Hostname: page-component-788cddb947-jbkpb Total loading time: 0 Render date: 2024-10-09T10:18:15.245Z Has data issue: false hasContentIssue false

A frictional–collisional model for bedload transport based on kinetic theory of granular flows: discrete and continuum approaches

Published online by Cambridge University Press:  01 June 2023

Rémi Chassagne*
Affiliation:
Université Grenoble Alpes, LEGI, CNRS UMR 5519, Grenoble, France
Cyrille Bonamy
Affiliation:
Université Grenoble Alpes, LEGI, CNRS UMR 5519, Grenoble, France
Julien Chauchat
Affiliation:
Université Grenoble Alpes, LEGI, CNRS UMR 5519, Grenoble, France
*
Email address for correspondence: [email protected]

Abstract

In this work, the modelling of collisional bedload transport is investigated with a focus on the continuum modelling of the granular flow. For this purpose, a frictional–collisional approach, combining a Coulomb model with the kinetic theory of granular flows, is developed. The methodology is based on a comparison with coupled fluid–discrete simulations that the classical kinetic theory model fails to reproduce. This inaccuracy may be explained by the assumptions of negligible interparticle friction and the absence of a saltation model in the continuum approach. In order to provide guidelines for the modelling, the fluctuating energy balance is computed in the discrete simulations and systematically compared with the kinetic theory laws. Interparticle friction is shown to affect the radial distribution function and to increase the energy dissipation, in agreement with previous observations. In addition, a saltation regime is identified, leading to departure from the viscosity and pseudo-thermal diffusivity laws of the kinetic theory in the dilute regime. Based on these observations, modifications to account for interparticle friction are included in the two-fluid model, and the kinetic theory is coupled with a saltation model. The results show that for inelastic frictional particles, interparticle friction controls energy dissipation, and the macroscopic behaviour of the granular flow does not depend on the microscopic particle properties. The proposed model reproduces the $\mu (I)$ rheology in the dense regime of the granular flow. Finally, the model is evaluated with experiments, showing significant improvements concerning the granular flow modelling.

Type
JFM Papers
Copyright
© The Author(s), 2023. Published by Cambridge University Press

1. Introduction

Sediment transport is one of the main processes that shape river beds and near-shore zones. It is of major importance for their management and interactions with human infrastructures. Modelling the transport of particles by a flowing fluid is a great challenge for the prediction of the morphological evolution of our environment. According to Berzi & Fraccarollo (Reference Berzi and Fraccarollo2013), sediment transport regimes may be differentiated using the bed slope $\alpha$ and the Shields number $\theta =\tau _b/(\Delta \rho \,g d)$, where $\tau _b$ is the fluid bed shear stress, $\Delta \rho = \rho ^p-\rho ^f$ is the difference between particle density $\rho ^p$ and fluid density $\rho ^f$, $g$ is the gravity acceleration, and $d$ is the particle diameter. At bed slopes above approximately $5^\circ$, debris flows are observed for all Shields numbers. Below this value, increasing the Shields number from just above the critical value, sediment transport takes place as ordinary bedload corresponding to a single layer of grains moving on top of the fixed sediment bed. For $\theta \geqslant 0.2$, a transition is observed from ordinary bedload to collisional transport with turbulent suspension at larger Shields numbers. While ordinary bedload may be modelled using statistical approaches (e.g. Einstein Reference Einstein1937; Ancey Reference Ancey2020), collisional transport and turbulent suspension are usually modelled in the continuum framework. The challenge in these approaches lies in the complexity of the particle–particle and turbulence–particle interactions modelling. Over the last two decades, extensive research has been carried out on this problem. Most of the time, Reynolds-averaged turbulence modelling has been used, e.g. mixing length models (e.g. Jenkins & Hanes Reference Jenkins and Hanes1998; Revil-Baudard & Chauchat Reference Revil-Baudard and Chauchat2013; Zhang et al. Reference Zhang, Deal, Perron, Venditti, Benavides, Rushlow and Kamrin2022) or two-equation models such as $k\unicode{x2013}\epsilon$ or $k\unicode{x2013}\omega$ (e.g. Hsu, Jenkins & Liu Reference Hsu, Jenkins and Liu2004; Lee, Low & Chiew Reference Lee, Low and Chiew2016; Chauchat et al. Reference Chauchat, Cheng, Nagel, Bonamy and Hsu2017; Gonzalez-Ondina, Fraccarollo & Liu Reference Gonzalez-Ondina, Fraccarollo and Liu2018). More recently, large eddy simulation has been used to model turbulence in these two-phase flows (e.g. Cheng et al. Reference Cheng, Chauchat, Hsu and Calantoni2018; Mathieu et al. Reference Mathieu, Chauchat, Bonamy, Balarac and Hsu2021). Concerning the granular stress modelling, two approaches have been used: $\mu (I)$ rheology (e.g. Revil-Baudard & Chauchat Reference Revil-Baudard and Chauchat2013; Lee et al. Reference Lee, Low and Chiew2016; Chauchat et al. Reference Chauchat, Cheng, Nagel, Bonamy and Hsu2017; Zhang et al. Reference Zhang, Deal, Perron, Venditti, Benavides, Rushlow and Kamrin2022) and kinetic theory of granular flows (e.g. Jenkins & Hanes Reference Jenkins and Hanes1998; Hsu & Liu Reference Hsu and Liu2004; Berzi & Jenkins Reference Berzi and Jenkins2011; Cheng et al. Reference Cheng, Chauchat, Hsu and Calantoni2018). This work investigates the collisional transport regime with a particular focus on the modelling of the granular part of the flow.

In order to model granular flows in a continuous framework, two approaches are generally considered, depending on the granular flow regime. Dense granular flows can be described with the phenomenological $\mu (I)$ rheology (GDR MiDi 2004; da Cruz et al. Reference da Cruz, Emam, Prochnow, Roux and Chevoir2005; Pouliquen et al. Reference Pouliquen, Cassar, Jop, Forterre and Nicolas2006), which relates the stress state (represented by the shear to normal stress ratio or effective friction coefficient $\mu =\tau ^p/P^p$) to the kinetic state of the granular flow (represented by the inertial number $I = d\,|\dot {\gamma }|/\sqrt {P^p/\rho ^p}$, where $d$ is the particle diameter, and $\dot {\gamma }$ is the granular velocity shear rate). This phenomenological law, derived by fitting experimental and discrete simulation data, gives predictive results for dense granular flows, but it fails in the dilute regime. In the bedload configuration, Maurin, Chauchat & Frey (Reference Maurin, Chauchat and Frey2016) studied the rheology of monodisperse beds with a coupled fluid–discrete element method (DEM) (Maurin et al. Reference Maurin, Chauchat, Chareyre and Frey2015). Despite the presence of water, they showed that the dry inertial number is still the controlling parameter. They found that the $\mu (I)$ rheology is valid in the dense part of the granular flow, and extended the classical laws for dry granular flows to the bedload case as follows:

(1.1)$$\begin{gather} \mu(I) = \mu_s + \dfrac{\mu_2-\mu_s}{I_0/I+1}, \end{gather}$$
(1.2)$$\begin{gather}\phi(I) = \dfrac{\phi_{c}}{1+bI}, \end{gather}$$

where $\mu _s=0.35$ is the static friction coefficient below which no motion is possible a priori, $\mu _2=0.97$, $I_0=0.69$, $\phi _{c} = 0.61$ and $b=0.31$. These laws show reasonable collapse for inertial number of the order of unity, but discrepancies are observed at higher inertial numbers in the dilute regime.

Dilute granular flows are generally described with the kinetic theory (KT) of granular gases, which is based on a statistical description of the granular flow assuming binary collisions between particles (Chapman & Cowling Reference Chapman and Cowling1970). It relies on the Enskog–Boltzmann equation for the velocity distribution function, and differs from the classical KT of molecular gases by taking into account the finite size of particles and energy dissipation at contacts due to inelasticity. It provides hydrodynamics conservation equations for mass, momentum and granular temperature $T$. The granular temperature is defined as the averaged granular fluctuating kinetic energy and is not at all related to thermal temperature. These equations need closures for the stress tensor, granular temperature diffusivity and rate of dissipation. In the framework of the KT, they can be expressed as complex integrals of the particle distribution function (solution of the Enskog–Boltzmann equation) and of the radial distribution function $g_0$, which characterizes the degree of spatial correlation between two particles that are about to collide. Under certain assumptions, analytical expressions for the coefficients may be obtained by application of the Chapman–Enskog method (Chapman & Cowling Reference Chapman and Cowling1970), leading to different models. The main difficulty is to express the particle distribution function. The simplest models were not solving the Enskog–Boltzmann equation and assumed to be at equilibrium (no temporal nor spatial gradients), leading to the classical Maxwell distribution function (Savage & Jeffrey Reference Savage and Jeffrey1981; Jenkins & Savage Reference Jenkins and Savage1983). Lun et al. (Reference Lun, Savage, Jeffrey and Chepurniy1984) considered a small perturbation around the Maxwell distribution and obtained constitutive relations for the coefficients that are valid for weakly dissipative granular flows, i.e. $1-e^2 \ll 1$, with $e$ the restitution coefficient. More recently, performing expansion to first order in spatial gradients, Garzó & Dufty (Reference Garzó and Dufty1999) derived relations for the whole range of restitution coefficients. In the bedload configuration, large spatial variations of all quantities are observed, i.e. exponential velocity profile, and the latter model is certainly the most relevant for the present problem.

Considering bedload, and environmental flows over an erodible bed in general, the difficulty arises from the coexistence of all granular flow regimes with transition from a dilute granular flow at the bed surface to a dense and quasi-static regime inside the bed. In terms of continuum modelling strategy, two options are possible: extend the $\mu (I)$ rheology to the dilute regime, or extend the KT to the dense regime. In the dilute regime, non-local effects are important features of the flow and therefore it seems hardly feasible to model all regimes with a local rheology. Consequently, the second approach is adopted hereafter.

There are various reasons to observe departure from the KT even in the dilute part of the flow. First, natural particles are frictional, while the classical KT models such as the one of Garzó & Dufty (Reference Garzó and Dufty1999) have been derived for frictionless particles. Interparticle friction makes it possible to transfer translational kinetic energy into rotational kinetic energy during collisions, and add another source of energy dissipation by sliding motion. There have been some attempts to generalize KT to frictional particles, including the resolution of rotational kinetic energy and a tangential restitution coefficient (Kumaran Reference Kumaran2006; Rao & Nott Reference Rao and Nott2008). This, however, makes models even more complex, and some authors proposed a more pragmatic approach in which the restitution coefficient is reduced to account for interparticle friction dissipation (Jenkins & Zhang Reference Jenkins and Zhang2002; Chialvo & Sundaresan Reference Chialvo and Sundaresan2013).

At the top of the sediment bed, particles are transported by saltation with ballistic trajectories. Their motion is controlled by gravity and fluid drag force, and is therefore out of the scope of the KT (Berzi, Jenkins & Richard Reference Berzi, Jenkins and Richard2020). The KT is not expected to reproduce bedload in the very dilute part of the flow, and saltation is generally taken into account as an upper boundary condition for the granular phase (Pasini & Jenkins Reference Pasini and Jenkins2005; Berzi et al. Reference Berzi, Jenkins and Richard2020). There have been few attempts to model saltation in the continuous framework (Jenkins, Cantat & Valance Reference Jenkins, Cantat and Valance2010; Jenkins & Valance Reference Jenkins and Valance2018) and this is still a challenge for the modelling of geophysical particulate flows.

Finally, the KT is not expected to predict the behaviour of the granular flow in the dense regime. This is because the motion of particles starts to be correlated and the molecular chaos assumption breaks down while particles are more concentrated. To model dense flows, Jenkins (Reference Jenkins2006, Reference Jenkins2007) and Berzi & Jenkins (Reference Berzi and Jenkins2011) proposed the introduction of a correlation length in the dissipation term of the granular temperature equation, showing good results when comparing with DEM for simple shear flow simulations (Berzi Reference Berzi2014; Berzi & Jenkins Reference Berzi and Jenkins2015). In addition to these considerations, the origin of stresses changes when going into the bed. While stresses are due to fluctuating motions and very short collisions in the dilute regime, force chains start to emerge with long-lasting contacts in the dense part of the bed leading to elastic stresses that cannot be captured by the KT. However, there exist phenomenological models (Johnson & Jackson Reference Johnson and Jackson1987) and micromechanical models (Jenkins & La Ragione Reference Jenkins and La Ragione2002) for elastic stresses. Johnson & Jackson (Reference Johnson and Jackson1987) simply proposed the total stress of the granular assembly to be the sum of both the elastic and the kinetic-collisional contributions. With this approach, there have been successful attempts at reproducing laboratory experiments (Hsu et al. Reference Hsu, Jenkins and Liu2004) and DEM simulations of dense granular flow (Berzi & Jenkins Reference Berzi and Jenkins2015; Berzi et al. Reference Berzi, Jenkins and Richard2020).

The literature review presented above highlights the duality between the $\mu (I)$ rheology, valid in the dense regime, and the KT, a priori valid in the dilute regime. A two-fluid model based on the KT that would be able to reproduce quantitatively the entire depth structure of the bedload layer would represent a major contribution for the sediment transport community. In particular, reproducing the $\mu (I)$ rheology with a KT-based model is still an open question. In order to focus on the granular flow modelling and on the particle–particle interactions, collisional transport only is considered without any turbulent suspension, and fluid–particle interactions will be reduced to the simplest ones, i.e. buoyancy and mean drag forces.

In this context, the aim of the present work is to propose a two-fluid model for bedload transport using the KT for granular flows and based on the frictional–collisional approach first proposed by Johnson & Jackson (Reference Johnson and Jackson1987). The model is implemented in SedFoam (Chauchat et al. Reference Chauchat, Cheng, Nagel, Bonamy and Hsu2017), which is an open-source three-dimensional solver based on the OpenFOAM toolbox. Coupled fluid–DEM simulations will be performed using YADE (Maurin et al. Reference Maurin, Chauchat, Chareyre and Frey2015; Smilauer et al. Reference Smilauer2015), and the results will be used as guideline for the model development and its validation. Keeping in mind the difficulties highlighted previously, modifications to the classical KT model of Garzó & Dufty (Reference Garzó and Dufty1999), most of them based on theoretical developments, will be proposed in order to reproduce quantitatively the discrete simulations.

First the two-phase flow model and the coupled fluid–DEM model are presented (§ 2). The results of both models will be compared, and some modifications to the Garzó & Dufty (Reference Garzó and Dufty1999) model will be proposed in § 3 and implemented in SedFoam to reproduce quantitatively the discrete simulations. Results are discussed in § 4. Finally, conclusions and perspectives are presented in § 5.

2. Two-phase flow models for bedload transport

2.1. Two-fluid model

The two-fluid model for sediment transport described in Chauchat et al. (Reference Chauchat, Cheng, Nagel, Bonamy and Hsu2017), based on the equations derived by Jackson (Reference Jackson2000), is used as a starting point in this paper. Although it can be used in three-dimensional configurations, the model will be used in this work only to simulate one-dimensional flows, with all variables depending only on the vertical axis $z$. Herein, only the simplified one-dimensional equations will be presented (Chauchat Reference Chauchat2018), and the interested reader is referred to Chauchat et al. (Reference Chauchat, Cheng, Nagel, Bonamy and Hsu2017) for more details on the three-dimensional model. The code used in the present work is freely available (follow the link at Bonamy et al. Reference Bonamy2023). In the following, superscript $f$ (resp. $p$) denotes a fluid (resp. particle) phase quantity. The equations are obtained through a double averaging procedure described in Appendix A. A first ensemble averaging, denoted as $\langle \cdot \rangle$, allows one to obtain hydrodynamics quantities for both the fluid and particle phases, and a second Favre averaging, denoted $\bar {\cdot }$, provides turbulence filtered equations. The solution of the mass and momentum conservation equations allows one to predict the fluid and solid phase volume fractions $\overline {\left \langle \epsilon \right \rangle }$ and $\overline {\left \langle \phi \right \rangle } = 1-\overline {\left \langle \epsilon \right \rangle }$, respectively, as well as the Favre-averaged fluid and particle phase velocities $\overline {\left \langle \boldsymbol {u}^f\right \rangle }^f = \left (\overline {\bigl \langle u_x^f\bigr \rangle }^f,\overline {\bigl \langle u_z^f\bigr \rangle }^f\right )$ and $\overline {\left \langle \boldsymbol {v}^p\right \rangle }^s = \left (\overline {\bigl \langle v_x^p\bigr \rangle }^s, \overline {\bigl \langle v_z^p\bigr \rangle }^s\right )$, respectively. In the following, unless specified explicitly, the averaging operator symbols are omitted for readability.

2.1.1. Mass and momentum conservation equations

The mass conservation equations of the fluid and particle phase reduce to

(2.1)$$\begin{gather} \dfrac{\partial \rho^f \epsilon }{\partial t} + \dfrac{\partial \rho^f \epsilon u_z^f}{\partial z} = 0, \end{gather}$$
(2.2)$$\begin{gather}\dfrac{\partial \rho^p \phi }{\partial t} + \dfrac{\partial \rho^p \phi v_z^p}{\partial z} = 0. \end{gather}$$

The momentum conservation equations in the streamwise direction are

(2.3)$$\begin{gather} \dfrac{\partial \epsilon \rho^f u_x^f}{\partial t} + \dfrac{\partial u_z^f \epsilon \rho^f u_x^f}{\partial z} = \epsilon \rho^f g \sin(\alpha) + \dfrac{\partial \tau_{xz}^f}{\partial z} - nf_{Dx}, \end{gather}$$
(2.4)$$\begin{gather}\dfrac{\partial \phi \rho^p v_x^p}{\partial t} + \dfrac{\partial v_z^p \phi \rho^p v_x^p}{\partial z} = \phi \rho^p g \sin(\alpha) + \dfrac{\partial \tau_{xz}^p}{\partial z} + nf_{Dx}, \end{gather}$$

and in the wall-normal direction are

(2.5)$$\begin{gather} \dfrac{\partial \epsilon \rho^f u_z^f}{\partial t} + \dfrac{\partial u_z^f \epsilon \rho^f u_z^f}{\partial z} ={-} \epsilon \rho^f g \cos(\alpha) -\epsilon\,\dfrac{\partial p^f}{\partial z} - nf_{Dz}, \end{gather}$$
(2.6)$$\begin{gather}\dfrac{\partial \phi \rho^p v_z^p}{\partial t} + \dfrac{\partial v_z^p \phi \rho^p v_z^p}{\partial z} ={-}\phi \rho^p g \cos(\alpha) - \dfrac{\partial p^p}{\partial z} - \phi\,\dfrac{\partial p^f}{\partial z} + nf_{Dz}, \end{gather}$$

where $p^f$ (resp. $p^p$) is the fluid (resp. particle) pressure, $\tau _{xz}^f$ (resp. $\tau _{xz}^p$) is the fluid (resp. particle) shear stress, $g=9.81\ {\rm m}\ {\rm s}^{-2}$ is the gravity acceleration, $\alpha$ is the bed slope angle, and $n\boldsymbol {f_{D}} = n(f_{Dx}, f_{Dz})$ is the drag force between the fluid and particle phase.

2.1.2. Fluid phase closures

To solve the fluid equations (2.1), (2.3) and (2.5), it is necessary to have closures for the fluid phase shear stress $\tau _{xz}^f$ and drag force $n\boldsymbol {f_D}$. The fluid shear stress is the sum of a viscous shear stress and a turbulent shear stress. The latter stress, also called Reynolds shear stress, is computed based on an eddy viscosity concept and the total shear stress expressed as

(2.7)\begin{equation} \tau_{xz}^f = \rho^f\epsilon(\nu^f + \nu_t)\,\dfrac{\partial u_{x}^f}{\partial z}, \end{equation}

where $\nu ^f$ is the fluid kinematic viscosity. The turbulent eddy viscosity $\nu _t$ follows a mixing length approach that depends on the integral of the solid volume fraction to account for the presence of the particles (Li & Sawamoto Reference Li and Sawamoto1995):

(2.8a,b)\begin{equation} \nu_t = l_m^2 \left| \dfrac{\partial u_{x}^f}{\partial z}\right|, \quad l_m(z) = \kappa \int_{0}^{z}1-\dfrac{\phi(\xi)}{\phi_{max}}\,{\rm d}\xi, \end{equation}

with $\kappa = 0.41$ the von Kármán constant. This simple formulation of mixing length extends the Prandtl (Reference Prandtl1926) law for flow inside and over a mobile sediment bed, and has been used widely for sheet flow and bedload applications (Li & Sawamoto Reference Li and Sawamoto1995; Dong & Zhang Reference Dong and Zhang1999; Revil-Baudard & Chauchat Reference Revil-Baudard and Chauchat2013; Maurin et al. Reference Maurin, Chauchat, Chareyre and Frey2015).

The drag force is computed as

(2.9)\begin{equation} n\boldsymbol{f_{D}} = \phi(1-\phi)K(\boldsymbol{u}^f - \boldsymbol{u}^p ), \end{equation}

where

(2.10)\begin{equation} K = 0.75 C_D\,\dfrac{\rho^f}{d}\,\|\boldsymbol{u}^f - \boldsymbol{u}^p\|\,(1-\phi)^{-\zeta-1}. \end{equation}

The $(1-\phi )^{-\zeta -1}$ term accounts for hindrance effects due to the collective presence of particles, and the exponent is fixed at $\zeta = 3.1$ (Jenkins & Hanes Reference Jenkins and Hanes1998). The drag coefficient $C_D$ is computed following Dalla Valle (Reference Dalla Valle1943) as

(2.11a,b)\begin{equation} C_D = C_D^{\infty} + \dfrac{24.4}{Re_p}, \quad Re_p = \dfrac{\|\boldsymbol{u}^f - \boldsymbol{u}^p\|\,d}{\nu^f}, \end{equation}

where $C_D^{\infty } = 0.4$ is the value of the drag coefficient in the limit of infinite particle Reynolds number.

2.1.3. Particle phase closures

As already pointed out in the Introduction, granular stresses have two physical origins. First, particles are subjected to elastic stresses, resulting from enduring contacts, which do not depend on shear rate. These elastic stresses appear at high volume fractions and are modelled as a frictional Coulomb-like behaviour. Second, particles are also subjected to kinetic stresses resulting from transfer of momentum due to fluctuating motions and to collisions between particles. In order to account for both these stresses in our model, the approach of Johnson & Jackson (Reference Johnson and Jackson1987), consisting of adding both contributions, is adopted:

(2.12)$$\begin{gather} \tau_{xz}^p = \tau_{xz}^{el} + \tau_{xz}^{kin}, \end{gather}$$
(2.13)$$\begin{gather}p^p = p^{el} + p^{kin}. \end{gather}$$
2.1.3.1 Elastic stresses.

Models for elastic stresses originate from soil mechanics or poro-elasticity and are, for most of them, empirical. In this paper, the empirical model proposed by Johnson & Jackson (Reference Johnson and Jackson1987) is used:

(2.14)\begin{equation} p^{el} = \left\{\begin{array}{@{}ll@{}} 0, & \phi < \phi_{rlp} ,\\ P_0\,\dfrac{(\phi-\phi_{rlp})^3}{(\phi_{max}-\phi)^5}, & \text{otherwise}, \end{array} \right. \end{equation}

with $P_0 = 0.05\ {\rm kg}\ {\rm m}^{-1}\ {\rm s}^{-2}$ the bulk elastic modulus, and $\phi _{rlp}=0.57$ the random loose packing fraction. The shear stress is then computed following a Coulomb model:

(2.15)\begin{equation} \tau^{el} = \mu_s p^{el}, \end{equation}

where $\mu _s$ is the effective static friction coefficient, below which no motion is possible a priori. It is expected to depend on the interparticle friction coefficient (Chialvo, Sun & Sundaresan Reference Chialvo, Sun and Sundaresan2012; Berzi & Vescovi Reference Berzi and Vescovi2015) and is estimated from several datasets of micromechanical analyses of DEM simulations (see Appendix B). Note that the elastic pressure exists only for volume fraction larger than $\phi _{rlp}$, and the elastic stresses are therefore restricted to the very dense part of the granular flow.

2.1.3.2 Kinetic stresses.

As already mentioned, the kinetic stresses are computed in the framework of the KT. One needs to solve an energy balance equation for the particle phase in addition to the set of equations (2.2), (2.4) and (2.6). For multiphase flows, the rate of change of particle fluctuating kinetic energy can be written as (Ding & Gidaspow Reference Ding and Gidaspow1990)

(2.16)\begin{equation} \dfrac{3}{2}\left(\dfrac{\partial \rho^p \phi T}{\partial t} + \dfrac{\partial u_z^p \rho^p \phi T}{\partial z} \right) = \tau_{xz}^{kin}\,\dfrac{\partial v_x^p}{\partial z} + \dfrac{\partial q}{\partial z} + \varGamma + J_{int}, \end{equation}

where $T=1/3\overline {\bigl \langle v_i^{p\prime }v_i^{p\prime }\bigr \rangle }^p$ is the granular temperature. The first term on the right-hand side is a production term of granular temperature. The second term on the right-hand side is a diffusion term with $q$ the granular temperature flux:

(2.17)\begin{equation} q ={-}\kappa\,\dfrac{\partial T}{\partial z} - \kappa_{\phi}\,\dfrac{\partial \phi}{\partial z}. \end{equation}

In the present configuration, and despite the sharp transition from dilute to dense granular flow at the bed interface, the contribution of the volume fraction gradient term to the total flux has been observed to be negligible. It is therefore not accounted for in the present model, and the granular temperature flux reduces to

(2.18)\begin{equation} q ={-}\kappa\,\dfrac{\partial T}{\partial z}. \end{equation}

The third term on the right-hand side represents the dissipation of granular temperature due to contact inelasticity. The last term is specific to multiphase flows and represents the work done by the drag force due to fluctuating motion. In order to close the granular temperature equation, the Garzó & Dufty (Reference Garzó and Dufty1999) model is used as a baseline. It has been derived for inelastic hard spheres to first order in the spatial gradients. The transport coefficients are expressed as functions of the granular temperature as

(2.19)$$\begin{gather} p^{kin} = \rho^p\,F_1(\phi)\,T, \end{gather}$$
(2.20)$$\begin{gather}\eta^{kin} = \rho^p d\,F_2(\phi)\,\sqrt{T}, \end{gather}$$
(2.21)$$\begin{gather}\kappa = \rho^p d\,F_3(\phi)\,\sqrt{T}, \end{gather}$$
(2.22)$$\begin{gather}\varGamma = \rho^p/d\,F_4(\phi)\,T^{3/2}, \end{gather}$$

where $\eta ^{kin} = \tau _{xz}^{kin}/|\dot {\gamma }|$ is the viscosity associated with the kinetic stress. The expressions for $F_1$, $F_2$, $F_3$ and $F_4$ are reported in the left column of table 1 and depend on the restitution coefficient $e$. Note that the dimensionless viscosity and diffusivity are expressed as the sum of kinetic (due to fluctuations) collisional and bulk contributions.

Table 1. Expression of the coefficients in the constitutive relations of the kinetic theory given by the Garzó & Dufty (Reference Garzó and Dufty1999) model (left column) and the proposed model (right column).

In these relations, a key parameter is the radial distribution function $g_0(\phi )$, which characterizes the degree of spatial correlation of two particles that are about to collide. It is therefore expected that $g_0$ is 1 in the dilute regime (no spatial correlation) and diverges when $\phi$ approaches $\phi _{max}$ (full spatial correlations). The first functional form has been proposed by Carnahan & Starling (Reference Carnahan and Starling1969), as $g_0(\phi ) = (2-\phi )/(2(1-\phi )^3)$. It gives very good results for low values of volume fraction but does not diverge in the dense limit. To correct this behaviour, other functional forms have been proposed theoretically (Ma & Ahmadi Reference Ma and Ahmadi1986; Torquato Reference Torquato1995) and empirically (Lun & Savage Reference Lun and Savage1986; Chialvo & Sundaresan Reference Chialvo and Sundaresan2013; Vescovi et al. Reference Vescovi, Berzi, Richard and Brodu2014). In the following, the form proposed by Chialvo & Sundaresan (Reference Chialvo and Sundaresan2013), based on discrete element simulations of simple shear flows, is adopted:

(2.23)\begin{equation} g_{0}(\phi) = \dfrac{2-\phi}{2(1-\phi)^3} + \dfrac{a \phi^2}{(\phi_{max} -\phi)^{3/2}}, \end{equation}

where $a=0.58$ is an empirical coefficient. This expression has the advantage of matching the Carnahan & Starling (Reference Carnahan and Starling1969) function for low volume fraction and diverging close to $\phi _{max}$.

The last term for which a closure is required is $J_{int}$. It corresponds to the work done by the drag force due to fluctuating particle motion. Assuming that the drag is linear in relative velocity (i.e. $K \sim {\rm const}.$), it can be expressed as (Ding & Gidaspow Reference Ding and Gidaspow1990; Fox Reference Fox2014)

(2.24)\begin{equation} J_{int} = \phi(1-\phi)K\left(\overline{\bigl\langle u_i^{f\prime}v_i^{p\prime}\bigr\rangle }^p-3T\right). \end{equation}

The second term in the right-hand set of parentheses of (2.24) is a dissipation term. The first term in the right-hand set of parentheses is a source term representing a transfer of fluctuating energy from the fluid to particles through turbulence. It depends on the degree of correlation between fluctuating velocities of both phases, and typically varies from $0$ (uncorrelated motions) to $2k$ (fully correlated motions), where $k$ is the fluid fluctuating kinetic energy (Danon, Wolfshtein & Hetsroni Reference Danon, Wolfshtein and Hetsroni1977; Chen & Wood Reference Chen and Wood1985). In the DEM model that is used in this study (see § 2.2), no fluid velocity fluctuations are computed and there is therefore no correlation between the fluid and granular phase fluctuation velocities. This is equivalent to considering that particles are very inertial and that their motion is not at all influenced by the turbulent structures of the fluid flow. The drag term therefore simplifies as

(2.25)\begin{equation} J_{int} ={-}\phi(1-\phi)K\times3T, \end{equation}

and it represents the dissipation into heat of granular temperature due to the drag force.

2.1.4. Numerical implementation

The numerical implementation is described fully in Chauchat et al. (Reference Chauchat, Cheng, Nagel, Bonamy and Hsu2017), consisting of a total variation diminution central scheme, with an ‘Euler implicit’ first-order scheme for time derivatives, a ‘Gauss linear’ scheme for spatial gradient operators, a ‘Gauss limitedLinear’ scheme for divergence operators, and a ‘Gauss linear corrected’ scheme for Laplacian operators. The details of these schemes can be found in the OpenFOAM documentation, and they are all second order in space. The boundary conditions are set to ‘cyclic’ in the streamwise direction and ‘empty’ in the spanwise direction. At the top boundary, the pressure of both phases is fixed at $0$, and a zero gradient is imposed on all other fields. The bottom boundary condition is set to ‘fixedFluxPressure’ for the pressure and to ‘noslip’ for the velocities. The CFL is fixed at $0.1$, with maximal time step $\Delta t_{max} = 10^{-3}$ s. The number of grid points is chosen such that the spatial discretization verifies $d_z \sim d/4$. This corresponds to 120 cells for the cases such that $\theta \leqslant 0.6$, and to 200 cells for the higher Shields numbers.

2.2. Euler–Lagrange model

The continuum two-fluid model will be tested against coupled fluid–DEM simulations. This is a three-dimensional DEM model, based on the open-source code YADE (Smilauer et al. Reference Smilauer2015), coupled with a one-dimensional turbulent fluid flow model. It is presented in Maurin et al. (Reference Maurin, Chauchat, Chareyre and Frey2015) and has been validated with experiments (Frey Reference Frey2014). It will be presented briefly herein, but the interested reader is referred to Maurin et al. (Reference Maurin, Chauchat, Chareyre and Frey2015) and Maurin (Reference Maurin2015) for a complete description.

Frictional spheres of density $\rho ^p$ and diameter $d$ submitted to a gravity acceleration $g = 9.81\ {\rm m}\ {\rm s}^{-2}$ are considered. A linear spring–dashpot model (Schwager & Poschel Reference Schwager and Poschel2007) is considered. It is composed of a spring of stiffness $k_n$, computed to stay in the rigid limit of grains (Roux & Combe Reference Roux and Combe2002), in parallel with a viscous damper of coefficient $c_n$ in the normal direction, and a spring of stiffness $k_s=k_n$ associated with a slider of friction coefficient $\mu ^p$ in the tangential direction. The normal stiffness, in parallel with the viscous damper, defines a normal restitution coefficient $e$. In addition, each particle is submitted to a buoyancy force and a fluid drag force. The same drag model as for the two-fluid model is considered (see (2.9) and (2.11a,b)), except that the velocity difference depends on the particle instantaneous velocity instead of the particle phase averaged velocity.

For the fluid phase, a one-dimensional vertical model is used, in which the fluid velocity is a function of only the wall-normal component $z$, and is aligned with the streamwise direction. This is the exact same fluid model as presented previously for the two-phase flow model (2.3). The only difference lies in the drag interaction term. Indeed, as a fluid drag force applies to each individual particle, it is computed as the average momentum transferred by the fluid to the particles through the drag force:

(2.26)\begin{equation} n\left\langle \boldsymbol{f_D} \right\rangle ^p = \dfrac{3\rho^f}{4d}\,\phi(1-\phi)^{-\zeta} \left\langle C_D\,\|\boldsymbol{u}^f - \boldsymbol{u}^p\|\,(\boldsymbol{u}^f - \boldsymbol{u}^p)\right\rangle ^p, \end{equation}

where it is recalled that $\langle {\cdot } \rangle ^p$ denotes the solid phase average (see Appendix A for definition).

Babic (Reference Babic1997) and Goldhirsch (Reference Goldhirsch2010) proposed a rigorous procedure to compute the DEM granular stresses $\sigma ^p$. Later, Pähtz et al. (Reference Pähtz, Durán, Ho, Valance and Kok2015) extended this formalism to the computation of the granular temperature flux $q$, dissipation during collision $\varGamma$, and drag dissipation $J_{int}$. For the same weighting function as previously, they are expressed as

(2.27)$$\begin{gather} \sigma^p_{ij}(z) ={-}\rho^p\phi\left\langle v_i^{p\prime}v_j^{p\prime} \right\rangle ^p - \dfrac{1}{V}\sum_c f_i^cb_j^c, \end{gather}$$
(2.28)$$\begin{gather}q(z) ={-} \dfrac{1}{2}\,\rho^p\phi\left\langle v_z^{p\prime}v_i^{p\prime}v_i^{p\prime}\right\rangle ^p - \dfrac{1}{V}\sum_c f_i^cv_i^pb_z^c, \end{gather}$$
(2.29)$$\begin{gather}\varGamma(z) ={-}\dfrac{1}{2V}\sum_{p, q\mid z^p\in[z-d_z/2, z+d_z/2]}f_i^c(v_i^p -v_i^q), \end{gather}$$
(2.30)$$\begin{gather}J_{int} = n\left\langle f_{Di}v_i^{p\prime}\right\rangle ^p, \end{gather}$$

where the sums are performed over the ensemble of particles $p$, particles $q$ in contact with $p$, and contacts $c$. Here, $\boldsymbol {f}^c$ is the interaction force at contact $c$ applied on particle $p$ by particle $q$, and $\boldsymbol {b}^c = \boldsymbol {x}^q-\boldsymbol {x}^p$ is the branch vector. In these expressions, the Einstein summation has been used. Note that the granular stress tensor and granular temperature flux are sums of fluctuating (similar to a Reynolds stress for a fluid) and contact contributions. The obtained fields are ensemble-averaged quantities, which can further be Favre-averaged for comparison with the continuum two-fluid model.

3. Results

In this section, coupled fluid–discrete simulations will be compared with two-fluid simulations. The observed discrepancies will be investigated physically, and corrections to the KT model will be proposed in order to reproduce quantitatively the DEM simulations with the two-fluid model.

3.1. Euler–Lagrange simulation results

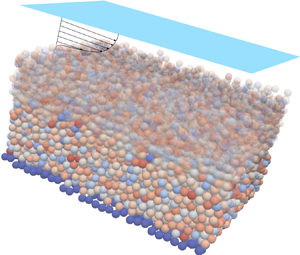
The numerical set-up is presented in figure 1. Particles of diameter $d$ and density $\rho ^p$ are initially deposited by gravity over a rough bed made of fixed particles. Particles are immersed in a fluid of density $\rho ^f=1000\ {\rm kg}\ {\rm m}^{-3}$, and the particle to fluid density ratio is denoted $r=\rho ^p/\rho ^f$. The free surface is fixed at $H_f = H_{bed} + h_w$, where $H_{bed}=12.5d$ represents the bed height at rest, and $h_w$ represents the water depth. The slope is fixed at $\sin (\alpha ) = 5\,\%$ ($2.85^\circ$). This defines the Shields number as $\theta = \rho ^fgh_w\sin (\alpha )/[(\rho ^p-\rho ^f)gd]$. At initial time, the fluid flows by gravity and sets particles into motion. After a short transient, during which fluid and particles are accelerating, a steady state takes place at transport equilibrium.

Figure 1. Numerical set-up of the DEM simulations: $N$ layers of particles are deposited by gravity above a rough bed made of fixed particles. The fluid free surface is set to $H_f = Nd+h_w$.

A set of simulations has been performed and is summarized in table 2. A reference case is considered for which $\theta =0.6$, $\rho ^p = 2500\ {\rm kg}\ {\rm m}^{-3}$, $d=6$ mm, $\mu ^p=0.4$ and $e=0.7$. Around this case, each parameter has been varied independently from the others – Shields number from $\theta =0.2$, at the transition between ordinary bedload and collisional transport, until $\theta =1$, corresponding to intense bedload transport, $\rho ^p$ from $1375$ to $4000\ {\rm kg}\ {\rm m}^{-3}$, $d$ from $3$ to $9$ mm, interparticle friction $\mu ^p$ from $0$ to $1.5$, and restitution coefficient from $e=0.3$ to $e=0.9$. The objectives of the present work being to investigate collisional bedload transport without turbulence–particle interactions, it has been verified that these simulations indeed correspond to this transport regime. Following Finn & Li (Reference Finn and Li2016), the suspension number, characterizing the competition between particle settling and turbulent suspension, is in the range $S = w_s/u_{*} \sim 1\unicode{x2013}4$, and the Stokes number, comparing the particle time scale to the turbulent time scale, is always larger $St = \tau _p/\tau _k \gg 10^3$ (see table 2). Therefore, the present configuration corresponds to bedload transport regime without suspension in which particles are inertial and not influenced by fluid turbulence.

Table 2. Physical parameters for each configuration: Shields number, particle to fluid density ratio, particle diameter, interparticle friction coefficient, restitution coefficient, fluid depth, free surface position, Stokes number and suspension number.

Figures 2(a) and 2(b) show the profiles of volume fraction, and particle and fluid velocities for the reference case. The sediment phase shows a very complex phenomenology, with continuous transition from a pure fluid phase ($z>17d$) to a quasi-static creeping regime ($z<8d$). This transition zone is called the bedload layer, in which most of the transport is taking place. At the same time, both the fluid and particle velocities decrease when going down into the bed. The quasi-static regime, below $z<8d$, is characterized by a roughly constant maximal packing fraction $\phi = \phi _{max}$ and very slow fluid and granular motions with exponentially decreasing velocity profiles with depth (Houssais et al. Reference Houssais, Ortiz, Durian and Jerolmack2015; Chassagne et al. Reference Chassagne, Maurin, Chauchat, Gray and Frey2020b; Rousseau et al. Reference Rousseau, Chassagne, Chauchat, Maurin and Frey2021). The quasi-static regime has a negligible contribution to the overall transport (Chassagne et al. Reference Chassagne, Frey, Maurin and Chauchat2020a) and will be neglected in this work.

Figure 2. Fluid–DEM simulation results for the reference case $\theta = 0.6$, $\rho ^p/\rho ^f=2.5$, $d=6$ mm, $\mu ^p=0.4$ and $e=0.7$: (a) volume fraction profile, (b) dimensionless particle and fluid velocity profiles, and (c) granular temperature balance, in ${\rm Pa}\ {\rm s}^{-1}$.

Figure 2(c) shows the profiles of granular temperature budget (2.16): production, diffusion, dissipation through collisions and drag dissipation term. At steady state, the left-hand side of the granular temperature equation (2.16) vanishes and the production of temperature should be balanced by diffusion, contact dissipation and drag dissipation. As can be observed in figure 1(c), the black dashed line representing the sum of these three terms is not superimposed on the production term, indicating that the balance is not completely closed. Pähtz et al. (Reference Pähtz, Durán, Ho, Valance and Kok2015) had the same issue in their DEM simulations and attributed this flaw to the dissipation term $\varGamma$ due to the lack of scale separation in the averaging procedure, i.e. the vertical discretization $d_z = d/30 \ll d$. For this reason, in the following, the dissipation term will be computed as the residual of the granular temperature balance equation: $\varGamma = -\tau _{xz}^p\dot {\gamma } - \partial q/\partial z - J_{int}$.

3.2. Direct comparison with the two-fluid model

The two-fluid model can now be compared with the results of the coupled fluid–DEM model. The fluid equations being the same in both models, a particular focus will be given to the granular behaviour of the particle bed. The same set-up as presented in § 3.1 is simulated using the two-fluid model, with parameters reported in table 2.

Figure 3 compares, for all Shields numbers, the profiles of volume fraction, particle velocity and granular temperature computed with the DEM (symbols) and with the two-fluid model (solid lines). The two-fluid model mispredicts the shape of the volume fraction profile and overestimates strongly the particle velocity and the granular temperature for all Shields numbers. The bed flows deeper in the two-fluid simulations than in the DEM results, and a plateau of velocity in the dilute part of the granular flow is predicted that is not observed in the DEM results. As a consequence, the width of the bedload layer is larger in the continuum model than in the DEM (see inset of figure 3b). Similarly, the granular temperature is overestimated by the continuum model, in particular inside the granular bed, suggesting that granular fluctuating energy dissipation is underestimated in the continuum simulations. As discussed in the Introduction, this is because particles are frictional and dissipate more energy than predicted in the frictionless KT model.

Figure 3. Comparison between DEM (symbols) and two-phase flow results with initial model (solid lines) for different Shields numbers (simulation Ids 1–5): (a) volume fraction profiles, (b) dimensionless particle velocity and transport (inset) profiles, and (c) dimensionless granular temperature.

In order to improve the results of the two-fluid model, additional physical mechanisms have to be accounted for. In particular, the Garzó & Dufty (Reference Garzó and Dufty1999) model does not account for interparticle friction, while, as will be shown hereafter, it plays an important role in the dynamics of the granular flow. In addition, the departure between the models in the dilute part of the granular flow indicates that saltation also plays an important role in the dynamics of the flow. In the following, the DEM results will be used as a guideline to develop a two-phase flow model based on the KT that accounts for both frictional interactions and saltation.

3.3. Influence of interparticle friction

As stated in the Introduction, interparticle friction is expected to have a strong impact on the flow dynamics. First, it influences the geometrical packing structure of the granular flow (da Cruz et al. Reference da Cruz, Emam, Prochnow, Roux and Chevoir2005; Chialvo et al. Reference Chialvo, Sun and Sundaresan2012; Berzi & Fraccarollo Reference Berzi and Fraccarollo2015) modifying the radial distribution function $g_0(\phi )$ (Chialvo & Sundaresan Reference Chialvo and Sundaresan2013; Berzi & Vescovi Reference Berzi and Vescovi2015). Second, it introduces another source of dissipation at contact in addition to inelasticity. These two aspects, playing an important role in the KT, have been explored in simple shear flow configurations. A set of discrete simulations has been performed, in which the interparticle friction coefficient has been varied from $\mu ^p=0$ to $\mu ^p=1.5$, in order to study and parametrize its impact in the more complex bedload configuration.

The radial distribution function is a key parameter of the KT. From the DEM simulations, it can be estimated by reversing the granular pressure law (2.19) as

(3.1)\begin{equation} g_0(\phi) = \dfrac{1}{2\phi(1+e)}\left(\dfrac{p^{kin}}{\rho^p\phi T}-1\right). \end{equation}

In the DEM simulations, it is not possible to isolate the kinetic-collisional contribution from the elastic one in the granular pressure. The radial distribution function is therefore computed in (3.1) based on the total pressure. The elastic pressure is, however, predominant only for volume fraction very close to the random close packing $\phi _{max} \sim 0.635$, and vanishes below $\phi _{rcp}=0.57$. It is assumed that assimilating the kinetic-collisional pressure to the total pressure has a negligible effect on the results. Figure 4(a) shows the computed radial distribution function in the DEM simulations (symbols). As expected, the data show an impact of interparticle friction on the radial distribution function. Similarly to the observations of da Cruz et al. (Reference da Cruz, Emam, Prochnow, Roux and Chevoir2005), Chialvo et al. (Reference Chialvo, Sun and Sundaresan2012) and Chialvo & Sundaresan (Reference Chialvo and Sundaresan2013) in shear cell numerical simulations, the radial distribution function starts to diverge at lower values of volume fraction when $\mu ^p$ increases. This corresponds to a decrease of the jamming volume fraction with interparticle friction coefficient at which a transition between inertial and quasi-static regime occurs (Chialvo et al. Reference Chialvo, Sun and Sundaresan2012). This behaviour saturates for $\mu ^p \geqslant 0.6$, after which a very small influence is observed.

Figure 4. (a) Radial distribution function computed in the DEM simulations (symbols, simulation Ids 1 and 9–14) and with (3.2) (solid lines) for different values of interparticle friction. (b) Impact of interparticle friction on coefficient $a(\mu ^p)$ of (3.2) measured in the DEM simulations (black crosses) and proposed empirical fit (3.3) (solid line).

The expression of the radial distribution function (2.23) (blue solid line) proposed by Chialvo & Sundaresan (Reference Chialvo and Sundaresan2013) for frictionless particles is in perfect agreement with the present frictionless simulation (blue circles). This is quite remarkable because (2.23) has been obtained in a very different configuration – dry granular flow in simple shear cell – showing that our DEM simulations are in line with the literature on this point. Vescovi et al. (Reference Vescovi, Berzi, Richard and Brodu2014) proposed another expression for the radial distribution function for frictionless spheres that is almost superimposed on (2.23) (not shown in figure 4(a) for clarity).

To account for the effect of interparticle friction on the radial distribution function, Chialvo & Sundaresan (Reference Chialvo and Sundaresan2013) suggested letting the critical packing fraction depend on interparticle friction in (2.23). However, this is not appropriate in the present configuration because in our model, the elastic stresses become more important than the kinetic ones at high volume fraction. The granular flow ultimately reaches the same maximum packing fraction ($\phi _{max} \sim 0.635$) in all the simulations, whatever the value of the interparticle friction. Reducing the maximum packing fraction in the radial distribution function leads to numerical instabilities. Instead, it is proposed here to let the coefficient $a$ in (2.23) depend on $\mu ^p$:

(3.2)\begin{equation} g_{0, \mu^p}(\phi) = \dfrac{2-\phi}{2(1-\phi)^3} + \dfrac{a(\mu^p)\,\phi^2}{(\phi_{max} -\phi)^{3/2}}. \end{equation}

Figure 4(b) shows the measured $a(\mu ^p)$ coefficient from the discrete simulations (black crosses). A hyperbolic tangent parametrization, reproducing the data perfectly, is proposed. It captures the strong variation at low interparticle friction and the saturation for larger values:

(3.3)\begin{equation} a(\mu^p) = a_0 + (a_{max}-a_0)\tanh(\mu^p/\delta), \end{equation}

with $a_0=0.58$ to recover the radial distribution function proposed by Chialvo & Sundaresan (Reference Chialvo and Sundaresan2013) for frictionless spheres, $a_{max} = 3.70$ and $\delta =0.54$. The obtained radial distribution function is compared with the ones measured in the DEM functions in figure 4(a) (solid lines), showing very good agreements for the whole range of volume fractions. The radial distribution function (3.2) makes it possible to mimic the impact of interparticle friction on the jamming volume fraction without modifying the maximum packing fraction in the KT model.

The previous discussion has shown that interparticle friction impacts strongly the micromechanics of the granular flow. It is also expected to influence granular temperature dissipation. Indeed, when particles interact, energy is dissipated through inelasticity and friction. Figure 5 shows the contact dissipation computed with the DEM simulation (symbols) for different values of interparticle friction coefficients. As expected, dissipation increases with interparticle friction, and, similarly to the radial distribution function, it saturates for $\mu ^p > 0.4$.

Figure 5. Dimensionless contact dissipation of granular temperature computed in the DEM simulations (symbols, simulation Ids 1 and 9–14) and predicted by the KT theory taking into account the effect of interparticle friction (solid lines). (a) Semi-log scale. (b) Linear scale; in the inset, solid lines correspond to the predicted dimensionless dissipation when the effect of interparticle friction is taken into account only in the radial distribution function.

The Garzó & Dufty (Reference Garzó and Dufty1999) model was derived for frictionless spheres and therefore does not account for this second source of dissipation. The rate of dissipation predicted by the KT is given in table 1 ($F_4$ coefficient). It is plotted in the solid blue line in figure 5. It predicts very well the contact dissipation of frictionless spheres (blue symbols) for volume fraction smaller than $0.55$ approximately, but fails above this value. Accounting for the impact of interparticle friction on the radial distribution function in the Garzó & Dufty (Reference Garzó and Dufty1999) dissipation law is not sufficient to capture the computed dissipation of frictional particles (see inset of figure 5b). To account for the additional source of dissipation by interparticle friction, Jenkins & Zhang (Reference Jenkins and Zhang2002) proposed to treat it similarly to inelasticity by a modification of the restitution coefficient $e_{eff}(\mu ^p) \leqslant e$, where $e_{eff}$ is the effective restitution coefficient. With asymptotical development at small $\mu ^p$, Jenkins & Zhang (Reference Jenkins and Zhang2002) proposed the following theoretical derivation:

(3.4)\begin{equation} e_{eff} = e - f(\mu^p) = e - \frac{1}{2}\left(a_1-a_2\,\frac{b_1}{b_2}\right). \end{equation}

Expressions for coefficients $a_1$, $a_2$, $b_1$ and $b_2$ are given in Appendix C and depend on $\mu ^p$ and $e$. The modified dimensionless dissipation coefficient $F_4^{\prime } = F_4 (1-e_{eff}^2)/(1-e^2)$ is plotted in solid coloured lines in figure 5. Even if the expression of effective restitution coefficient by Jenkins & Zhang (Reference Jenkins and Zhang2002) was derived in the limit of small $\mu ^p$, it reproduces almost perfectly the DEM simulations, even at large $\mu ^p$ and in particular the saturation of dissipation. This is because the effective restitution coefficient derived by Jenkins & Zhang (Reference Jenkins and Zhang2002) also saturates at large interparticle friction coefficient (see figure 16 of Appendix C).

3.4. Accounting for the saltation regime in the continuum framework

The results presented above show that, as expected, interparticle friction influences the radial distribution function and the rate of granular temperature dissipation at contact. In bedload transport, a saltation regime is also present at the top of the bed, i.e. at small volume fraction. This regime is controlled by the fluid drag force and therefore cannot be reproduced by the KT. To deal with this difficulty, saltation is usually treated as a top boundary condition (Pasini & Jenkins Reference Pasini and Jenkins2005; Berzi et al. Reference Berzi, Jenkins and Richard2020). In the present two-phase flow model, it is, however, necessary to model saltation in a continuum framework. Based on the law of motion of a single saltating particle, submitted to only gravity and a fluid drag force, and averaging over an ensemble of particles, Jenkins et al. (Reference Jenkins, Cantat and Valance2010) and Jenkins & Valance (Reference Jenkins and Valance2018) derived a theoretical continuum framework for saltation with analytical expression for the granular viscosity, which, with the present notation, can be written as

(3.5)\begin{equation} \eta^{salt} = \dfrac{\rho^p p^{kin}}{c_0 K}, \end{equation}

where $K$ is the fluid drag force coefficient defined in (2.9), and $c_0$ is a constant that should take into account all the correlations neglected during the averaging procedure. Jenkins et al. (Reference Jenkins, Cantat and Valance2010) proposed $c_0 = 20$ for aeolian saltation, while the present DEM simulations suggest $c_0=5$ for subaqueous saltation. The saltation regime takes place at the top of the bed, where the volume fraction is small and the granular pressure simplifies to its fluctuating part $p^{kin} \sim \rho ^p \phi T$, leading to the dimensionless viscosity law

(3.6)\begin{equation} \eta^{salt*} = \frac{\eta^{salt}}{\rho^p d \sqrt{T}} = \dfrac{\rho^p \phi \sqrt{T}}{c_0 d K} = \dfrac{\rho^p}{\rho^f}\,\dfrac{4}{3c_0}\,\frac{\phi \sqrt{T}}{C_D\,\|\boldsymbol{u}^f - \boldsymbol{u}^p\|}. \end{equation}

Figure 6(a) shows the dimensionless viscosity computed in the DEM simulations (symbols) for different particle to fluid density ratios together with the Garzó & Dufty (Reference Garzó and Dufty1999) coefficient ($F_2$ in table 1, dashed black line). The theoretical law reproduces perfectly the DEM data for intermediate to high volume fractions, but, as expected, not for $\phi < 0.2$. At rather low volume fraction, the viscosity exhibits a linear dependency on the volume fraction (the figure is in semi-log) as predicted by (3.6). This shows that there is a transition from a saltating regime to a kinetic regime. Such deviation of the viscosity law compared to the KT of Garzó & Dufty (Reference Garzó and Dufty1999) was already reported in Tsao & Koch (Reference Tsao and Koch1995) and Sangani et al. (Reference Sangani, Mo, Tsao and Koch1996) with simulations of sheared dilute gas–solid suspensions, indicating that this is probably a general trend in fluid–particle applications. A way to account for this transition is to average harmonically the contributions of viscosity due to saltation and to the fluctuating part of the kinetic-collisional model as

(3.7)\begin{equation} \eta^{*} = \dfrac{1}{\dfrac{1}{\eta^{k*}} + \dfrac{1}{\eta^{salt*}}} + \eta^{c*} + \eta^{b*}. \end{equation}

The result of (3.7) is plotted in the solid black line in figure 6(a), and it exhibits a very good match with the DEM data. This equation allows one to account for saltation at low volume fraction and to recover the KT expressions for $\phi >0.2$.

Figure 6. (a) Dimensionless viscosity and (b) granular temperature flux coefficient computed in the DEM simulations for different particle to fluid density ratios $r$ (symbols, simulation Ids 1 and 6–8), and predicted by the classical KT theory (dashed black line) and with (3.7) and (3.10) for $r=2.5$ (solid black line).

To justify the adopted form of viscosity coefficient, it is compared with the approach of Garzó et al. (Reference Garzó, Tenneti, Subramaniam and Hrenya2012) and González & Garzó (Reference González and Garzó2019). In these works, the authors accounted for fluid–particle interactions in the Enskog kinetic equation and derived new KT coefficients modified by fluid–particle forces, in particular drag force. Their results show that the kinetic contribution of the viscosity is affected by the fluid drag force, which reads, using the present notation (in (2.1) of Garzó et al. (Reference Garzó, Tenneti, Subramaniam and Hrenya2012), by identification to the present configuration, the mean drag and thermal drag terms are the same, $\beta = \gamma = (1-\phi )({{\rm \pi} d^3}/{6})K$, and as no stochastic model is adopted, $B=0$; the viscosity term (3.7) is then given by (7.7) of Garzó et al. (Reference Garzó, Tenneti, Subramaniam and Hrenya2012), neglecting the small terms proportional to $a_2$),

(3.8)\begin{equation} \dfrac{1}{\eta_{Garzo2012}^{k*}} = \dfrac{1}{\eta^{k*}} + \dfrac{1}{c_1\dfrac{\rho^p\phi \sqrt{T}}{dK}}, \end{equation}

in which the saltation viscosity proposed by Jenkins et al. (Reference Jenkins, Cantat and Valance2010) naturally comes out and where $c_1 = (1-2/5(1+e)(1-3e)\phi g_0) / (1-\phi )$ reduces to $c_1 \sim 1$ in the dilute regime. This justifies even further that the behaviour observed in the dilute part of the granular flow corresponds to a regime controlled by the fluid–particle interactions leading in the present configuration to a saltation regime.

Contrary to the predictions of (3.6), the viscosity law measured in the DEM simulations does not show any dependency with the particle to fluid density ratio (different symbols of figure 6(a) all superimposed). This is possibly due to the simplicity of the saltation model, for which many assumptions have been made (non-interacting saltating particles, fixed bed, correlations neglected during averaging procedure, etc.). Despite this apparent contradiction between the saltation theoretical model and the DEM simulations, it will be shown that (3.7) with (3.6) reproduces very well the transition towards the saltation regime for the whole range of particle to fluid density ratio.

The granular temperature flux coefficient, plotted in figure 6(b), shows a similar trend, with signature of the saltation regime at low volume fraction, not captured by the Garzó & Dufty (Reference Garzó and Dufty1999) coefficient ($F_3$ in table 1, dashed black line). The saltation model of Jenkins et al. (Reference Jenkins, Cantat and Valance2010), however, does not provide an analytical expression for this coefficient. Taking inspiration from classical turbulence models, in which the turbulent kinetic energy flux coefficient is taken proportional to the turbulent eddy viscosity, it is assumed that

(3.9)\begin{equation} \kappa^{salt*} = \dfrac{\eta^{salt*}}{\sigma}, \end{equation}

where $\sigma =0.5$ is an empirical constant adjusted on the DEM simulations. Similarly to the viscosity law, the contribution of saltation is accounted for in the granular temperature flux coefficient as

(3.10)\begin{equation} \kappa^{*} = \dfrac{\kappa^{salt*}\kappa^{k*}}{\kappa^{salt*} + \kappa^{k*}} + \kappa^{c*}+ \kappa^{b*}. \end{equation}

The result is plotted as the solid black line in figure 6(b), capturing correctly the signature of the saltation regime on the pseudo-heat-flux coefficient.

3.5. Dissipation by the drag force

The work done by the drag force due to granular fluctuating motion $J_{int} = n\left \langle f_{Di}v_i^{p\prime }\right \rangle ^s$ is plotted in figure 7 for different values of interparticle friction. As expected from the Ding & Gidaspow (Reference Ding and Gidaspow1990) closure (2.25), no dependency on interparticle friction is observed, nor on any other parameter (not shown for readability). However, (2.25), shown as the dashed black line, underestimates the effective dissipation of fluctuating energy by the drag force for the whole range of volume fraction. This is because a linear drag force was assumed to derive closure (2.25), while it is not the case in this configuration (or in any turbulent flow application). To understand how the quadratic nature of the drag force influences the dissipation of fluctuating energy, let us replace $f_{Di}$ by the drag force (2.9) in $J_{int}$:

(3.11)$$\begin{gather} J_{int} = n\overline{\left\langle f_{Di}v_i^{p\prime}\right\rangle }^p = \dfrac{3}{4}\,\dfrac{\phi\rho^f(1-\phi)^{-\zeta}}{d}\,\overline{\left\langle C_D\,\|\boldsymbol{u}^f - \boldsymbol{v}^p\|\,(u_i^f - v_i^p)v_i^{p\prime}\right\rangle }^p, \end{gather}$$

so

(3.12)$$\begin{gather}J_{int} \propto \overline{\left\langle C_D\,\|\boldsymbol{u}^f - \boldsymbol{v}^p\|\,(u_i^f - v_i^p)v_i^{p\prime}\right\rangle }^p. \end{gather}$$

Figure 7. Dimensionless granular temperature dissipation by the drag force computed in the DEM simulations (symbols, simulation Ids 1 and 9–14) compared with (2.25) (dashed black line) and with corrected model (3.13) (solid black line).

In order to provide a closure, it is necessary to discuss the term inside the averaging operator $\overline {\langle \cdot \rangle }^p$. Indeed, depending on the value of the particle Reynolds number $Re_p$, $C_D\,\|\boldsymbol {u}^f - \boldsymbol {v}^p\|\,(u_i^f - v_i^p)$ can be linear with the relative velocity (laminar regime), quadratic (turbulent regime), or in between. While it is usually assumed that the drag is linear (Ding & Gidaspow Reference Ding and Gidaspow1990; Fox Reference Fox2014), this assumption does not hold in the turbulent bedload transport configuration. Indeed, the particle Reynolds number ranges between $Re_p \sim 100$ in the bed to $Re_p \sim 2500$ at the bed surface. The drag force is therefore quadratic at the surface and in a transitional regime in the bed. Splitting the particle velocity into mean and fluctuating components, and performing a Taylor expansion to first order with respect to the mean values, the following expression of the granular temperature dissipation through the drag force is obtained (see Appendix D):

(3.13)\begin{equation} J_{int} \sim{-} \phi(1-\phi)K\left(3+2\,\dfrac{C_D^{\infty}}{C_D}\right)T, \end{equation}

where $C_D^{\infty }$ is the value of the drag coefficient for an infinite particle Reynolds number. Note that this term is negative and corresponds to a loss of fluctuating energy for the granular phase. The term $2C_D^{\infty }/C_D$ represents an additional source of dissipation due to the quadratic nature of the drag force. In order to derive this expression, it has been assumed that $\left\|\overline{\left<\boldsymbol{u}^f\right>}^f - \overline{\left<\boldsymbol{v}^p\right>}^p\right\| \sim \left|\overline{\left<u_x^f\right>}^f - \overline{\left< v_x^p\right>}^p\right|$ and that $\overline {\left \langle v_x^{p\prime }v_x^{p\prime }\right \rangle }^p \sim 2T$. These assumptions are specific to configurations with a preferential shearing direction with anisotropic velocity fluctuations. However, computations presented in Appendix D can be adapted easily to other cases. The corrected closure (3.13) is plotted in coloured solid lines and compared with DEM data in figure 7. It improves quantitatively the prediction of dissipated energy. It shows very good agreement with the DEM in the dilute regime, but underestimates slightly the drag dissipation at high volume fractions. In this limit, the influence of the drag is, however, very small, and this underestimation should not affect too much the balance of granular temperature.

3.6. Evaluation of the proposed two-fluid model

The results presented in the previous subsections allow us to propose a two-fluid model for bedload transport based on the Garzó & Dufty (Reference Garzó and Dufty1999) KT model that accounts for the effects of interparticle friction and for the saltation regime. The model closures are summarized in the right-hand column of table 1. The model has been implemented in SedFoam, and the results can be compared with the DEM simulations in figure 8. The results are shown for different Shields numbers (figures 8ac), different particle to fluid density ratios (figures 8df), different interparticle friction coefficients (figures 8gi) and for different restitution coefficients (figures 8jl).

Figure 8. Comparison between DEM (symbols) and two-phase flow results with corrected model (solid lines) for: (ac) varying Shields numbers, simulation Ids 1–5; (df) varying particle to fluid density ratios $r$, simulation Ids 1 and 6–8; (gi) varying interparticle friction coefficients $\mu ^p$, simulation Ids 1 and 9–12; and ( jl) varying restitution coefficients $e$, simulation Ids 1 and 15–17. (a,d,g,j) Volume fraction profiles; (b,e,h,k) dimensionless particle velocity and transport (inset) profiles; and (cf,i,l) dimensionless granular temperature.

Overall, the results are improved quantitatively compared with the initial model. Focusing on figures 8(ac) (variation of Shields number), the shape of the volume fraction profiles is reproduced nicely, in particular the formation of the ‘shoulder’ at volume fraction around $\phi \sim 0.3$. The velocity profiles are well predicted by the continuum model for all Shields numbers. In particular, the depth of the flowing layer is captured perfectly. This is remarkable as the depth at which the flow stops is a response of the stress and energy balance between both phases and not computed with a bottom boundary condition. The plateau of velocity observed previously in the dilute regime (figure 3) is no longer present thanks to the saltation model. The shapes of the predicted velocity profiles are in agreement with DEM ones in the dilute regime. For the low Shields number case $\theta =0.2$, both the volume fraction and velocity profiles are not well predicted. That case is at the transition with ordinary bedload, usually modelled using statistical approaches. The height of the transport layer is of the same order as the particle diameter, which makes a continuum description questionable and could explain the discrepancies of the continuum model in the low-Shields-number case. As a consequence of the well-predicted volume fraction and velocity profiles, the transport profiles are very well reproduced (see inset of figure 8b). The thickness of the transport layer and its increase with the Shields number are particularly well predicted. The proposed continuum model also improves the predicted granular temperature (figure 8c) compared with the initial model (figure 3c). To be more quantitative, figure 9(a) shows the predicted transport error between the two-phase model (initial model shown by empty symbols, proposed model shown by solid symbols) and the DEM simulations, defined as $e = |Q_s^{two\text {-}fluid}-Q_s^{DEM}|/ Q_s^{DEM}$, with $Q_s = \int _z \phi v_x^p\,{\rm d}z$. Except for the case $\theta =0.2$, the error is largely reduced with the proposed two-phase model, below $15\,\%$, while it was more than $50\,\%$ with the initial model. For $\theta =0.2$, the lower error with the initial model is not relevant as this is due to compensating errors, and the proposed model is qualitatively better (compare figures 3 and 8). Concerning the fluid velocity profiles (figure 9b), the two-phase model predictions are almost perfect. This is not surprising as the fluid model is exactly the same in both models.

Figure 9. (a) Error between solid transport rate in the discrete simulations and predicted by the initial model (empty circles) and by the corrected model (solid squares) for varying Shields numbers (simulation Ids 1–5).(b) Comparison of the fluid velocity profiles between DEM (symbols) and two-phase flow results with corrected model (solid lines) for varying Shields numbers (simulation Ids 1–5).

The two-fluid model predictions for varying density ratios (figures 8df) are also in very good agreement with the DEM results. In particular, the increase of dimensionless transport for decreasing density ratio (inset of figure 8e) is captured by the two-fluid model. In the saltation regime ($z/d \sim 15$), the slight dependence of the particle velocity with the density ratio is also reproduced by the two-fluid model. This is surprising, as the saltation model of Jenkins et al. (Reference Jenkins, Cantat and Valance2010) used in the two-fluid model accounts for a dependency on the density ratio that was not observed in the DEM simulation (see discussions of § 3.4). This indicates that this dependency does not have much effect in the explored range of density ratio and could explain why it was not observed in the DEM simulations (figure 6).

The DEM results for varying interparticle friction coefficients (symbols of figure 8gi), indicate that the behaviour of the granular flow depends highly on the interparticle friction $\mu ^p$ when it is small, but not when it is large. The simulations at $\mu ^p=0.8$ and $1.5$ are not shown because they are completely superimposed with the case $\mu ^p = 0.6$. This is in line with the conclusions of § 3.3, where the radial distribution function $g_0$ and rate of granular temperature dissipation were observed to be independent of $\mu ^p$ when it is higher than $0.4\unicode{x2013} 0.6$. The two-fluid model reproduces correctly the dynamics of the granular flow for frictional particles, even though the particle velocity and transport are slightly underestimated for small interparticle friction coefficient $\mu ^p \leqslant 0.2$ (orange and green curves of figure 8h). For frictionless particles (blue symbols and blue line), the two-fluid model is quantitative in the dilute part but not in the dense part. In this case, the region where the elastic stresses dominate is large, leading to a large granular flow depth. The Coulomb-type model used for elastic stresses is certainly too simple to represent the complexity of the flow for frictionless particles. However, for frictional particles, this region is reduced drastically and the Coulomb model leads to very acceptable results. Using a more elaborate model, especially able to represent the quasi-static granular flow (Bouzid et al. Reference Bouzid, Trulsson, Claudin, Clément and Andreotti2013; Kamrin & Henann Reference Kamrin and Henann2014; Zhang et al. Reference Zhang, Deal, Perron, Venditti, Benavides, Rushlow and Kamrin2022), would certainly make it possible to model the granular flow of frictionless spheres and to improve the results at low interparticle friction. As natural particles are always frictional, the Coulomb model is acceptable for the targeted configurations, and this is left for future work.

The results of the DEM and of the two-fluid model do not show any dependency on the restitution coefficient (figures 8jl). This is surprising, as the restitution coefficient is one of the main parameters of the KT responsible for the granular energy dissipation. This seems to indicate that for the range of parameters investigated herein, interparticle friction controls the dissipation of energy. This is discussed in more detail in the next section.

Finally, simulations in which the particle diameter were varied have been performed. As absolutely no effects were noticed in dimensionless form, these simulations are not shown. This is not surprising, as all the closures introduced in the two-phase flow model scale with the particle diameter. This should no longer be true if turbulence particle interactions are considered.

4. Discussions

The proposed model has been shown to reproduce very accurately the DEM results. The improvements provided by the corrections to account for interparticle friction and saltation can be analysed in order to interpret the physics of the granular flow in bedload transport.

4.1. Interparticle friction controls the rate of energy dissipation

Interparticle friction has been shown to play an important role in the granular flow behaviour. It modifies the radial distribution function and increases the granular temperature dissipation at contact. In our DEM simulations with frictional particles $\mu ^p = 0.4$, almost no influence of the restitution coefficient is observed (figures 8g,h). The volume fraction and velocity profiles are completely superimposed whatever the value of $e$, ranging from $e=0.3$ to $e=0.9$. The granular temperature is slightly higher for a higher restitution coefficient, but no important trend is observed, while one could expect a large difference between the cases $e=0.3$ and $e=0.9$. It indicates that the dissipation of granular temperature is governed by interparticle friction rather than inelasticity of collisions. Figure 10 shows the dimensionless rate of dissipation of frictional particles, $\mu ^p=0.4$, for restitution coefficients ranging from $e=0.3$ to $e=0.9$. The rate of dissipation is slightly lower for $e=0.9$, but is the same for the other simulations with smaller restitution coefficients $e \leqslant 0.7$. On the contrary, a stronger influence on the interparticle friction coefficient was observed both on the rate of dissipation (figure 5) and on the macroscopic dynamics of the granular flow (figures 8gi). This indicates that in bedload transport of inertial particles and for the range of parameters investigated, interparticle friction plays a more important role than inelasticity in the energy dissipation at contact of frictional particles.

Figure 10. Dimensionless rate of dissipation of granular temperature at contact for different restitution coefficients computed in the DEM simulations (simulation Ids 1 and 15–17) and predicted by the modified KT to account for interparticle friction ($\mu ^p = 0.4$).

The two-fluid model reproduces correctly this property, as shown in figure 10, where the solid line represents the predicted rate of granular temperature dissipation at contact. For $e\leqslant 0.7$, the two-fluid model does not predict any influence of the restitution coefficient on the energy dissipation at contact. Indeed, the dissipation $\varGamma$, predicted by the KT, is proportional to $1-e^2$ and therefore highly dependent on the restitution coefficient when it is large ($e>0.7$). When applying the correction proposed by Jenkins & Zhang (Reference Jenkins and Zhang2002), which consists of a reduction of the restitution coefficient to account for friction ($e_{eff} = e - f(\mu ) <0.7$), the dissipation law is made less dependent on $e$. The KT model is therefore applied in a range of parameters that barely depends on the restitution coefficient. As a consequence, the two-fluid model does not show much dependence of the macroscopic behaviour on the restitution coefficient (figures 8jl).

4.2. Macroscopic behaviour of frictional particles independent of particle microscopic properties

When considering natural materials, particles are expected to be frictional, with $\mu ^p \geqslant 0.4$, and inelastic with $e < 0.9$. In this range of parameters, the rate of dissipation of granular temperature does not depend on $e$ or on $\mu ^p$ (see figures 10 and 5). Additionally, it was shown that interparticle friction modifies the radial distribution function $g_0$. A strong influence was noticed compared with frictionless particles, but the effect saturates rapidly when the value of $\mu ^p$ increases above $\mu ^p \geqslant 0.4$ (see figure 4). This means that for frictional-inelastic particles, almost no influence of the restitution coefficient and interparticle friction is expected on the macroscopic behaviour of the granular flow. This is particularly interesting as natural materials are frictional and non-spherical, and estimating their restitution coefficient and interparticle friction can be an extremely difficult task. The proposed two-fluid model is able to reproduce this property, and this strongly supports using it to predict bedload transport in more realistic configurations.

The fact that the macroscopic behaviour becomes independent of the interparticle friction coefficient when it is high enough can be interpreted from micromechanical perspectives. When considering frictionless particles, a two-particle contact is necessarily a sliding contact. Interparticle friction introduces the possibility of rotating contact. Several studies have shown that the percentage of sliding contacts decreases very rapidly with increasing interparticle friction coefficient (e.g. Thornton Reference Thornton2000; Yang, Yang & Wang Reference Yang, Yang and Wang2012), associated with a saturation of dissipated energy. According to Thornton (Reference Thornton2000), this indicates that interparticle ‘friction acts, primarily, as a kinematic constraint. Enhanced friction at the contacts increases the stability of the system’. Our observations are in agreement with the Thornton (Reference Thornton2000) analysis, performed with dense shear deformation DEM simulations, and therefore extends to the bedload configuration.

In the present simulations, any impact of lubrication forces on collisions between particles has been neglected. The experiments of Gondret, Lance & Petit (Reference Gondret, Lance and Petit2002) and Yang & Hunt (Reference Yang and Hunt2006) showed that for particles immersed in a viscous fluid, the restitution coefficient of the collisions reduces for slower impact velocity. In other words, lubrication forces make particles even more inelastic and bring the system into a regime where it depends even less on the restitution coefficient. Therefore, when considering more realistic configurations of collisional bedload transport, neglecting the impact of lubrication forces is certainly a reasonable assumption.

4.3. Granular flow rheology

Kinetic theory is often criticized for its inability to predict dense granular flows. Our simulations, however, show very good results even in the dense regime. The results can be interpreted in the framework of the granular flow rheology. Figure 11 shows the $\mu$ versus $I$ and $\phi$ versus $I$ relations for different Shields numbers, where it is recalled that $\mu = \tau ^p/p^p$ is the effective friction coefficient – or normal to shear stress ratio – and $I = d\dot {\gamma }/\sqrt {P^p/\rho ^p}$ is the inertial number. The DEM data do not show any dependency with the Shields number. The $\mu (I)$ rheology for bedload transport ((1.1) and (1.2)) derived by Maurin et al. (Reference Maurin, Chauchat and Frey2016) (dash-dotted line) is retrieved in the dense part of the granular flow, $0.3 < \phi < 0.6$, corresponding to $10^{-2} < I < 2$. The departure between the data points and the $\mu (I)$ rheology for small $I$ (resp. large $I$) is characteristic of the quasi-static regime (resp. the dilute regime) that cannot be captured by a local rheology such as $\mu (I)$/$\phi (I)$ rheology. The same observations can be made on the scaling law between the volume fraction and the inertial number (figure 11b), with departure from the $\phi (I)$ law at low and large values of $I$.

Figure 11. Plots of (a) $\mu (I)$ and (b) $\phi (I)$ computed in the DEM (symbols) and compared with: the rheological law proposed by Maurin et al. (Reference Maurin, Chauchat and Frey2016) ((1.1) and (1.2)) for bedload transport (dot-dashed lines); two-phase flow simulation with the initial model before any correction (configuration 1, dashed lines); and two-phase flow simulations with the corrected model for different Shields numbers (simulation Ids 1 and 3–5, solid lines).

Both of these scaling laws can also be computed in the two-fluid simulations, in which the effective friction coefficient is computed with the total stresses, i.e. the sum of the elastic and kinetic-collisional contributions. They are plotted in coloured solid lines in figure 11. Surprisingly, the $\mu (I)/\phi (I)$ rheology is retrieved in the dense part of the granular flow. The elastic stresses make the effective friction coefficient asymptotically join the static friction coefficient $\mu _s$ in the limit of vanishing inertial number. At large inertial number, the two-fluid model overestimates the effective friction coefficient, but as in the DEM, a deviation to the $\mu (I)$ rheology (dash-dotted line) is observed with a similar trend. The $\phi (I)$ law is also very well reproduced in the entire range of inertial number. The rheology obtained with the initial model for $\theta =0.6$, before application of the corrections proposed in § 3, is plotted in the dashed line and highlights the role of these corrections in the rheological behaviour of the granular flow. The dashed line shows two branches, characteristic of a hysteresis behaviour, as suggested by Forterre & Pouliquen (Reference Forterre and Pouliquen2008).

In the dense regime, corresponding to the lower branch, the model shows the same trend as in the DEM data but underestimates the stress ratio. This is because interparticle friction was not taken into account in the first model, and the rate of dissipation was underestimated. The corrections to account for interparticle friction, including modification of $g_0$ and of the restitution coefficient in the dissipation law, make the granular flow less inertial, improving the results quantitatively. In the literature, the recent attempts to model dense granular flows with the KT have used the extended KT, consisting in the introduction of a correlation length in the dissipation term $\varGamma$. Our results suggest that the reproduction of the dense granular flow regime over an erodible bed is dominated by the competition between elastic-frictional and kinetic-collisional stresses rather than the development of velocity correlation at high volume fraction (Jenkins Reference Jenkins2006, Reference Jenkins2007; Berzi & Jenkins Reference Berzi and Jenkins2011; Berzi et al. Reference Berzi, Jenkins and Richard2020). In the present model, this is the hybridization of the KT with a frictional model that makes it possible to recover the correct behaviour in the dense regime.

In the dilute regime, corresponding to the higher branch, the behaviour predicted by the initial model is completely different from the DEM simulations for both scaling laws, with a turning point of the curves leading to a hysteresis effect. The proposed model, which accounts for saltation in the dilute regime, removes this hysteresis and shows behaviour similar to that in the DEM, in particular the local minimum of effective friction for $I$ between $2$ and $8$. This shows clearly that the departure from the $\mu (I)$ rheology, observed both in the DEM and in the two-fluid model, is a signature of saltation. The saltation model (3.5) proposed by Jenkins et al. (Reference Jenkins, Cantat and Valance2010) predicts, after rewriting, a $\mu$ to $I$ relationship as

(4.1)\begin{equation} \mu^{salt} = \dfrac{\rho^{p3/2}\sqrt{\phi T}}{c_0dK}\,I. \end{equation}

The departure from the $\mu (I)$ rheology therefore corresponds to the transition from the kinetic-collisional regime to the saltation regime. The inertial number at which this transition occurs results from a competition between the different physical mechanisms controlling the granular flow in the dilute regime, and should depend on the characteristics of the flow, in particular on the ratio $\sqrt {\phi T}/K$. This regime transition is also observed in the $\phi$ to $I$ relation. Except for the case $\theta = 0.4$, the two-fluid model reproduces quantitatively the volume fraction in the dilute regime. The data seem to indicate that this transition always occurs for a volume fraction approximately $\phi \sim 0.25$. A better understanding of saltation in bedload transport and its modelling would be useful to better describe this regime transition.

Among the different parameters explored in the present work, only $\mu ^p$ was observed to affect the rheology of the granular flow. The $\mu$ to $I$ and $\phi$ to $I$ relations are shown for different interparticle friction coefficients in figure 12. The $\phi$ to $I$ relation is not much affected by the value of $\mu ^p$; however, in the dense part of the flow ($I < 2\sim 3$), the value of the stress ratio $\mu$ is lower for lower values of interparticle friction coefficient. This is not surprising as the frictional $\mu (I)$ rheology depends on the static friction coefficient $\mu _s$ (see (1.1)), which itself depends on the interparticle friction coefficient $\mu ^p$ (see Appendix B). On the contrary, for $I>2\sim 3$, only slight dependencies on $\mu ^p$ are observed, except for the frictionless spheres. Again, this is not surprising as this corresponds to the saltation regime, which is not expected to be affected by interparticle friction (4.1). For the whole range of inertial number $I$, no more effect on the rheology is observed for $\mu ^p > 0.4$.

Figure 12. Plots of (a) $\mu (I)$ and (b) $\phi (I)$ computed in the DEM (symbols) and compared with two-phase flow simulations with the corrected model for different interparticle friction coefficient (simulation Ids 1 and 9–12, solid lines).

The two-fluid model represents qualitatively this dependency on the interparticle friction coefficient, but it overestimates the stress ratio for the low values of $\mu ^p$. This explains the discrepancies observed in figure 8(h) when comparing the velocity profiles predicted by the two-fluid model with the DEM results. For higher values of the interparticle friction coefficient, the agreement is excellent for a large range of inertial number.

4.4. Evaluation with the experimental dataset of Ni & Capart (2018)

In order to further assess the proposed two-phase flow model, it is now compared with the experimental dataset of Ni & Capart (Reference Ni and Capart2018). The authors performed turbulent open-channel flow experiments with mobile bed particles, using a sloping channel of length $L = 1.3$ m and width $B=120$ mm. Particles are PMMA spheres of diameter $d=7$ mm and density $\rho ^p = 1190 \ {\rm kg}\ {\rm m}^{-3}$ immersed in a fluid (para-cymene) of density $\rho ^f = 855\ {\rm kg}\ {\rm m}^{-3}$ and viscosity $\nu ^f = 1.15\times 10^{-6}\ {\rm m}^{2}\ {\rm s}^{-1}$. Particles have restitution coefficient $e=0.93$, dynamic friction coefficient $\mu ^p=0.55$, and static friction coefficient $\mu _s=0.34$. With respect to the discussion of § 4.2, the system dynamics should not be sensitive to these microscopic particle parameters. Using an index-matching technique, the authors were able to measure the fluid velocity, particle volume fraction and particle streamwise velocity profiles.

The dataset is composed of eight experiments with varying fluid flow rate and channel slope. The authors measured non-negligible convective accelerations that they attributed to the flow non-uniformity. The equivalent one-dimensional flows are simulated with the two-phase flow model. The same sediment mass is introduced in the model as well as the same fluid free surface position. The channel slope $S_0$ is modelled as a pressure gradient in the streamwise direction such that $\partial p^i / \partial x = \rho ^igS_0$, with $i = f,p$, depending on the phase considered. The convective acceleration profiles measured experimentally are depth-averaged and accounted for as source terms in the fluid phase. This methodology ensures that at steady state, the stresses of the mixture (fluid and particle) in the simulations are consistent with those measured in the experiments.

Because of the weak fluid submergence in the Ni & Capart (Reference Ni and Capart2018) experiments, the mixing length given in (2.8a,b) that was used in the analysis above is not adapted for this configuration. Indeed, for low submergence, turbulence originates from fluid–particle interactions, and larger-scale turbulence, associated with the flow depth, is not able to develop. Therefore, the mixing length proposed by Berzi & Fraccarollo (Reference Berzi and Fraccarollo2015) is adopted hereafter: $l_m = 3d(\phi _{max}-\phi )^3$. It scales with the particle diameter and the volume fraction, consistent with fluid–particle turbulence. In their experiments, Ni & Capart (Reference Ni and Capart2018) observed $l_m = 0.2d$ as a minimal value for the mixing length. The following form of mixing length is therefore adopted:

(4.2)\begin{equation} l_m = \max \left[3d\left(\phi_{max}-\phi\right)^3, 0.2d \right]. \end{equation}

This form of mixing length has already been used in Zhang et al. (Reference Zhang, Deal, Perron, Venditti, Benavides, Rushlow and Kamrin2022) to reproduce sediment transport simulations with the lattice Boltzman method coupled with DEM.

Contrary to the DEM simulations presented in § 3.1, the particles experience interactions with the fluid turbulence. In turbulence-averaged models, this can be accounted for with the introduction of a drift velocity $\boldsymbol {u}_d$ in the drag force, and (2.9) becomes (Chauchat Reference Chauchat2018)

(4.3)\begin{equation} n\boldsymbol{f_{D}} = \phi(1-\phi)K(\boldsymbol{u}^f - \boldsymbol{u}^p + \boldsymbol{u}_d). \end{equation}

The drift velocity represents the fluid velocity fluctuations ‘seen by the particles’, and it corresponds physically to a dispersion effect on the particle phase induced by the turbulent velocity fluctuations. Consistently with the Rouse (Reference Rouse1937) approximation, it is usually modelled using a gradient diffusion model as

(4.4)\begin{equation} \boldsymbol{u}_d = \dfrac{\nu_t}{S_c}\,\dfrac{\boldsymbol{\nabla} \phi}{\phi}, \end{equation}

where $S_c=1/3$ is the Schmidt number. The modification of the mixing length and the addition of the drift velocity are the only modifications made to the two-phase flow model.

Figure 13 compares the two-phase flow simulations with the experimental measurements for Shields number ranging from $0.2$ to $0.4$. The Shields number is computed in the experiments as $\theta = \rho g (h_f-h_b) S_0/[(\rho ^p-\rho ^f)gd]$, where $h_f$ is the free surface position, and $h_b$ is the bed position corresponding to $99\,\%$ of the solid transport rate. Overall, the two-phase flow simulations are in qualitative agreement with the laboratory experiments. The increase of both the particle and fluid velocities, as well as the flowing depth, with the Shields number is captured correctly. In particular, the particle velocity profiles (figure 13b) are in excellent agreement for the whole range of depth. The fluid velocity profiles are correct for intermediate to large volume fraction, $z/d \leqslant 4$, but a slight departure is observed above this level. This is because the volume fraction in this region is not well predicted by the model, which affects the fluid velocity through the volume fraction dependency in the mixing length. The model is indeed less accurate at predicting the volume fraction profiles (figure 13a). The particles were observed to be more deposited in the simulations. The granular temperature (figure 13d) is also underpredicted. This may explain the differences in the volume fraction profiles: if particles have less fluctuating kinetic energy, then they are more deposited. In comparison with the DEM simulations, the dimensionless granular temperature is substantially higher in the experiments than in the discrete simulations. This seems to indicate that there exist transfers of fluctuating energy between the fluid and the particle phases. This is not accounted for in the present model. It may play a important role in the particle dynamics, and it could be responsible for some of the model discrepancies.

Figure 13. Evaluation of the two-phase model with the Ni & Capart (Reference Ni and Capart2018) turbulent bedload transport experiments at four Shields numbers: (a) volume fraction, (b) dimensionless particle velocity, (c) dimensionless fluid velocity, and (d) dimensionless granular temperature.

The present evaluation of the model with the Ni & Capart (Reference Ni and Capart2018) dataset therefore validates the model when turbulence is negligible and does not affect the particles much, which is the purpose of this work. To be able to reproduce more realistic configurations, it will be necessary to investigate further the transfers of fluctuating energy between the fluid and particle phases. The present model represents a very good basis to incorporate these physical processes, but it is beyond the scope of the present contribution.

To evaluate the improvements achieved in this work, figure 14 compares, for the experimental configuration $\theta =0.39$, the initial model (dashed line) with the proposed model (solid line). The improvements on the granular velocity are obvious. The flow depth, the velocity magnitude and the behaviour in the dilute region are largely improved by the proposed model. Because the proposed model accounts for the energy dissipation due to interparticle friction, the granular temperature is lower in the proposed model, which makes the bed more compacted.

Figure 14. Comparison of the initial (dashed line) and proposed (solid line) models with the experimental case $\theta =0.39$ (symbols): (a) volume fraction, (b) dimensionless particle velocity, and (c) dimensionless granular temperature.

5. Conclusions

In this paper, the modelling of bedload transport in the collisional regime has been studied. In order to focus on the sediment phase modelling, simple fluid–particle interactions have been considered without turbulent–particle interactions. The sediment phase is modelled with a frictional–collisional approach (Johnson & Jackson Reference Johnson and Jackson1987). Comparisons with coupled fluid–DEM simulations have highlighted that the classical kinetic theory (KT) model of Garzó & Dufty (Reference Garzó and Dufty1999) is not able to reproduce correctly the behaviour of the granular flow. It is shown that interparticle friction strongly influences the dynamics of the flow, increasing dissipation and modifying the radial distribution function $g_0$. In the dilute regime, at the top of the sediment bed, the saltation regime could not be predicted by the Garzó & Dufty (Reference Garzó and Dufty1999) model.

Based on these observations, modifications to the classical Garzó & Dufty (Reference Garzó and Dufty1999) model have been proposed: (i) the theoretical saltation model of Jenkins et al. (Reference Jenkins, Cantat and Valance2010) has been used; and (ii) the impact of the interparticle friction on the dissipation of energy at contact has been accounted for following the theoretical development of Jenkins & Zhang (Reference Jenkins and Zhang2002), consisting in reducing the restitution coefficient. The proposed model, based essentially on theoretical developments, has shown remarkable capabilities at reproducing the DEM simulations for a large variation of Shields number, particle to fluid density ratio, interparticle friction coefficient, restitution coefficient and particle diameter.

The results allowed us to demonstrate the primary role played by interparticle friction in the dissipation of granular energy. Additionally, it was shown that for frictional-inelastic particles ($\mu ^p>0.4$ and $e\leqslant 0.7$) corresponding to most natural materials, the macroscopic behaviour of the granular flow is independent on the microscopic properties of the particles, i.e. interparticle friction and restitution coefficient. The proposed two-fluid model is able to reproduce this property, giving it strong credit for further applications to sediment transport involving natural particles.

This work has also shown that in the bedload configuration, the frictional–collisional approach is consistent with the $\mu (I)$ rheology and represents a first success to reproduce the dense granular flow rheology with the KT in granular flow on an erodible bed. The approach presented in this paper could be adapted easily to other granular configurations, in particular to any granular flows over an erodible bed, and should also be able to reproduce the rheological properties of the flow.

Finally, the proposed two-fluid model has been compared with experiments (Ni & Capart Reference Ni and Capart2018). The improvements achieved by the proposed model are remarkable. It therefore represents a strong basis to further study turbulence–particle interactions and their modelling in more complex configurations, such as real turbulent sediment transport with coherent structures or in the presence of hydraulic structures such as scour around pipelines or bridge piers.

Acknowledgements

Most of the computations presented in this paper were performed using the GENCI infrastructure under allocations A0060107567 and A0080107567, and the GRICAD infrastructure. LEGI is a member of Labex TEC21 (Investissements d'Avenir grant agreement ANR-11-LABX-0030) and Labex Osug@2020 (Investissements d'Avenir grant agreement ANR-10-LABX-0056). The authors would also like to acknowledge the fruitful discussions on granular flows with P. Frey and R. Maurin.

Funding

The authors would like to acknowledge the financial support from the Agence Nationale de la Recherche (ANR) through the project SheetFlow (ANR-18-CE01-0003).

Declaration of interests

The authors report no conflict of interest.

Data availability statement

The results of the coupled fluid–discrete simulations and of the two-phase flow model are openly available at https://doi.org/10.5281/zenodo.7835266. The SedFoam solver version used in this article is available at https://doi.org/10.5281/zenodo.7944048 (Bonamy et al. Reference Bonamy2023).

Appendix A. Definition of ensemble- and Favre-averaged operators

The mass and momentum equations are obtained through a double averaging procedure. First, an ensemble averaging allows one to obtain hydrodynamics quantities and continuum fields for the particle phase. A second Favre averaging provides turbulence filtered quantities.

A.1. Ensemble average

The averaging procedure proposed by Jackson (Reference Jackson1997, Reference Jackson2000) is adopted. It is based on a weighting function, representing the volume in which the averaging is performed. Considering the symmetry of the problem, a cuboid weighting function $\mathcal {H}$ with the same length and width as the three-dimensional domain is applied. In the vertical direction, in order to capture the strong gradient of the mean flow, the vertical thickness of the box is taken as $d_z = d/30$. The solid volume fraction is computed as

(A1)\begin{equation} \phi(z) = \sum_p \int_{V_p}\mathcal{H}(|z-z^{\prime}|)\,{\rm d}V, \end{equation}

where $V_p$ represents the volume of particle $p$. The fluid volume fraction is $\epsilon = 1-\phi$. The average over the solid phase of any scalar quantity $\gamma$ is computed as

(A2)\begin{equation} \langle \gamma\rangle ^p(z) = \dfrac{1}{\phi(z)}\sum_p \int_{V_p}\gamma(z^{\prime})\,\mathcal{H}(|z-z^{\prime}|)\,{\rm d}V, \end{equation}

and the average over the fluid phase of any scalar quantity $\gamma$ is computed as

(A3)\begin{equation} \langle \gamma\rangle ^f(z) = \dfrac{1}{\epsilon(z)} \int_{V_f}\gamma(z^{\prime})\,\mathcal{H}(|z-z^{\prime}|)\,{\rm d}V, \end{equation}

where $V_f$ is the volume occupied by the fluid phase.

A.2. Favre average

To average over turbulence, a Favre-averaging procedure is adopted. It involves an averaging over realizations defined as

(A4)\begin{equation} \tilde{\gamma} = \dfrac{1}{N}\lim_{N\rightarrow\infty}\sum_{k=1}^{N}\gamma_k, \end{equation}

where $\gamma _k$ is a given realization $k$ of a quantity $\gamma$, and $N$ is the total number of realizations. The Favre average is then defined as a concentration-weighted average, and is therefore different depending on the phase considered. For a quantity $\gamma$, the Favre averages over the fluid and solid phases are defined, respectively, as

(A5)$$\begin{gather} \bar{\gamma}^f = \dfrac{\widetilde{(1-\phi)\gamma}}{1-\tilde{\phi}}, \end{gather}$$
(A6)$$\begin{gather}\bar{\gamma}^p = \dfrac{\widetilde{\phi\gamma}}{\tilde{\phi}}. \end{gather}$$

Appendix B. Static friction coefficient

The static friction coefficient, corresponding to the threshold below which no motion is possible a priori, is estimated from numerical DEM data of the literature (Oger et al. Reference Oger, Savage, Corriveau and Sayed1998; Thornton Reference Thornton2000; Suiker & Fleck Reference Suiker and Fleck2004; Maeda, Hirabayashi & Ohmura Reference Maeda, Hirabayashi and Ohmura2006; Kruyt & Rothenburg Reference Kruyt and Rothenburg2006; Peña et al. Reference Peña, Lizcano, Alonso-Marroquin and Herrmann2008; Antony & Kruyt Reference Antony and Kruyt2009; Yang et al. Reference Yang, Yang and Wang2012) first collected and discussed in Dai, Yang & Zhou (Reference Dai, Yang and Zhou2016). This dataset, shown in figure 15, was obtained by micromechanical analyses of DEM simulations and is used here to estimate the static friction coefficient as a function of the interparticle friction coefficient. A good estimation can be obtained with the following fit of the data, plotted as a dashed black line in figure 15:

(B1)\begin{equation} \mu_s = \mu_{s0} + \mu_{s1}\tanh\left(\frac{\mu^p}{\mu_{s2}}\right), \end{equation}

with $\mu _{s0}=0.146$, $\mu _{s1}=0.228$ and $\mu _{s2}=0.232$. For $\mu ^p=0.4$, this yields a static friction coefficient $\mu _s = 0.36$, very close to the value computed by Maurin et al. (Reference Maurin, Chauchat and Frey2016) ($\mu _s = 0.35$) with DEM simulations of bedload transport with $\mu ^p=0.4$.

Figure 15. Static friction coefficient as a function of interparticle friction.

Figure 16. Variation of $f(\mu ^p)$ as a function of $\mu ^p$.

Appendix C. Effective restitution coefficient expressions derived by Jenkins & Zhang (2002)

Based on asymptotical development at small interparticle friction, Jenkins & Zhang (Reference Jenkins and Zhang2002) introduced an effective restitution coefficient in the rate of dissipation that accounts for the transfer of translational to rotational fluctuating kinetic energy and to the additional rate of dissipation due to interparticle friction. The obtained effective restitution coefficient is

(C1)\begin{equation} e_{eff} = e-f(\mu^p) = e - \frac{1}{2}\left(a_1-a_2\,\frac{b_1}{b_2}\right), \end{equation}

with

(C2)$$\begin{gather} a_1 = \frac{\mu^p}{\mu_0}\left[{\rm \pi}\mu_0 \left(1-\frac{2}{\rm \pi}\arctan(\mu_0)\right) + \frac{2\mu_0^2}{1+\mu_0^2}\,(1-2\mu^p/\mu_0)\right], \end{gather}$$
(C3)$$\begin{gather}a_2 = \frac{5}{2}\,\frac{\mu^p}{\mu_0}\left[\frac{\rm \pi}{2}\,\mu_0 \left(1-\frac{2}{\rm \pi}\arctan(\mu_0)\right) + \frac{\mu_0^2-\mu_0^4}{(1+\mu_0^2)^2}\right], \end{gather}$$
(C4)$$\begin{gather}b_1 = \left( \frac{\mu^p}{\mu_0} \right)^2 \frac{\mu_0^2}{1+\mu_0^2}, \end{gather}$$
(C5)$$\begin{gather}b_2 = \frac{1}{2}\,\frac{\mu^p}{\mu_0}\left[\frac{\rm \pi}{2}\,\mu_0 \left(1-\frac{2}{\rm \pi}\arctan(\mu_0)\right) + \frac{\mu_0^2}{1+\mu_0^2}\right], \end{gather}$$
(C6)$$\begin{gather}\mu_0 = \frac{7}{2}\,\mu^p\,\frac{1+e}{1+e_t}, \end{gather}$$

where $e_t$ is the tangential restitution coefficient, set to zero in the present simulations.

Appendix D. Computation of the granular temperature dissipation by the drag force

The aim of this appendix is to compute the phase-averaged dissipation of granular temperature by the drag force. In the $J_{int}$ expression (2.30), replacing $f_{Di}$ by the drag force expression (2.9) and the drag coefficient $C_D$ by (2.11a,b), the phase-averaged dissipation or granular temperature by the drag force is computed as

(D1)\begin{align} J_{int} &= n\,\overline{\left\langle f_{Di}v_i^{p\prime}\right\rangle }^p = \dfrac{3}{4}\,\dfrac{\phi\rho^f(1-\phi)^{-\zeta}}{d}\,\overline{\left\langle C_D\,\|\boldsymbol{u}^f - \boldsymbol{v}^p\|\,(u_i^f - v_i^p)v_i^{p\prime}\right\rangle }^p\nonumber\\ &=\dfrac{3}{4}\,\dfrac{\phi\rho^f(1-\phi)^{-\zeta}}{d}\left[C_{D}^{\infty}\,\overline{\left\langle \|\boldsymbol{u}^f - \boldsymbol{v}^p\|\,(u_i^f - v_i^p)v_i^{p\prime}\right\rangle }^p + \dfrac{24.4\nu^f}{d}\,\overline{\left\langle (u_i^f - v_i^p)v_i^{p\prime}\right\rangle }^p\right]. \end{align}

The fluid and particle velocities can be decomposed into an averaged component and a fluctuating component. In the present configuration, the averaged velocities are non-zero only in the streamwise direction. In addition, as the models used in this paper do not consider any fluid velocity fluctuations, they are considered to be zero. The fluid and particles velocities can therefore be expressed as

(D2)$$\begin{gather} \boldsymbol{u}^f = \left(\overline{\bigl\langle u_x^f\bigr\rangle }^f, 0, 0\right), \end{gather}$$
(D3)$$\begin{gather}\boldsymbol{v}^p = \left(\overline{\bigl\langle v_x^p\bigr\rangle }^p + v_x^{p\prime}, v_y^{p\prime}, v_z^{p\prime}\right). \end{gather}$$

Let us consider the second term in the brackets of (D1). Replacing for the decomposition of velocities (D2) and (D3), it can be expressed as

(D4)\begin{equation} (u_i^f - v_i^p)v_i^{p\prime} = \left(\overline{\bigl\langle u_x^f\bigr\rangle }^f - \overline{\bigl\langle v_x^p\bigr\rangle }^p\right)v_x^{p\prime} - v_i^{p\prime}v_i^{p\prime}, \end{equation}

and applying the Favre average over the solid phase, the first term vanishes and the second is three times the granular temperature:

(D5)\begin{equation} \overline{\left\langle (u_i^f - v_i^p)v_i^{p\prime}\right\rangle }^p ={-}3T. \end{equation}

Let us consider now the first term in the brackets of (D1). The norm of the relative velocity can be expressed as

(D6)\begin{equation} \|\boldsymbol{u}^f - \boldsymbol{v}^p\| = \left\|\overline{\left\langle \boldsymbol{u}^f\right\rangle }^f - \overline{\bigl\langle \boldsymbol{v}^p\bigr\rangle }^p\right\|\sqrt{1 - 2\,\dfrac{v_x^{p\prime}}{\overline{\bigl\langle u_x^f\bigr\rangle }^f - \overline{\bigl\langle v_x^p\bigr\rangle }^p} + \dfrac{v_i^{p\prime}v_i^{p\prime}}{\left(\overline{\bigl\langle u_x^f\bigr\rangle }^f - \overline{\bigl\langle v_x^p\bigr\rangle }^p\right)^2}}, \end{equation}

and performing a Taylor expansion at first order in fluctuating velocity, it becomes

(D7)\begin{equation} \|\boldsymbol{u}^f - \boldsymbol{v}^p\| = \left\|\overline{\bigl\langle \boldsymbol{u}^f\bigr\rangle }^f - \overline{\bigl\langle \boldsymbol{v}^p\bigr\rangle }^p\right\|\left(1 - \dfrac{v_x^{p\prime}}{\overline{\bigl\langle u_x^f\bigr\rangle }^f - \overline{\bigl\langle v_x^p\bigr\rangle }^p}\right) + o(v^{p\prime2}). \end{equation}

Multiplying by (D4) yields

(D8)\begin{align} &\|\boldsymbol{u}^f - \boldsymbol{v}^p\|(u_i^f - v_i^p)v_i^{p\prime} = \left\|\overline{\bigl\langle \boldsymbol{u}^f\bigr\rangle }^f - \overline{\bigl\langle \boldsymbol{v}^p\bigr\rangle }^p\right\| \nonumber\\ &\quad \times \left[\left(\overline{\bigl\langle u_x^f\bigr\rangle }^f - \overline{\bigl\langle v_x^p\bigr\rangle }^p\right)v_x^{p\prime} - v_x^{p\prime}v_x^{p\prime} - v_i^{p\prime}v_i^{p\prime} + \dfrac{v_i^{p\prime}v_i^{p\prime}v_x^{p\prime}}{\overline{\bigl\langle u_x^f\bigr\rangle }^f - \overline{\left\langle v_x^p\right\rangle }^p}\right]+ o(v^{p\prime3}). \end{align}

The last term is a third-order term and can therefore be neglected. Applying the Favre average over the solid phase, the first term in the brackets vanishes, and we have

(D9)\begin{equation} \overline{\left\langle \|\boldsymbol{u}^f - \boldsymbol{v}^p\|\,(u_i^f - v_i^p)v_i^{p\prime}\right\rangle }^p = \left\|\overline{\bigl\langle \boldsymbol{u}^f\bigr\rangle }^f - \overline{\bigl\langle \boldsymbol{v}^p\bigr\rangle }^p\right\|\left( -\overline{\bigl\langle v_x^{p\prime}v_x^{p\prime}\bigr\rangle }^p -3T \right). \end{equation}

Replacing (D5) and (D9) in the drag term (D1), it is expressed as

(D10)\begin{align} J_{int} &= \dfrac{3}{4}\,\dfrac{\phi\rho^f\!(1-\phi\!)^{-\zeta}}{d} \left\|\overline{\bigl\langle \boldsymbol{u}^f\bigr\rangle }^p - \overline{\bigl\langle \boldsymbol{v}^p\bigr\rangle }^p\right\| \left[\! - C_{D}^{\infty}\,\overline{\bigl\langle v_x^{p\prime}v_x^{p\prime}\bigr\rangle }^p - C_{D}^{\infty}3T - \dfrac{24.4\nu^f}{d\left\|\bigl\langle \boldsymbol{u}^f\bigr\rangle ^p - \bigl\langle \boldsymbol{v}^p\bigr\rangle ^p\right\|}\,3T \!\right] \nonumber\\ &= \dfrac{3}{4}\,\dfrac{\phi\rho^f(1-\phi)^{-\zeta}}{d} \left\|\overline{\bigl\langle \boldsymbol{u}^f\bigr\rangle }^p - \overline{\bigl\langle \boldsymbol{v}^p\bigr\rangle }^p\right\|C_{D} \left(- \dfrac{C_{D}^{\infty}}{C_D}\,\overline{\bigl\langle v_x^{p\prime}v_x^{p\prime}\bigr\rangle }^p - 3T \right), \end{align}

where $C_D$ is the drag coefficient computed with phase-averaged velocities.

Figure 17. Streamwise fluctuating kinetic energy as a function of the granular temperature computed in the DEM simulations for different Shields numbers (simulations 1–5). Dashed line is $2T$.

In the bedload configuration, velocity fluctuations are not isotropic, and as shown in figure 17, the streamwise fluctuating energy can be estimated as approximately $\overline {\bigl \langle v_x^{p\prime }v_x^{p\prime }\bigr \rangle }^p \sim 2T$. Finally, the drag interaction term becomes

(D11)\begin{equation} J_{int} ={-}\phi(1-\phi)K\left(3 + 2\,\dfrac{C_{D}^{\infty}}{C_{D}}\right)T. \end{equation}

The drag coefficient $K$ is expressed using the Favre-averaged velocities, and the term $2({C_{D}^{\infty }}/{C_{D}})$ represents a correction to account for the quadratic nature of the drag force.

References

Ancey, C. 2020 Bedload transport: a walk between randomness and determinism. Part 1. The state of the art. J.Hydraul. Res. 58 (1), 117.CrossRefGoogle Scholar
Antony, S.J. & Kruyt, N.P. 2009 Role of interparticle friction and particle-scale elasticity in the shear-strength mechanism of three-dimensional granular media. Phys. Rev. E 79 (3), 031308.CrossRefGoogle ScholarPubMed
Babic, M. 1997 Average balance equations for granular materials. Intl J. Engng Sci. 35 (5), 523548.CrossRefGoogle Scholar
Berzi, D. 2014 Extended kinetic theory applied to dense, granular, simple shear flows. Acta Mechanica 225 (8), 21912198.CrossRefGoogle Scholar
Berzi, D. & Fraccarollo, L. 2013 Inclined, collisional sediment transport. Phys. Fluids 25 (10), 106601.CrossRefGoogle Scholar
Berzi, D. & Fraccarollo, L. 2015 Turbulence locality and granularlike fluid shear viscosity in collisional suspensions. Phys. Rev. Lett. 115 (19), 194501.CrossRefGoogle ScholarPubMed
Berzi, D. & Jenkins, J.T. 2011 Surface flows of inelastic spheres. Phys. Fluids 23 (1), 013303.CrossRefGoogle Scholar
Berzi, D. & Jenkins, J.T. 2015 Steady shearing flows of deformable, inelastic spheres. Soft Matt. 11 (24), 47994808.CrossRefGoogle ScholarPubMed
Berzi, D., Jenkins, J.T. & Richard, P. 2020 Extended kinetic theory for granular flow over and within an inclined erodible bed. J.Fluid Mech. 885, A27.CrossRefGoogle Scholar
Berzi, D. & Vescovi, D. 2015 Different singularities in the functions of extended kinetic theory at the origin of the yield stress in granular flows. Phys. Fluids 27 (1), 013302.CrossRefGoogle Scholar
Bonamy, C., et al. 2023 SedFoam/sedfoam: release 2212. Zenodo. Available at: https://doi.org/10.5281/zenodo.7944048.CrossRefGoogle Scholar
Bouzid, M., Trulsson, M., Claudin, P., Clément, E. & Andreotti, B. 2013 Nonlocal rheology of granular flows across yield conditions. Phys. Rev. Lett. 111 (23), 238301.CrossRefGoogle ScholarPubMed
Carnahan, N.F. & Starling, K.E. 1969 Equation of state for nonattracting rigid spheres. J.Chem. Phys. 51 (2), 635636.CrossRefGoogle Scholar
Chapman, S. & Cowling, T.G. 1970 The Mathematical Theory of Non-uniform Gases. Cambrige University Press.Google Scholar
Chassagne, R., Frey, P., Maurin, R. & Chauchat, J. 2020 a Mobility of bidisperse mixtures during bedload transport. Phys. Rev. Fluids 5 (11), 114307.CrossRefGoogle Scholar
Chassagne, R., Maurin, R., Chauchat, J., Gray, J.M.N.T. & Frey, P. 2020 b Discrete and continuum modelling of grain size segregation during bedload transport. J.Fluid Mech. 895, A30.CrossRefGoogle Scholar
Chauchat, J. 2018 A comprehensive two-phase flow model for unidirectional sheet-flows. J.Hydraul. Res. 56 (1), 1528.CrossRefGoogle Scholar
Chauchat, J., Cheng, Z., Nagel, T., Bonamy, C. & Hsu, T.-J. 2017 SedFoam-2.0: a 3-D two-phase flow numerical model for sediment transport. Geosci. Model Develop. 10 (12), 43674392.CrossRefGoogle Scholar
Chen, C.P. & Wood, P.E. 1985 A turbulence closure model for dilute gas–particle flows. Can. J. Chem. Engng 63 (3), 349360.CrossRefGoogle Scholar
Cheng, Z., Chauchat, J., Hsu, T.-J. & Calantoni, J. 2018 Eddy interaction model for turbulent suspension in Reynolds-averaged Euler–Lagrange simulations of steady sheet flow. Adv. Water Resour. 111, 435451.CrossRefGoogle Scholar
Chialvo, S., Sun, J. & Sundaresan, S. 2012 Bridging the rheology of granular flows in three regimes. Phys. Rev. E 85 (2), 021305.CrossRefGoogle ScholarPubMed
Chialvo, S. & Sundaresan, S. 2013 A modified kinetic theory for frictional granular flows in dense and dilute regimes. Phys. Fluids 25 (7), 070603.CrossRefGoogle Scholar
da Cruz, F., Emam, S., Prochnow, M., Roux, J.-N. & Chevoir, F. 2005 Rheophysics of dense granular materials: discrete simulation of plane shear flows. Phys. Rev. E 72 (2), 021309.CrossRefGoogle ScholarPubMed
Dai, B.B., Yang, J. & Zhou, C.Y. 2016 Observed effects of interparticle friction and particle size on shear behavior of granular materials. Intl J. Geomech. 16 (1), 04015011.CrossRefGoogle Scholar
Dalla Valle, J.M. 1943 Micromeritics: The Technology of Fine Particles. Pitman.Google Scholar
Danon, H., Wolfshtein, M. & Hetsroni, G. 1977 Numerical calculations of two-phase turbulent round jet. Intl J. Multiphase Flow 3 (3), 223234.CrossRefGoogle Scholar
Ding, J. & Gidaspow, D. 1990 A bubbling fluidization model using kinetic theory of granular flow. AIChE J. 36 (4), 523538.CrossRefGoogle Scholar
Dong, P. & Zhang, K. 1999 Two-phase flow modelling of sediment motions in oscillatory sheet flow. Coast. Engng 36 (2), 87109.CrossRefGoogle Scholar
Einstein, H.A 1937 Der Geschiebetrieb als Wahrscheinlichkeitsproblem (Bedload transport as a probability problem). ETHZ.Google Scholar
Finn, J.R. & Li, M. 2016 Regimes of sediment–turbulence interaction and guidelines for simulating the multiphase bottom boundary layer. Intl J. Multiphase Flow 85, 278283.CrossRefGoogle Scholar
Forterre, Y. & Pouliquen, O. 2008 Flows of dense granular media. Annu. Rev. Fluid Mech. 40 (1), 124.CrossRefGoogle Scholar
Fox, R.O. 2014 On multiphase turbulence models for collisional fluid–particle flows. J.Fluid Mech. 742, 368424.CrossRefGoogle Scholar
Frey, P. 2014 Particle velocity and concentration profiles in bedload experiments on a steep slope. Earth Surf. Process. Landf. 39 (5), 646655.CrossRefGoogle Scholar
Garzó, V. & Dufty, J.W. 1999 Dense fluid transport for inelastic hard spheres. Phys. Rev. E 59 (5 Pt B), 58955911.CrossRefGoogle ScholarPubMed
Garzó, V., Tenneti, S., Subramaniam, S. & Hrenya, C.M. 2012 Enskog kinetic theory for monodisperse gas–solid flows. J.Fluid Mech. 712, 129168.CrossRefGoogle Scholar
GDR MiDi 2004 On dense granular flows. Eur. Phys. J. E 14 (4), 341365.CrossRefGoogle Scholar
Goldhirsch, I. 2010 Stress, stress asymmetry and couple stress: from discrete particles to continuous fields. Granul. Matt. 12 (3), 239252.CrossRefGoogle Scholar
Gondret, P., Lance, M. & Petit, L. 2002 Bouncing motion of spherical particles in fluids. Phys. Fluids 14 (2), 643652.CrossRefGoogle Scholar
González, R.G. & Garzó, V. 2019 Transport coefficients for granular suspensions at moderate densities. J.Stat. Mech. 2019 (9), 093204.CrossRefGoogle Scholar
Gonzalez-Ondina, J.M., Fraccarollo, L. & Liu, P.L.-F. 2018 Two-level, two-phase model for intense, turbulent sediment transport. J.Fluid Mech. 839, 198238.CrossRefGoogle Scholar
Houssais, M., Ortiz, C.P., Durian, D.J. & Jerolmack, D.J. 2015 Onset of sediment transport is a continuous transition driven by fluid shear and granular creep. Nat. Commun. 6, 6527.CrossRefGoogle ScholarPubMed
Hsu, T.-J., Jenkins, J.T. & Liu, P.L.-F. 2004 On two-phase sediment transport: sheet flow of massive particles. Proc. R. Soc. Lond. A 460 (2048), 22232250.CrossRefGoogle Scholar
Hsu, T.-J. & Liu, P.L.-F. 2004 Toward modeling turbulent suspension of sand in the nearshore. J.Geophys. Res.: Oceans 109, C06018.CrossRefGoogle Scholar
Jackson, R. 1997 Locally averaged equations of motion for a mixture of identical spherical particles and a Newtonian fluid. Chem. Engng Sci. 52 (15), 24572469.CrossRefGoogle Scholar
Jackson, R. 2000 The Dynamics of Fluidized Particles. Cambridge University Press.Google Scholar
Jenkins, J.T. 2006 Dense shearing flows of inelastic disks. Phys. Fluids 18 (10), 103307.CrossRefGoogle Scholar
Jenkins, J.T. 2007 Dense inclined flows of inelastic spheres. Granul. Matt. 10 (1), 4752.CrossRefGoogle Scholar
Jenkins, J.T., Cantat, I. & Valance, A. 2010 Continuum model for steady, fully developed saltation above a horizontal particle bed. Phys. Rev. E 82 (2), 020301.CrossRefGoogle ScholarPubMed
Jenkins, J.T. & Hanes, D.M. 1998 Collisional sheet flows of sediment driven by a turbulent fluid. J.Fluid Mech. 370, 2952.CrossRefGoogle Scholar
Jenkins, J.T. & La Ragione, L. 2002 Micromechanical modeling of granular materials. In Modeling and Mechanics of Granular and Porous Materials (ed. G. Capriz, V.N. Ghionna & P. Giovine), pp. 45–61. Birkhäuser.CrossRefGoogle Scholar
Jenkins, J.T. & Savage, S.B. 1983 A theory for the rapid flow of identical, smooth, nearly elastic, spherical particles. J.Fluid Mech. 130, 187202.CrossRefGoogle Scholar
Jenkins, J.T. & Valance, A. 2018 Two-phase continuum theory for windblown sand. Phys. Rev. Fluids 3 (3), 034305.CrossRefGoogle Scholar
Jenkins, J.T. & Zhang, C. 2002 Kinetic theory for identical, frictional, nearly elastic spheres. Phys. Fluids 14 (3), 12281235.CrossRefGoogle Scholar
Johnson, P.C. & Jackson, R. 1987 Frictional–collisional constitutive relations for granular materials, with application to plane shearing. J.Fluid Mech. 176, 6793.CrossRefGoogle Scholar
Kamrin, K. & Henann, D.L. 2014 Nonlocal modeling of granular flows down inclines. Soft Matt. 11 (1), 179185.CrossRefGoogle Scholar
Kruyt, N.P. & Rothenburg, L. 2006 Shear strength, dilatancy, energy and dissipation in quasi-static deformation of granular materials. J.Stat. Mech. 2006 (07), P07021.CrossRefGoogle Scholar
Kumaran, V. 2006 The constitutive relation for the granular flow of rough particles, and its application to the flow down an inclined plane. J.Fluid Mech. 561, 142.CrossRefGoogle Scholar
Lee, C.-H., Low, Y.M. & Chiew, Y.-M. 2016 Multi-dimensional rheology-based two-phase model for sediment transport and applications to sheet flow and pipeline scour. Phys. Fluids 28 (5), 053305.CrossRefGoogle Scholar
Li, L. & Sawamoto, M. 1995 Multi-phase model on sediment transport in sheet-flow regime under oscillatory flow. Coast. Engng Japan 38 (2), 157178.CrossRefGoogle Scholar
Lun, C.K.K. & Savage, S.B. 1986 The effects of an impact velocity dependent coefficient of restitution on stresses developed by sheared granular materials. Acta Mechanica 63 (1), 1544.CrossRefGoogle Scholar
Lun, C.K.K., Savage, S.B., Jeffrey, D.J. & Chepurniy, N. 1984 Kinetic theories for granular flow: inelastic particles in Couette flow and slightly inelastic particles in a general flowfield. J.Fluid Mech. 140, 223256.CrossRefGoogle Scholar
Ma, D. & Ahmadi, G. 1986 An equation of state for dense rigid sphere gases. J.Chem. Phys. 84 (6), 34493450.CrossRefGoogle Scholar
Maeda, K., Hirabayashi, H. & Ohmura, A. 2006 Micromechanical influence of grain properties on deformation – failure behaviours of granular media by DEM. In Geomechanics and Geotechnics of Particulate Media. CRC.Google Scholar
Mathieu, A., Chauchat, J., Bonamy, C., Balarac, G. & Hsu, T.-J. 2021 A finite-size correction model for two-fluid large-eddy simulation of particle-laden boundary layer flow. J.Fluid Mech. 913, A26.CrossRefGoogle Scholar
Maurin, R. 2015 Investigation of granular behavior in bedload transport using a Eulerian–Lagragian model. PhD thesis, Université Grenoble Alpes.Google Scholar
Maurin, R., Chauchat, J., Chareyre, B. & Frey, P. 2015 A minimal coupled fluid–discrete element model for bedload transport. Phys. Fluids 27 (11), 113302.CrossRefGoogle Scholar
Maurin, R., Chauchat, J. & Frey, P. 2016 Dense granular flow rheology in turbulent bedload transport. J.Fluid Mech. 804, 490512.CrossRefGoogle Scholar
Ni, W.-J. & Capart, H. 2018 Stresses and drag in turbulent bed load from refractive index-matched experiments. Geophys. Res. Lett. 45 (14), 70007009.CrossRefGoogle Scholar
Oger, L., Savage, S.B., Corriveau, D. & Sayed, M. 1998 Yield and deformation of an assembly of disks subjected to a deviatoric stress loading. Mech. Mater. 27 (4), 189210.CrossRefGoogle Scholar
Pähtz, T., Durán, O., Ho, T.-D., Valance, A. & Kok, J.F. 2015 The fluctuation energy balance in non-suspended fluid-mediated particle transport. Phys. Fluids 27 (1), 013303.CrossRefGoogle Scholar
Pasini, J.M. & Jenkins, J.T. 2005 Aeolian transport with collisional suspension. Phil. Trans. R. Soc. Lond. A 363 (1832), 16251646.Google ScholarPubMed
Peña, A.A., Lizcano, A., Alonso-Marroquin, F. & Herrmann, H.J. 2008 Biaxial test simulations using a packing of polygonal particles. Intl J. Numer. Anal. Meth. Geomech. 32 (2), 143160.CrossRefGoogle Scholar
Pouliquen, O., Cassar, C., Jop, P., Forterre, Y. & Nicolas, M. 2006 Flow of dense granular material: towards simple constitutive laws. J.Stat. Mech. 2006 (07), P07020.CrossRefGoogle Scholar
Prandtl, L. 1926 Bericht über neuere Turbulenzforschung. Hydraulische Probleme. Vorträge Hydrauliktagung Göttingen 5, 113.Google Scholar
Rao, K.K. & Nott, P.R. 2008 An Introduction to Granular Flow. Cambridge University Press.CrossRefGoogle Scholar
Revil-Baudard, T. & Chauchat, J. 2013 A two-phase model for sheet flow regime based on dense granular flow rheology. J.Geophys. Res.: Oceans 118 (2), 619634.CrossRefGoogle Scholar
Rouse, H. 1937 Modern conceptions of the mechanics of fluid turbulence. Trans. Am. Soc. Civil Engrs 102 (1), 463505.CrossRefGoogle Scholar
Rousseau, H., Chassagne, R., Chauchat, J., Maurin, R. & Frey, P. 2021 Bridging the gap between particle-scale forces and continuum modelling of size segregation: application to bedload transport. J.Fluid Mech. 916, A26.CrossRefGoogle Scholar
Roux, J.N. & Combe, G. 2002 Quasistatic rheology and the origins of strain. C. R. Phys. 3 (2), 131140.CrossRefGoogle Scholar
Sangani, A.S., Mo, G., Tsao, H.-K. & Koch, D.L. 1996 Simple shear flows of dense gas–solid suspensions at finite Stokes numbers. J.Fluid Mech. 313, 309341.CrossRefGoogle Scholar
Savage, S.B. & Jeffrey, D.J. 1981 The stress tensor in a granular flow at high shear rates. J.Fluid Mech. 110, 255272.CrossRefGoogle Scholar
Schwager, T. & Poschel, T. 2007 Coefficient of restitution and linear-dashpot model revisited. Granul. Matt. 9 (6), 465469.CrossRefGoogle Scholar
Smilauer, V., et al. 2015 Yade Documentation 2nd Ed. The Yade Project. Zenodo.Google Scholar
Suiker, A.S.J. & Fleck, N.A. 2004 Frictional collapse of granular assemblies. J.Appl. Mech. 71 (3), 350358.CrossRefGoogle Scholar
Thornton, C. 2000 Numerical simulations of deviatoric shear deformation of granular media. Géotechnique 50 (1), 4353.CrossRefGoogle Scholar
Torquato, S. 1995 Nearest-neighbor statistics for packings of hard spheres and disks. Phys. Rev. E 51 (4), 31703182.CrossRefGoogle ScholarPubMed
Tsao, H.-K. & Koch, D.L. 1995 Simple shear flows of dilute gas–solid suspensions. J.Fluid Mech. 296, 211245.CrossRefGoogle Scholar
Vescovi, D., Berzi, D., Richard, P. & Brodu, N. 2014 Plane shear flows of frictionless spheres: kinetic theory and 3D soft-sphere discrete element method simulations. Phys. Fluids 26 (5), 053305.CrossRefGoogle Scholar
Yang, F.-L. & Hunt, M.L. 2006 Dynamics of particle–particle collisions in a viscous liquid. Phys. Fluids 18 (12), 121506.CrossRefGoogle Scholar
Yang, Z.X., Yang, J. & Wang, L.Z. 2012 On the influence of inter-particle friction and dilatancy in granular materials: a numerical analysis. Granul. Matt. 14 (3), 433447.CrossRefGoogle Scholar
Zhang, Q., Deal, E., Perron, J.T., Venditti, J., Benavides, S.J., Rushlow, M. & Kamrin, K. 2022 Fluid-driven transport of round sediment particles: from discrete simulations to continuum modeling. J.Geophys. Res.: Earth 127 (7), e2021JF006504.Google Scholar
Figure 0

Table 1. Expression of the coefficients in the constitutive relations of the kinetic theory given by the Garzó & Dufty (1999) model (left column) and the proposed model (right column).

Figure 1

Figure 1. Numerical set-up of the DEM simulations: $N$ layers of particles are deposited by gravity above a rough bed made of fixed particles. The fluid free surface is set to $H_f = Nd+h_w$.

Figure 2

Table 2. Physical parameters for each configuration: Shields number, particle to fluid density ratio, particle diameter, interparticle friction coefficient, restitution coefficient, fluid depth, free surface position, Stokes number and suspension number.

Figure 3

Figure 2. Fluid–DEM simulation results for the reference case $\theta = 0.6$, $\rho ^p/\rho ^f=2.5$, $d=6$ mm, $\mu ^p=0.4$ and $e=0.7$: (a) volume fraction profile, (b) dimensionless particle and fluid velocity profiles, and (c) granular temperature balance, in ${\rm Pa}\ {\rm s}^{-1}$.

Figure 4

Figure 3. Comparison between DEM (symbols) and two-phase flow results with initial model (solid lines) for different Shields numbers (simulation Ids 1–5): (a) volume fraction profiles, (b) dimensionless particle velocity and transport (inset) profiles, and (c) dimensionless granular temperature.

Figure 5

Figure 4. (a) Radial distribution function computed in the DEM simulations (symbols, simulation Ids 1 and 9–14) and with (3.2) (solid lines) for different values of interparticle friction. (b) Impact of interparticle friction on coefficient $a(\mu ^p)$ of (3.2) measured in the DEM simulations (black crosses) and proposed empirical fit (3.3) (solid line).

Figure 6

Figure 5. Dimensionless contact dissipation of granular temperature computed in the DEM simulations (symbols, simulation Ids 1 and 9–14) and predicted by the KT theory taking into account the effect of interparticle friction (solid lines). (a) Semi-log scale. (b) Linear scale; in the inset, solid lines correspond to the predicted dimensionless dissipation when the effect of interparticle friction is taken into account only in the radial distribution function.

Figure 7

Figure 6. (a) Dimensionless viscosity and (b) granular temperature flux coefficient computed in the DEM simulations for different particle to fluid density ratios $r$ (symbols, simulation Ids 1 and 6–8), and predicted by the classical KT theory (dashed black line) and with (3.7) and (3.10) for $r=2.5$ (solid black line).

Figure 8

Figure 7. Dimensionless granular temperature dissipation by the drag force computed in the DEM simulations (symbols, simulation Ids 1 and 9–14) compared with (2.25) (dashed black line) and with corrected model (3.13) (solid black line).

Figure 9

Figure 8. Comparison between DEM (symbols) and two-phase flow results with corrected model (solid lines) for: (ac) varying Shields numbers, simulation Ids 1–5; (df) varying particle to fluid density ratios $r$, simulation Ids 1 and 6–8; (gi) varying interparticle friction coefficients $\mu ^p$, simulation Ids 1 and 9–12; and ( jl) varying restitution coefficients $e$, simulation Ids 1 and 15–17. (a,d,g,j) Volume fraction profiles; (b,e,h,k) dimensionless particle velocity and transport (inset) profiles; and (cf,i,l) dimensionless granular temperature.

Figure 10

Figure 9. (a) Error between solid transport rate in the discrete simulations and predicted by the initial model (empty circles) and by the corrected model (solid squares) for varying Shields numbers (simulation Ids 1–5).(b) Comparison of the fluid velocity profiles between DEM (symbols) and two-phase flow results with corrected model (solid lines) for varying Shields numbers (simulation Ids 1–5).

Figure 11

Figure 10. Dimensionless rate of dissipation of granular temperature at contact for different restitution coefficients computed in the DEM simulations (simulation Ids 1 and 15–17) and predicted by the modified KT to account for interparticle friction ($\mu ^p = 0.4$).

Figure 12

Figure 11. Plots of (a) $\mu (I)$ and (b) $\phi (I)$ computed in the DEM (symbols) and compared with: the rheological law proposed by Maurin et al. (2016) ((1.1) and (1.2)) for bedload transport (dot-dashed lines); two-phase flow simulation with the initial model before any correction (configuration 1, dashed lines); and two-phase flow simulations with the corrected model for different Shields numbers (simulation Ids 1 and 3–5, solid lines).

Figure 13

Figure 12. Plots of (a) $\mu (I)$ and (b) $\phi (I)$ computed in the DEM (symbols) and compared with two-phase flow simulations with the corrected model for different interparticle friction coefficient (simulation Ids 1 and 9–12, solid lines).

Figure 14

Figure 13. Evaluation of the two-phase model with the Ni & Capart (2018) turbulent bedload transport experiments at four Shields numbers: (a) volume fraction, (b) dimensionless particle velocity, (c) dimensionless fluid velocity, and (d) dimensionless granular temperature.

Figure 15

Figure 14. Comparison of the initial (dashed line) and proposed (solid line) models with the experimental case $\theta =0.39$ (symbols): (a) volume fraction, (b) dimensionless particle velocity, and (c) dimensionless granular temperature.

Figure 16

Figure 15. Static friction coefficient as a function of interparticle friction.

Figure 17

Figure 16. Variation of $f(\mu ^p)$ as a function of $\mu ^p$.

Figure 18

Figure 17. Streamwise fluctuating kinetic energy as a function of the granular temperature computed in the DEM simulations for different Shields numbers (simulations 1–5). Dashed line is $2T$.