Hostname: page-component-586b7cd67f-tf8b9 Total loading time: 0 Render date: 2024-11-24T10:55:42.094Z Has data issue: false hasContentIssue false

Drag of a shear-thickening suspension on a rotating cylinder

Published online by Cambridge University Press:  04 September 2023
Francisco M. Rocha
Affiliation:
Aix Marseille University, CNRS, IUSTI, 13453 Marseille, France
Yoël Forterre
Affiliation:
Aix Marseille University, CNRS, IUSTI, 13453 Marseille, France
Bloen Metzger
Affiliation:
Aix Marseille University, CNRS, IUSTI, 13453 Marseille, France
Henri Lhuissier*
Affiliation:
Aix Marseille University, CNRS, IUSTI, 13453 Marseille, France
*
Email address for correspondence: [email protected]

Abstract

We investigate experimentally the two-dimensional flow of a shear-thickening suspension around a rotating cylinder to which a constant torque is applied. While for low torques both the drag and the flow are steady and close to those for a Newtonian fluid, above the onset torque for discontinuous shear thickening the average velocity of the cylinder saturates and large periodic oscillations of the cylinder velocity are observed. The oscillations result from a hydrodynamic instability of the flow: slow-acceleration phases are followed by high-deceleration phases, triggered by the propagation of a thickening front, and so on. The slow-acceleration phases set the oscillation period, which is limited by the cylinder inertia and inversely proportional to the applied torque. Combined analyses of the cylinder motion and the flow reveal that the front typically nucleates when the shear rate at the cylinder surface reaches the discontinuous shear-thickening threshold. In addition, the characteristics (duration, stress) of the deceleration are set by the interplay between the thickening front propagation and the suspension and cylinder inertiae or the container size. Since for a slow acceleration the shear rate at the cylinder surface is essentially the cylinder angular velocity, this description of the unsteadiness elucidates the saturation of the average velocity. More generally, it illustrates how the hydrodynamics of a shear-thickening suspension with a strongly re-entrant rheology can lead to a marginally re-entrant, although steep, drag curve.

Type
JFM Papers
Copyright
© The Author(s), 2023. Published by Cambridge University Press

1. Introduction

Dense suspensions of microscopic particles are often steeply shear-thickening media. This peculiar rheology has been interpreted fruitfully as a frictional transition driven by the stress level between the particles (Seto et al. Reference Seto, Mari, Morris and Denn2013; Mari et al. Reference Mari, Seto, Morris and Denn2014; Wyart & Cates Reference Wyart and Cates2014) and has received important numerical and experimental confirmations (Guy, Hermes & Poon Reference Guy, Hermes and Poon2015; Lin et al. Reference Lin, Guy, Hermes, Ness, Sun, Poon and Cohen2015; Clavaud et al. Reference Clavaud, Bérut, Metzger and Forterre2017; Comtet et al. Reference Comtet, Chatté, Niguès, Bocquet, Siria and Colin2017; Dong & Trulsson Reference Dong and Trulsson2017; Singh et al. Reference Singh, Mari, Denn and Morris2018; Clavaud, Metzger & Forterre Reference Clavaud, Metzger and Forterre2020). On the other hand, much less is known about simple hydrodynamics questions such as the unsteady structures of the flow, the spatial and temporal fluctuations of the stresses, the role of the suspension inertia or the mechanism which selects the effective drag in the regime when the suspension shear thickens. Progress on these questions would be helpful, practically, for optimizing the transport and flowability of shear-thickening suspensions (LaFarge 2013; Abdesselam et al. Reference Abdesselam, Agassant, Castellani, Valette, Demay, Gourdin and Peres2017; Blanco et al. Reference Blanco, Hodgson, Hermes, Besseling, Hunter, Chaikin, Cates, Van Damme and Poon2019). They might also be useful to appreciate and push the limits of rheological characterizations.

Important results have already been obtained for the flow around a solid displaced with a constant force. Eighty years ago, Freundlich & Röder (Reference Freundlich and Röder1938) reported that the average velocity of a sphere displaced in a shear-thickening suspension inside a narrow tube becomes independent of the applied force for high loads, while the instantaneous velocity is not steady but oscillates around the average value. Later, the oscillations were modelled based on a heuristic drag law (von Kann, Snoeijer & van der Meer Reference von Kann, Snoeijer and van der Meer2013) but the reality of this drag law and how it actually emerges from the unsteady flow past the sphere still need to be clarified. Recently, numerous studies on small-gap rheological configurations have reported similar saturations of the average velocity of the tool, as well as oscillations under a constant applied torque (Boersma et al. Reference Boersma, Baets, Lavèn and Stein1991; Lootens, Van Damme & Hébraud Reference Lootens, Van Damme and Hébraud2003; Nagahiro, Nakanishi & Mitarai Reference Nagahiro, Nakanishi and Mitarai2013; Hermes et al. Reference Hermes, Guy, Poon, Poy, Cates and Wyart2016; Rathee, Blair & Urbach Reference Rathee, Blair and Urbach2017; Chacko et al. Reference Chacko, Mari, Cates and Fielding2018; Saint-Michel, Gibaud & Manneville Reference Saint-Michel, Gibaud and Manneville2018; Richards et al. Reference Richards, Royer, Liebchen, Guy and Poon2019; Ovarlez et al. Reference Ovarlez, Le, Smit, Fall, Mari, Chatté and Colin2020; Sedes, Singh & Morris Reference Sedes, Singh and Morris2020; Gauthier et al. Reference Gauthier, Pruvost, Gamache and Colin2021). Such oscillations have been modelled, first, by Nakanishi & Mitarai (Reference Nakanishi and Mitarai2011) and Nakanishi, Nagahiro & Mitarai (Reference Nakanishi, Nagahiro and Mitarai2012), who have introduced two key elements: a shear-thickening steady-state rheology with a negatively sloped portion ($\partial \sigma /\partial \dot {\gamma }<0$, with $\sigma$ and $\dot {\gamma }$ the shear stress and shear rate, respectively) and a delayed relaxation to the equilibrium state (involving an intrinsic strain scale, $\gamma _0$). Combined with the inertia of the flow, the shear weakening ($\partial \sigma /\partial \dot {\gamma }<0$) is destabilizing, while the delay regularizes the instability at small wavelengths (short time scales). Later, Richards et al. (Reference Richards, Royer, Liebchen, Guy and Poon2019) added the inertia of the tool to the modelling. However, their model treats the suspension as uniform and spaceless, which does not capture the heterogeneous structures of the flow observed in experiments (Rathee et al. Reference Rathee, Blair and Urbach2017; Ovarlez et al. Reference Ovarlez, Le, Smit, Fall, Mari, Chatté and Colin2020; Gauthier et al. Reference Gauthier, Pruvost, Gamache and Colin2021; Rathee et al. Reference Rathee, Miller, Blair and Urbach2022) and requires the introduction of a second relaxation scale (intrinsic time scale) to obtain the periodic oscillations reported experimentally. Last, additional heuristic modifications of the rheology have also been proposed to capture the saturation of the mean velocity of the tool (Baumgarten & Kamrin Reference Baumgarten and Kamrin2019), but these modifications are equivalent to changing the steady-state rheology and disregard the oscillatory nature of the mean velocity saturation.

Other important results have been obtained about the impulsive dynamics under an imposed displacement. Experiments of indentation into a bulk or floated layer of suspension (Waitukaitis & Jaeger Reference Waitukaitis and Jaeger2012; Waitukaitis et al. Reference Waitukaitis, Roth, Vitelli and Jaeger2013; Peters & Jaeger Reference Peters and Jaeger2014; Peters, Majumdar & Jaeger Reference Peters, Majumdar and Jaeger2016) have revealed that, for impulsive motion, the transport of shear inside the suspension is not diffusive anymore, but involves steep propagative thickening fronts, termed jamming or shear fronts. The latter have been rationalized as kinematic shocks stemming from the shear-weakening rheology and a relaxation strain scale ($\gamma _0$) (Han et al. Reference Han, Wyart, Peters and Jaeger2018). However, it remains to understand how these shocks nucleate and decay, the history of stress they impose on the flow, how their propagation interacts with the motion of the solid and how all these phenomena actually set the drag on the solid.

In this paper, we address those hydrodynamic questions through experiments on the flow of a floated layer of shear-thickening suspension (cornstarch) around a rotating cylinder to which a constant torque is applied. This configuration has several advantages. The flow in the suspension layer, floated above a non-miscible low-viscosity oil (Peters et al. Reference Peters, Majumdar and Jaeger2016), is essentially two-dimensional, which gives access to local and instantaneous measurements of the suspension flow and facilitates the evaluation of the stresses. Importantly, it is also a model configuration for the dynamics of a solid moved inside a fluid, with a simple but non-uniform base-state flow, from which the fundamental aspects of the solid motion and its interaction with the flow can be addressed.

The manuscript is organized as follows. Section 2 presents the experimental set-up. Section 3.1 introduces the overall behaviour in the different flow regimes. Sections 3.2 and 3.3 analyse the steady regime observed for low torques and each phase of the oscillatory regime observed for high torques, respectively. Section 3.4 comments on how the dynamics of the two regimes sets the curve of the effective drag of the suspension on the cylinder. Last, a discussion is given in § 4.

2. Experimental set-up

The experimental set-up is sketched in figure 1(a). It consists of a cylinder of radius $R = 14.05$ mm immersed in a layer of an aqueous suspension of cornstarch particles (Agrana Starch Maisita) contained in a cylindrical vessel with radius $R_{out} = 95.0$ mm. The cylinder is driven in rotation by a rheometer head (Anton Paar MCR 501), which applies a controlled torque $\varGamma$ to the cylinder and measures the current angular velocity $\varOmega (t)$ (the actual torque delivered by the rheometer remains constant to within less than 1 %). The suspension layer, of thickness $h$, is floated on a Perfluorotributylamine bath (3M, Fluorinert), which is a water-non-miscible, high density (1.86 g cm$^{-3}$) and low-viscosity (4 mPa s) liquid. This ensures a close to stress-free boundary condition at the bottom of the suspension layer and a quasi-two-dimensional experimental configuration (Peters et al. Reference Peters, Majumdar and Jaeger2016; Han et al. Reference Han, Wyart, Peters and Jaeger2018). To avoid slippage, the vertical surfaces of both the cylinder and the outer wall are roughened with sandpaper (3M, P100).

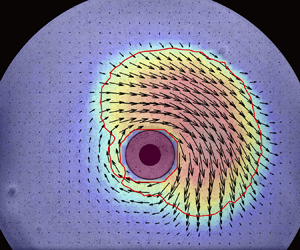
Figure 1. Experimental set-up. (a) Sketch of the set-up. (b) Typical view of the cylinder (red), tracer-seeded suspension layer (black and white background) and measured flow field (arrows).

The suspension layer is imaged from below, through the transparent bath, using an inclined mirror and a high-speed camera (Phantom v711) operating at 500 f.p.s. The flow is monitored by seeding the suspension/bath interface with black glass tracers (diameter of 40–70 $\mathrm {\mu }$m). The velocity field, $\boldsymbol {u} = u_r \boldsymbol {e}_{\boldsymbol {r}}+ u_\theta \boldsymbol {e}_{\boldsymbol {\theta }}$, is measured with conventional particle image velocimetry (PIV) methods. A typical image of the layer and of the measured flow field is shown in figure 1(b).

The suspension rheology is measured with a small-gap cylindrical Couette rheometer (figure 2). The suspension is pre-sheared with a constant shear rate of 0.1 s$^{-1}$ for 30 s, after which an increasing logarithmic sweep in torque is imposed and shear rates are obtained by averaging over sufficient durations to be independent of the sweep. The resultant data set is fitted with the Wyart–Cates flow rule, $\eta (\phi ) = \eta _S (\phi _J(\sigma ) - \phi )^{-2}$ and $\phi _J(\sigma ) = \phi _0 (1 - \mathrm {e}^{-\sigma ^\star /\sigma }) + \phi _1 \,\mathrm {e}^{-\sigma ^\star /\sigma }$, where $\eta _S$ is a numerical factor, $\phi _J$ denotes the suspension jamming volume fraction, $\phi _0$ and $\phi _1$ are the jamming volume fractions of the frictionless and the frictional viscosity branches, respectively, and $\sigma ^\star$ is the onset shear stress for frictional contact activation (Wyart & Cates Reference Wyart and Cates2014). We use the same fitting procedure as described in Darbois Texier et al. (Reference Darbois Texier, Lhuissier, Forterre and Metzger2020), which yields $\eta _S \simeq 0.60$ mPa s, $\phi _0 \simeq 0.480, \phi _1 \simeq 0.407$ and $\sigma ^\star \simeq 7.0$ Pa, i.e. $\phi _{DST} = \phi _0-2\,\mathrm {e}^{-1/2}(\phi _0-\phi _1)\simeq 0.390$ for the onset volume fraction of discontinuous shear thickening (figure 2). All experiments are performed at a fixed volume fraction $\phi =0.44>\phi _1$, for which the fitted suspension rheology is not only re-entrant ($\partial _\sigma \dot {\gamma }<0$) above the critical stress $\sigma _c\simeq 3.0$ Pa (defined by $\partial _\sigma \dot {\gamma }|_{\sigma _c}=0$) and critical shear rate $\dot {\gamma }_c \simeq 5.4\ {\rm s}^{-1}$, but is actually expected to jam above the shear stress $\sigma _J = \sigma ^*/\ln (({\phi _0 - \phi _1})/({\phi _0 - \phi })) \simeq 11.6$ Pa. The volume fraction is computed from the dry mass of starch assuming a fixed starch density of 1.55 g cm$^{-3}$. The suspension is thoroughly mixed between each run to homogenize the volume fraction and avoid bias due to sedimentation.

Figure 2. Rheology of the suspension. (a) Shear stress vs shear rate for different volume fractions, $\phi$. (b) Frictionless and frictional viscosity branches obtained from low and high shear-rate measurements, respectively. (a,b) Symbols stand for measurements with the small-gap cylindrical Couette device. Lines show the fitting Wyart–Cates law (see text).

It should be noted that, while measurements at the microscopic scale support the frictional transition scenario for cornstarch suspensions (Comtet et al. Reference Comtet, Chatté, Niguès, Bocquet, Siria and Colin2017), their rheology is more complex than the simple Wyart–Cates model, raising the possibility of a more complex scenario (Gauthier, Ovarlez & Colin Reference Gauthier, Ovarlez and Colin2023). In particular, the cornstarch rheology exhibits yield stress and aging, due to adhesion between the particles (Fall et al. Reference Fall, Huang, Bertrand, Ovarlez and Bonn2008, Reference Fall, Bertrand, Ovarlez and Bonn2012; Oyarte Galvez, van der Meer & Pons Reference Oyarte Galvez, van der Meer and Pons2017). A generalization of the Wyart–Cates model including adhesion has been proposed (Guy et al. Reference Guy, Hermes and Poon2015), but its application to cornstarch is still debated. In the present study, the main ingredients of the Wyart–Cates framework, i.e. a quasi-Newtonian low-stress branch followed by a jamming transition at high stress, will prove sufficient to describe observations.

3. Results

3.1. Overall behaviour of the cylinder dynamics

To obtain the typical dynamics of the cylinder for a broad range of applied torques, $\varGamma$, we consider, first, a protocol where $\varGamma$ is increased sufficiently slowly such that the cylinder motion and the flow both adjust to the current forcing at all times. Figure 3(a) shows the angular velocity of the cylinder, $\varOmega$, for torques ranging from $\approx 0.2\varGamma _c$ to over $90\varGamma _c$, where $\varGamma _c \equiv 2{\rm \pi} h R^2\sigma _c\simeq 56\ \mathrm {\mu }{\rm N}\ {\rm m}$ is the critical torque for which the average stress at the cylinder surface ($r=R$) is equal to the onset stress of discontinuous shear thickening $\sigma _c \simeq 3.0$ Pa, with $h=15$ mm. Below $\varGamma _c$, the velocity increases monotonically with increasing torque in a quasi-Newtonian fashion. By contrast, above $\varGamma _c$, the velocity is found to saturate, on average, at a value close to 4 rad s$^{-1}$, even though the torque is further increased by almost two orders of magnitude. Concomitantly, large-amplitude oscillations in $\varOmega$ are observed. The ramp is not extended to higher torques because large out-of-plane deformations of the suspension layer are observed there.

Figure 3. The two regimes of cylinder motion ($\phi = 0.44 > \phi _{DST}$). (a) Applied torque vs angular velocity of the cylinder for a slowly increasing ramp of applied torque ($h = 15$ mm). (b) Time evolution of the cylinder speed for constant torques applied at $t=0$ s ($\varGamma /\varGamma _c = 0.36$, 0.72, 1.07, 1.43 and 1.79, highlighted by dashed lines in (a)). See also supplementary movie 1.

The temporal dynamics of the cylinder in the low and large torque regimes is illustrated in figure 3(b) for a constant torque applied at $t=0$ s, which is the case we will consider in the rest of the paper. Below $\varGamma _c$ (blue disks) the cylinder velocity increases monotonically from 0 to its equilibrium steady value. Conversely, sufficiently above $\varGamma _c$ ($\varGamma \gtrsim 1.4 \varGamma _c$, pink squares, see also supplementary movie 1 available at https://doi.org/10.1017/jfm.2023.624) the motion is found to be unsteady at all times. After a short initial transient of a few cycles, the motion settles down to periodic oscillations, with short and steep decreases in velocity separated by much slower and longer increases.

In the following, we consider successively the steady regime obtained for low torques and the oscillations observed for high torques.

3.2. Low-torque steady regime

The low-torque steady regime allows us to verify precisely the suspension rheology from local in situ measurements. For each constant-torque experiment in the low-torque regime we measure the steady flow field of the suspension (figure 4a) and extract the radial profile of the azimuthal velocity component, $u_\theta (r)$ (figure 4b). The velocity is found to vanish beyond a no-flow radius $R_y$ ($= 20.6$, 34.9 and 47.2 mm, respectively, for $\varGamma /\varGamma _c = 0.35$, 0.70 and 1.10), which suggests that the suspension has a small yield stress, $\sigma _y = \varGamma /(2{\rm \pi} h R_y^2) \simeq 0.38 \pm 0.11$ Pa, with a value in good agreement with those already reported for aqueous cornstarch suspensions at similar volume fractions (Fall et al. Reference Fall, Huang, Bertrand, Ovarlez and Bonn2008, Reference Fall, Bertrand, Ovarlez and Bonn2012). Nevertheless, in the flowing region near the cylinder, the velocity profiles are found to match closely the steady Newtonian profile

(3.1)\begin{equation} \frac{u_\theta (r)}{\varOmega R}= \displaystyle\begin{cases} \displaystyle \frac{r}{R}\frac{1/r^{2}-1/{R_y}^{2}}{1/R^{2} -1/{R_y}^{2}}, & r \leq R_y,\\ \displaystyle 0, & r \geq R_y, \end{cases}\end{equation}

which is represented by solid lines in figure 4(b). This indicates that, in spite of the non-uniform stress field ($\sigma (r) \propto 1/r^2$), no significant effect of shear-induced migration is observed in the low-torque regime, in agreement with previous observations (Fall et al. Reference Fall, Huang, Bertrand, Ovarlez and Bonn2008, Reference Fall, Bertrand, Ovarlez and Bonn2012). Equivalently, the close to Newtonian behaviour of the suspension (above $\sigma _y$) is illustrated in figure 4(c), which presents the local stress, $\sigma (r) = \varGamma /(2{\rm \pi} h r^2)$, assuming steadiness and rotational invariance, as a function of the shear rate, $\dot {\gamma }(r) = -r\partial _r(u_\theta /r)$, measured locally from the flow. The measurements obtained for different applied torques and different radii collapse on the same quasi-Newtonian flow curve, which matches (above $\sigma _y$) the frictionless part of the Wyart–Cates flow rule obtained from the global rheology measurements of figure 2. The match is fairly good up to the largest stress, $\sigma \simeq 3$ Pa, that can be reached in the steady regime.

Figure 4. Low-torque steady regime: local rheology and onset of unsteadiness ($h=15$ mm). (a) Steady velocity field around the cylinder for a constant applied torque $\varGamma = 0.30 \varGamma _c$. (b) Radial profiles of the azimuthal velocity for $\varGamma /\varGamma _c = 0.35$, 0.70 and 1.10. Solid lines: Newtonian profiles given by (3.1). (c) Corresponding local shear stress vs local shear rate. Solid line: Wyart–Cates flow rule fitting the global rheometry in figure 2 ($\phi =0.44$). Red dashed line: onset shear stress of discontinuous shear thickening, $\sigma _c$.

Importantly, this latter value also matches the discontinuous shear-thickening onset ($\sigma _c \simeq 3.0$ Pa) obtained from the global rheograms (figure 2). This indicates that unsteadiness is triggered by the discontinuous shear thickening of the suspension at the cylinder surface and that the onset condition is approximately $\sigma (R) \simeq \sigma _c$, or equivalently, $\varGamma \simeq \varGamma _c$. The instability mechanism, per se, will be clarified in the following sections.

3.3. High-torque unsteady regime

We turn, now, to the periodic oscillations observed for a constant applied torque exceeding $\varGamma _c$, starting with the slow-acceleration phases of the oscillations.

3.3.1. Slow-acceleration phases

The slow-acceleration phases are visco-inertial transients. They can be described simply by considering the inertia of the cylinder, the constant applied torque and the frictionless Newtonian-effective drag of the suspension. Angular momentum theorem applied to the cylinder implies

(3.2)\begin{equation} I\dot{\varOmega} = \varGamma - 2{\rm \pi} hR^2\sigma(R,t),\end{equation}

with $I= 104\pm 1\ \mathrm {\mu }$N m s$^{2}$ the angular moment of inertia of the cylinder plus rotor of the rheometer, which is characterized using an in-built function of the rheometer (when the cylinder is in air). During the acceleration the shear stress is below $\sigma _c$ everywhere in the suspension, momentum has time to diffuse across the flow ($\rho R^2/\eta _0 \sim 10^{-1} {\rm s} \ll \varOmega /\dot {\varOmega }\sim 1\ {\rm s}$, with $\rho \simeq 1240\ {\rm kg}\ {\rm m}^{-3}$ the suspension density and $\eta _0 \simeq 0.38$ Pa s the non-frictional viscosity of the suspension) and the inertia of the flowing part of the liquid ($\sim \rho h R^4 \sim 10^{-7}\ {\rm N}\ {\rm m}\ {\rm s}^{2}$) is much smaller than the cylinder inertia ($I\sim 10^{-4}\ {\rm N}\ {\rm m}\ {\rm s}^{2}$). This means that the shear stress at the cylinder surface is almost equal to the steady, frictionless, Newtonian-effective value, $\sigma (R,t) \simeq \eta _0 \dot {\gamma }(R,t) \simeq 2\eta _0\varOmega (t)$, with $\dot {\gamma }(R,t) \simeq 2\varOmega (t)$ the steady shear rate for a large gap (see (3.1) in the limit $R/R_y\ll 1$). Integrating (3.2) with $\sigma (R,t) = 2\eta _0\varOmega (t)$ gives

(3.3) \begin{equation} \varOmega(t) = \frac{\varGamma}{4{\rm \pi}\eta_0 hR^2} (1-\mathrm{e}^{-\frac{\varGamma_c}{\varGamma}\frac{t-t'}{\tau_{acc}}}),\quad \text{with } \tau_{acc} = \frac{I\sigma_c}{2\eta_0\varGamma},\end{equation}

which is found to agree quantitatively with the measured acceleration phases, as shown in figure 5(a).

Figure 5. High-torque unsteady regime. (a) Long-time evolution of the cylinder velocity (rheometer measurements, $\varGamma = 3.5 \varGamma _c, h = 35$ mm). Solid-line: (3.3) for the acceleration phases. (b,c) Focus on a deceleration phase resolved with high-speed imaging. Here, $t=0$ stands for the onset of deceleration ($\dot {\varOmega }=0$). (b) Cylinder velocity normalized by the velocity, $\varOmega _c$, at the deceleration onset. (c) Deceleration (left-hand vertical axis) and shear stress at the cylinder surface normalized by the discontinuous shear-thickening stress, $\sigma _c$ (right-hand).

3.3.2. Transitions from slow accelerations to fast decelerations

During the acceleration phase, the rate of acceleration of the cylinder decreases, which means that the stress, $(\varGamma -I\dot {\varOmega })/2{\rm \pi} h R^2$, actually transmitted to the suspension increases, until a value of approximately $\sigma _c$ is reached. Because of the slowness of the acceleration the condition is reached for

(3.4)\begin{equation} \varOmega(t) = \varOmega_c \approx \dot{\gamma}_c/2,\end{equation}

after the typical acceleration time $(\varGamma /\varGamma _c)\ln ({1}/({1-\varGamma _c/\varGamma }))\tau _{acc}$ set by (3.3). Equation (3.4) is valid for a suspension that would be strictly Newtonian up to $\sigma _c$. In practice, there is a continuous shear thickening for stresses just below $\sigma _c$, which augments the actual value of $\varOmega _c$ relative to $\dot {\gamma }_c/2$. For the volume fraction we consider ($\phi = 0.44$), the critical steady cylinder velocity based on the Wyart–Cates rheology (given by $\varOmega _c= \int _R^\infty ({\dot {\gamma }\,\mathrm {d} r}/{r}) = \frac {1}{2}\int _0^{\sigma _c} ({\mathrm {d} \sigma }/{\eta })$) is $\varOmega _c \simeq 1.35 \dot {\gamma }_c/2$. This value is found to be within a factor 2 of the critical velocity, $\varOmega _c \approx 2 \dot {\gamma }_c/2$, observed experimentally, with no trend on the suspension layer thickness (see inset of figure 7c).

Besides this non-trivial relation between the stress level at the cylinder, $\sigma (R)$, and the steady velocity, $\varOmega$, it must be noticed that the condition for unsteadiness is presumably more complex than $\sigma (R)\geq \sigma _c$. As will be discussed in § 4, the criterion is actually expected to depend slightly on the Reynolds number of the flow, as well as on the mode of destabilization. This latter point brings us to the fast-deceleration phases.

3.3.3. Fast-deceleration phases

The deceleration between two acceleration cycles lasts only a fraction of a second, which is shorter than the temporal resolution of the rheometer. To resolve the dynamics we use high-speed imaging of the cylinder and a PIV procedure, which yield both time-resolved measurements of the cylinder velocity $\varOmega (t)$ and the average stress at the cylinder surface, $\sigma (R,t)=(\varGamma -I\dot {\varOmega })/2{\rm \pi} h R^2$, from the measured deceleration rate, $\dot {\varOmega }$. A typical evolution of $\varOmega (t), \dot {\varOmega }(t)$ and $\sigma (R,t)$ is shown in figure 5. The cylinder decelerates from $\varOmega _c\approx 7.5$ to approximately 2 rad s$^{-1}$ within approximately $0.1$ s. This indicates that the drag of the suspension increases steeply. The average stress, $\sigma |_{r=R}$, peaks at almost $10^2 \sigma _c$, which is approximately 30 times as large as the constant stress, $\varGamma /2{\rm \pi} h R^2$, applied by the rheometer and is much larger than the shear stress, $\sigma _J\approx 10$ Pa, at which the suspension jams, according to the fitted Wyart–Cates rheology.

To understand the peak of drag experienced by the cylinder, the flow of the suspension has to be considered. Figure 6(a) presents the evolution of the suspension velocity field measured during the deceleration phase (see also supplementary movie 2). It shows that the beginning of the cylinder deceleration ($\dot {\varOmega }=0$, defining $t=0$) coincides with the emergence of a velocity front, which propagates from the cylinder to the outer wall with a velocity of order 1 m s$^{-1}$. The front is found to nucleate over a small portion of the cylinder surface. After a short transient that will be discussed below, it propagates within an angular sector of approximately 180$^\circ$ around the nucleation direction (the latter being random with respect to both the cylinder and the laboratory). As shown from the velocity profiles along the front propagation direction presented in figure 6(b), this velocity front is also a ‘thickening’ front separating an inner high-stress and low-shear (thickened) region from the outer, unperturbed, low-stress region. The corresponding thickening front position, $R_{f}$, the cylinder angular velocity, $\varOmega$, and the deceleration, $-\dot {\varOmega }$, are plotted vs time in figure 6(ce), respectively (the front position is defined as the radius, in the front propagation direction, at which $u_\theta = R\varOmega /2$). These analyses confirm that the deceleration phase is triggered by the inception of the thickening front and show that the front propagates at a close to constant speed, $V_{f}$, which is transverse to the suspension velocity and much larger than the latter. This front is of the same nature as those termed jamming or shear fronts, reported previously in imposed-velocity configurations (Peters & Jaeger Reference Peters and Jaeger2014; Peters et al. Reference Peters, Majumdar and Jaeger2016). For high levels of stress these fronts have been rationalized as kinematic shocks with a typical shock width, $\sim 10\eta _0/\rho V_{f}$, limited by viscosity, and a typical propagation velocity, $V_{f} \sim {\rm \Delta} u/\gamma _0$, proportional to the increment of transverse velocity of the suspension across the shock, ${\rm \Delta} u$, and with the inverse of the relaxation strain scale, $\gamma _0$ (Han et al. Reference Han, Wyart, Peters and Jaeger2018). The fronts observed in the present study are found to match these scalings. The typical shock width, $\approx 10$ mm, is of order $10\eta _0/\rho V_{f}\sim 5$ mm, and the relative propagation velocity, $V_{f}/R\varOmega _c\approx 7$, is consistent with reported values (Peters & Jaeger Reference Peters and Jaeger2014; Han et al. Reference Han, Wyart, Peters and Jaeger2018).

Figure 6. Spatio-temporal analysis of a deceleration phase ($\varGamma = 3.5\varGamma _c, h=35$ mm). (a) Velocity fields at $t= 8$, 28, 48 and 68 ms after the cylinder has started decelerating ($t=0$, see also supplementary movie 2). Colour encodes the relative norm of the velocity, $\sqrt {u_\theta ^2 + u_r^2}/R\varOmega _c$. (b) Radial profiles of the azimuthal velocity component in the direction where the thickening front nucleates and propagates (white arrow in a). (ce) Time evolution of the thickening front position (c), of the cylinder velocity normalized by the deceleration onset velocity (d) and of the cylinder deceleration rate (e). Red dashed line: arrival time, $t_{out}$, of the front at the outer (vessel) wall. Green-dashed line: release time, $t_{rel}$, at which the next acceleration phase starts.

Figure 7. Early part of the deceleration phase: maximal deceleration. (a) Normalized maximal deceleration of the cylinder or, equivalently, maximal shear stress in the suspension vs thickness of the suspension layer.(b) Maximal deceleration time normalized by the front arrival time at the outer wall, $t_{out}$, vs $h$. (c) Normalized velocity of the cylinder during a deceleration phase ($h=35$ mm). Insets from top to bottom: cylinder velocity at the onset of deceleration, front velocity and front angular width, ${\rm \Delta} \theta$, vs $h$. (ac) The pink solid lines show ((3.7)–(3.10a,b)) with $t_{out} = (R_{out}-R)/V_{f}$ for a homogeneous nucleation of the thickening front ($R_{f}(t) /R = 1+V_{f} t$). The black dashed lines show the same equations for a localized nucleation ($R_{f}(t) /R = 1+\sqrt {L^2+(V_{f} t)^2}-L$ with $L^2=R^2+(h/2)^2$, see text).

The important point, now, is to elucidate how the interaction between the front propagation and the cylinder motion sets the oscillation and the effective drag of the suspension. To do so, we model the velocity field and the stresses based on the features of the front observed experimentally. We assume that the velocity of the suspension remains essentially azimuthal ($u_\theta \gg u_r$), that the front is sharp, such that the shear stress immediately upstream of the thickening front vanishes ($\sigma |_{r>R_{f}}\ll \rho V_{f} u_\theta$), that azimuthal stress gradients can be neglected and that the angular momentum imparted by the rheometer during the deceleration is small ($\varGamma \times 0.1\ {\rm s} \ll I\varOmega _c$). In this case, angular momentum conservation of the cylinder and the suspension gives

(3.5)\begin{equation} I\varOmega(t)+S(t)\varOmega(t) = I\varOmega_c,\end{equation}

where $I\varOmega _c$ is the initial angular momentum of the cylinder (before deceleration) and $I\varOmega (t)$ and $S(t)\varOmega (t)$ are the current momenta of the cylinder and of the suspension in the thickened region, respectively. Equation (3.5) simply expresses that the cylinder slows down as it shares momentum with the thickened region. Experimental observations (figure 6a) indicate that the front propagates typically over a half-space, i.e. within an angle span ${\rm \Delta} \theta \approx {\rm \pi}$. Inside the thickened region ($r< R_{f}(t)$) the azimuthal velocity is roughly uniform and close to $R\varOmega (t)$ (figure 6b). Based on these observations the angular momentum of the suspension reads

(3.6)\begin{equation} S(t)\varOmega(t) = \frac{{\rm \Delta}\theta\rho h R}{3} (R_{f}^3(t) - R^3 ) \varOmega(t), \end{equation}

and, from (3.5), the cylinder velocity is expected to follow

(3.7)\begin{equation} \varOmega(t) = \frac{\varOmega_c}{1 + \alpha[R_{f}^3(t)/R^3 - 1]},\quad \text{where } \alpha = \frac{{\rm \Delta}\theta \rho h R^4}{3 I}\end{equation}

represents the characteristic angular moment of inertia of the suspension (at scale $R$) relative to that of the cylinder. Considering $R_{f}(t) = R + V_{f} t$, as a consequence of the approximately constant front speed, $V_{f}$ (figure 6c), gives the following time evolution:

(3.8)\begin{equation} \varOmega(t) = \frac{\varOmega_c}{1 + [(\alpha^{1/3} + t/\tau_{dec})^3 - \alpha]},\quad \text{with } \tau_{dec} = \frac{R}{V_{f}}\alpha^{{-}1/3}.\end{equation}

In the present case, where the cylinder inertia is large ($\alpha ^{-1}\gtrsim 10^{2}$ in the experiments), the maximal deceleration rate is

(3.9)\begin{equation} -\dot{\varOmega}_{max} \simeq \frac{2^{4/3}}{3}\frac{\varOmega_c}{\tau_{dec}} \sim \left(\frac{{\rm \Delta}\theta \rho h R^4}{I}\right)^{1/3} \frac{V_{f} \varOmega_c}{R}, \end{equation}

which is reached at

(3.10a,b)\begin{equation} R_{f,{max}} \simeq (2\alpha)^{{-}1/3} R, \quad \text{and} \quad t_{max} \simeq (2^{{-}1/3} -\alpha^{1/3})\tau_{dec} \sim \tau_{dec},\end{equation}

when the moment of inertia of the thickened region ($\sim {\rm \Delta} \theta \rho h R {R_{f}}^3$) compares with $I$.

Equation (3.9) indicates that the maximal deceleration is expected to scale with the suspension layer thickness as $-\dot {\varOmega }_{max} \propto h^{1/3}$ or, equivalently, that the maximal stress, $\sigma _{max} \propto -\dot {\varOmega }_{max} /h$, follows $h^{-2/3}$. We test this prediction experimentally by varying $h$ systematically from 6 to 35 mm, which is the thickness range accessible with our set-up, while keeping a fixed value of $\varGamma /\varGamma _c = 3.5$. For each thickness, three deceleration events are analysed with high-speed PIV of both the cylinder and the suspension. The latter allows us to verify that the front characteristics remain close to the heuristic features we adopted, i.e. ${\rm \Delta} \theta \approx {\rm \pi}$ and a front velocity, $V_{f} \approx 1.1\ {\rm m}\ {\rm s}^{-1}$, independent of $h$ (insets of figure 7c). We also verify that the cylinder velocity at the onset of deceleration ($\varOmega _c$) is essentially independent of $h$.

Figure 7(a) shows that the maximal deceleration rate obtained experimentally is well captured by (3.9), both in magnitude and trend. It also indicates that the peak stress during the deceleration, $\sigma _{max} = -I\dot {\varOmega }_{max}/({\rm \Delta} \theta h R^2)$, can reach as much as 300 $\sigma _c$ for the thinnest layer. As for the instant of the maximal deceleration, the magnitude of $t_{max}$ is reasonably well captured by (3.10a,b) (see figure 7b), which consistently predicts that, for all thicknesses investigated, the maximal deceleration of the cylinder occurs before the time $t_{out}$ at which the front reaches the outer wall ($t_{max}/t_{out}<1$). However, the model is found to underestimate the exact value, especially for thick layers. We will comment this point in the next paragraph.

Finally, figure 7(c) compares (3.8) with the evolution of the cylinder velocity observed during a whole deceleration event for a thickness $h=35$ mm. The time origin is taken at the onset of deceleration ($\dot {\varOmega }=0$). The match in the maximal deceleration rate is recovered but the deceleration rate at the beginning of the deceleration phase is found to be overestimated by (3.8), which indicates that the initial growth of the thickened region is not as fast as assumed by the model. This suggests that the thickened region nucleates at a single locus on the cylinder wall and has to extend across the layer and azimuthally before propagating radially only. This hypothesis is consistent with the initial growth of the angular span of the front, ${\rm \Delta} \theta$, observed at the layer surface (see figure 6a). It is also in line with the slight underestimation of $t_{max}$ by the model. Indeed, as shown in figure 7(b,c), a better match is found for both the early stage of deceleration and the arrival time, $t_{out}$, by considering heuristically that the average front radius follows $R_{f}(t)/R = 1 + \sqrt {L^2+(V_{f}t)^2}-L$, with $L^2 = R^2+(h/2)^2$, to account for the azimuthal component, $\sim R$, and the vertical component, $\sim h/2$, an initially localized front has to propagate through. Importantly, the maximal deceleration is almost unchanged by the lag, provided $h$ remains small relative to $R_{f,{max}}$ (see figure 7a).

As for the late stage of the deceleration, the model deviates from the measurements close to the time, $t_{out}$, at which the thickening front reaches the outer wall. This is consistent because the leading edge of the front is not stress free anymore. However, the deviation is not towards a stronger deceleration of the cylinder, as could be expected for a suspension fully jammed from the cylinder to the wall, but towards an increasingly milder deceleration until the cylinder eventually re-accelerates approximately $t_{rel} \approx 120$ ms after the onset of deceleration, i.e. $\approx 60$ ms after $t_{out}$ (see figures 6e and 7c). This brings us to the question of the release mechanism terminating the fast-deceleration phases.

3.3.4. Transitions from fast decelerations to slow accelerations

The deceleration of the cylinder results from the extension of the shear-thickened region. On the other hand, shear thickening is conditioned to the shear stress sustained by the suspension. If the latter typically decreases below the critical value $\sigma _c$ at any radius inside the thickened region, the front propagation should stop. This should in turn lead to a large drop in shear stress all over the suspension. Since at this time the deceleration has already reduced the cylinder velocity and the shear rate in the suspension significantly relative to the critical condition for the nucleation of a new thickening front, the cylinder is expected to enter a new acceleration phase (where the suspension is essentially unstressed because most of the applied torque is absorbed by the accelerating cylinder). Therefore, understanding the end of the deceleration phases requires understanding of the stress field in the suspension.

To do so it is insightful to consider, first, the case of a sufficiently large vessel, for which no interaction with the outer wall is expected. Conserving the same assumptions as in § 3.3.3 and applying the angular momentum theorem to the cylinder and thickened suspension up to a fixed radius $r$, the shear stress in the expanding thickened region ($r< R_{f}$) follows

(3.11)\begin{equation} \sigma(r,t) ={-}\frac{(I+S_{{<}r})\dot{\varOmega}}{{\rm \Delta}\theta h r^2} ={-}\frac{1+\alpha(r^3/R^3-1)}{r^2/R^2}\frac{I\dot{\varOmega}}{{\rm \Delta}\theta hR^2}, \end{equation}

with $S_{< r}\varOmega (t)$ the angular moment of the thickened suspension at radii below $r$. The stress is minimal at the same radius, $r_{min} \simeq (2/\alpha )^{1/3}R$, regardless of time, and it evolves as (using 3.8)

(3.12)\begin{equation} \sigma_{min}(t) \simeq \frac{3\rho R \varOmega_c V_{f}}{2^{2/3}}\left(\frac{t}{\tau_{dec}}\right)^{{-}4}.\end{equation}

This means that the release condition, when the shear stress becomes typically lower than $\sigma _c$, is expected at a time and a front position given by

(3.13a,b)\begin{equation} t_{rel,\infty} \simeq \tau_{dec}\left(\frac{3}{2^{2/3}}\frac{V_{f}}{R\varOmega_c}Re\right)^{1/4}, \quad R_{f,rel} \simeq R \left(\frac{3}{2^{2/3}}\frac{V_{f}}{R\varOmega_c}Re \right)^{1/4}\alpha^{{-}1/3},\end{equation}

respectively, where

(3.14)\begin{equation} Re = \frac{\rho R^2 \varOmega_c^2}{\sigma_c} \sim \frac{\rho R^2 \dot{\gamma}_c}{\eta_0},\end{equation}

is the typical Reynolds number at the onset of the deceleration phase. Since $\sigma _c \sim \eta _0 \dot {\gamma }_c$ and both $\varOmega _c$ and $V_{f}$ scale like $\dot {\gamma }_c$, the Reynolds number is essentially the square of the ratio between the cylinder size $R$ and the characteristic viscous length $\sqrt {\eta _0/\rho \dot {\gamma }_c}$ of the suspension. In the experiments $Re \approx 5$ implies $R_{f,rel}\gtrsim 12R$, which means that the release stress, $\approx \sigma _c$, is not expected to be reached before the front arrives at the outer wall ($R_{out} \simeq 6.8R$), even for the thickest suspension layer. This is consistent with the observation that, in all the experiments, the re-acceleration of the cylinder ($t=t_{rel}$) is posterior to the arrival of the front at the outer wall ($t=t_{out}$).

In this case the interaction of the front with the wall has to be considered. High stresses should develop as the thickened region reaches the wall, and one could expect that the cylinder would re-accelerate only after a reflected shear front propagating inward (i.e. a stop front with even higher stresses and a low velocity for $r>R_f$) has reached the cylinder or decreased the stress below $\sigma _c$. Such an inward-propagating wave of low velocity is indeed observed systematically in experiments (see figure 8a). However, modelling the influence of a stop front on the cylinder deceleration under the same assumptions as in § 3.3.3 does not match, quantitatively, the observations for $t>t_{out}$. Indeed, as discussed in Appendix A, if the dissipation law of the front is assumed to be unchanged by the reflection on the wall, the cylinder deceleration is expected to be slightly larger for a reflected front than for an ever outward-propagating front (sufficiently large vessel), whereas the observed deceleration is actually milder. This suggests that departure from axial symmetry may have a more significant effect on the stress field in the suspension after the interaction of the front with the wall than before, or that the front interaction with the wall leads to either an elastic response of the suspension (Larsen et al. Reference Larsen, Kim, Zukoski and Weitz2010) or to out-of-plane motion, facilitating the release of stress.

Figure 8. Late part of the deceleration phase: release. (a) Velocity profiles in the suspension (azimuthal velocity component, same direction as in figure 6) between the front arrival time, $t_{out}$ ($R_{f} = R_{out}$), and the release time, $t_{rel}$ (onset of re-acceleration, $\dot {\varOmega } = 0$). (b) Release velocity. The mean observed value is $\varOmega _{rel} \simeq 0.24 \varOmega _c$. (c) Release time relative to the front arrival time (time origin at the onset of the deceleration phase). Symbols: experiments. The solid line indicates the upper bound $t_{rel} \leq 2t_{out}$ of (3.15), see text. The mean observed value is $t_{rel} \simeq 2.0t_{out}$.

Nevertheless, the observation of an inward-propagating stop front suggests that the typical re-acceleration time (relative to the onset of deceleration) should follow

(3.15)\begin{equation} t_{rel} \lesssim 2\frac{R_{out}-R}{V_{f}}.\end{equation}

Equation (3.15) is found to be consistent with the measurements presented in figure 8(b). The observed re-acceleration time is found to be $t_{rel} \approx 2t_{out}$ for all layer thicknesses without significant dependence on the latter. Similarly, the cylinder release velocity is found to be close to $\varOmega _{rel} \approx \varOmega _c/4$ without significant dependence on $h$. While this is compatible with the idea that the front reflection at the wall leads to the stress release, which allows the cylinder re-acceleration, further investigations would be required to be conclusive.

3.4. Effective drag on the cylinder

The quantitative picture of the dynamics obtained in the previous sections allows us to model the effective drag (time-averaged drag) of the suspension on the cylinder, for both steady and unsteady regimes, that is, for any value of the applied torque.

Below $\varGamma _c$, the motion is steady and a quasi-Newtonian drag, $\varGamma \simeq 4{\rm \pi} \eta _0 h R^2 \varOmega$, is expected. Above $\varGamma _c$, the cylinder velocity oscillates between a fraction of $\varOmega _c$ and $\varOmega _c$, whose value $\varOmega _c\approx \dot {\gamma }_c/2$ is independent of the applied torque. This means that the average velocity $\langle \varOmega \rangle = \int _0^\tau \varOmega (t)\, \mathrm {d} t/\tau$ is expected to saturate at a value of order $\dot {\gamma }_c/2$, almost independently of the applied torque, or, equivalently, that the effective drag–velocity curve of the cylinder should be infinitely steep at $\varOmega \approx \dot {\gamma }_c/2$. More precisely, in the limit when the duration of the deceleration phase can be neglected, the average of the velocity given by (3.3) is expected to decrease only minimally from $\langle \varOmega \rangle =\varOmega _c$ at $\varGamma _c$ to $\langle \varOmega \rangle =(\varOmega _c+\varOmega _{rel})/2 \approx 0.6\varOmega _c$ for larger torques (for $\varGamma /\varGamma _c \gtrsim {I V_{f}}/{4{\rm \pi} \eta _0 h R^2(R_{out}-R)} \approx 20$, the deceleration phase has to be considered, but this only marginally changes the expectation to $\langle \varOmega \rangle \approx 0.5\varOmega _c$).

As shown in figure 9, this simple model is found to capture the main characteristics of the effective drag–velocity curve obtained experimentally by ramping up the torque from $\varGamma /\varGamma _c \approx 0.2$ to over $90$ (the data are obtained by a short-time averaging of those presented in figure 3a). Although the drag–velocity curve obtained by averaging (3.3) is slightly re-entrant for applied torques above $\varGamma _c$, it is found to be in agreement with the experimental average velocity within a factor two over the almost three orders of magnitude variation in applied torque.

Figure 9. Effective drag of the suspension. (a) The local rheological flow rule is strongly re-entrant for $\sigma >\sigma _c$. (b) The average cylinder velocity, $\langle \varOmega \rangle$, is marginally re-entrant for $\varGamma > \varGamma _c$: it essentially saturates at a value of order $\varOmega _c \approx \dot {\gamma }_c/2$ because of the periodic instability of the suspension flow. Solid line: average velocity, $\tau ^{-1}\int _0^\tau \varOmega (t)\, \mathrm {d} t$, expected from (3.3) with $\varOmega _{rel} = \varOmega _c/4$ (i.e. $t'=({I}/{4{\rm \pi} \eta _0 h R^2})\ln (1-{\varGamma _c}/{4\varGamma })$). Symbols: measurements obtained for an increasing ramp of applied torque (short-time averaging of the data of figure 3(a)).

4. Discussion and conclusions

The experiments and analyses presented above provide a simple picture of the dynamics of a shear-thickening suspension driven by a rotating cylinder. For low applied torques the flow is steady. The drag is close to Newtonian and set by the low-stress branch of the rheology. Above the onset torque for discontinuous shear thickening, $\varGamma _c$, the average velocity of the cylinder saturates, while large periodic oscillations are observed. Long phases of slow acceleration are followed by short phases of high deceleration, which are triggered by the propagation of a thickening front, and so on. The front is found to nucleate when the shear rate at the cylinder surface reaches, typically, the discontinuous shear-thickening threshold ($\dot {\gamma }\geq \dot {\gamma }_c$), i.e. when the rotation rate, $\varOmega$, compares with the critical shear rate, $\sim \dot {\gamma }_c/2$ (3.4). The oscillation period is controlled by the slow acceleration phases, $\sim \tau _{acc}(\varGamma /\varGamma _c)\ln ({1}/({1-\varGamma _c/\varGamma }))\sim ({I}/{\eta _0R^2h})\ln ({1}/({1-\varGamma _c/\varGamma }))$ (3.3), the duration of which is set by the applied torque and cylinder inertia. The peak stress, $\sigma _{max}$ (3.9), and intrinsic time scale of the deceleration, $\tau _{dec}$ (3.8), also involve the inertia of the suspension. However, in the present case of an insufficiently large gap, the duration of the deceleration phases, $\sim t_{out}$ (3.15), is set by the propagation time of the front across the gap. Several important conclusions can be drawn from these analyses.

The first one concerns the oscillations and their time scales. As mentioned in the introduction, similar velocity oscillations have been reported in small-gap Couette flows (Boersma et al. Reference Boersma, Baets, Lavèn and Stein1991; Lootens et al. Reference Lootens, Van Damme and Hébraud2003; Nagahiro et al. Reference Nagahiro, Nakanishi and Mitarai2013; Hermes et al. Reference Hermes, Guy, Poon, Poy, Cates and Wyart2016; Rathee et al. Reference Rathee, Blair and Urbach2017; Chacko et al. Reference Chacko, Mari, Cates and Fielding2018; Saint-Michel et al. Reference Saint-Michel, Gibaud and Manneville2018; Richards et al. Reference Richards, Royer, Liebchen, Guy and Poon2019; Ovarlez et al. Reference Ovarlez, Le, Smit, Fall, Mari, Chatté and Colin2020; Sedes et al. Reference Sedes, Singh and Morris2020; Gauthier et al. Reference Gauthier, Pruvost, Gamache and Colin2021). In this case, the oscillations have been explained as limit cycles involving the tool inertia and a uniformly sheared suspension with a relaxing shear-thickening rheology (Richards et al. Reference Richards, Royer, Liebchen, Guy and Poon2019). This formalism predicts small-amplitude oscillations, close to the instability onset torque, and oscillations with a strict stop, for higher torques. It also requires a second rheological relaxation scale (time scale) to reproduce the periodic oscillations reported experimentally. However, in the large-gap experiments presented above no small-amplitude oscillation is observed. The amplitude of the oscillations is found to be of order one, including just above the onset torque for unsteadiness ($\approx \varGamma _c$), and the tool is never close to stopping, even for much larger torques. Moreover, none of the oscillation time scales reflect the intrinsic rheological time scale, $\gamma _0/\dot {\gamma }_c$, only. All time scales of the oscillation, including those for the deceleration phases $(\tau _{dec} \sim \frac{\gamma _0}{\dot {\gamma }_c}\left(\frac{\rho h R^4}{I}\right)^{-1/3}$ and $t_{rel,\infty } \sim \tau _{dec} \left(\frac{Re}{\gamma _0}\right)^{1/4} \sim \tau _{dec} \left(\frac{\dot {\gamma }_c}{\gamma _0}\frac{\rho R^2}{\eta _0}\right)^{1/4}$ or $t_{out} \sim \frac{\gamma _0}{\dot {\gamma }_c}\frac{R_{out}}{R}$ depending, respectively, on whether the vessel is large enough or not), also involve the suspension inertia, the cylinder inertia or the gap size and parameters of the steady rheology. As for small-gap configurations, it is not possible to conclude on whether there is also a single thickened region for each oscillation. However, it is worth noticing that, in the small-gap limit, the propagation time of the front across the gap is typically the intrinsic rheological time scale, $\gamma _0/\dot {\gamma }_c$ (indeed for a gap width $w$, it is $t_{out} = w/V_{f}\sim \gamma _0w/R\varOmega _c \sim \gamma _0/\dot {\gamma }_c$). Therefore, both times are of order a fraction of a second for a dense aqueous suspension of cornstarch and compare with the typical oscillation periods reported for small-gap configurations.

Second, and as detailed in § 3.4, the picture discussed above illustrates how a steep, but marginally re-entrant, effective drag curve can emerge from the strongly re-entrant rheology of the suspension. Because of the large inertia of the cylinder ($\alpha \ll 1$) the condition for the nucleation of a thickening front ($\dot {\gamma }\geq \dot {\gamma }_c$) sets a maximal cylinder velocity, $\varOmega _c \approx \dot {\gamma }_c/2$, which is, essentially, independent of the applied torque. This implies that the average velocity, $\langle \varOmega \rangle$, saturates at a value $\sim \dot {\gamma }_c$. This saturation is a direct consequence of the flow instability, which means that the drag is intrinsically inertial above $\varGamma _c$. Ironically, it turns out that a very similar effective drag curve would be expected if the flow was stable for shear stresses above $\sigma _c$. Indeed, the steady shear stress follows $\sigma /\sigma _c=(\varGamma /\varGamma _c)(R^2/r^2)$, which means that, for a fully re-entrant flow curve as in figure 9(a), the suspension would be jammed for radii below $r_J\approx R(\varGamma /\varGamma _c)^{1/2}$ and frictionless beyond. Therefore, the steady rotation velocity of the ‘cylinder plus jammed suspension’ would also be $\approx \varGamma /4{\rm \pi} \eta _0 h r_J^2= \varOmega _c$, independently of the applied torque (above $\varGamma _c$). Nonetheless, this match should not be given too much significance. It omits the order-one fluctuations of the motion as well as the inertial nature of the drag and it is merely coincidental. Indeed, the two scenarios (saturation by an instability at the velocity for which the shear stress at the solid surface is critical, or steady saturation when the drag of the ‘solid plus jammed suspension’ balances the applied force) do not predict the same average velocity for other configurations such as the drag of a translating cylinder or a translating sphere, for instance.

Third, and as briefly evoked in § 3.3.2, the criterion for the onset of unsteadiness, $\varOmega \gtrsim \varOmega _c$ (or, equivalently, $\sigma |_{r=R}\gtrsim \sigma _c$), is not expected to be strict nor independent of any other consideration. Indeed, for a Wyart–Cates rheology with a single relaxation scale, $\gamma _0$, the dynamics for a slowly accelerating cylinder is expected to depend not only on the current velocity relative to the critical ($\varOmega /\varOmega _c$) but also on the critical Reynolds number, $Re/\gamma _0 \sim \rho R^2 \varOmega _c/(\gamma _0\eta _0)$, which is the ratio between the typical viscous time, $\rho R^2/\eta _0$, and the intrinsic rheological time, $\gamma _0/\dot {\gamma }_c$. In the present case where $Re/\gamma _0\approx 30$, the onset of instability is actually observed for $\varOmega \approx \varOmega _c$, while the destabilization consists in the nucleation and fast expansion of a thickened region resulting in a peak torque that is non-correlated with the applied torque. It remains to be studied whether the onset velocity can be significantly shifted by varying the Reynolds number (as for zero-dimensional (Richards et al. Reference Richards, Royer, Liebchen, Guy and Poon2019) or long-wavelength linear models (Darbois Texier et al. Reference Darbois Texier, Lhuissier, Metzger and Forterre2023), as well as whether the mode of destabilization is significantly altered for low Reynolds numbers or not.

Last, the role of the vessel and the release mechanism deserve a comment. In the present experiments, the thickening front interacts with the outer wall of the vessel before the cylinder re-accelerates, which means that some momentum is transferred to the vessel. This is certainly also the case for small-gap configurations, but the analysis considering the deceleration in a large vessel presented in § 3.3.3 ($R_{out} \geq R_{f,rel}$) suggests that this is not mandatory and that periodic oscillations could also be observed in a large or open system. As for the condition for the fading of the thickening front, it is certainly more complex than a decrease of the stress below $\sigma _c$ somewhere within the thickened region. It might actually be that the stress remains below the critical stress, $\sigma _J$, at which the steady-state rheology is jammed for a significant deformation, $\sim \gamma _0$. Indeed, for a strain-relaxing Wyart–Cates rheology, a purely propagative front is possible only for a stress jump above $\sigma _J$, while the thinning of the suspension requires a typical deformation $\gamma _0$. These subtleties should not change, significantly, the expectation for the onset of the re-acceleration ($t_{rel}$), but they call for further studies to understand better the details of the release mechanism with or without interaction of the front with a wall.

All these considerations emphasize the importance of considering not only the rheology of the suspension but also its hydrodynamics and the interaction with the often large inertia of the moving solid to understand the unsteady flow of shear-thickening suspensions driven by a moving solid above the thickening threshold. They might prove useful for understanding other drags or flows, such as those past a sphere or a cylinder.

Supplementary movies

Supplementary movies are available at https://doi.org/10.1017/jfm.2023.624.

Funding

This work was financially supported by the Agence Nationale de la Recherche (grants ANR-18-CE30-0024 and ANR-21-CE30-0015-01).

Declaration of interests

The authors report no conflict of interest.

Data availability statement

Data available upon request.

Appendix A. Stress and deceleration for a reflected front

This appendix derives the deceleration of the cylinder and the shear stress in the suspension, which would be expected after the thickening front reaches the outer wall ($t>t_{out}$) if the front was reflected by the wall into an inward-propagating thickening front (stop front) preserving the axial symmetry of the flow.

For an inward-propagating front, the outer side of the front is not stress free as during the initial (outward-propagating) front. Under the same assumptions as in § 3.3.3, the angular momentum balance of the cylinder and flow motion becomes

(A1)\begin{equation} I\varOmega(t)+S(t)\varOmega(t) = I\varOmega_c - \int_{t_{out}}^t \varGamma_{out}\,\mathrm{d} t', \quad \text{for } t\geq t_{out}, \end{equation}

with $\varGamma _{out}$ the resistive torque applied by the outer wall.

The thickening fronts are propagative structures, which are intrinsically dissipative. Assuming that the dissipation relation of the reflected front is the same as for the initial front (i.e. half the kinetic energy flux across the front), implies that the torque follows $\varGamma _{out} = -2\dot {S}\varOmega (t)$, which is positive since $\dot {S} = - \rho {\rm \Delta} \theta h R^2 V_{f}<0$. This yields

(A2)\begin{equation} \varOmega(t) = \frac{I(I+S(t))}{(I+S|_{t=t_{out}})^2} \varOmega_c, \quad \text{for } t\geq t_{out},\end{equation}

which matches, in $t = t_{out}$, the velocity $\varOmega = ({I}/({I+S})) \varOmega _c$ obtained for the initial front (3.7). Consistently, for a reflected front with the same velocity as the initial one, the deceleration is also continuous at $t = t_{out}$. After $t_{out}$, the deceleration predicted by (A2) is slightly larger, though close in practice, than the one expected in the absence of outer wall (3.7).

Similarly, the minimal stress in the suspension is not much different from the one expected in the absence of outer wall (3.12). Indeed, the relation (3.11) between the stress on the inner side of the front ($r< R_{f}$) and the cylinder deceleration, i.e.

(A3)\begin{equation} \sigma(r,t) ={-}\frac{(I+S_{{<}r})\dot{\varOmega}}{{\rm \Delta}\theta h r^2} ={-}\frac{1+\alpha(r^3/R^3-1)}{r^2/R^2}\frac{I\dot{\varOmega}}{{\rm \Delta}\theta hR^2}, \end{equation}

remains valid. Accordingly the stress is minimal at the same radius $r_{min} \simeq (2/\alpha )^{1/3}R$, provided $r_{min} \leq R_{f}$, or at the inner side of the front ($r=R_{f}$), otherwise. Therefore the minimal stress is expected to follow

(A4)$$\begin{gather} \sigma_{min}(t) \simeq 3\left(\frac{\alpha}{2}\right)^{2/3} \frac{I^2}{(I+S|_{t=t_{out}})^2}\rho R \varOmega_c V_{f},\quad \text{for } R_{f}\geq r_{min}, \end{gather}$$
(A5)$$\begin{gather}\sigma_{min}(t) \simeq \frac{I(I+S)}{(I+S|_{t=t_{out}})^2}\rho R \varOmega_c V_{f}, \quad \text{for } R_{f}\leq r_{min}. \end{gather}$$

References

Abdesselam, Y., Agassant, J.-F., Castellani, R., Valette, R., Demay, Y., Gourdin, D. & Peres, R. 2017 Rheology of plastisol formulations for coating applications. Polym. Engng Sci. 57, 982988.CrossRefGoogle Scholar
Baumgarten, A. & Kamrin, K. 2019 A general constitutive model for dense, fine-particle suspensions validated in many geometries. Proc. Natl Acad. Sci. 116, 1908065116–9.CrossRefGoogle ScholarPubMed
Blanco, E., Hodgson, D., Hermes, M., Besseling, R., Hunter, G., Chaikin, P., Cates, M., Van Damme, I. & Poon, W. 2019 Conching chocolate is a prototypical transition from frictionally jammed solid to flowable suspension with maximal solid content. Proc. Natl Acad. Sci. 116, 1030310308.CrossRefGoogle ScholarPubMed
Boersma, W., Baets, P., Lavèn, J. & Stein, H. 1991 Time-dependent behavior and wall slip in concentrated shear thickening dispersions. J. Rheol. 35, 10931120.CrossRefGoogle Scholar
Chacko, R., Mari, R., Cates, M. & Fielding, S. 2018 Dynamic vorticity banding in discontinuously shear thickening suspensions. Phys. Rev. Lett. 121, 108003.CrossRefGoogle ScholarPubMed
Clavaud, C., Bérut, A., Metzger, B. & Forterre, Y. 2017 Revealing the frictional transition in shear-thickening suspensions. Proc. Natl Acad. Sci. 114, 51475152.CrossRefGoogle ScholarPubMed
Clavaud, C., Metzger, B. & Forterre, Y. 2020 The darcytron: a pressure-imposed device to probe the frictional transition in shear-thickening suspensions. J. Rheol. 64, 395403.CrossRefGoogle Scholar
Comtet, J., Chatté, G., Niguès, A., Bocquet, L., Siria, A. & Colin, A. 2017 Pairwise frictional profile between particles determines discontinuous shear thickening transition in non-colloidal suspensions. Nat. Commun. 8, 15633.CrossRefGoogle ScholarPubMed
Darbois Texier, B., Lhuissier, H., Forterre, Y. & Metzger, B. 2020 Surface-wave instability without inertia in shear-thickening suspensions. Commun. Phys. 3, 232.CrossRefGoogle Scholar
Darbois Texier, B., Lhuissier, H., Metzger, B. & Forterre, Y. 2023 Shear-thickening suspensions down inclines: from Kapitza to Oobleck waves. J. Fluid Mech. 959, A2730.CrossRefGoogle Scholar
Dong, J. & Trulsson, M. 2017 Analog of discontinuous shear thickening flows under confining pressure. Phys. Rev. Fluids 2, 081301.CrossRefGoogle Scholar
Fall, A., Bertrand, F., Ovarlez, G. & Bonn, D. 2012 Shear thickening of cornstarch suspensions. J. Rheol. 56, 575591.CrossRefGoogle Scholar
Fall, A., Huang, N., Bertrand, F., Ovarlez, G. & Bonn, D. 2008 Shear thickening of cornstarch suspensions as a reentrant jamming transition. Phys. Rev. Lett. 100, 018301.CrossRefGoogle ScholarPubMed
Freundlich, H. & Röder, H.L. 1938 Dilatancy and its relation to thixotropy. Trans. Faraday Soc. 34, 308316.CrossRefGoogle Scholar
Gauthier, A., Ovarlez, G. & Colin, A. 2023 Shear-thickening in presence of adhesive contact forces: the singularity of cornstarch. arXiv:2303.15915v1 [cond–mat.soft].CrossRefGoogle Scholar
Gauthier, A., Pruvost, M., Gamache, O. & Colin, A. 2021 A new pressure sensor array for normal stress measurement in complex fluids. J. Rheol. 65, 583594.CrossRefGoogle Scholar
Guy, B.M., Hermes, M. & Poon, W.C.K. 2015 Towards a unified description of the rheology of hard-particle suspensions. Phys. Rev. Lett. 115, 088304.CrossRefGoogle ScholarPubMed
Han, E., Wyart, M., Peters, I. & Jaeger, H. 2018 Shear fronts in shear-thickening suspensions. Phys. Rev. Fluids 3, 073301.CrossRefGoogle Scholar
Hermes, M., Guy, B., Poon, W., Poy, G., Cates, M. & Wyart, M. 2016 Unsteady flow and particle migration in dense, non-Brownian suspensions. J. Rheol. 60, 905916.CrossRefGoogle Scholar
von Kann, S., Snoeijer, J. & van der Meer, D. 2013 Velocity oscillations and stop-go cycles: the trajectory of an object settling in a cornstarch suspension. Phys. Rev. E 87, 042301–14.CrossRefGoogle Scholar
LaFarge 2013 Superplasticizers: the wonder of fluid concrete, 38. Available at: https://www.youtube.com/watch?v=CSZxjQwDKF0.Google Scholar
Larsen, R., Kim, J.-W., Zukoski, C. & Weitz, D. 2010 Elasticity of dilatant particle suspensions during flow. Phys. Rev. E 81, 011502–8.CrossRefGoogle ScholarPubMed
Lin, N., Guy, B., Hermes, M., Ness, C., Sun, J., Poon, W. & Cohen, I. 2015 Hydrodynamic and contact contributions to continuous shear thickening in colloidal suspensions. Phys. Rev. Lett. 115, 228304.CrossRefGoogle ScholarPubMed
Lootens, D., Van Damme, H. & Hébraud, P. 2003 Giant stress fluctuations at the jamming transition. Phys. Rev. Lett. 90, 178301.CrossRefGoogle ScholarPubMed
Mari, R., Seto, R., Morris, J. & Denn, M. 2014 Shear thickening, frictionless and frictional rheologies in non-brownian suspensions. J. Rheol. 58, 16931724.CrossRefGoogle Scholar
Nagahiro, S.-I., Nakanishi, H. & Mitarai, N. 2013 Experimental observation of shear thickening oscillation. Europhys. Lett. 104, 28002.CrossRefGoogle Scholar
Nakanishi, H. & Mitarai, N. 2011 Shear thickening oscillation in a dilatant fluid. J. Phys. Soc. Japan 80, 033801–4.CrossRefGoogle Scholar
Nakanishi, H., Nagahiro, S. & Mitarai, N. 2012 Fluid dynamics of dilatant fluids. Phys. Rev. E 85, 011401–11.CrossRefGoogle ScholarPubMed
Ovarlez, G., Le, A., Smit, W., Fall, A., Mari, R., Chatté, G. & Colin, A. 2020 Density waves in shear-thickening suspensions. Sci. Adv. 6, eaay5589.CrossRefGoogle ScholarPubMed
Oyarte Galvez, L., van der Meer, D. & Pons, A. 2017 Dramatic effect of fluid chemistry on cornstarch suspensions: linking particle interactions to macroscopic rheology. Phys. Rev. E 95, 030602–6.CrossRefGoogle ScholarPubMed
Peters, I. & Jaeger, H.M. 2014 Quasi-2D dynamic jamming in cornstarch suspensions: visualization and force measurements. Soft Matt. 10, 65646570.CrossRefGoogle ScholarPubMed
Peters, I., Majumdar, S. & Jaeger, H. 2016 Direct observation of dynamic shear jamming in dense suspensions. Nature 532, 214217.CrossRefGoogle ScholarPubMed
Rathee, V., Blair, D. & Urbach, J. 2017 Localized stress fluctuations drive shear thickening in dense suspensions. Proc. Natl Acad. Sci. 114, 87408745.CrossRefGoogle ScholarPubMed
Rathee, V., Miller, J., Blair, D. & Urbach, J. 2022 Structure of propagating high-stress fronts in a shear-thickening suspension. Proc. Natl Acad. Sci. 119, e2203795119.CrossRefGoogle Scholar
Richards, J., Royer, J., Liebchen, B., Guy, B. & Poon, W. 2019 Competing timescales lead to oscillations in shear-thickening suspensions. Phys. Rev. Lett. 123, 038004.CrossRefGoogle ScholarPubMed
Saint-Michel, B., Gibaud, T. & Manneville, S. 2018 Uncovering instabilities in the spatiotemporal dynamics of a shear-thickening cornstarch suspension. Phys. Rev. X 8, 031006.Google Scholar
Sedes, O., Singh, A. & Morris, J. 2020 Fluctuations at the onset of discontinuous shear thickening in a suspension. J. Rheol. 64, 309319.CrossRefGoogle Scholar
Seto, R., Mari, R., Morris, J. & Denn, M. 2013 Discontinuous shear thickening of frictional hard-sphere suspensions. Phys. Rev. Lett. 111, 218301.CrossRefGoogle ScholarPubMed
Singh, A., Mari, R., Denn, M.M. & Morris, J.F. 2018 A constitutive model for simple shear of dense frictional suspensions. J. Rheol. 62, 457468.CrossRefGoogle Scholar
Waitukaitis, S. & Jaeger, H. 2012 Impact-activated solidification of dense suspensions via dynamic jamming fronts. Nature 487, 205209.CrossRefGoogle ScholarPubMed
Waitukaitis, S., Roth, L., Vitelli, V. & Jaeger, H. 2013 Dynamic jamming fronts. Europhys. Lett. 102, 44001.CrossRefGoogle Scholar
Wyart, M. & Cates, M. 2014 Discontinuous shear thickening without inertia in dense non-brownian suspensions. Phys. Rev. Lett. 112, 098302.CrossRefGoogle ScholarPubMed
Figure 0

Figure 1. Experimental set-up. (a) Sketch of the set-up. (b) Typical view of the cylinder (red), tracer-seeded suspension layer (black and white background) and measured flow field (arrows).

Figure 1

Figure 2. Rheology of the suspension. (a) Shear stress vs shear rate for different volume fractions, $\phi$. (b) Frictionless and frictional viscosity branches obtained from low and high shear-rate measurements, respectively. (a,b) Symbols stand for measurements with the small-gap cylindrical Couette device. Lines show the fitting Wyart–Cates law (see text).

Figure 2

Figure 3. The two regimes of cylinder motion ($\phi = 0.44 > \phi _{DST}$). (a) Applied torque vs angular velocity of the cylinder for a slowly increasing ramp of applied torque ($h = 15$ mm). (b) Time evolution of the cylinder speed for constant torques applied at $t=0$ s ($\varGamma /\varGamma _c = 0.36$, 0.72, 1.07, 1.43 and 1.79, highlighted by dashed lines in (a)). See also supplementary movie 1.

Figure 3

Figure 4. Low-torque steady regime: local rheology and onset of unsteadiness ($h=15$ mm). (a) Steady velocity field around the cylinder for a constant applied torque $\varGamma = 0.30 \varGamma _c$. (b) Radial profiles of the azimuthal velocity for $\varGamma /\varGamma _c = 0.35$, 0.70 and 1.10. Solid lines: Newtonian profiles given by (3.1). (c) Corresponding local shear stress vs local shear rate. Solid line: Wyart–Cates flow rule fitting the global rheometry in figure 2 ($\phi =0.44$). Red dashed line: onset shear stress of discontinuous shear thickening, $\sigma _c$.

Figure 4

Figure 5. High-torque unsteady regime. (a) Long-time evolution of the cylinder velocity (rheometer measurements, $\varGamma = 3.5 \varGamma _c, h = 35$ mm). Solid-line: (3.3) for the acceleration phases. (b,c) Focus on a deceleration phase resolved with high-speed imaging. Here, $t=0$ stands for the onset of deceleration ($\dot {\varOmega }=0$). (b) Cylinder velocity normalized by the velocity, $\varOmega _c$, at the deceleration onset. (c) Deceleration (left-hand vertical axis) and shear stress at the cylinder surface normalized by the discontinuous shear-thickening stress, $\sigma _c$ (right-hand).

Figure 5

Figure 6. Spatio-temporal analysis of a deceleration phase ($\varGamma = 3.5\varGamma _c, h=35$ mm). (a) Velocity fields at $t= 8$, 28, 48 and 68 ms after the cylinder has started decelerating ($t=0$, see also supplementary movie 2). Colour encodes the relative norm of the velocity, $\sqrt {u_\theta ^2 + u_r^2}/R\varOmega _c$. (b) Radial profiles of the azimuthal velocity component in the direction where the thickening front nucleates and propagates (white arrow in a). (ce) Time evolution of the thickening front position (c), of the cylinder velocity normalized by the deceleration onset velocity (d) and of the cylinder deceleration rate (e). Red dashed line: arrival time, $t_{out}$, of the front at the outer (vessel) wall. Green-dashed line: release time, $t_{rel}$, at which the next acceleration phase starts.

Figure 6

Figure 7. Early part of the deceleration phase: maximal deceleration. (a) Normalized maximal deceleration of the cylinder or, equivalently, maximal shear stress in the suspension vs thickness of the suspension layer.(b) Maximal deceleration time normalized by the front arrival time at the outer wall, $t_{out}$, vs $h$. (c) Normalized velocity of the cylinder during a deceleration phase ($h=35$ mm). Insets from top to bottom: cylinder velocity at the onset of deceleration, front velocity and front angular width, ${\rm \Delta} \theta$, vs $h$. (ac) The pink solid lines show ((3.7)–(3.10a,b)) with $t_{out} = (R_{out}-R)/V_{f}$ for a homogeneous nucleation of the thickening front ($R_{f}(t) /R = 1+V_{f} t$). The black dashed lines show the same equations for a localized nucleation ($R_{f}(t) /R = 1+\sqrt {L^2+(V_{f} t)^2}-L$ with $L^2=R^2+(h/2)^2$, see text).

Figure 7

Figure 8. Late part of the deceleration phase: release. (a) Velocity profiles in the suspension (azimuthal velocity component, same direction as in figure 6) between the front arrival time, $t_{out}$ ($R_{f} = R_{out}$), and the release time, $t_{rel}$ (onset of re-acceleration, $\dot {\varOmega } = 0$). (b) Release velocity. The mean observed value is $\varOmega _{rel} \simeq 0.24 \varOmega _c$. (c) Release time relative to the front arrival time (time origin at the onset of the deceleration phase). Symbols: experiments. The solid line indicates the upper bound $t_{rel} \leq 2t_{out}$ of (3.15), see text. The mean observed value is $t_{rel} \simeq 2.0t_{out}$.

Figure 8

Figure 9. Effective drag of the suspension. (a) The local rheological flow rule is strongly re-entrant for $\sigma >\sigma _c$. (b) The average cylinder velocity, $\langle \varOmega \rangle$, is marginally re-entrant for $\varGamma > \varGamma _c$: it essentially saturates at a value of order $\varOmega _c \approx \dot {\gamma }_c/2$ because of the periodic instability of the suspension flow. Solid line: average velocity, $\tau ^{-1}\int _0^\tau \varOmega (t)\, \mathrm {d} t$, expected from (3.3) with $\varOmega _{rel} = \varOmega _c/4$ (i.e. $t'=({I}/{4{\rm \pi} \eta _0 h R^2})\ln (1-{\varGamma _c}/{4\varGamma })$). Symbols: measurements obtained for an increasing ramp of applied torque (short-time averaging of the data of figure 3(a)).

Rocha et al. Supplementary Movie 1

Real-time movie showing the typical behaviour observed in the high-torque unsteady regime, for a layer of cornstarch suspension subjected to a constant torque ( $\phi = 0.44$, $h = 8$\,mm, $\Gamma = 3.5\Gamma_c$) .

Download Rocha et al. Supplementary Movie 1(Video)
Video 45.2 MB

Rocha et al. Supplementary Movie 2

Movie of the thickening-front propagation observed during the cylinder deceleration phase ( $\phi = 0.44$, $h = 35 mm$, $\Gamma = 3.5 \Gamma_c$, same as Fig. 6). The movie starts at the onset of cylinder deceleration ($t = 0$) and finishes at the release time ($t = 124$ ms), when the cylinder starts re-accelerating. Arrows indicate the suspension velocity. Colour encodes the relative norm of the velocity $\sqrt{u_\theta^2 + u_r^2}/R\Omega_c$.

Download Rocha et al. Supplementary Movie 2(Video)
Video 7.8 MB