Introduction
The search for potentially habitable planets around other stars has advanced significantly in recent years. As the precision of radial velocity searches has improved, the detection limits have reached into the regime where planets are thought to be too small to be genuine gaseous planets. Furthermore, estimates of the incompleteness of such searches suggest that planetary systems composed of low mass planets may be significantly more common than those with Jovian class planets in short period orbits (Howard et al. Reference Howard2010; Mayor et al. Reference Mayor2011). The launch of the Kepler satellite has also unearthed a substantial catalogue of planetary candidates with radii indicative of small planets (Borucki et al. Reference Borucki2011; Batalha et al. Reference Batalha2013), including several candidates at sufficiently long periods to potentially qualify as habitable (Barclay et al. Reference Barclay2013; Borucki et al. Reference Borucki2013).
The origins of such plentiful systems of lower mass planets are still somewhat uncertain. There are a significant number of planets in the Neptune-size category, which are difficult to produce, on these scales, in models based on the concept of planetary migration (Ida & Lin Reference Ida and Lin2008; Mordasini et al. Reference Mordasini, Alibert and Benz2009). Furthermore, the period ratios in the multiple planet systems detected by Kepler (Lissauer et al. Reference Lissauer2011; Fabrycky et al. Reference Fabrycky2012) are broadly distributed, contrary to predictions of migration models (Alibert et al. Reference Alibert2006; Terquem & Papaloizou Reference Terquem and Papaloizou2007; Raymond et al. Reference Raymond, Barnes and Mandell2008; Mordasini et al. Reference Mordasini, Alibert and Benz2009; Ida & Lin Reference Ida and Lin2010), which anticipated a preference for commensurabilities. This has led to an alternative proposal that such systems assemble in situ (Hansen & Murray Reference Hansen and Murray2012, Reference Hansen and Murray2013; Chiang & Laughlin Reference Chiang and Laughlin2013), although adjustments to the migration scenario have also been proposed (Rein Reference Rein2012; Goldreich & Schlichting Reference Goldreich and Schlichting2014).
The bulk of the attention thus far has been focused on solar-type stars, both for the obvious anthropocentric reasons and because the observational samples are dominated by such stars. Lower mass stars, M-dwarfs, are disfavoured by virtue of their lower luminosities, high activity levels, and redder spectra (which reduce radial velocity accuracy). On the other hand, M-dwarfs are smaller and therefore are attractive transit survey targets, as smaller planets obscure a larger fraction of the star than of a G-dwarf during transit. Furthermore, the lower stellar luminosity also implies that the habitable zone (HZ) is closer to the star and so easier to study via transits because of the shorter orbital period and greater transit depths. As a result, several groups have recently begun to quantify the sample of transiting systems that orbit M-dwarfs in the Kepler data (Mann et al. Reference Mann, Gaidos, Lepine and Hilton2012; Muirhead et al. Reference Muirhead, Hamren, Schlawin, Rojas-Ayala, Covey and Lloyd2012; Dressing & Charbonneau Reference Dressing and Charbonneau2013). Therefore, in this paper we explore the predictions of an in situ assembly model for M-dwarf planetary systems, adapting the in situ assembly model of Hansen & Murray (Reference Hansen and Murray2013) – hereafter HM13 – to the environs of a 0.5 M ⊙ star. We compare these with the sample of transiting planet candidates defined by Dressing & Charbonneau (Reference Dressing and Charbonneau2013) – hereafter DC13. In the section “Observations”, we will quantify the observational sample and use this to estimate the initial conditions necessary for our theoretical model. In the section “Model”, we then describe the construction of our theoretical model for in situ assembly and its comparison for the data.
Observations
Howard et al. (Reference Howard2012) noted an increasing incidence of short period, low mass planets as the effective temperature of the Kepler host stars decreased. This suggests that the environs of M-dwarfs are an encouraging place to search for planets. However, the stellar parameters for the coolest stars in the Kepler Input Catalogue are somewhat uncertain because the Kepler stellar characterization was optimized for solar-like stars. Several groups have recently attempt to remedy this by a variety of means. Muirhead et al. (Reference Muirhead, Hamren, Schlawin, Rojas-Ayala, Covey and Lloyd2012) and Mann et al. (Reference Mann, Gaidos, Lepine and Hilton2012) have performed spectroscopic characterizations which reveal, among other things, that the brightest of the cool Kepler stars are primarily giants, and that the dwarfs dominate the fainter part of the cool star luminosity function. DC13 have performed a comprehensive comparison of stellar models with the available photometry to properly delineate the cool star planet sample, and we will henceforth use their catalogue of planets and planet properties as our comparison set.
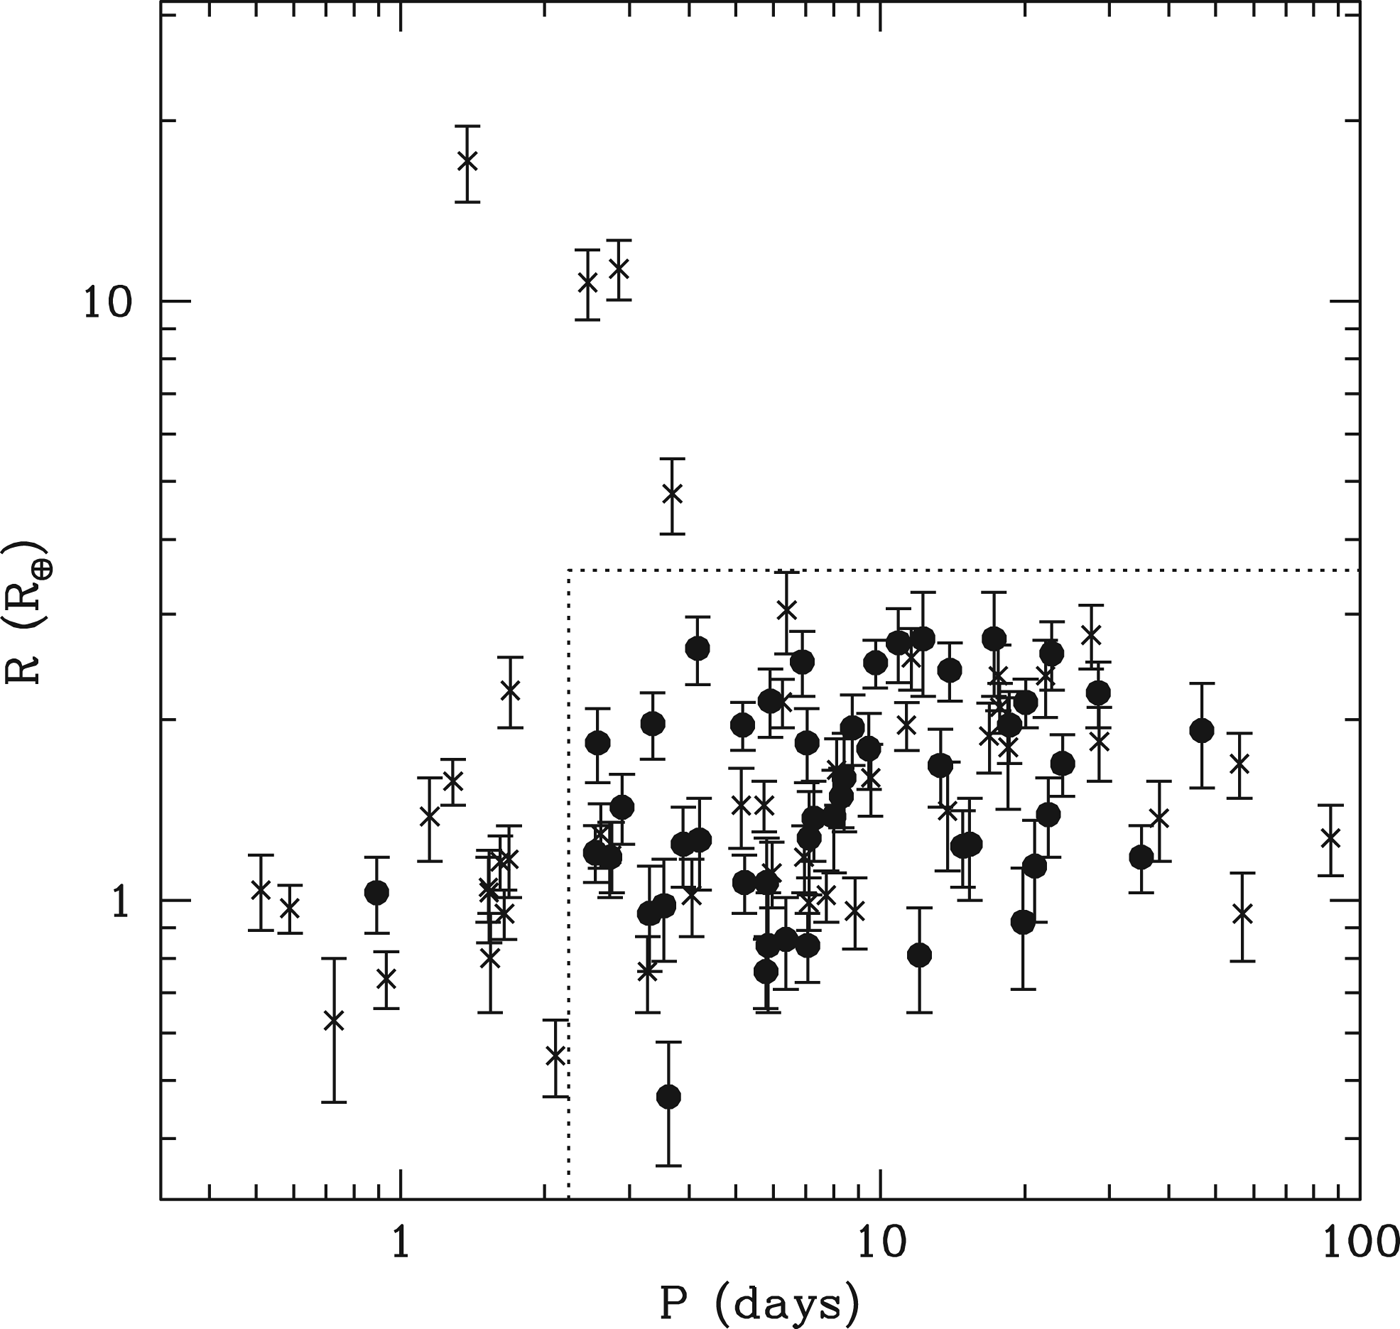
The resulting planetary catalogue is shown in Fig. 1, showing candidate period versus radius. Solid points indicate planets in systems with multiple transiting planets, while the crosses indicate systems in which only a single planet transits. We see that the catalogue contains four planets with radii >3.5 R ⊕, which appear to represent an extension of the hot Jupiter sample to low planet masses. Furthermore, we see that planets with P<2.2 days are also overwhelmingly single (13/1 for R<3.5 R ⊕), in contrast to planets found at larger radii. Anticipating the result that our model will lead primarily to multiple planet systems, composed of primarily rocky planets, we will focus our attention on the sample enclosed by the dotted line in Fig. 1, namely P>2.2 days and R<3.5 R ⊕.

Fig. 1. The solid points show the planets from the DC13 catalogue that are found in multiple systems. The crosses show the planets found in single systems. The dotted line encloses the sample used to calculate the multiplicity statistics used in the text to compare the model to observations.
Protoplanetary disk parameters
Our working hypothesis is that the final planetary system is a consequence of the gravitational assembly from an initial disk of planetary embryos. Such a disk could arise from genuine in situ sedimentation, by the inspiral of smaller particles by aerodynamic drag and subsequent growth, or by embryo inspiral due to protoplanetary nebula torques. Our model is restricted to the final stage of assembly, which we assume is dominated by the gravitational interactions between the embryos. In the case of planetary systems around G stars, the characteristic benchmark disk is the minimum mass solar nebula (Weidenschilling Reference Weidenschilling1977), although the currently observed systems often require substantially more mass than is found in our own solar system (Hansen & Murray Reference Hansen and Murray2012, HM13; Chiang & Laughlin Reference Chiang and Laughlin2013). In the case of M dwarfs, we need guidance from a different set of observations. To that end, we repeat the analysis of Chiang & Laughlin, but restricted to the cool star sample of DC13, in order to construct an equivalent initial density profile using the Kepler data.
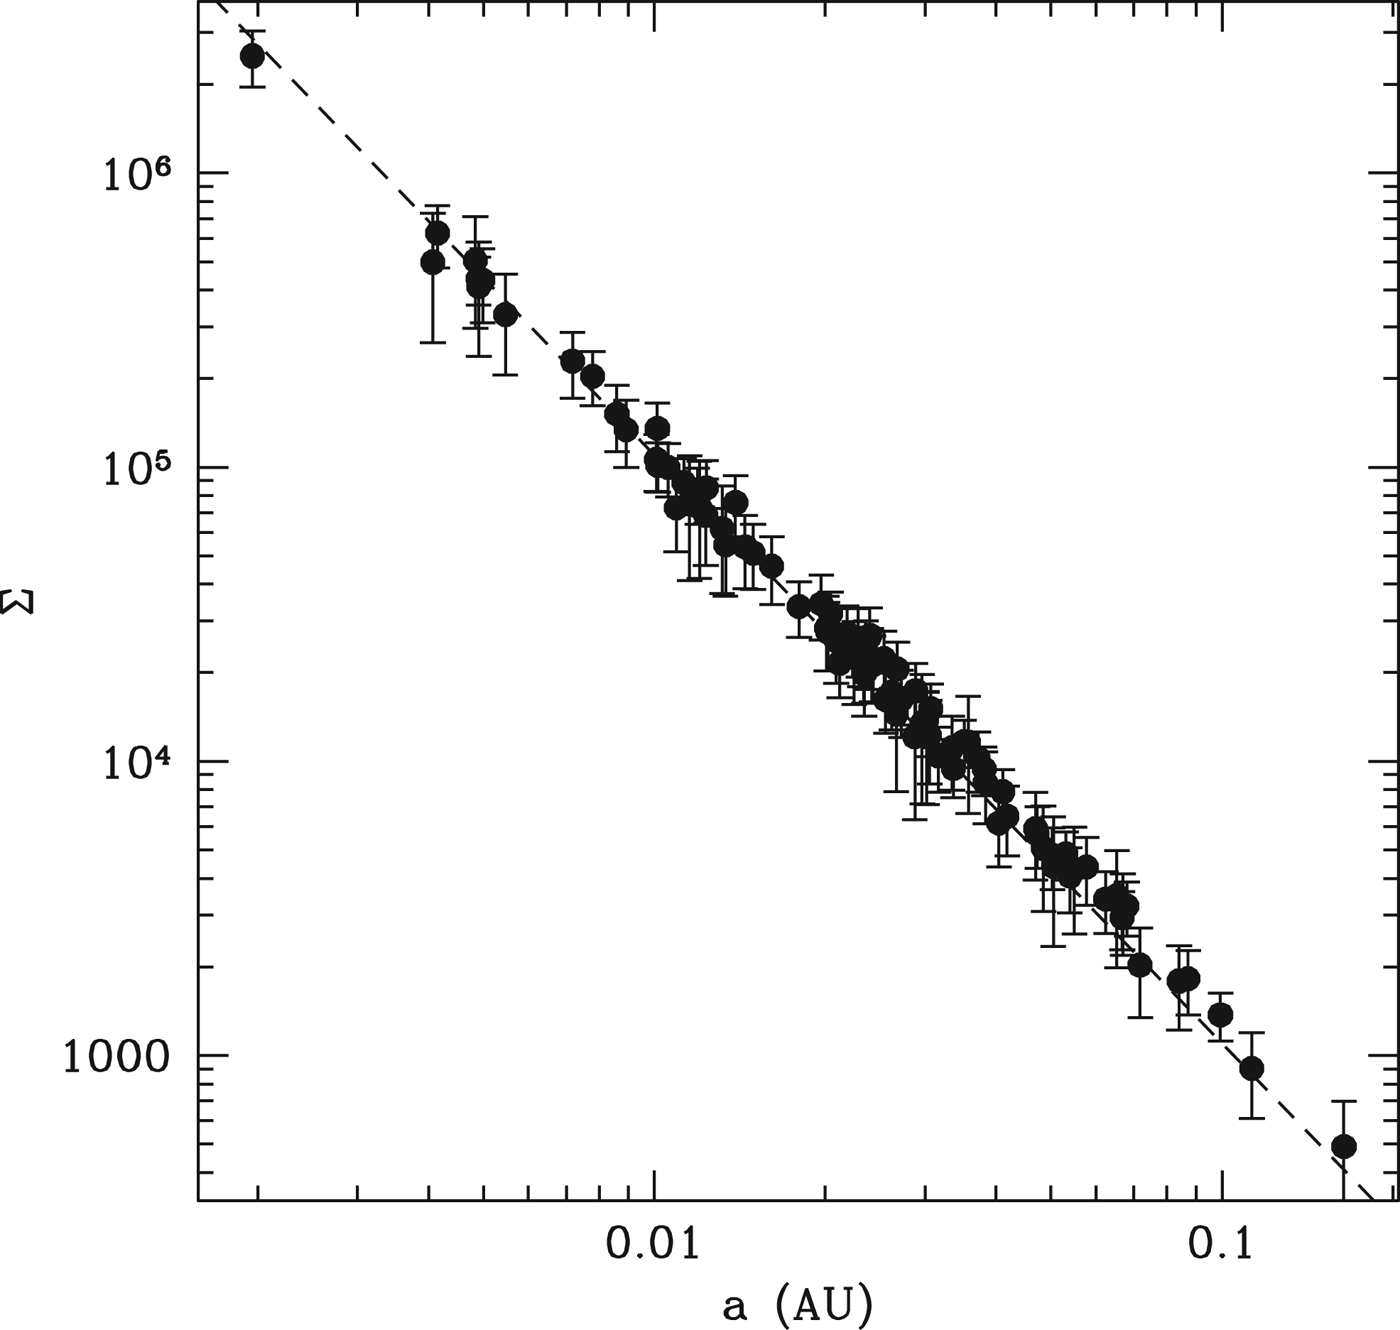
In order to derive a surface density profile ∑=M p/2πa p Δa p, we need to estimate M p from the planetary radius and the relative proportion of Δa p/a p. Chiang & Laughlin used the mass-radius relation from Lissauer et al. (Reference Lissauer2011), M p=(R p/R ⊕)2.06. However, this is based on an interpolation between the terrestrial planets and the ice giants of the solar system. The bulk of the planets in Fig. 1 have R<3 R ⊕, so we expect these to be predominantly rock planets. Furthermore, observations suggest that many low-mass planets have hydrogen atmospheres large enough to significantly inflate the radius while not increasing the mass substantially. Thus, we instead adopt a simpler estimate that all the planets in this sample have mass ~1 M ⊕, regardless of the observed radius. We also estimate Δa/a~0.4. This latter number assumes an average planetary mass of 1 M ⊕ around an average stellar mass of 0.5 M ⊙, and that the spacing, Δ, between planets ~50, when measured in terms of mutual Hill radii. This is a conservative estimate, as Δ~50 represents the most widely spaced pairs produced by our assembly simulations, but can partially compensate for any underestimate in the planetary mass. Estimating ∑ in this fashion, we find the profile shown in Fig. 2, and fit it with a disk surface density profile
which yields a mass of 6 M ⊕ from 0.05 to 0.5 AU. For a solar metallicity disk, this implies an original protoplanetary disk ~10−3 M ⊙, which indicates that we need not invoke early radial migration of solids to enhance our planetesimal inventory as in the case of some planetary systems (Hansen & Murray Reference Hansen and Murray2012).

Fig. 2. The points represent the surface density ∑ calculated for each of the planets in the DC13 catalogue, as described in the text. The resulting ∑∝R −2 model is shown as a dashed line.
Model
As in HM13, we begin our integrations at the end of the oligarchic assembly phase, using the equations of Kokubo & Ida (Reference Kokubo and Ida1998) to specify the distribution of the initial planetary embryos in mass and semi-major axis. For a density profile that drops off as the square of the distance, this results in a fixed initial embryo mass ~0.26 M ⊕ and a total initial population ~27 (we allow for a small random fluctuation in the location of the inner embryo, which in turn results in a small variation in the embryo mass across simulations in order to maintain the 6 M ⊕ total disk mass). We adopt an inner edge for the disk ~0.05 AU, so that some small scatter in the final locations of observed planets will produce a sample with a>0.03 AU (the inner edge of our observed sample). Initial orbits are assumed to be circular and the dispersion in inclinations is ~1°. The time step is now reduced to 6 h because of the small inner edge. The central star is taken to be 0.5 M ⊙ and the stellar radius to be 0.5 R ⊙, in order to correspond to the median host mass in the DC13 sample. We also assume that there are no giant planets at long distances, so that the rocky planets assemble only under their mutual gravitational interaction.
We note that the chosen inner edge is larger than the dust sublimation radius calculated by Swift et al. (Reference Morton and Swift2013), who argued against in situ formation based on the fact that a candidate planet in the Kepler-32 system is found interior to this radius. However, the bulk of the planets in the multiple planetary systems sample lie well exterior to this boundary, suggesting that Kepler-32f may be an outlier. The fact that it is also smaller than the other planets in the system argues in favour of a model in which it was scattered inwards after building up to planetary size, as has been suggested for Mercury in our solar system (e.g. Hansen Reference Hansen2009).
Integrations
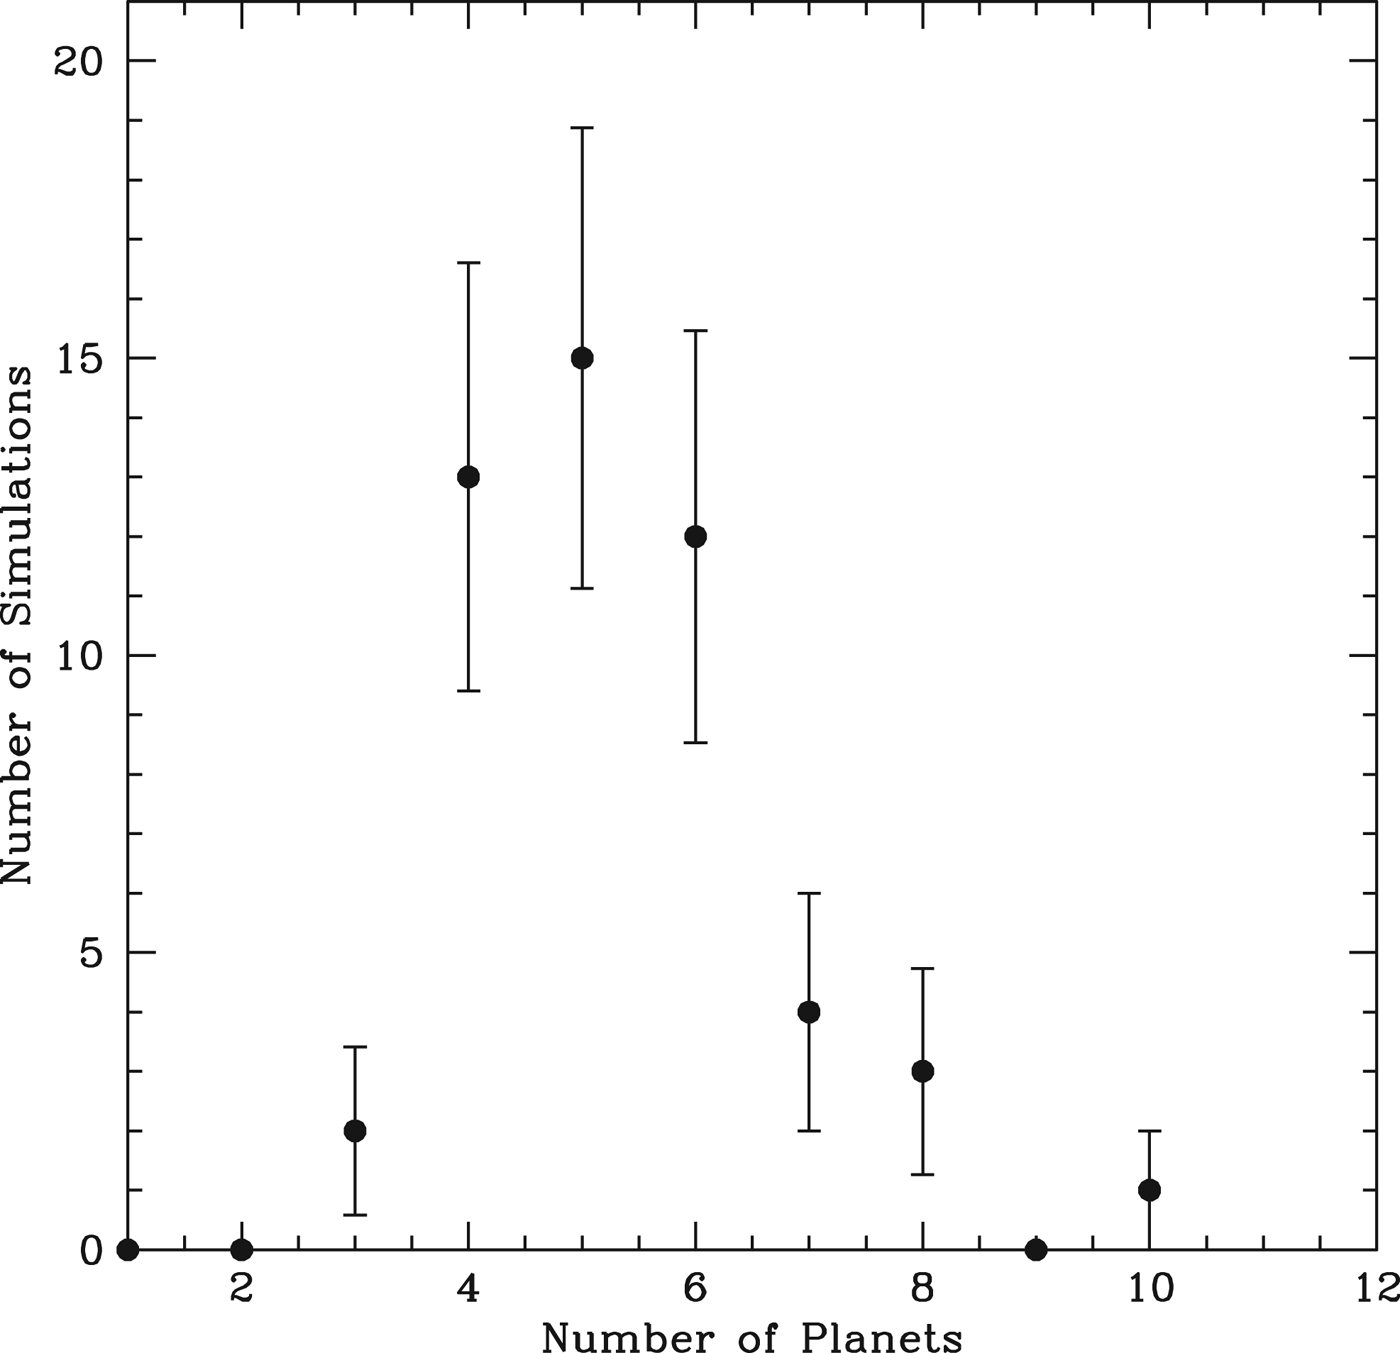
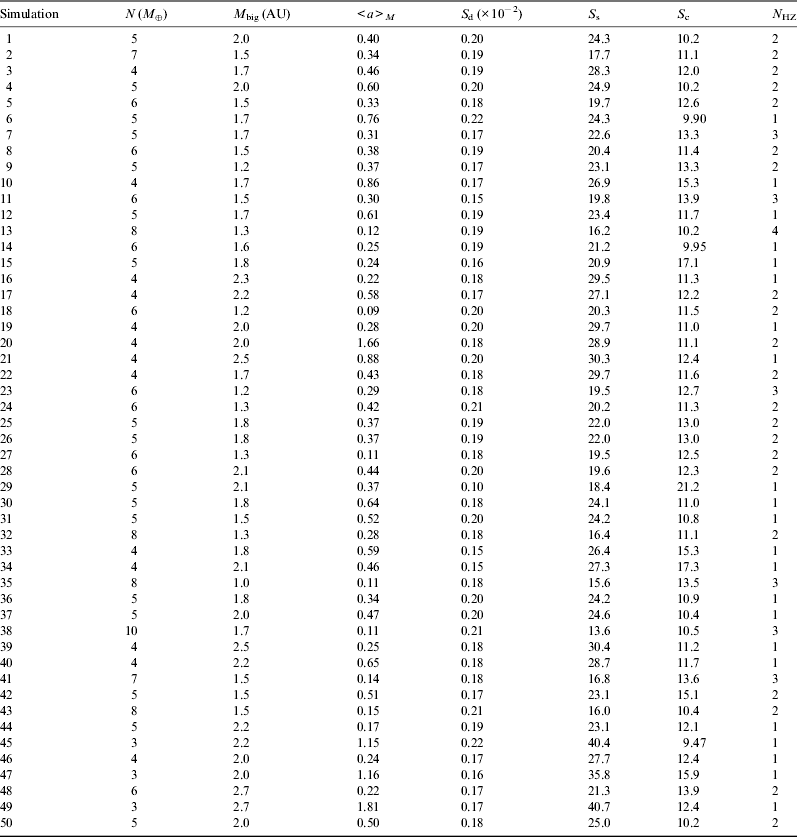
We integrate 50 realizations of this model using the Mercury integrator (Chambers Reference Chambers1999). The simulations are run for 107 years and then we examine the ensemble properties, several of which are tabulated in Table 1. Figure 3 shows the distribution of the number of surviving planets with semi-major axis <0.5 AU. We see that most systems comprise between 4 and 6 surviving planets inside 0.5 AU, although the largest number goes as high as 10. Figure 4 compares the results of these simulations with 50 realizations of the model of HM13 – the equivalent for solar-type stars. We see that the M-dwarf planetary systems have separations similar to the solar-type case (when measured in terms of mutual gravitational influence), but are somewhat more circular and coplanar. This also indicates that the system configurations are dynamically stable at this point and unlikely to evolve significantly on longer timescales, because there is not sufficient angular momentum deficit in the systems (Laskar Reference Laskar1997) to facilitate orbit crossing. Although tidal damping can damp secular eccentricity oscillations in the system (Wu & Goldreich Reference Wu and Goldreich2002; Greenberg & van Laerhoven Reference Greenberg and van Laerhoven2011; Laskar et al. Reference Laskar, Boué and Correia2012), this does not affect the planetary spacing and we assume that the resulting ensemble properties reflect the long-lived state of the systems.

Fig. 3. The points indicate the distribution of the final multiplicities of the simulated systems. For each simulation, we calculated the number of surviving planets with a semi-major axis <0.5 AU, after 10 Myr. Every system contains at least three surviving planets, with most systems having between four and six.

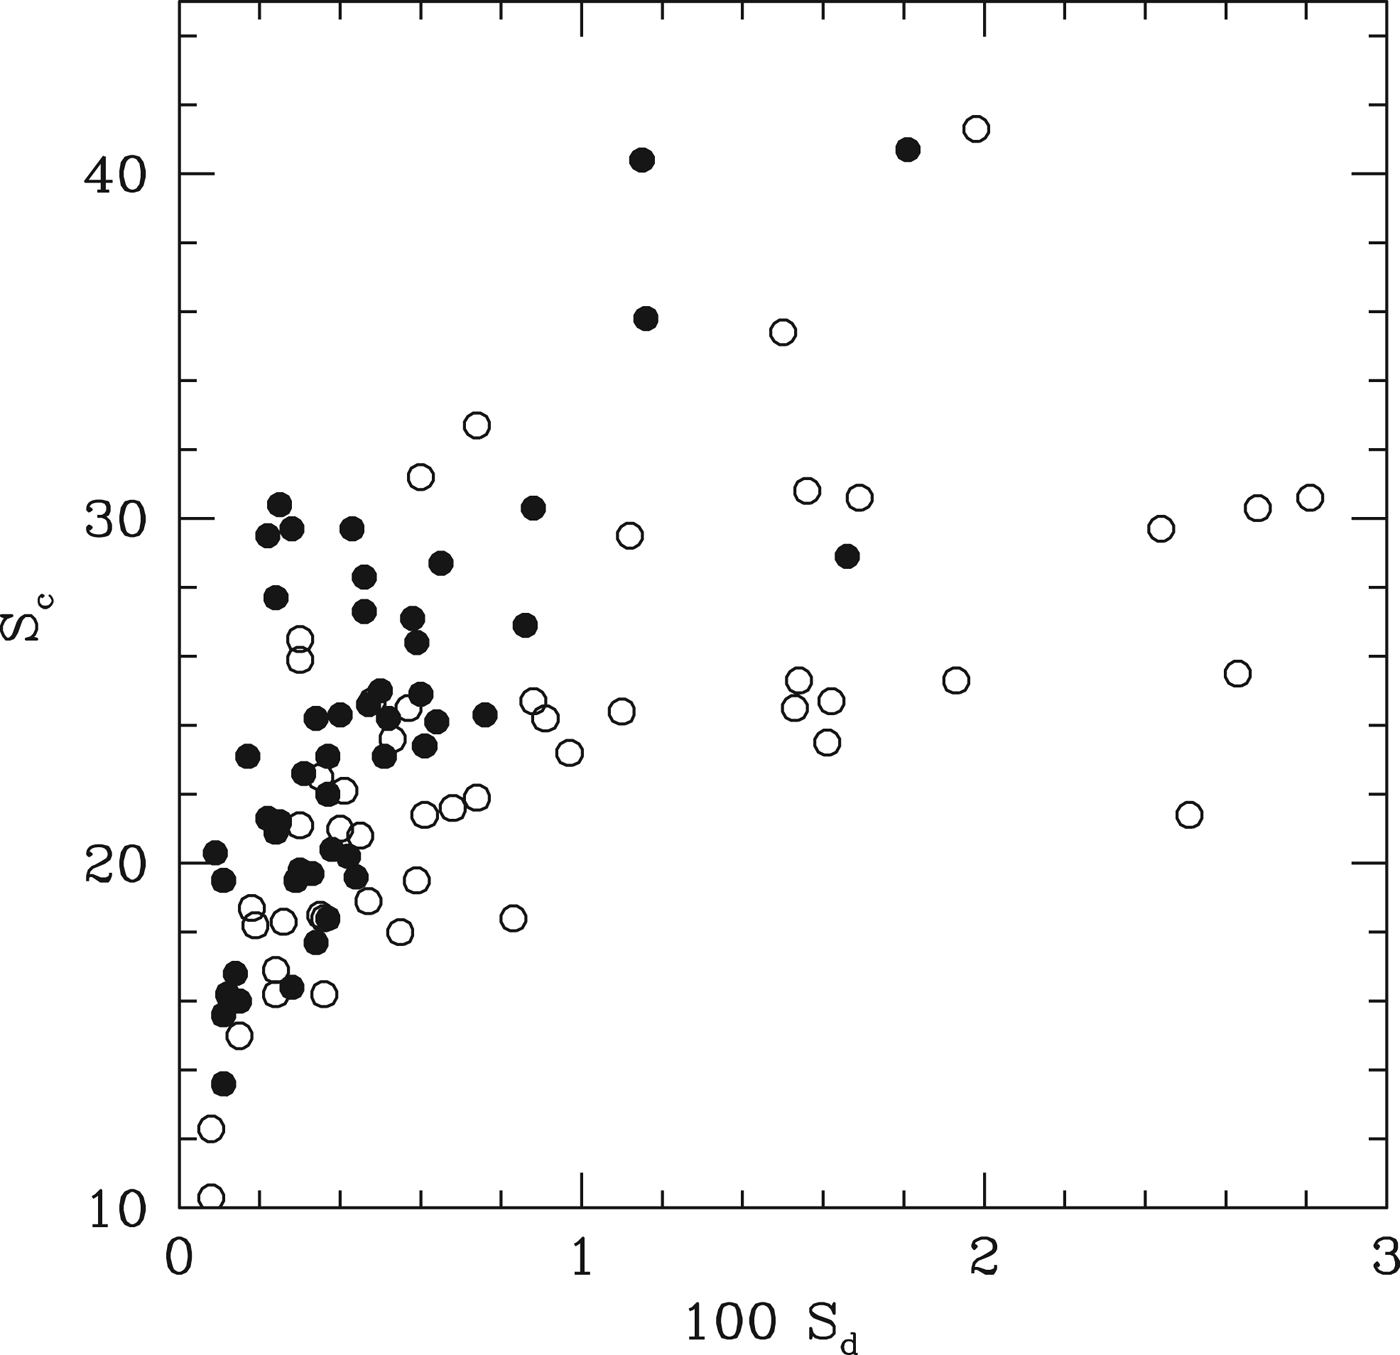
Fig. 4. The open circles show the statistics S d (a measure of how circular/coplanar a planetary system is) and S c (a measure of how closely packed a system is) for 50 realizations of the planetary system model in HM13. The filled circles are the same measures but for the 50 realizations of the model in this paper. We see that the M-star planetary systems are more circular and coplanar but with similar spacing.
Table 1. Final states of assembly simulations

The columns show the number N of final planets with a semi-major axis <0.5 AU, the mass of the largest planet, and the four statistical measures <a>M (mass weighted semi-major axis), S d (angular momentum deficit – a measure of deviation from circular, coplanar orbits), S s (a measure of how closely spaced the planets are in terms of gravitational influence) and S c (a measure of how bunched/spread out the mass distribution is). The final column shows N HZ, the number of surviving planets with semi-major axis between 0.23 and 0.44 AU (our nominal HZ).
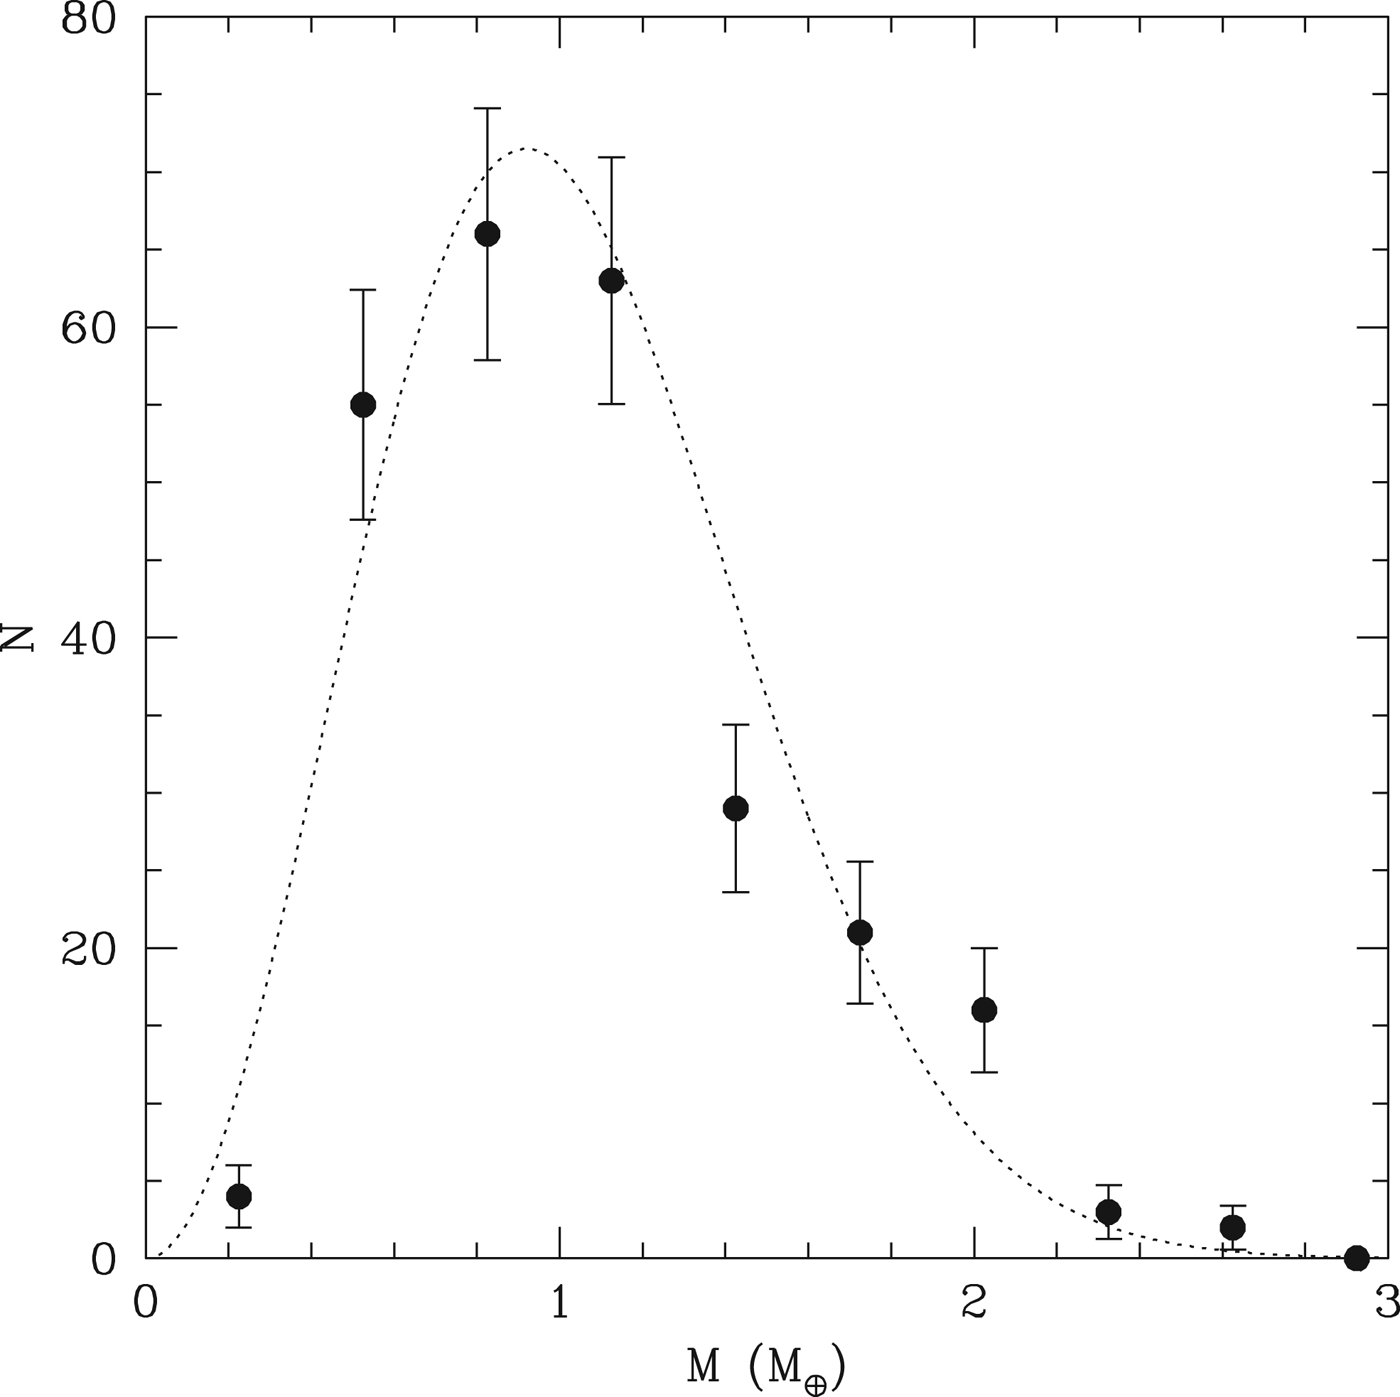
We use the results of these simulations to generate input distributions for a Monte Carlo population synthesis model. Figure 5 shows the mass distribution of the surviving planets. There is little trend of planet mass with semi-major axis, and so we model this distribution as
as shown in the figure. We have not attempted to match all the features of the observed histogram as some of the structure is the result of the coarseness of our mass resolution (recall our embryo mass ~0.26 M ⊕).

Fig. 5. The points are obtained by binning up the surviving planets inside 1 AU over all the simulated runs. There is no significant trend with a semi-major axis. The dotted line is a model of this distribution that is used to generate the Monte Carlo model. The shape of the distribution is reminiscent of that inferred from the observed radius distribution (DC13, Morton & Swift Reference Morton and Swift2013).
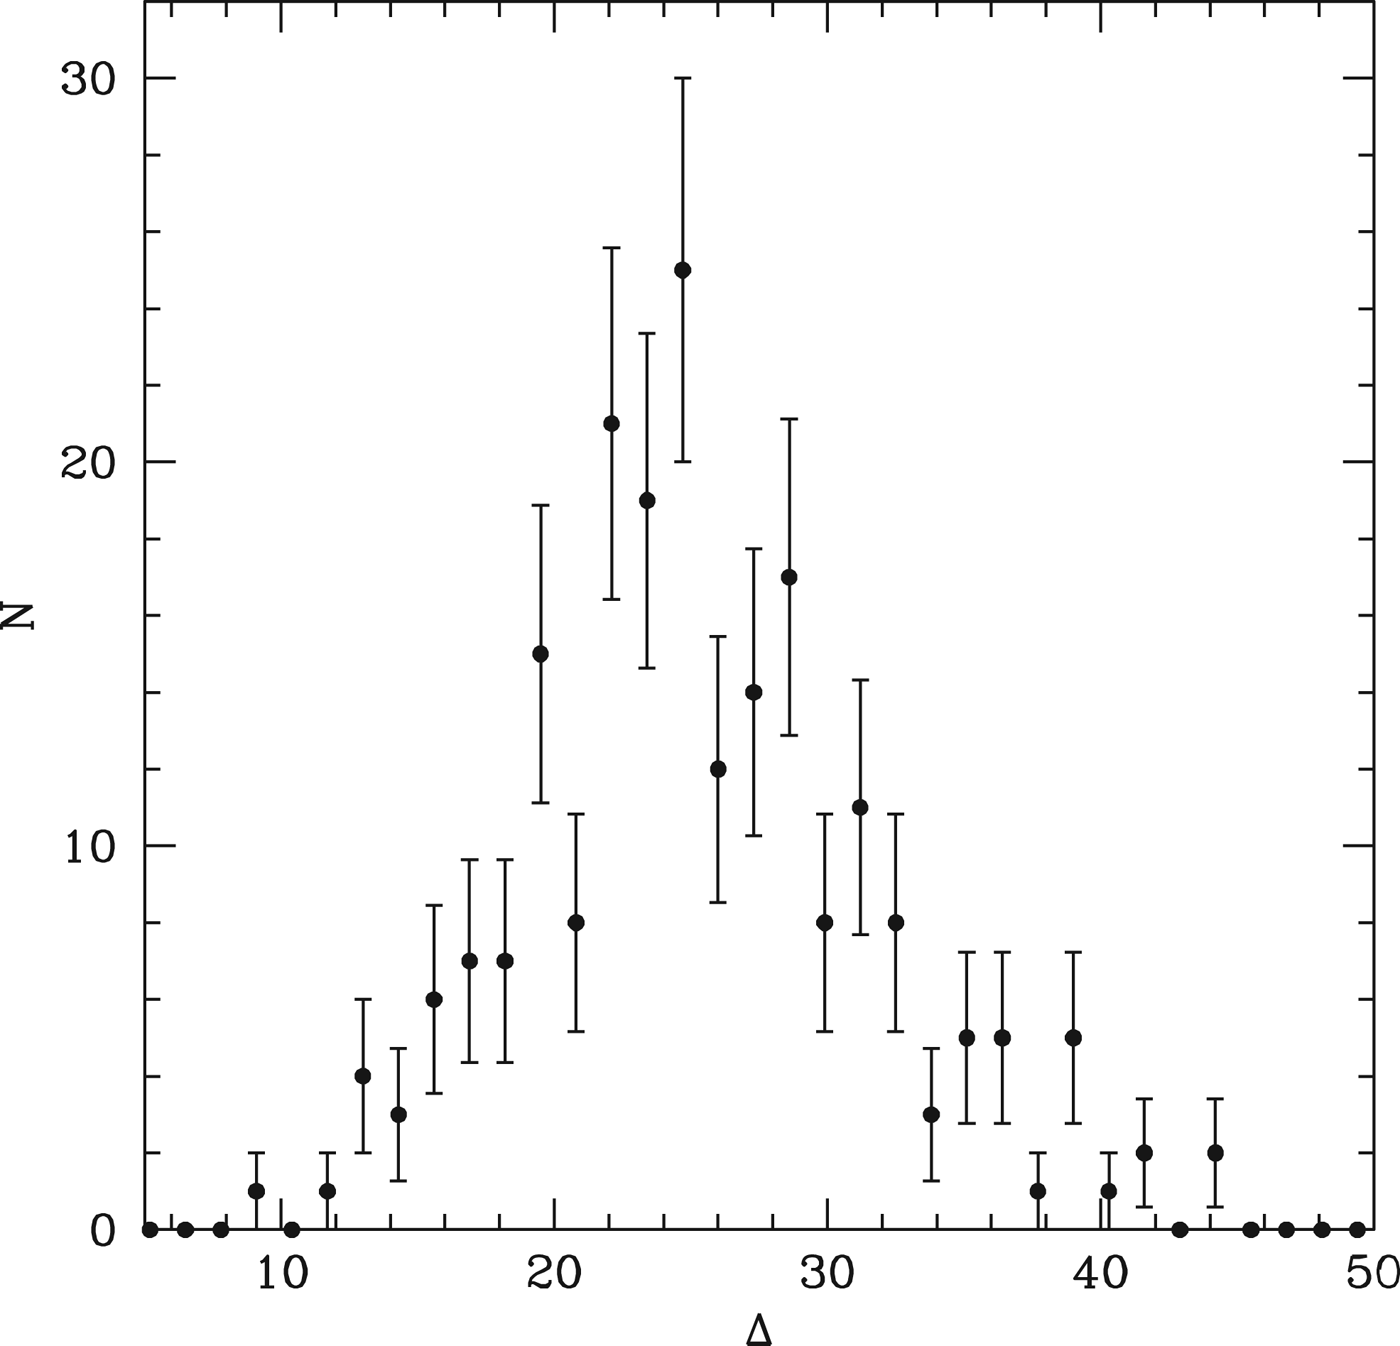
The spacing of the final planets is similar to those of the higher mass systems (HM13), when expressed in units of the mutual Hill radius, i.e. Δ=2(a 2−a 1)/(a 2+a 1)/((M 1+M 2)/3M *)1/3. Figure 6 shows the resulting distribution of planet pairs. We see that the distribution peaks between Δ~20–25, and spans the range 12<Δ<45. For the purposes of the Monte Carlo model, however, the distribution of orbital separations δ=2(a 2−a 1)/(a 2+a 1) is used, namely
 $$p_\delta (x) \sim {\rm exp}\left( { - \displaystyle{1 \over 2}\left( {\displaystyle{{x - 0.4} \over {0.2}}} \right)^2} \right).$$
Fig. 6. The points show the distribution of Δ for planet pairs in the simulations which survive to 10 Myr and have a<0.5 AU. The peak at Δ~25 is similar to the distribution obtained for higher mass systems in HM13.
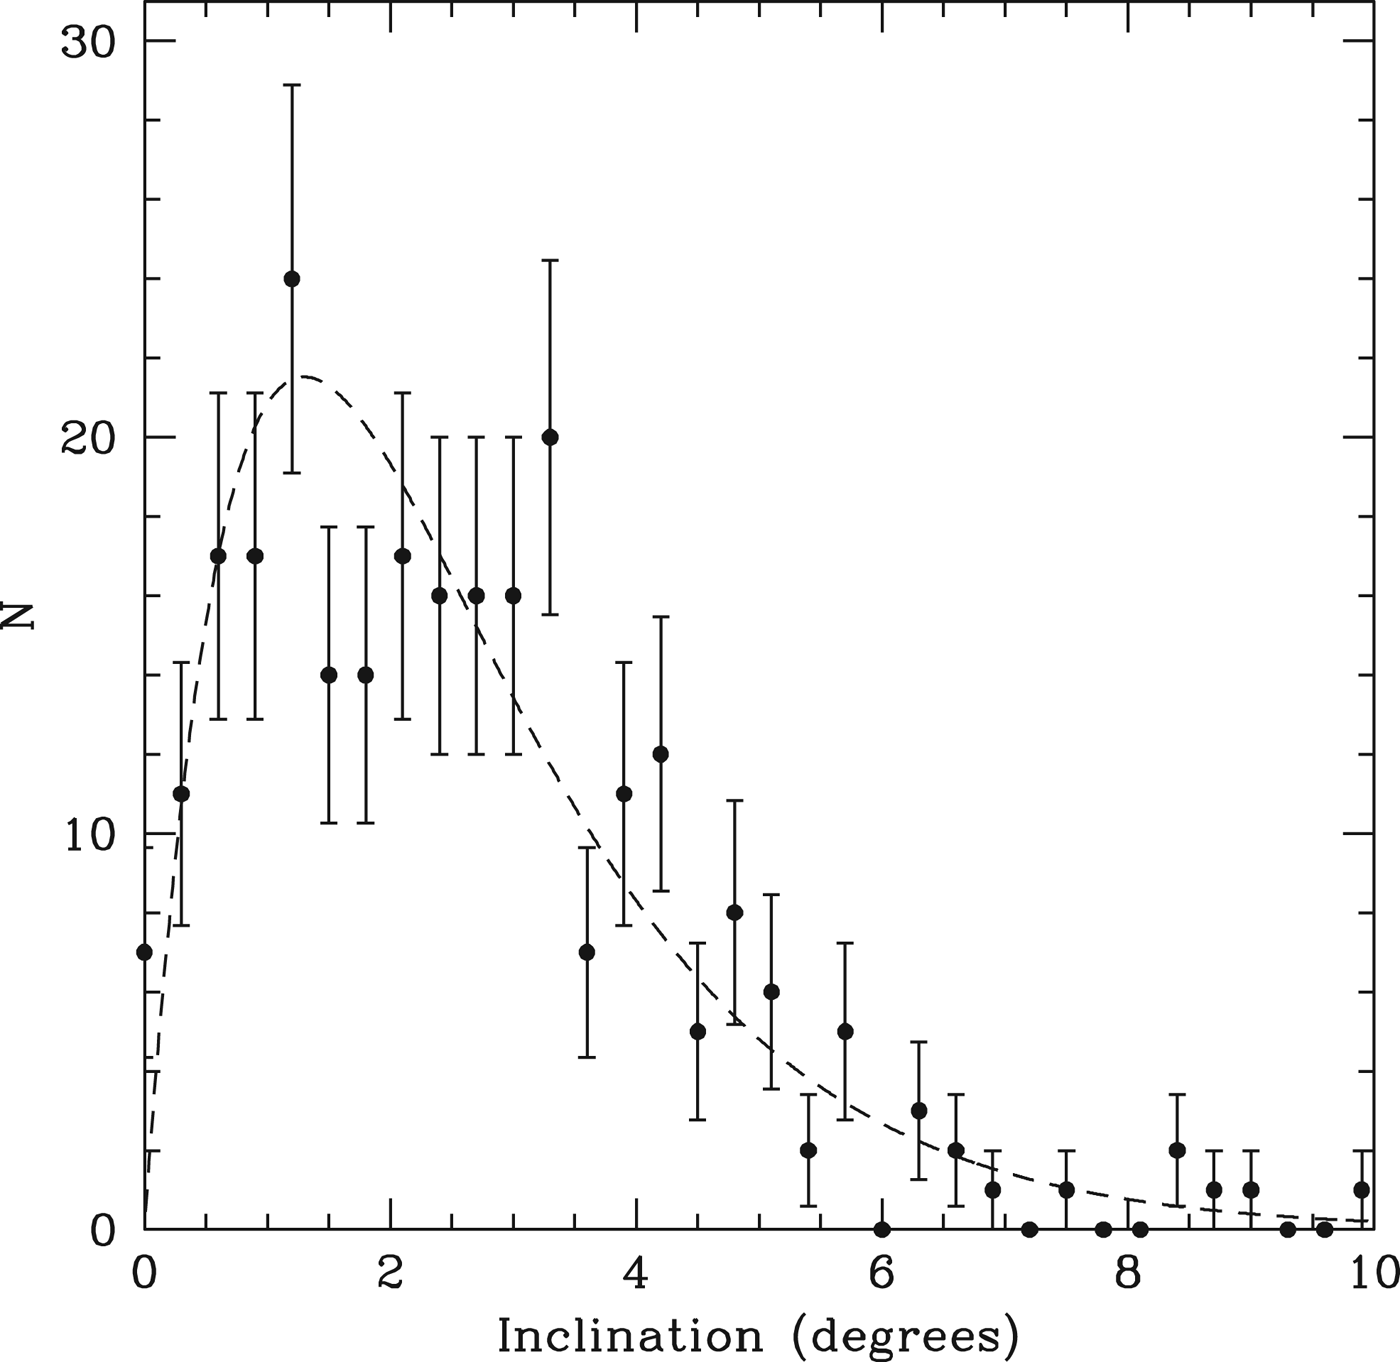
The inclination dispersion, relative to the original orbital plane, is shown in Fig. 7, and is well characterized by

Fig. 7. The points show the inclinations of surviving planets in the simulations, measured relative to the original orbital plane. The dashed line is used to simulate this in the Monte Carlo model.
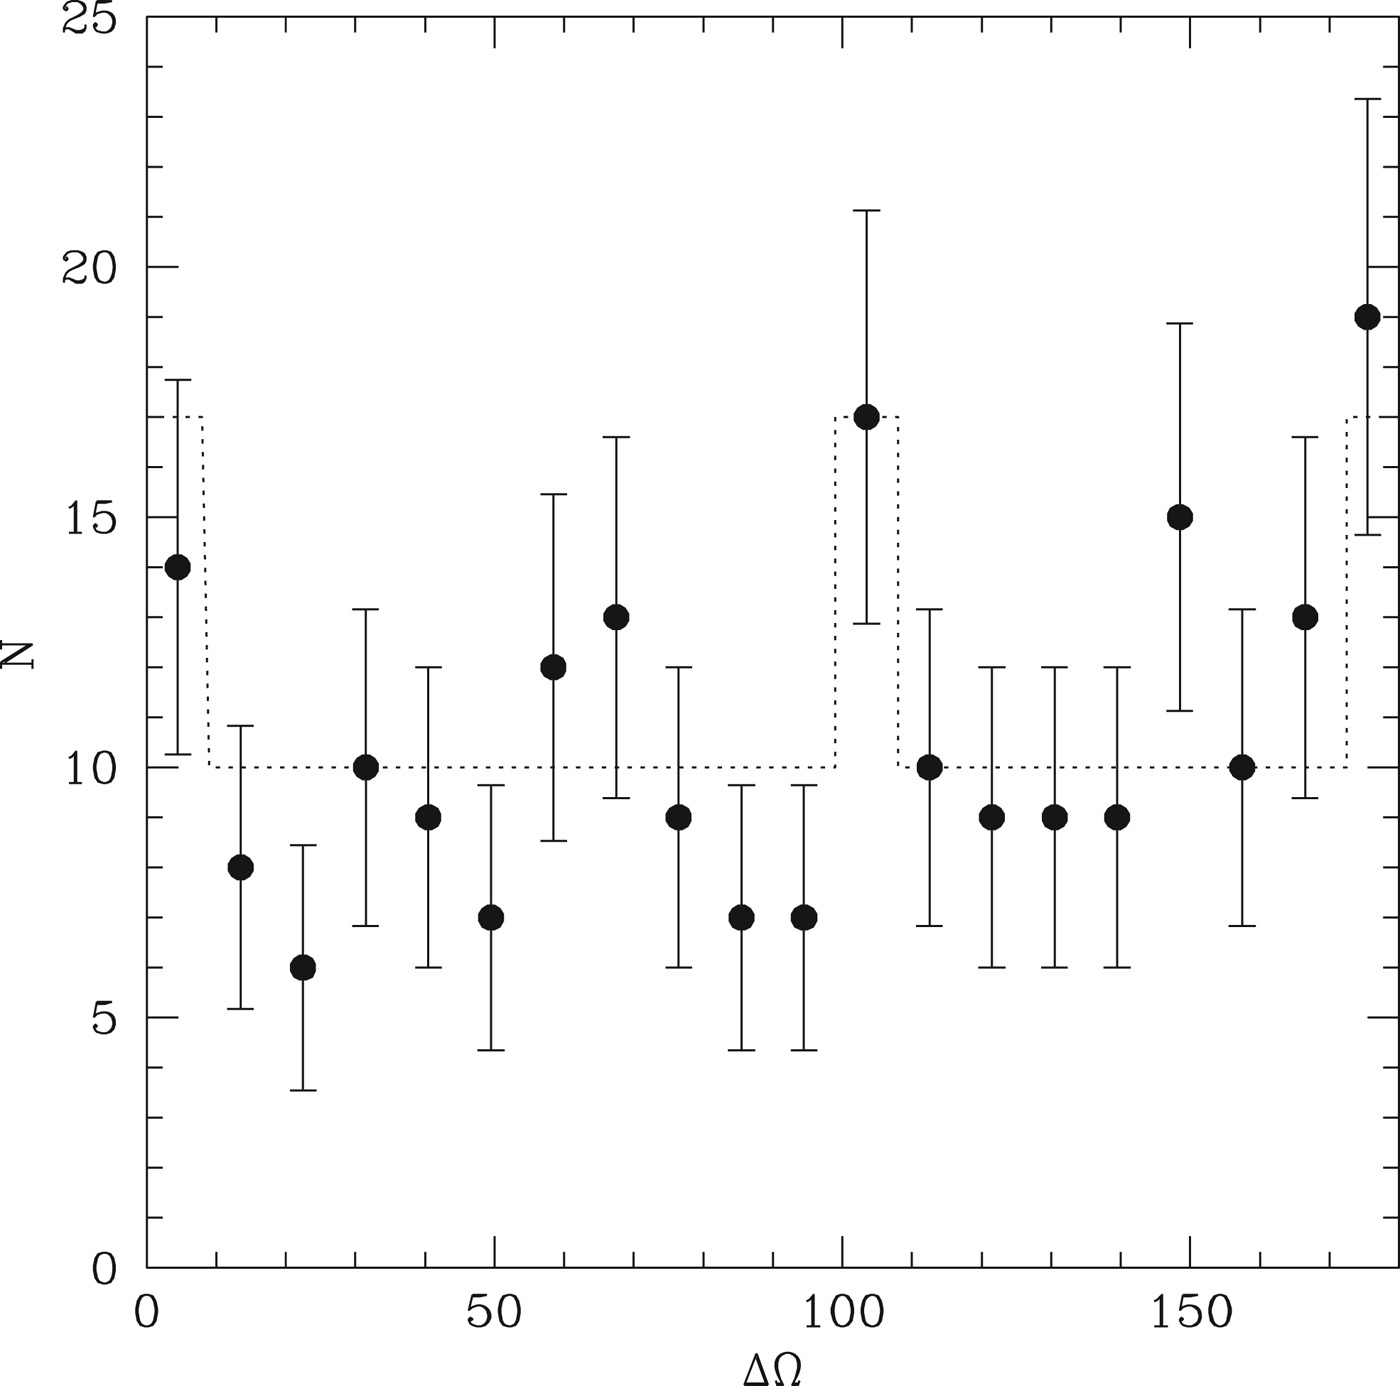
The probability of transit is determined not only by the distribution of inclinations, but also the distribution of the lines of nodes relative to the observer. Figure 8 shows the distribution of ΔΩ, the difference in the position of the line of nodes for neighbouring pairs in our simulations, at 10 Myr. We characterize this as a flat distribution in ΔΩ, plus enhancements by a factor of 1.7, for 0°<ΔΩ<10°, 99°<ΔΩ<109° and 173°<ΔΩ<180°.

Fig. 8. The points show the distribution of ΔΩ, which is the angle between the two lines of nodes of a pair of neighbouring planets. The dotted line indicates the model distribution we use, which is flat except for modest enhancements at a handful of preferred values.
The model for the distribution of the mutual offset in the nodes of neighbouring planets is the same as used in HM13. Eccentricities are small, and well characterized by p e(x)∝x exp(−x/0.03). As such, any tidal damping of the eccentricities has a negligible effect on the following results.
Monte Carlo model
As in HM13, we use the distributions p m, p e, p i and p δ, fit to the simulations, to construct a Monte Carlo model for the underlying planetary population, in order to provide a population synthesis model that can be observed in the same manner as a transiting planet search. We draw from these distributions the separations, masses, inclinations, eccentricities and nodal alignments of model planetary systems. We remove any which violate our criteria that 12<Δ<40, and then determine what fraction of the planets will be observed as transits from observers at various orientations. We assume the stellar radius is 0.5 R ⊙ and also adopt a parameter R′ that specifies the degree of planetary radius enhancement, in order to account for the possibility that the radii are inflated by hydrogen atmospheres whose contribution to the total mass is negligible.
The detection efficiency for the DC13 sample can be modelled in a similar fashion as Youdin (Reference Youdin2011) did for the Sun-like sample, using the numbers in Fig. 15 of DC13. We find that the detection efficiency for planets is not strongly dependant on the planetary period, and that the recovery fraction f recover can be approximated as
We use this function to estimate the probability that a transiting planet in our Monte Carlo sample is actually recorded as a tranet, a term we adopt, following Tremaine & Dong (Reference Tremaine and Dong2012), to avoid confusion between the sample observed in a transit survey (tranets) and the underlying population (planets).
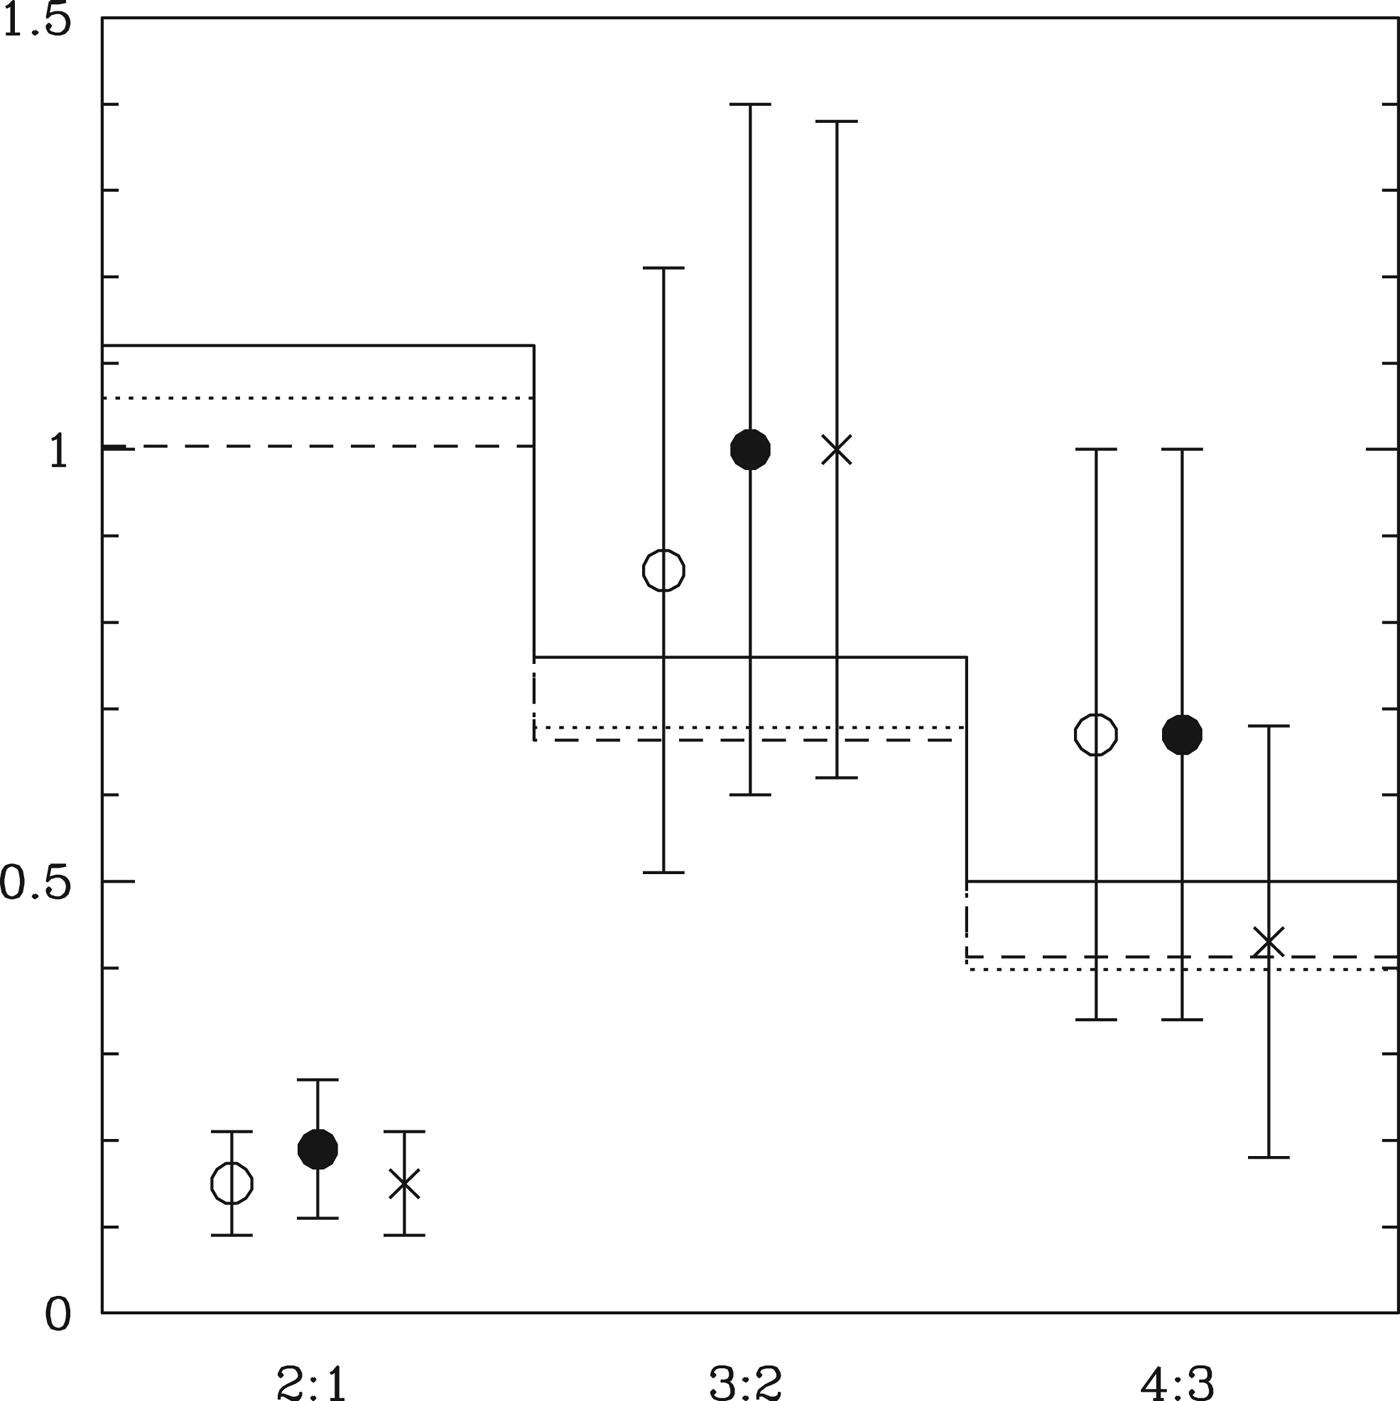
The first measure of comparison is the ratio of tranet systems of different multiplicity. Figure 9 shows the results from the Monte Carlo model, compared with several observational determinations. The open circles show the ratio determined from the full DC13 catalogue, and the crosses indicate the ratios in the catalogue of Muirhead et al. (Reference Muirhead, Hamren, Schlawin, Rojas-Ayala, Covey and Lloyd2012). The filled circles show the ratios calculated using only the sample contained in the dotted line in Fig. 1. The exclusion of 17 singles (although one is regained since one double loses a member too) increases the 2 : 1 ratio slightly, but not sufficiently to change any qualitative conclusions. As for the G star sample (see HM13), the ratio of higher multiples matches the model (although the statement is weaker in this case because of the smaller sample size) but we see again an excess of single tranet systems which suggests a substantial population of systems whose multiplicities must be lower than in our model. Models with a modest enhancement in radius R′>1.2 are consistent with the observed multiplicities and we adopt R′=1.4 as our default model. These values are small enough to justify the assumption that the mass enhancement due to hydrogen is negligible. We also show a comparison with a model in which R′=1.4 only for a>0.07 AU and is set to R′=1 interior to that. This is an approximation to the idea that the closest planets may lose some or all of their hydrogen atmospheres due to evaporation, driven by the stellar flux (Lopez et al. Reference Lopez, Fortney and Miller2012; Owen & Jackson Reference Owen and Jackson2012; Lammer et al. Reference Lammer2013; Owen & Wu Reference Owen and Wu2013).

Fig. 9. The solid points indicate the multiplicity ratios calculated for the sample identified in the dotted box in Fig. 1. The open circles represent the same quantity calculated using the entire sample. The crosses indicate the multiplicities using the catalogue of Muirhead et al. (Reference Muirhead, Hamren, Schlawin, Rojas-Ayala, Covey and Lloyd2012). The solid histogram represents our default model, with R′=1.4, and the dotted line uses R′=1.2. The dashed line uses R′=1.4 for a>0.07 AU and R′=1 otherwise. We see that the agreement is robust to both variation in the observational catalogue and variation in the model parameters.
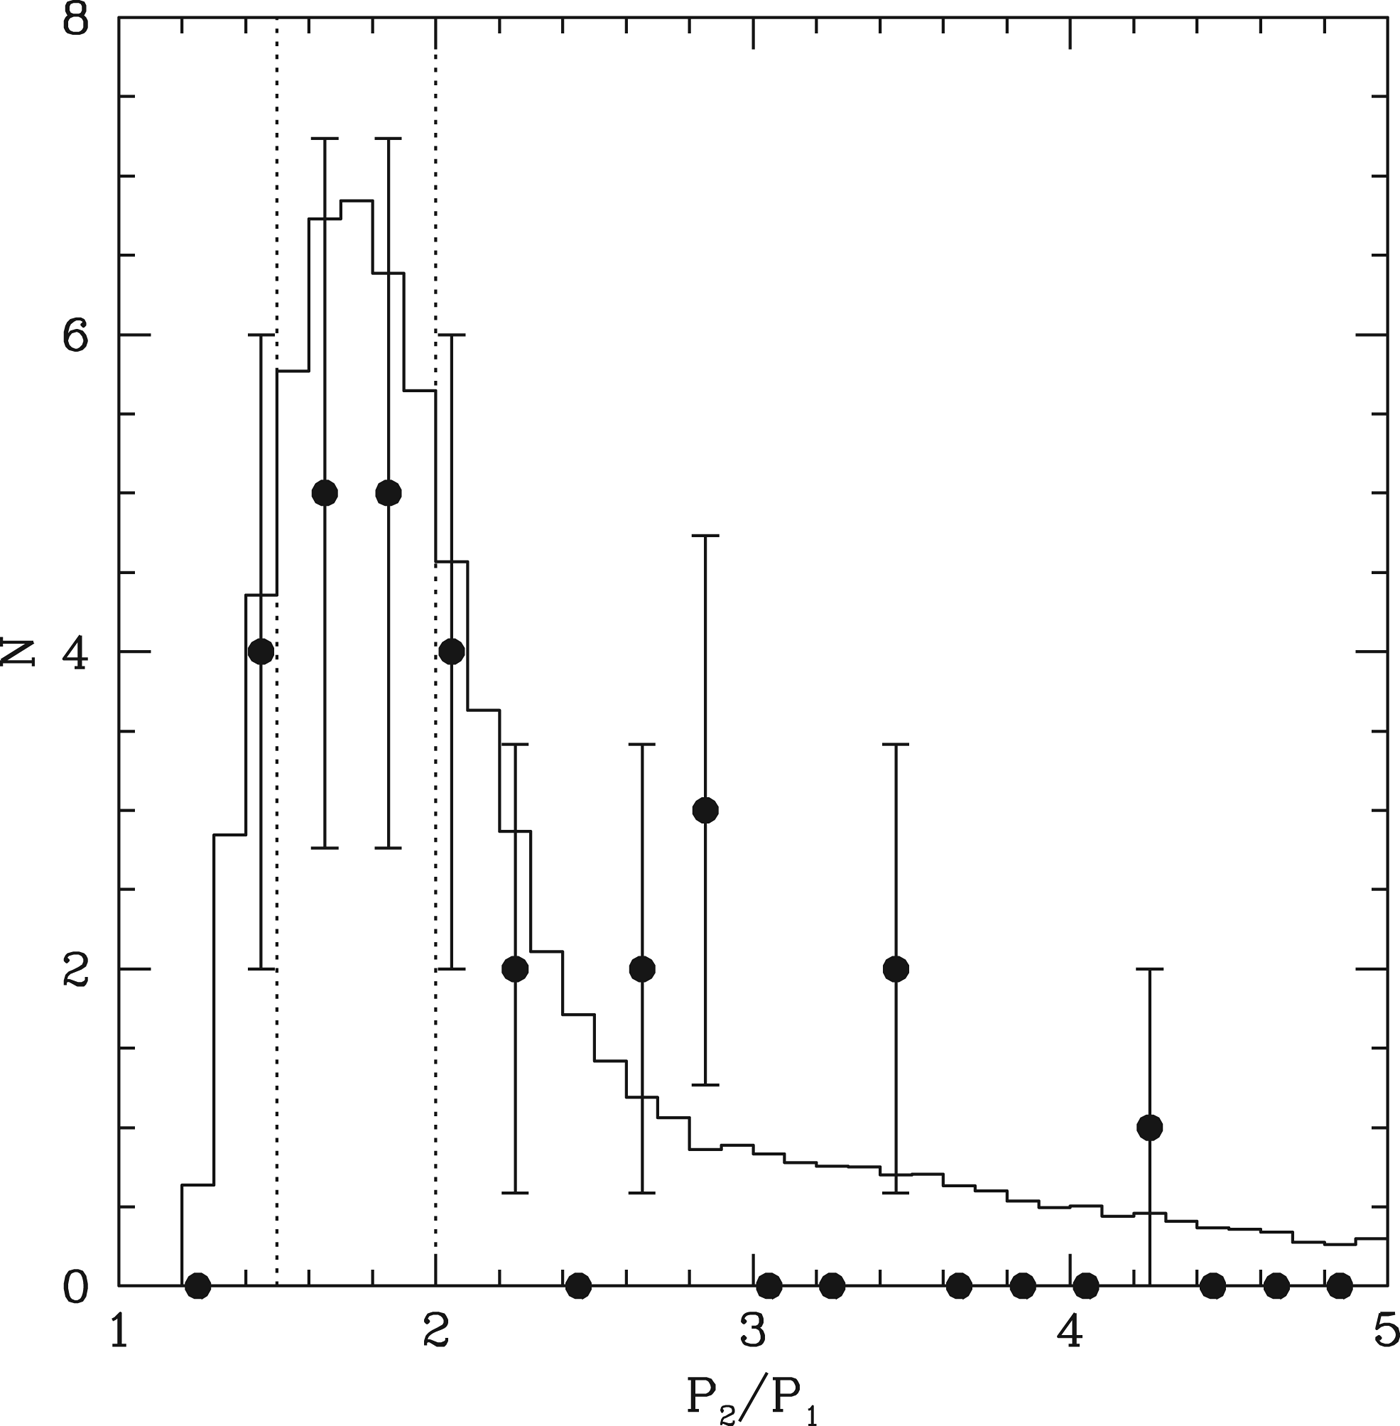
The histogram in Fig. 10 shows the distribution of period ratios for neighbouring tranets from our Monte Carlo model. The points show the same quantity for the multiple tranets in the DC13 catalogue. The excellent agreement further supports the basic notion that the spacing of the planets in the multiple tranet systems observed by Kepler is well represented by an in situ assembly model. We also denote the location of the 2 : 1 and 3 : 2 commensurabilities, in order to demonstrate that the M dwarf sample shows no significant preference for such period ratios. There is not even the slight excess observed in the G-dwarf sample (Lissauer et al. Reference Lissauer2011; Fabrycky et al. Reference Fabrycky2012), although the number of observed systems is also smaller.

Fig. 10. The filled circles indicate the binned distribution of period ratios for neighbouring tranets in the DC13 system. The histogram represents the distribution that emerges from our Monte Carlo model with R′=1.4. The vertical dotted lines indicate the 3 : 2 and 2 : 1 commensurabilities. We see that both the observations and the simulations favour a broad distribution between 1.3 and 2.3.
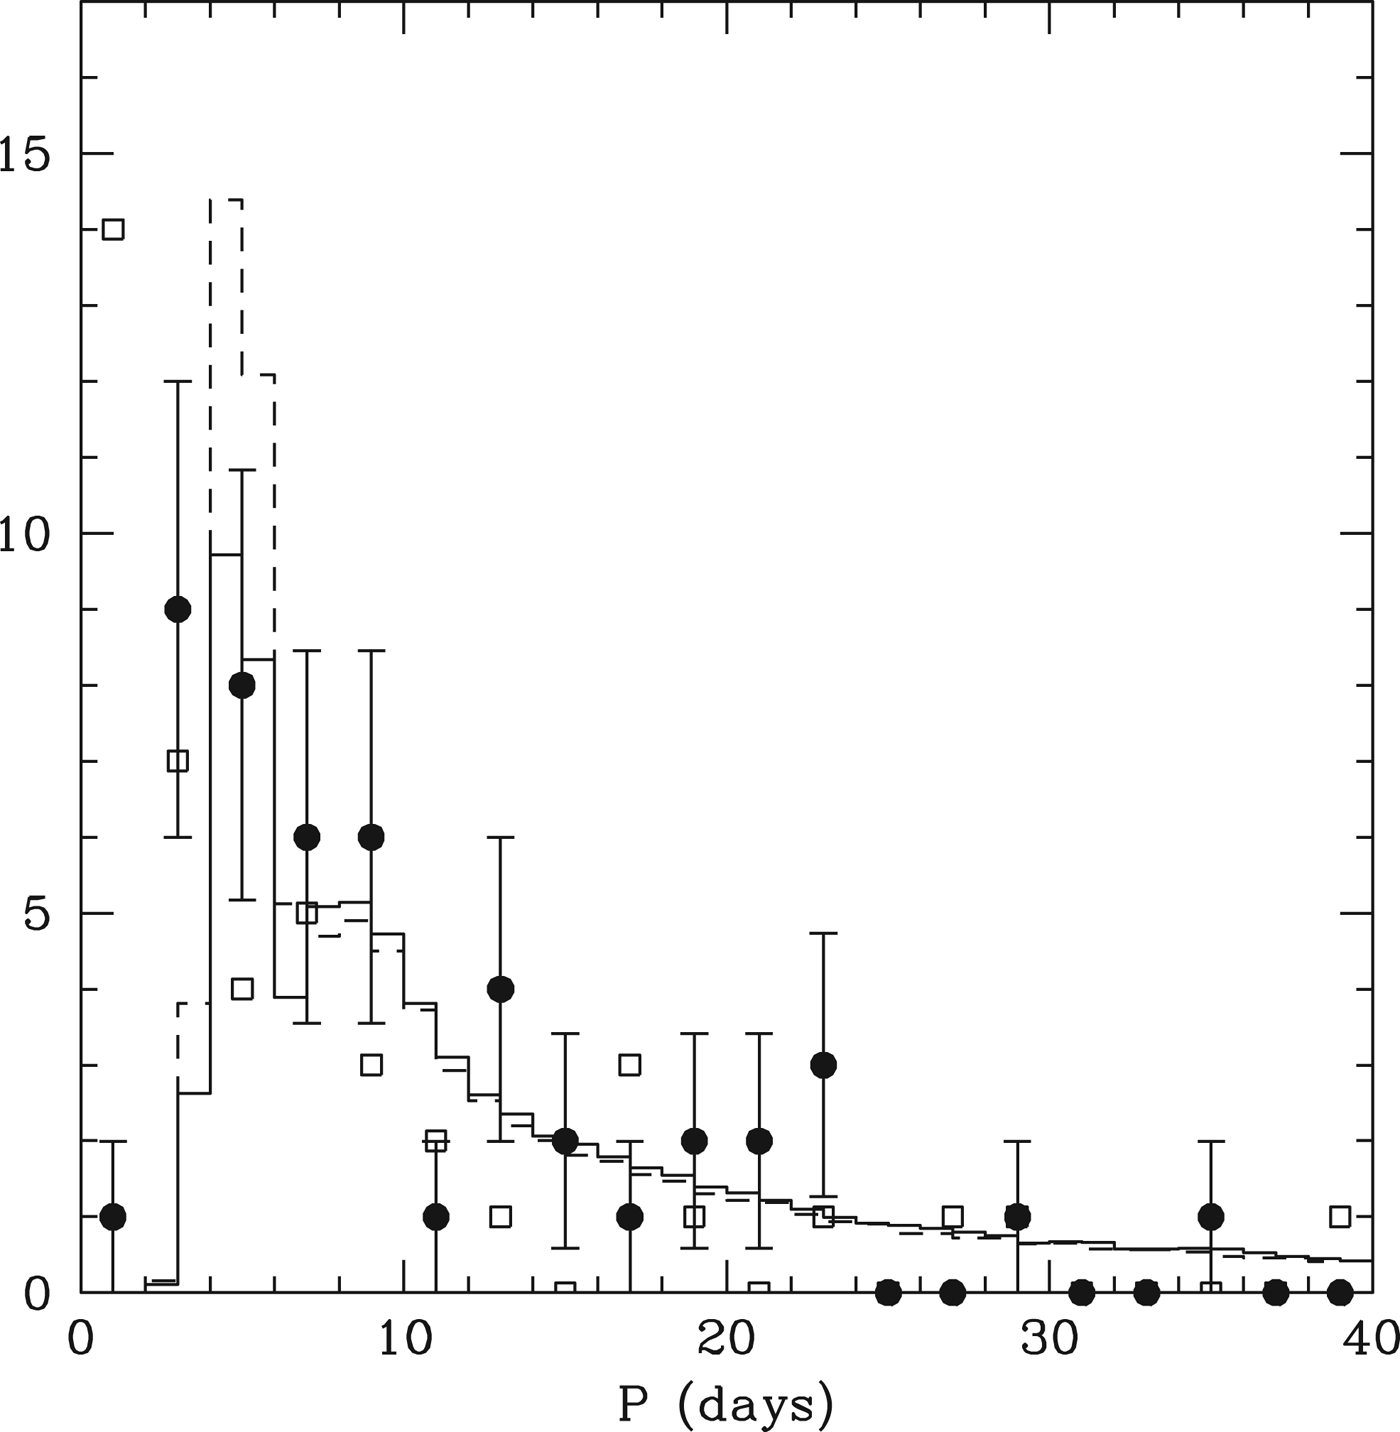
The distribution of periods themselves is also well produced by the models, as seen in Fig. 11. The solid points show the periods of tranets in multiple systems, while the open circles indicate the distribution of single tranets. The dashed histogram shows the prediction of a model with R′=1.4. This fits most of the data well, but over predicts the number of planets with periods <6 days. The solid histogram shows the distribution drawn from the model in which we use R′=1.4 for a>0.07 AU only, and R′=1 interior to that. We see that the general shape is now well matched. An alternative way to match the innermost bins would be to have a slight distribution of inner edges to the original disk, as our present model is rather naive with a uniform inner edge.

Fig. 11. The filled circles show the binned period distribution of tranets in the DC13 catalogue that are found in multiple systems. The open squares show the corresponding distribution of single tranet systems. The excess of single tranets at periods <2 days is evident. The dashed histogram is the distribution from the Monte Carlo model with R′=1.4, while the solid histogram is the distribution for the model in which R′=1.4 only for a>0.07 AU.
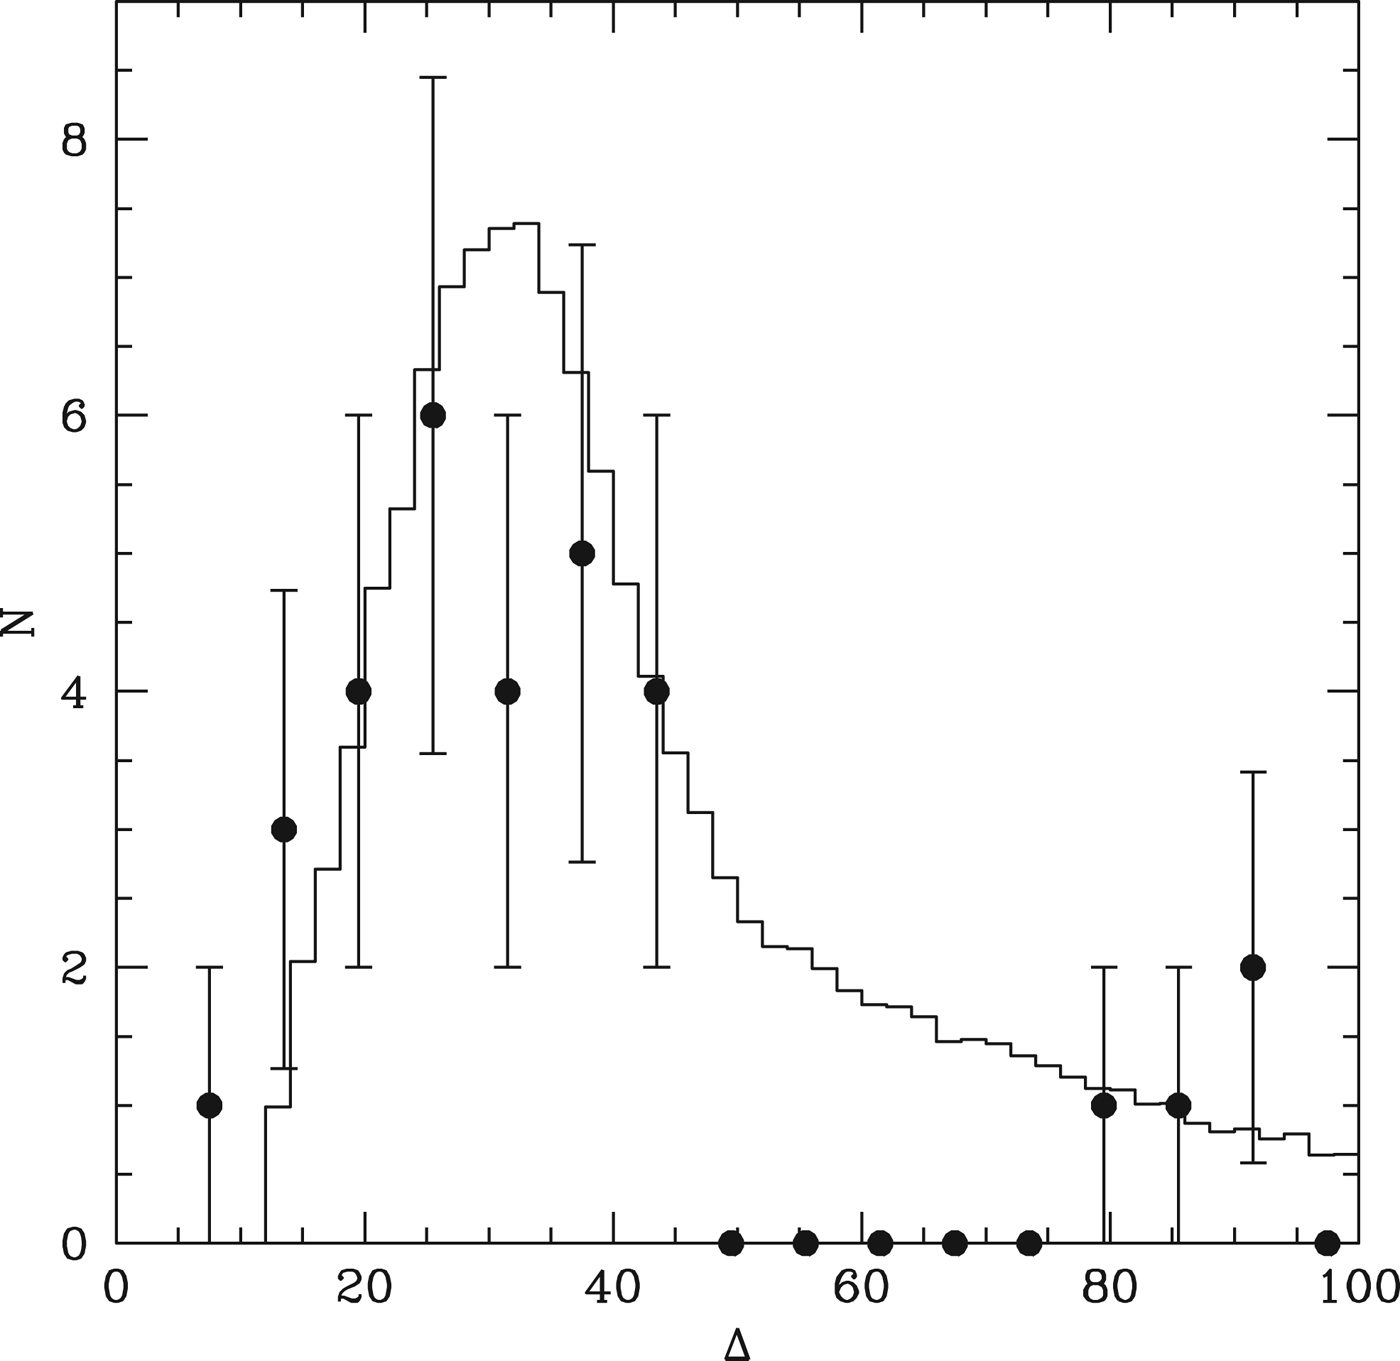
Figure 12 shows the comparison between the models and the observations when the spacings are normalized by their mutual Hill radii. The histogram shows the model distribution of Δ, for R′=1.4. To get an observational distribution, we need to convert the observed radii to masses. A common procedure in the literature is to use the relationship of Lissauer et al. (Reference Lissauer2011). We designate the Δ calculated with this relationship as ΔL. Much as for the G star sample, the observed distribution of ΔL shows a similar shape as that from the simulations, but shifted to lower numerical values. This once again suggests that the masses estimated using Lissauer's relation is overestimated. In Figure 12 we have multiplied ΔL by a factor of 1.5 to match the simulated distribution, which corresponds to the assumption that the Lissauer relation leads to a mass overestimate by a factor of 3. For a planet of radius 2 R ⊕, this suggests that masses should be more like 1.4 M ⊕ rather than 4.2 M ⊕. Regardless of the difference in normalization, we can see that the shapes of the observed and theoretical distributions are similar, with a broad peak and a long tail to higher values. This again implies that some observed neighbouring tranet pairs have inferred Δ well above the expected maximum from the simulations, suggesting that additional planets may be awaiting detection in the gaps. The four systems in the DC13 table that satisfy this criterion are 936.01 & 936.02, 2719.01 & 2719.02, 2650.01 & 2650.02 and, finally, 1422.01 & 1422.02. None of these pairs are particularly surprising in this regard, since all of them show period ratios in excess of three.

Fig. 12. The solid points are the observed values of Δ, derived by calculating ΔL (using the Lissauer et al. Reference Lissauer2011 relation) and then multiplying by a factor of 1.5. The histogram results from the Monte Carlo model, with R′=1.4, although the shape of the distribution is rather insensitive to the value of R′.
Finally, the mutual inclinations of neighbouring planets can also prove to be an interesting constraint on the models (e.g. Fabrycky et al. Reference Fabrycky2012), and is well matched by the in situ assembly model for solar-type stars (HM13). Unfortunately, the DC13 sample is sufficiently small that the shape of the distribution is not well constrained observationally, especially since the impact parameters of individual tranets are only reported to a single significant digit.
Habitability and water delivery
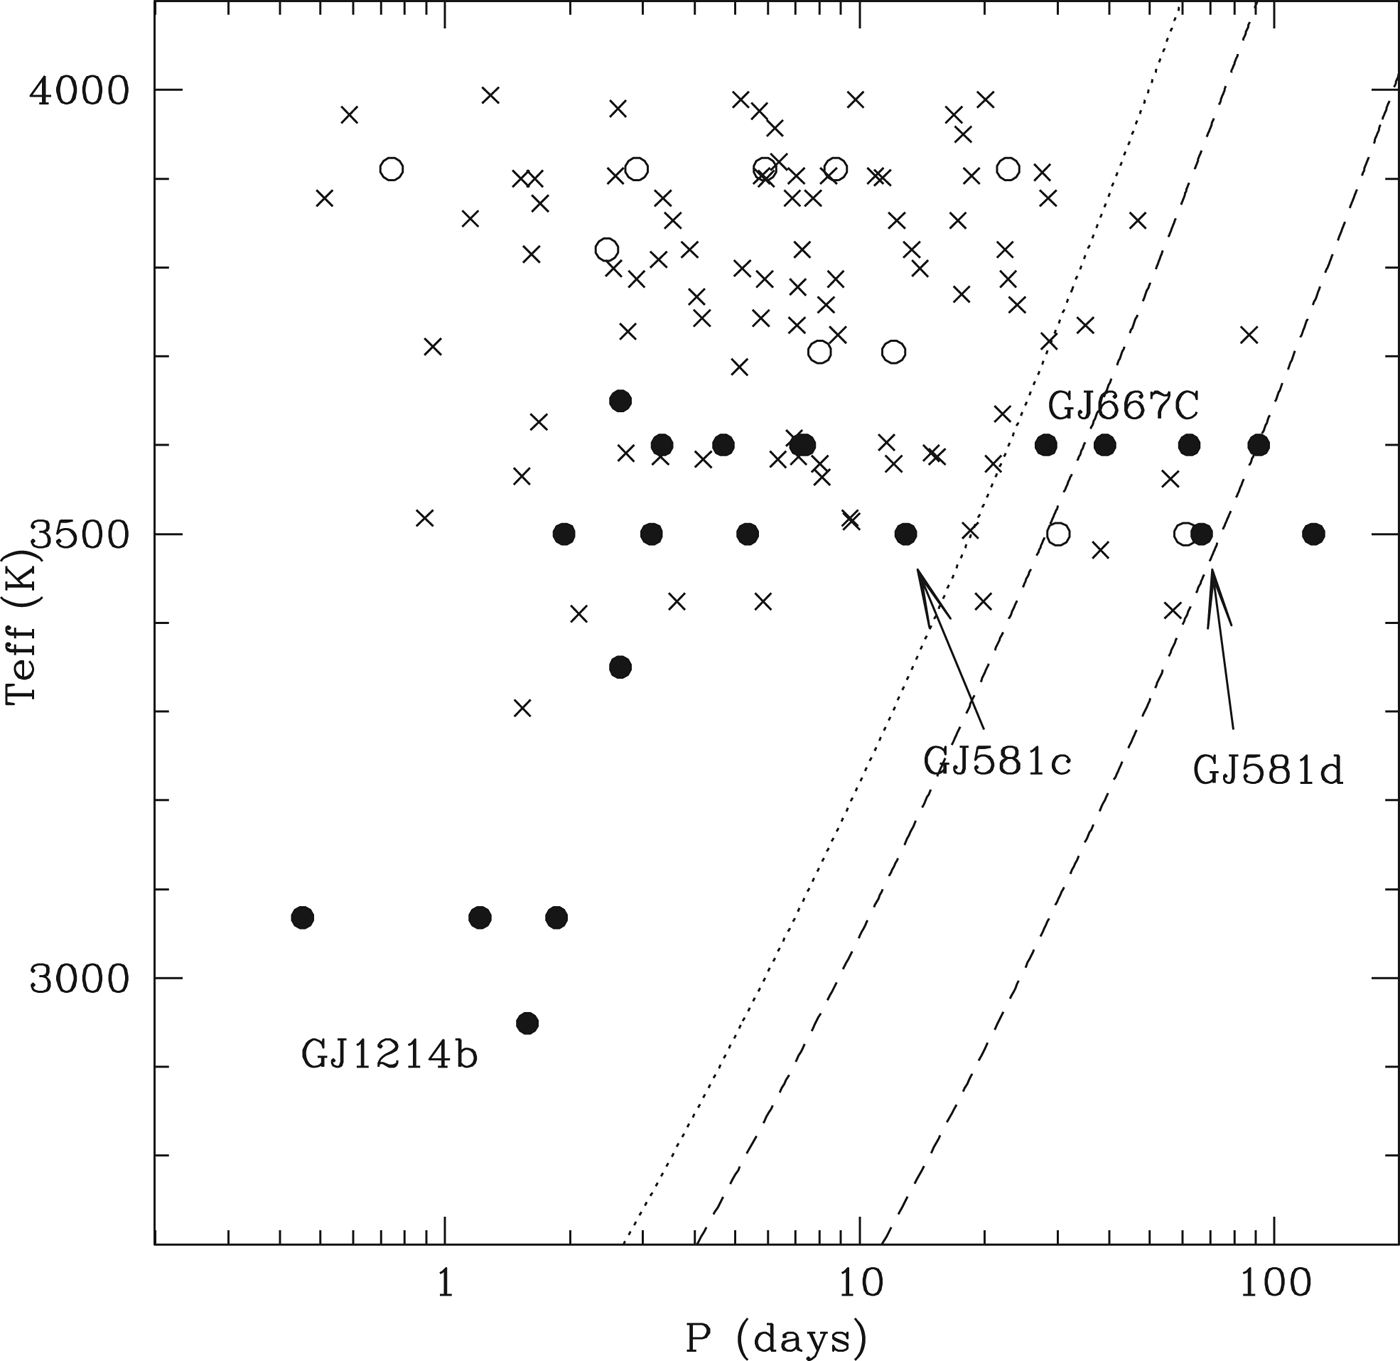
A particularly exciting aspect of planetary systems around M dwarfs is the possibilities they offer for studying the habitability of planets through transit observations, by virtue of the proximity of the HZ to the host star. Figure 13 shows the sample of known M dwarf planets and candidates as a function of distance and host star effective temperature, along with estimated locations of the HZ using the recent estimate of Koppurapu et al. (Reference Kopparapu2013).

Fig. 13. Filled and open circles represent confirmed planets, showing orbital periods as a function of host star effective temperature. The filled circles are planets whose minimum mass are <0.1 M J, while open circles have masses >0.1 M J. The crosses indicate planetary candidates from the sample of DC13. The dashed curves show the expectation of the HZ inner and outer edges from Kopparapu et al. (Reference Kopparapu2013), assuming the ‘runaway greenhouse’ and ‘early Mars’ models. The dotted line represents the more optimistic ‘recent Venus’ model. The listed names indicate several well-known M-dwarf planets, including those most likely to be considered habitable.
However, the habitability of such planets is far from assured, as the proximity to the host star also introduces additional effects, such as the tidal locking of the planetary spin, and the consequent possibility of dramatic atmospheric effects (Kasting et al. Reference Kasting, Whitmire and Reynolds1993; Joshi et al. Reference Joshi, Haberle and Reynolds1997). An additional problem is that such planets may be quite dry. Raymond et al. (Reference Raymond, Scalo and Meadows2007) and Lissauer (Reference Lissauer2007) have argued that it will be harder for planets in M-dwarf HZ to accrete volatiles, including water, because they are well separated from the ice line and would have difficulty accreting in high velocity impacts. It has long been appreciated that, in our Solar System, the condensation of water into solid material suitable for planetary accretion requires lower temperatures than expected in the region where Earth accreted. This has led to a long debate regarding the origins and timing of the delivery of water to the Earth (Morbidelli et al. Reference Morbidelli, Chambers, Lunine, Petit, Robert, Valsecchi and Cyr2000; Raymond et al. Reference Raymond, Scalo and Meadows2007; Bond et al. Reference Bond, Lauretta and O'Brien2010; Izidoro et al. Reference Izidoro, de Souza Torres, Winter and Haghighipour2013). Therefore, we have performed a set of simulations in which we repeat the above assembly calculation but include a population of test particles in order to trace the efficiencies with which planets at different locations can accrete water. This will allow us to infer the disk properties necessary to provide a given amount of water to planets in the HZ.
Our model uses the same disk profile as in the subsection “Integrations”, but now extended out to a distance of 1 AU. If we scale from the solar system ice line at ~2.5 AU to a 0.5 M ⊙, T eff=3800 K M-dwarf representative of the DC13, we estimate that water ice will begin to form at distances ~(3800/5800)2×2.5/2=0.54 AU, and so we include 100 test particles in each simulation, distributed uniformly in the semi-major axis from 0.54 and 1 AU. This weights the larger separations more than the underlying oligarchic mass distribution, and represents a crude representation of increasing condensation at larger distances and cooler temperatures.
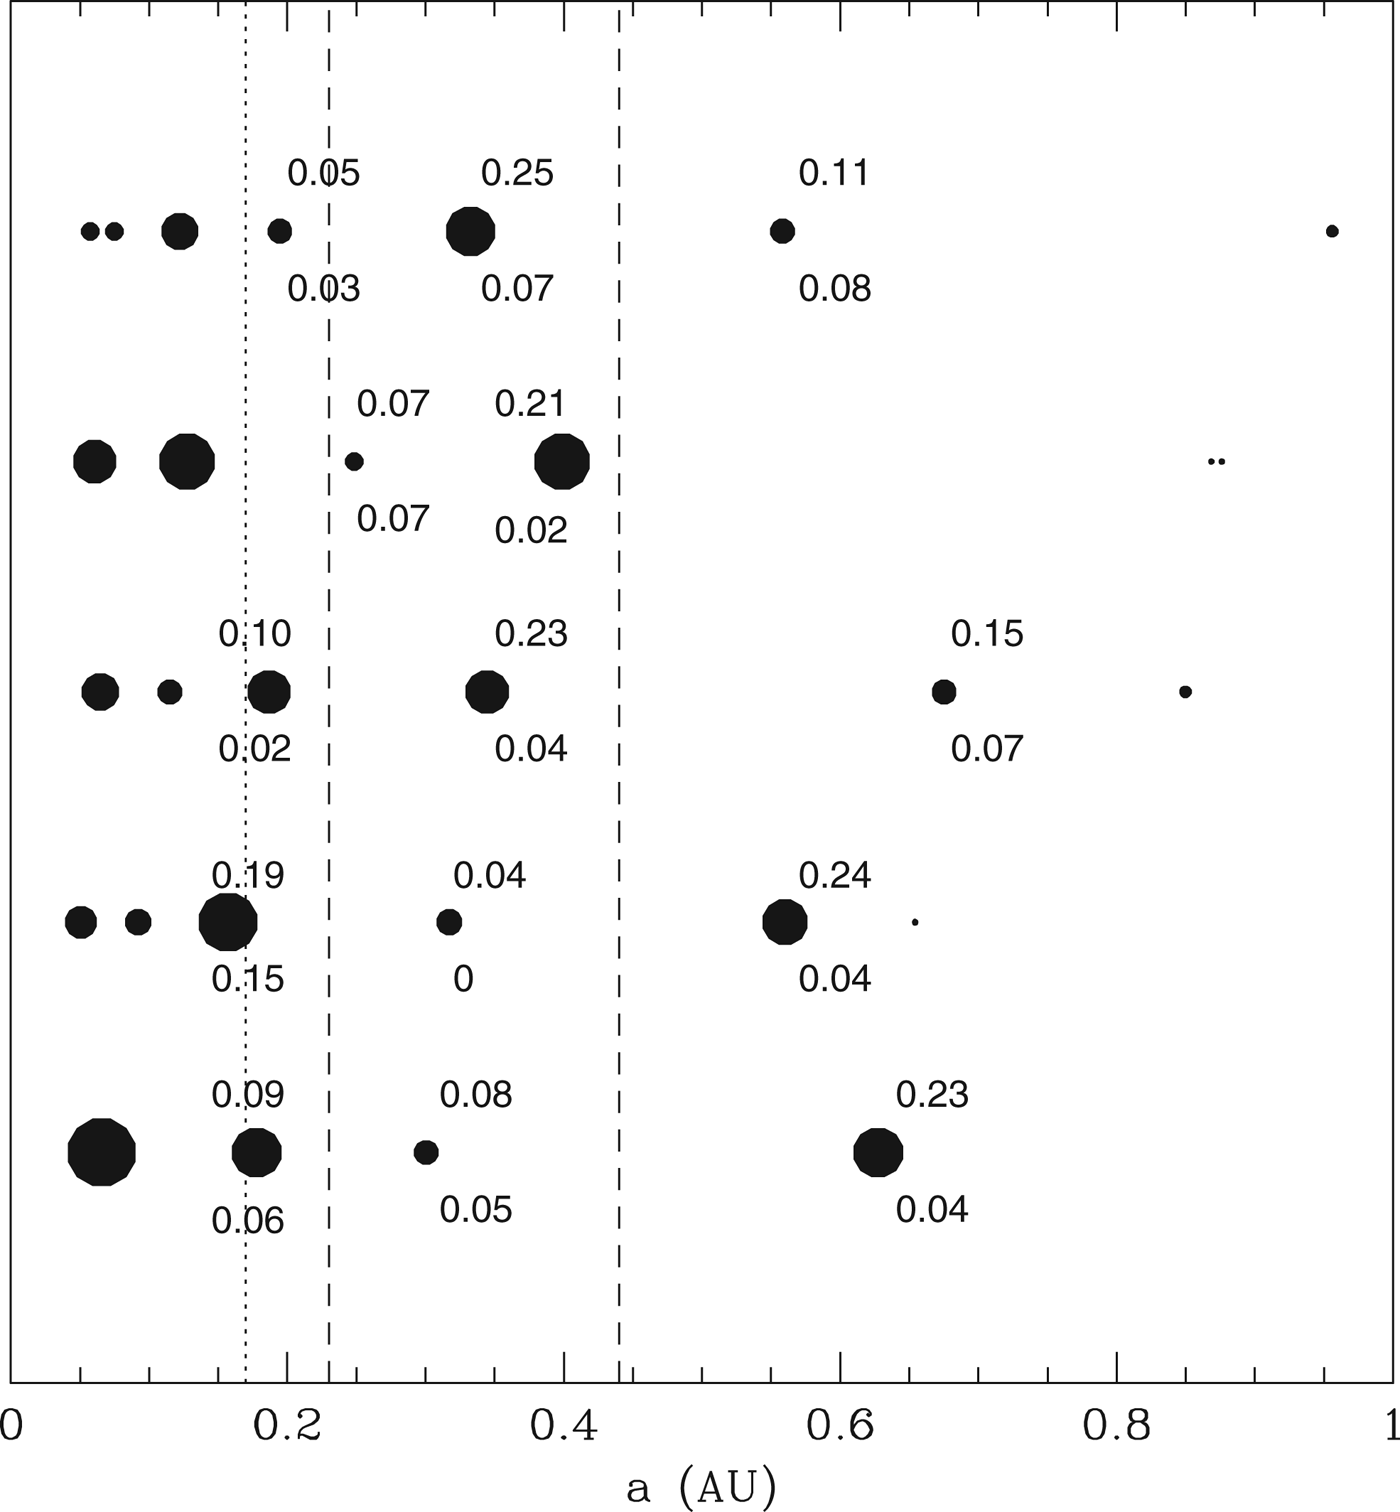
For our 0.5 M ⊙ star, a moderately conservative estimate for the HZ lies between 0.23 and 0.44 AU (using the Koppurapu models for a runaway greenhouse at the inner edge and an early Mars for the outer edge). Our simulations produce either one or two surviving planets in this range, at an age of 10 Myr. Figure 14 shows the locations of the surviving bodies for five realizations of our model. For the planets in or near the HZ, we also include two labels showing what fraction of the original water-bearing planetesimals was accreted by the planets. The upper label indicates the total fraction of the test particles accreted by the surviving body, including those accreted by embryos that were later accreted. The lower label indicates only that fraction of the total test particle inventory that was accreted after the last embryo was accreted by this planet. The difference between the two numbers represents the range of possibilities, depending on whether volatiles are lost during giant impacts (lower number) or not. We see that there is substantial scatter in the amount of water accreted, ranging from 0 to 23% of the original reservoir. We also note that many systems contain a ‘gatekeeper’ body located just outside the HZ, which accretes a substantial fraction of the water.

Fig. 14. Filled circles indicate planets at the end of our accumulation runs, in five different realizations of the same model. The circle diameters scale linearly with planetary mass, to better illustrate the mass variation. The upper labels indicate the fraction of all test particles in the range 0.5–1 AU accreted by this body. The lower labels indicate only that fraction accreted after the last giant impact. The vertical dashed lines indicate the inner and outer regions of the conservative HZ, while the dotted line indicates the location of a more optimistic estimate of the inner edge. These criteria are drawn from the models of Koppurapu et al. (Reference Kopparapu2013) assuming a 0.5 M ⊙ host.
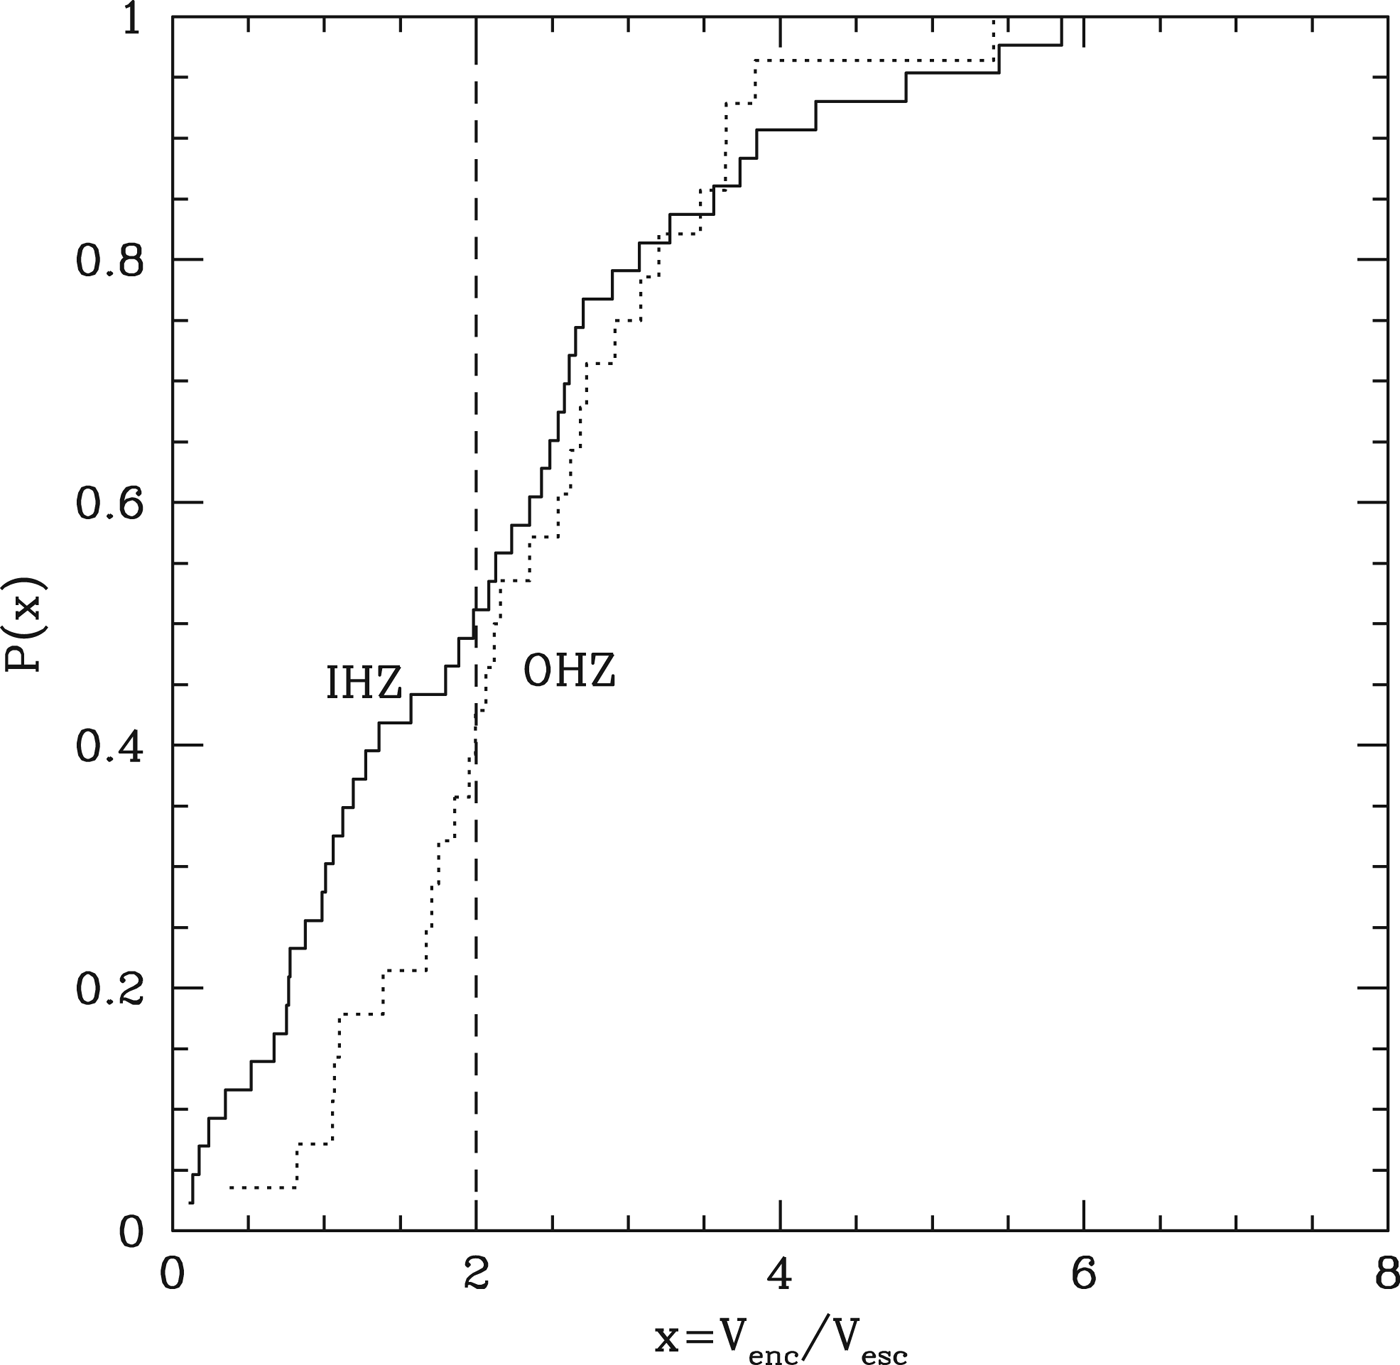
Lissauer (Reference Lissauer2007) also raised the possibility that even late accretion from water-rich bodies might not be very efficient because of the high velocities of encounter. In our case, the presence of gatekeeper bodies will scatter bodies on orbits that penetrate the inner planetary system. This will potentially serve to limit the flux of such bodies but may also make their evolution more diffusive and therefore reduce the velocities of encounter for those that do penetrate the HZ. To estimate this effect, Fig. 15 shows the final encounter velocities, normalized to the escape velocity from the accreting rocky planet, for those test particles accreted after the last major impact, for planets with final semi-major axis between 0.23 and 0.44 AU and summed over 10 simulations. We further divide the HZ into the inner (IHZ) and outer (OHZ) parts, with the transition at 0.27 AU. In both cases, approximately 50% of the accreted material is acquired through encounters with less than twice the planetary escape speed – the criterion of Melosh & Vickery (Reference Melosh and Vickery1989) for substantial atmosphere erosion. This suggests that the build-up of volatiles on these planets can be very stochastic, with approximately equal chances of gaining or losing from the planetary inventory with each encounter. The planets in the IHZ might have a slight advantage in this regard, as the tail to lower velocities is larger, presumably reflecting the more diffusive orbital evolution of planetesimals that manage to penetrate that far inwards.

Fig. 15. The solid histogram, labelled IHZ, shows the distribution of escape velocity-normalized encounter velocities for test particles accreted by planets that lie between 0.17 and 0.27 AU in our simulations. Only those particles accreted after the last major impact are counted. The dotted histogram represents the same distribution for those planets that lie within 0.27 and 0.38 AU. The vertical dashed line indicates a value of V encounter/V escape=2, which is the threshold for significant atmosphere erosion (Melosh & Vickery Reference Melosh and Vickery1989).
These numbers demonstrate that a sufficient water inventory is potentially possible for many of these habitable planets. The water inventory of the Earth is estimated at a mass ~2×10⁻³ M ⊕ (Drake & Campins Reference Drake and Campins2006; Marty Reference Marty2012), with about 10% contained in the oceans. If we assume that 50% of the late accreted water in these simulations is retained, then IHZ planets capture and retain ~3% of the original reservoir, while OHZ planets retain ~2% on average. Estimates of the condensable fraction of material in a protoplanetary disk suggest that, beyond the ice line, the mass inventory approximately doubles (e.g. Hughes & Armitage Reference Hughes and Armitage2012). If the same holds for the model discussed here, this implies as much as 2 M ⊕ of water is available in planetesimals. This implies that the HZ planets around M dwarfs can accrete ~0.05 M ⊕ of water, an order of magnitude more than estimated for the water inventory of Earth. The actual reservoir of water will depend on the physical processes that produce the initial conditions for final assembly, but the results here show that planets in M dwarf HZs can be large enough, and accrete sufficient material at late times to potentially also meet the water delivery requirement for habitability.
Discussion
M dwarfs have a history of confounding pessimistic theory predictions regarding their planetary inventories. Laughlin et al. (Reference Laughlin, Bodenheimer and Adams2004) predicted that the mass and timescale requirements for giant planet formation via core accretion would make giant planets relatively rare around M dwarfs. Although this is partially borne out by the relative rarity of giant planets with short orbital periods around M dwarfs (Johnson et al. Reference Johnson, Butler, Marcy, Fischer, Vogt, Wright and Peek2007), some have been discovered (Haghighipour et al. Reference Haghighipour2010; Rivera et al. Reference Rivera, Laughlin, Butler, Vogt, Haghighipour and Meschiari2010; Johnson et al. Reference Johnson2012) and microlensing surveys suggest that many M dwarfs may indeed possess giant planets at larger distances (Gould et al. Reference Gould2010). Similarly, Raymond et al. (Reference Raymond, Scalo and Meadows2007) predicted that protoplanetary disks which scaled linearly with stellar mass would produce terrestrial planet systems with planets too small (<0.3 M ⊕) to be detected by Kepler in significant quantities, although Montgomery & Laughlin (Reference Montgomery and Laughlin2009) demonstrated that more massive disks could indeed produce planetary systems of observable size via in situ accretion. Furthermore, planetary systems may also be constructed via a number of other evolutionary pathways beyond simple in situ accretion (Raymond et al. Reference Raymond, Barnes and Mandell2008; Ogihara & Ida Reference Ogihara and Ida2009), which could potentially alleviate the mass constraints.
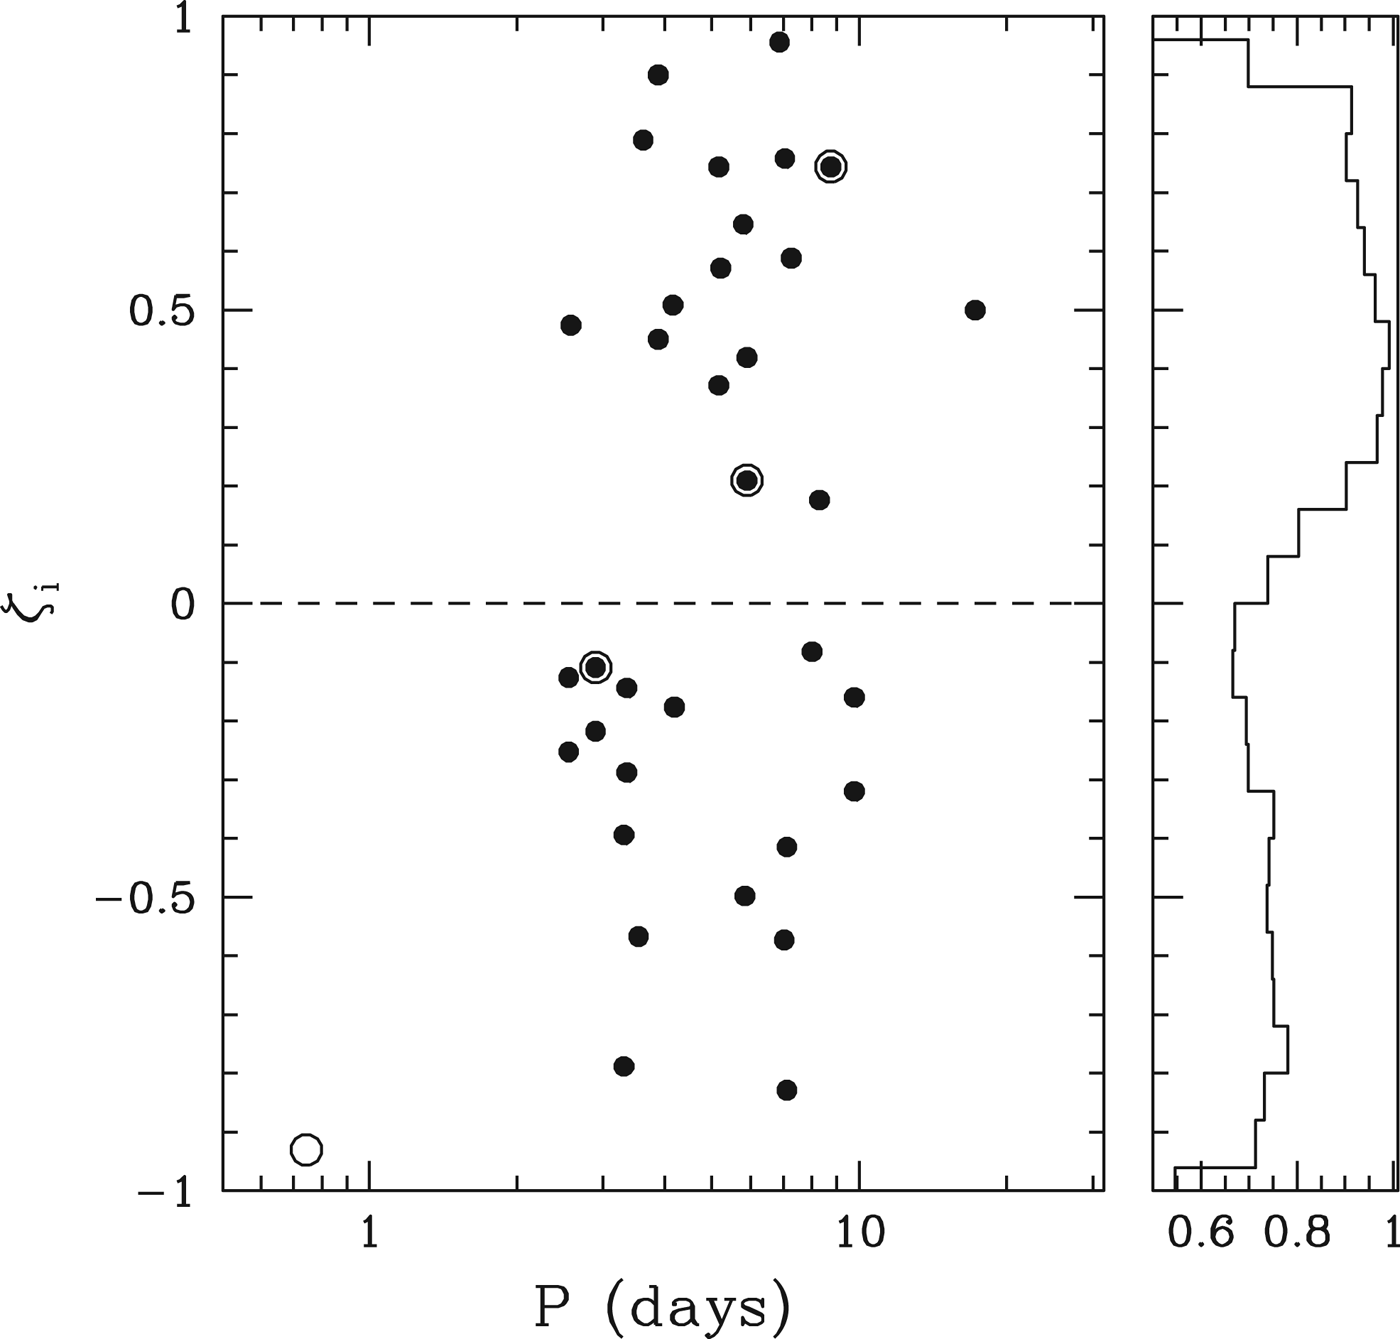
The Kepler mission has now revealed that planetary systems around cool stars follow a similar trend to those around hotter stars, in the sense that compact systems of low mass planets appear to be more numerous than those containing gas giants, at least at short orbital periods. Our goal in this paper has been to demonstrate that these low mass planetary systems are indeed broadly consistent with a population of planets that assembled in situ, suggesting a commonality with the planetary systems observed around Sun-like stars (Hansen & Murray Reference Hansen and Murray2012, HM13; Chiang & Laughlin Reference Chiang and Laughlin2013). This is somewhat at odds with the conclusion reached by Swift et al. (Reference Swift, Johnson, Morton, Crepp, Montet, Fabrycky and Muirhead2013), who favour inward migration of planets. However, that study relied on a detailed study of a single system (Kepler-32), allied to blithe generalities about the rest of the Kepler sample. The Kepler-32 system is one of the few observed systems that actually corresponds to the commensurable chain expected from migration models, and therefore cannot really be used as a representative of the sample as a whole (consider the distribution of period ratios shown in Fig. 10). Furthermore, the particular arrangement of the Kepler-32 system may simply be a statistical fluctuation. Figure 16 shows the distribution of the four Kepler-32 period ratios when characterized by the statistic ζi introduced by Lissauer et al. (Reference Lissauer2011) to characterize the proximity to a resonance of order i. The open circles indicate the four Kepler-32 pairs, while the filled circles show the rest of the pairs in the DC13 sample. We see that the Kepler sample as a whole is spread out over the full observed range of ζ, and could easily represent a generic sampling of the fuller distribution. Also shown is the distribution of ζ1 expected from our Monte-Carlo model, which reproduces the broad distribution seen in the observations. In short, in situ assembly reproduces the observed distribution of Kepler period ratios quite well, even with the commensurabilities of the Kepler-32 system included in the sample. The observed commensurabilities in giant planet systems observed with radial velocities however (Haghighipour Reference Haghighipour2013), may suggest a different formation mechanism, and are a better fit to models which invoke late stage planetary migration.

Fig. 16. Filled circles show the values of ζi for the planet pairs in the DC13 sample. Values of ζ1 are plotted unless |ζ1|>1, in which case ζ2 is plotted. The open circles indicate the period ratios of the Kepler-32 system, which are included in the DC13 sample except for Kepler-32f (Swift et al. Reference Swift, Johnson, Morton, Crepp, Montet, Fabrycky and Muirhead2013), which yields the open circle on the bottom left. The right hand panel shows the distribution of ζ1 that emerges from the Monte Carlo model. Note the zoomed-in scale – the distribution is broadly uniform in ζ.
The amount of mass used in our rocky nebula model is 6 M ⊕ between 0.05 and 0.5 AU. If we estimate the same amount of mass in this range using the surface density profile assumed in HM13, we get 12.4 M ⊕, around a star of twice the size. Thus, our two models nicely match the approximate linear scaling of disk mass with respect to stellar mass inferred by Andrews et al. (Reference Andrews, Rosenfeld, Kraus and Wilner2013) from observations of infrared excesses around stars in Taurus. Furthermore, this amount of rocks requires only ~10−3 M ⊙ of gas for a metallicity protoplanetary disk, and is thus quite possible around a young M-star.
Our model also has implications for the detectability of habitable planets around M dwarfs. We have shown in Fig. 14 that the disk mass solar appropriate to explaining the observed distribution of tranets usually produces one and often two, planets in the nominal HZ. We can generalize this assertion by making use of the same semi-analytic estimate of planetary spacings outlined in HM13. If we assert that a given surface density profile results in a chain of planets that are characterized by mass, energy and angular momentum conservation, and the requirement that the final planets be spaced according to the Δ distribution shown in Fig. 6, then we can relate the Δ between two neighbouring planets to the quantity y=a 2/a 1, where a 1 and a 2 are the semi-major axes of the inner and outer members of the pair. Using the same ∑∝R −2 profile, we derive
where M disk is the total planetesimal disk mass, integrated from 0.05 to 0.5 AU. If the HZ extends from 0.23 to 0.44 AU, this corresponds to y=1.91 and Δ~42. A comparison with Fig. 6 shows that this value is larger than almost all of the pairs in our simulations, and indicates that it is very difficult to form a system with this model without at least one planet in the HZ.
We can extend this discussion by asking how large a disk do we need before it becomes likely to not have any planets in the HZ? If we set Δ=25, the peak of the distribution, and keep y=1.9, we can use this to derive a disk mass (between 0.05 and 0.5 AU) of M disk>28 M ⊕. A more useful comparison is if we convert this disk mass into the summed mass of the pair of planets that might straddle the HZ. For our surface density profile, the mass fraction of the total 0.05–0.5 AU disk that is contained in the HZ is 0.28, so that a pair of planets that straddles the HZ and has a combined mass >7.8 M ⊕ may not have any further planets between them.
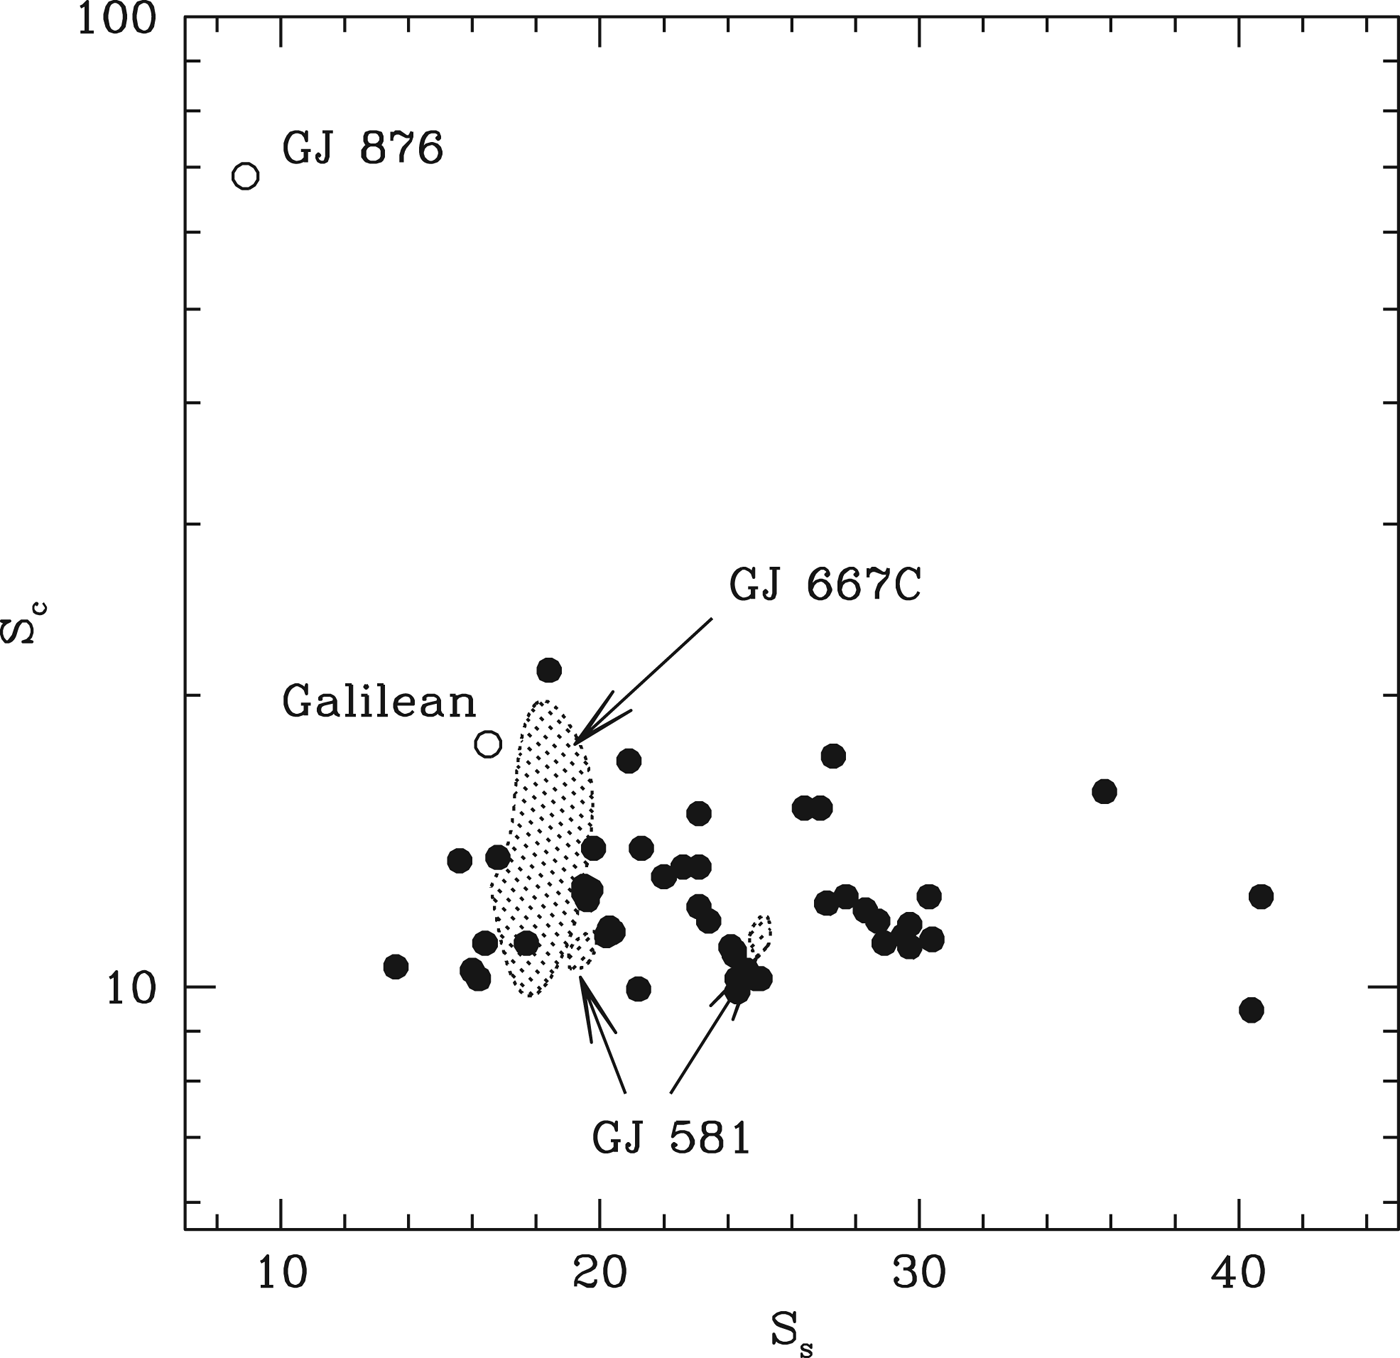
Our discussion has thus far focused on transiting systems, because of the larger sample size and prospects for eventual atmospheric characterization. However, several planetary systems have also been discovered around M dwarfs, and these are also well matched by in situ assembly models. Figure 17 shows the comparison of the simulation results with the observed planetary systems around the stars GJ 581 and GJ 667C (Udry et al. Reference Udry2007; Mayor et al. Reference Mayor2009; Vogt et al. Reference Vogt2010; Bonfils et al. Reference Bonfils2011; Forveille et al. Reference Forveille2011; Anglada-Escude’ et al. Reference Anglada-Escude2012, Reference Anglada-Escude2013; Vogt et al. Reference Vogt, Butler and Haghighipour2012; Delfosse et al. Reference Delfosse2013). We compare the relative spacings (S s) and mass concentration indices (S c) shown in Table 1 with the mass and periods measured from radial velocities. We see that both the observed systems fall within the parameter range probed by the simulations. The star GJ 667C hosts several potentially habitable planets (Anglada-Escude’ et al. Reference Anglada-Escude2013), as expected from the above discussion. We can also adapt this rationale to the controversy regarding the existence of habitable planets in the GJ 581 system (Vogt et al. Reference Vogt2010, Reference Vogt, Butler and Haghighipour2012; Forveille et al. Reference Forveille2011). The existence of GJ 581c and GJ 581d is not disputed, and they exhibit a period ratio of 6.8, corresponding to y=3.59. Their estimated minimum combined mass is 11.2 M ⊕, which yields Δ~34, for a host star mass ~0.32 M ⊙. The issue is whether the claimed planet GJ 581g exists between them. Compared to Fig. 6, we see that Δ~34 is larger than most pairs, but does occur in a few cases. Thus, it is not impossible that there is a true gap between GJ 581c and GJ 581d, although there should be another planet between them in the majority of planetary systems of this type. If GJ 581g did exist with the nominal 3.1 M ⊕ mass and 36.6 day period, it would yield Δ~23 and Δ~12 with respect to the inner and outer companions, which is also not ruled out on dynamical grounds, although it would be comparable to the most compact systems that emerged from the simulations. It is possible to locate a planet in this gap in a more dynamically stable location, in terms of maximizing the Δ values with respect to both GJ 581c and GJ 581d. Planets with periods ~29 days would have Δ~20 with respect to both neighbours, assuming a 1 M ⊕ planet in the gap.

Fig. 17. The filled circles show the statistical measures that characterize the simulations, given in Table 1. The quantity S s measures the average separation between planets in terms of their mutual Hill radii, while S c is a measure of how evenly spread the system mass is between the various components (low values imply an even spread and high values imply a concentration into only some members). The shaded regions indicate the estimated values for the GJ 667C and GJ 581 systems, accounting for the 1σ uncertainties in the masses. We show two regions for GJ 581, corresponding to whether we include GJ 581g (lower S s value) or not. The open circles show two other systems of potential applicability – the Galilean moons of Jupiter and the four-planet system around the M-dwarf GJ 876. However, in both cases there is room to question the applicability of the model. The Galilean moons have similar mass ratios, but the evident commensurabilities are usually taken as evidence of migration from their formation positions. The host star GJ 876 is indeed an M-dwarf, but two of the planets are of Jovian mass, implying substantial gas accretion not accounted for in this model.
Although the in situ assembly model provides a good description of the distribution of period ratios and overall period distribution of the observed multiple systems, we must also note that the model once again underpredicts the number of single tranets observed, just as in the case of the solar-like hosts (HM13). Furthermore, Fig. 9 shows that the ratio of singles to doubles is similar to the case of the solar hosts. However, unlike in the solar case, it does appear as though there is some difference in the distribution of single tranets, in that there is a great overabundance of single tranet systems for orbital periods <2.2 days. Once again, this discrepancy suggests that our description is not complete, and that a comprehensive model for the formation of these planetary systems will require additional elements to either reduce the multiplicity of some systems, or to increase the spread in inclinations. Indeed, if we postulate a second process that produces only single planet systems, then, in order to match the observed multiplicities, we require that ~58% of observed tranet systems form via this alternative process. Our model would then be responsible for the remaining 42% systems, and for 56% of all observed tranets, including all multiple tranet systems.
This has implications for the estimates of the frequency of habitable planets around M dwarfs. The analysis of the frequency of tranet detections (DC13, Kopparapu Reference Kopparapu2013) indicates that such planetary systems around M dwarfs are quite common, and that the nearest planet in the HZ of an M dwarf may be within only a few parsecs. DC13 estimate that 25% of early M-dwarfs host a planet with radius between 0.5 and 1.4 R ⊕. If we assume that these planets result from our in situ model plus the second, singles-only process in the proportions above, this implies that 10% of such stars host high multiplicity systems. Given that every planetary system formed by the above model produces at least one HZ planet, this suggests that the incidence of habitable planets is ~0.10 per star, which is quite similar to the number obtained by DC13. It would also increase if we include those systems with radius between 1.4 and 4 R ⊕, which have an equivalent occurrence rate. Our results therefore only strengthen the conclusion of DC13, in that we demonstrate that the bulk of the observed systems are well reproduced by an in situ assembly model, and that the model suggests that a large fraction of planetary systems observed to have a transiting earth-mass planet at any period should also have at least one planet within the HZ.
Acknowledgements
This research has made use of the NASA Exoplanet Archive, which is operated by the California Institute of Technology, under contract with the National Aeronautics and Space Administration under the Exoplanet Exploration Program, and has also benefitted from the considerable governmental and community investment of resources and effort that produced the spectacular scientific legacy of the Kepler mission.

