1. Introduction
The Pohang Accelerator Laboratory (PAL), Pohang, South Korea, is developing a 0.1 nm SASE based free-electron laser (FEL), named PAL-XFEL, for high power, short pulse X-ray coherent photon sources. It is adjacent to the existing third-generation light source, PLS-II, which was upgraded to a ![]() $3~\text{GeV}/400~\text{mA}/6~\text{nm}$ facility in 2010 (see Figure 1). The PAL-XFEL project was started in 2011 with a five-year total budget of 400 million US dollar, its building construction was completed by the end of 2014, and successively the installation of linac, undulator and beamline followed and will be completed by the end of 2015. The FEL commissioning will be started in early 2016.
$3~\text{GeV}/400~\text{mA}/6~\text{nm}$ facility in 2010 (see Figure 1). The PAL-XFEL project was started in 2011 with a five-year total budget of 400 million US dollar, its building construction was completed by the end of 2014, and successively the installation of linac, undulator and beamline followed and will be completed by the end of 2015. The FEL commissioning will be started in early 2016.
The PAL-XFEL includes a 10 GeV S-band normal conducting linac consisting of a photocathode RF-gun, 174 accelerating structures with 50 klystrons and modulators, one X-band system for linearization, and three bunch compressors (see Table 1). Beyond the 10 GeV linac, a 250 m long hard X-ray undulator hall follows. An experimental hall, which is 60 m long and 16 m wide, is located at the end of the facility. The total length of the building is 1110 m.
Among the five available undulator lines in the undulator halls, only two undulator lines will be prepared during the construction period 2011–2105: a hard X-ray FEL line (HX1) with 18 undulators and a soft X-ray FEL line (SX1) with eight undulators, as shown in Figure 2. HX1 covers the wavelength range ![]() ${\it\lambda}=0.06{-}0.6~\text{nm}$ using a 4–10 GeV electron beam and uses linear polarization, variable gap, out-vacuum undulators. SX1 covers the wavelength range
${\it\lambda}=0.06{-}0.6~\text{nm}$ using a 4–10 GeV electron beam and uses linear polarization, variable gap, out-vacuum undulators. SX1 covers the wavelength range ![]() ${\it\lambda}=1.0{-}4.5~\text{nm}$ using a 3.15 GeV electron beam. In SX1, two elliptically polarized undulators (EPUs) following six planar undulators will be used for polarization control at the final stages of lasing. Sufficient space is reserved in the undulator halls for a future upgrade to house a total of 28 undulators for HX1 and 15 undulators for SX1.
${\it\lambda}=1.0{-}4.5~\text{nm}$ using a 3.15 GeV electron beam. In SX1, two elliptically polarized undulators (EPUs) following six planar undulators will be used for polarization control at the final stages of lasing. Sufficient space is reserved in the undulator halls for a future upgrade to house a total of 28 undulators for HX1 and 15 undulators for SX1.
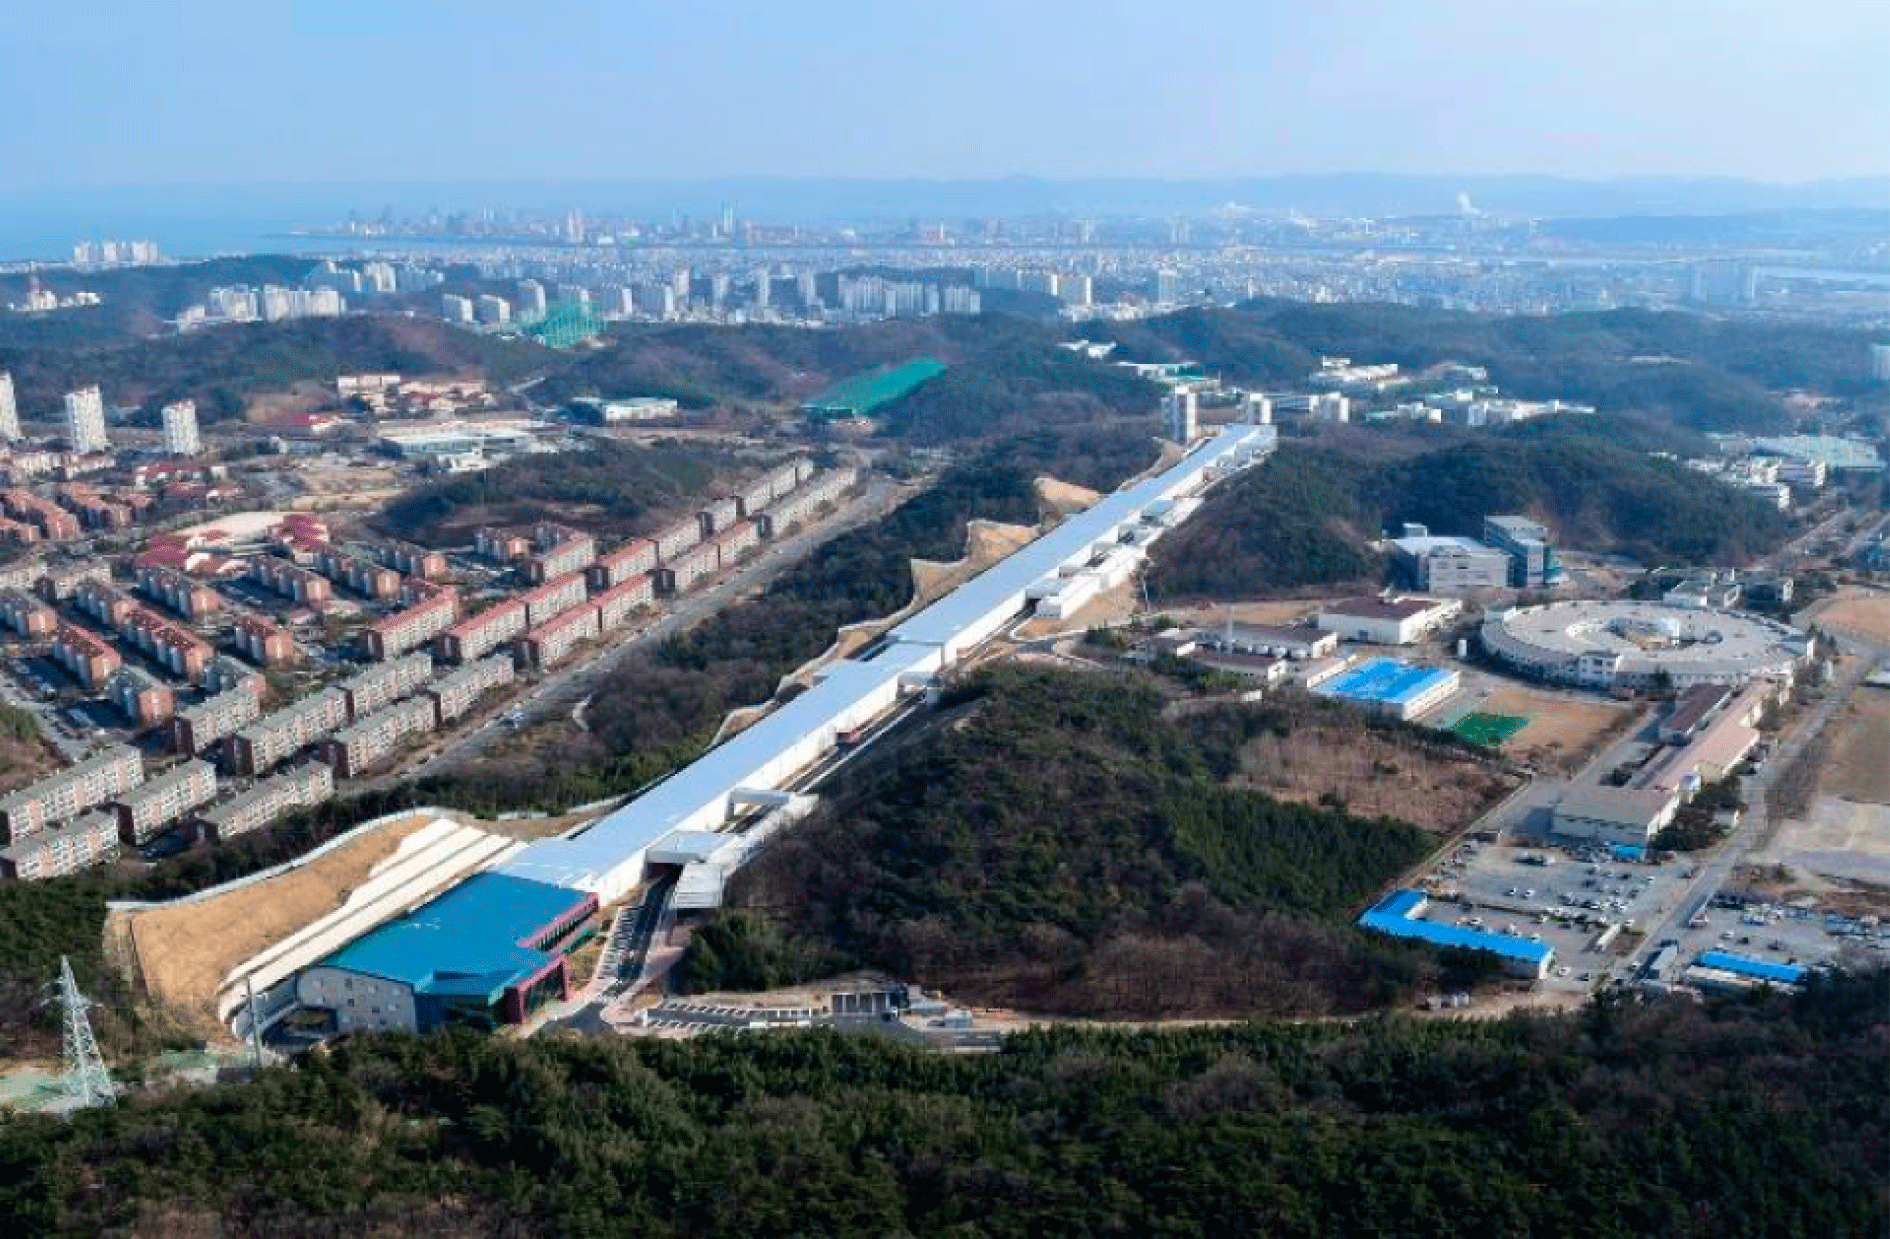
Figure 1. Construction site of PAL-XFEL.
Table 1. Parameters of PAL-XFEL.


Figure 2. FEL undulator line plan of PAL-XFEL.
Linac RF conditioning and injector commissioning are scheduled between October and December 2015. The first XFEL commissioning for HX1 is scheduled in early 2016, aiming for 0.3 nm radiation with a 6 GeV beam at 10 Hz. The second FEL commissioning is scheduled between September and December 2016 for the 0.1 nm hard X-ray FEL.
For the success of PAL-XFEL, two critical systems, namely a low emittance injector and a variable gap out-vacuum undulator, are being developed[Reference Kang, Han, Kim, Kim, Kim, Lee, Park, Park, Kang and Ko1]. The smaller the beam emittance from the injector, the shorter the saturation length is in the undulators, giving a higher radiation power generated through the SASE process. The requirement of undulator field accuracy is better than ![]() $2\times 10^{-4}$ and the undulator gap setting accuracy should be below
$2\times 10^{-4}$ and the undulator gap setting accuracy should be below ![]() $1~{\rm\mu}\text{m}$, which are challenging issues not easy to realize.
$1~{\rm\mu}\text{m}$, which are challenging issues not easy to realize.
At the beginning of the PAL-XFEL project in 2011, the Injector Test Facility (ITF) was built in the extended building of the PLS injector linac (see Figure 3). The ITF has the same configuration as the injector of the PAL-XFEL, which consists of a photocathode RF-gun, two 3 m long S-band constant gradient traveling-wave structures, and a laser heater. The ITF has been operational since 2012 for low emittance injector R&D.
In this paper we report recent beam measurement results using the RF-gun at ITF and the test result of a prototype of the undulator.
2. Low emittance injector
2.1. ITF
The PAL-XFEL baseline gun developed at PAL is a 1.6-cell structure withfour holes on the second cell, two of which are for RF power coupling and the others for vacuum ports (see Figure 4). Both cells have a round shape. Two RF input holes are made with mirror symmetry to minimize the dipole component of the RF field, and two additional pumping holes are used to reduce the quadrupole component[Reference Chae, Hong, Parc, Ko, Park, Qian, Huang and Tang2]. The peak accelerating field at the cathode is designed to be ![]() $120~\text{MV}~\text{m}^{-1}$ and the beam energy at the gun exit is 5.7 MeV[Reference Hong, Han, Min, Chae, Park, Park and Kang3].
$120~\text{MV}~\text{m}^{-1}$ and the beam energy at the gun exit is 5.7 MeV[Reference Hong, Han, Min, Chae, Park, Park and Kang3].
The cavity body was made by diamond machining oxygen-free copper. RF tuning was mainly done by controlling the cell length before the final brazing. The first gun used for the ITF was the gun fabricated in 2011. An improved gun, named Gun1-0, in terms of brazing and tuning process was fabricated in spring 2013. Gun1-0 was used for the ITF beam operation from summer 2013 to summer 2014. In September 2014, another gun, named Gun1-1, was installed at ITF. This gun will be used later for PAL-XFEL beam commissioning.

Figure 3. ITF.

Figure 4. Baseline gun for PAL-XFEL.
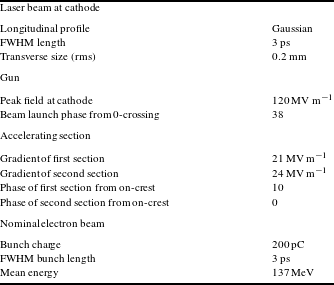
Table 2. Nominal operation parameters of ITF.
Oxygen-free copper, which is part of the gun cavity back plane, is used as photocathode. At nominal operating condition, a quantum efficiency (QE) of the order of ![]() $10^{-5}$ is measured. Laser cleaning was tried using an IR (760 nm) laser pulse as well as a UV (253 nm) laser pulse. An IR laser pulse with a length of hundreds of ps has been found to be most useful up to now. After the IR laser cleaning, the QE of the cathode recovered from
$10^{-5}$ is measured. Laser cleaning was tried using an IR (760 nm) laser pulse as well as a UV (253 nm) laser pulse. An IR laser pulse with a length of hundreds of ps has been found to be most useful up to now. After the IR laser cleaning, the QE of the cathode recovered from ![]() $4.0\times 10^{-5}$ to
$4.0\times 10^{-5}$ to ![]() $1.3\times 10^{-4}$ and was maintained for a few months[Reference Min, Hong and Chae4].
$1.3\times 10^{-4}$ and was maintained for a few months[Reference Min, Hong and Chae4].
The laser system is a commercial regenerative Ti:sapphire amplifier from Coherent Inc[Reference Min, Kim, Eom and Hong5]. The pulsing rate of the seed laser (Coherent Mira) is set to 79.333 MHz, which is synchronized to the master oscillator. A regenerative amplifier (Coherent Legend Elite) is used to generate a preamplified output with a 150 ps pulse length and a 120 Hz repetition rate. A post-power amplifier is employed to boost the output power up to 2.5 W with an rms jitter of 0.24%. The center wavelength of 770 nm is tripled to 257 nm for beam generation at the gun cathode. Various UV pulse lengths are used for electron beam generation.
A schematic diagram of the ITF beamline is shown in Figure 5. The detailed system parameters and typical electron beam parameters are described in Table 2. The emittance compensation solenoid (‘S1’) downstream of the ‘GUN’ enables the correction of space charge emittance growth. A Turbo Integrating Current Transformer (‘ICT1’) downstream of the solenoid measures the electron bunch charge. A YAG screen #1 (‘Y1’) is located downstream of ‘ICT1’ to measure the transverse beam profile. Then the electron beam is accelerated up to 140 MeV by two 3 m J-type S-band structures (‘ACC1’ and ‘ACC2’). After acceleration the emittance is measured using the quadrupole #3 (‘Q3’) and the screen #5 (‘Y5’).
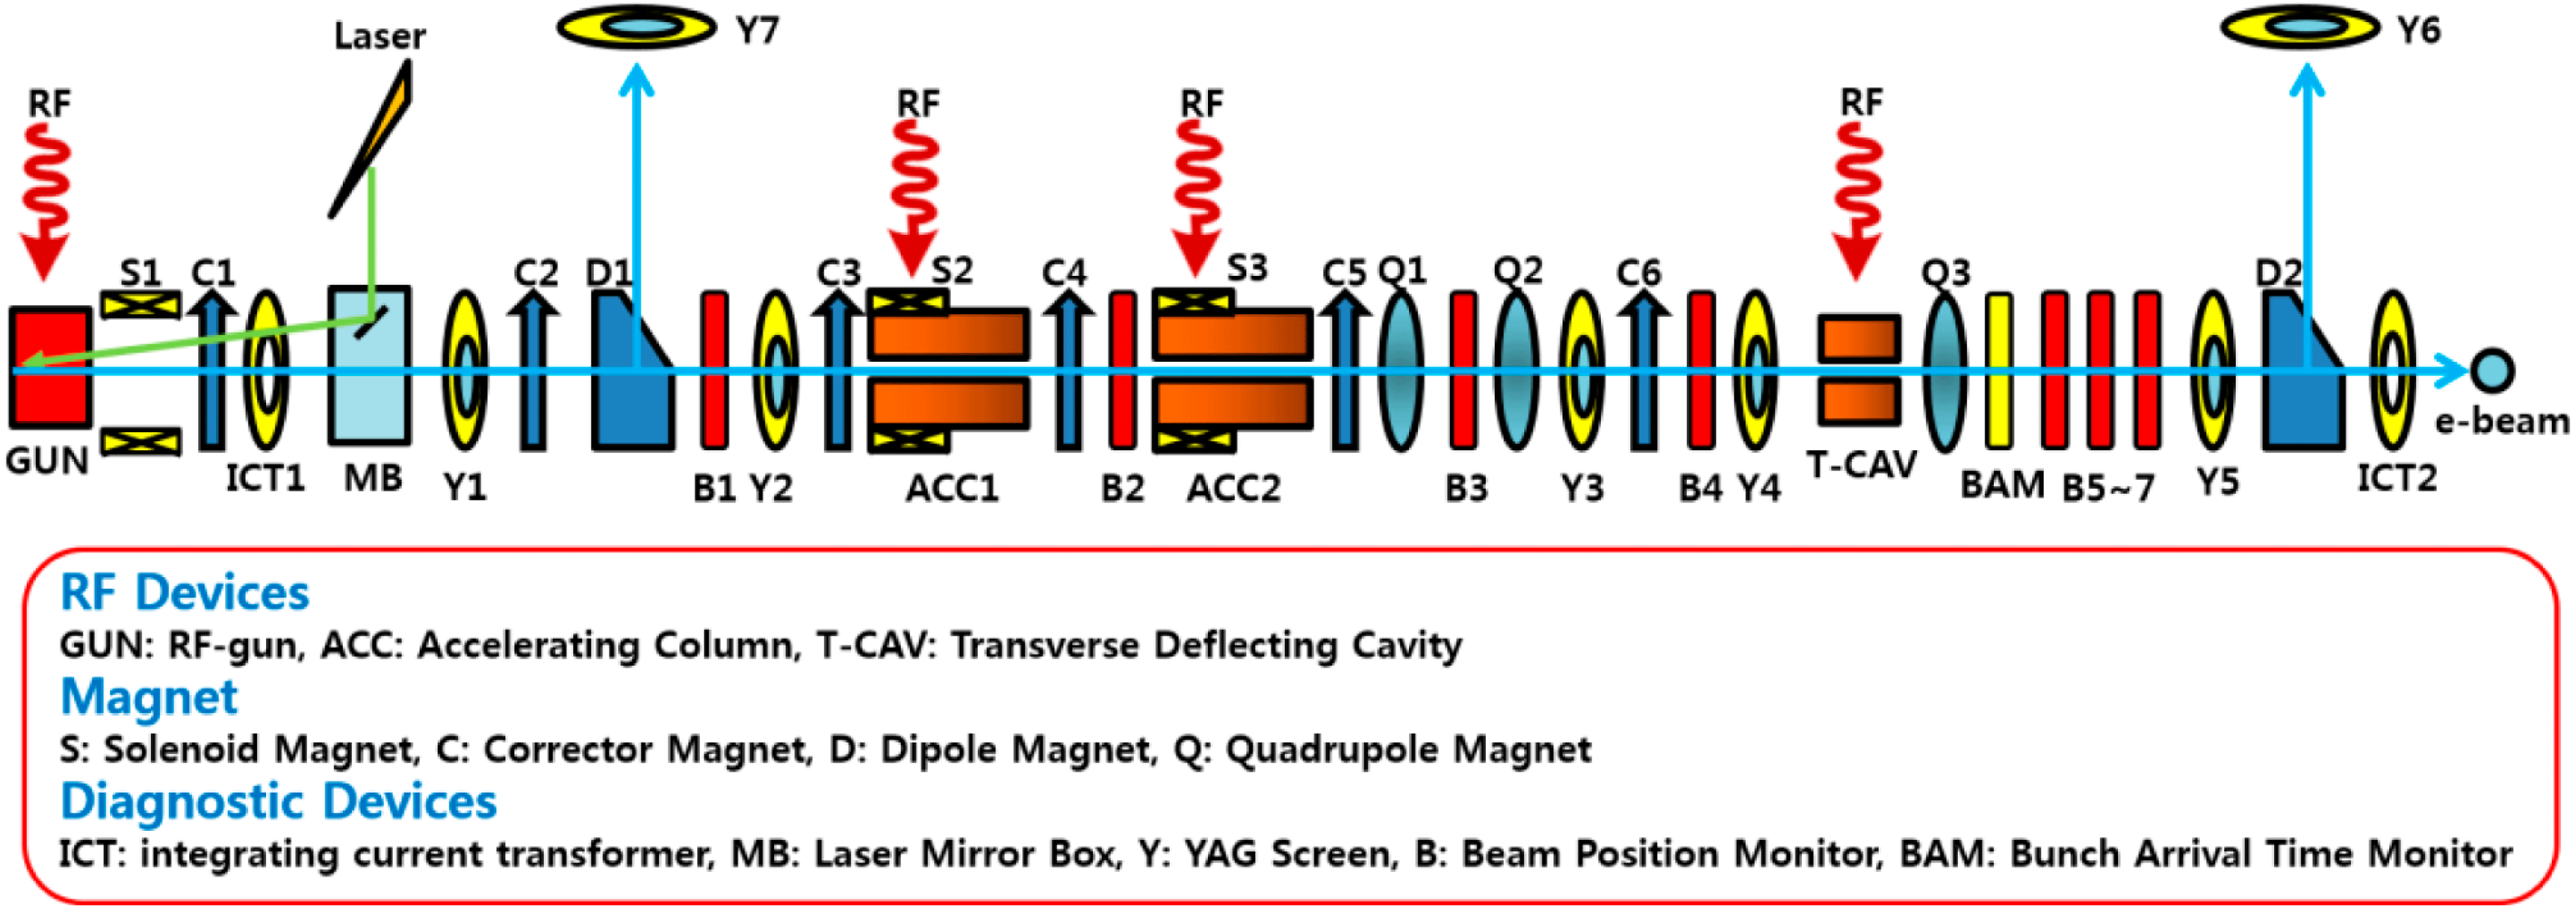
Figure 5. A schematic diagram of the ITF beamline.
The beam size is measured by using YAG crystals imaged with CCD cameras for image processing. The images are acquired with a 14-bit CCD camera synched to the electron beam pulse. The lens was set to give a calibration factor of ![]() $8~{\rm\mu}\text{m}$ per pixel, which is a compromise between capturing the full variation of the beam size and maximizing the resolution of smallest spot size. Typically, five images of the beam transverse profile are taken for each measurement. Typical images of each screen are shown in Figure 6.
$8~{\rm\mu}\text{m}$ per pixel, which is a compromise between capturing the full variation of the beam size and maximizing the resolution of smallest spot size. Typically, five images of the beam transverse profile are taken for each measurement. Typical images of each screen are shown in Figure 6.
Projected emittance is measured by scanning the strength of the quadrupole Q3[Reference Chae, Hong, Han, Park and Ko6]. The beam transverse profile is measured using the screen Y5 immediately upstream of the spectrometer dipole D2. The distance between the quadrupole and the screen is 2.6 m. The measured emittance is normalized by the beam energy measured with the spectrometer dipole D2.
Bunch charge is measured by using the ICT1. The QE of the photocathode is defined by the ratio of generated electrons and photons hitting the cathode surface. The measured QE of the copper cathode is ![]() $1.26\times 10^{-4}$. We also measure the bunch charge as a function of laser injection phase for three different bunch charges, as shown in Figure 7. Beam energies and their spreads as a function of injection phase are measured with the energy spectrometer (‘D2’
$1.26\times 10^{-4}$. We also measure the bunch charge as a function of laser injection phase for three different bunch charges, as shown in Figure 7. Beam energies and their spreads as a function of injection phase are measured with the energy spectrometer (‘D2’ ![]() $+$ ‘Y6’) (see Figure 8). In Figure 8, dashed lines represent the measurement and solid lines represent the calculated values. The relative beam energy spread for a laser injection phase around
$+$ ‘Y6’) (see Figure 8). In Figure 8, dashed lines represent the measurement and solid lines represent the calculated values. The relative beam energy spread for a laser injection phase around ![]() $40^{\circ }$ is about 0.1% rms.
$40^{\circ }$ is about 0.1% rms.

Figure 6. Typical images of five screens (left to right: ‘Y1’ to ‘Y5’).
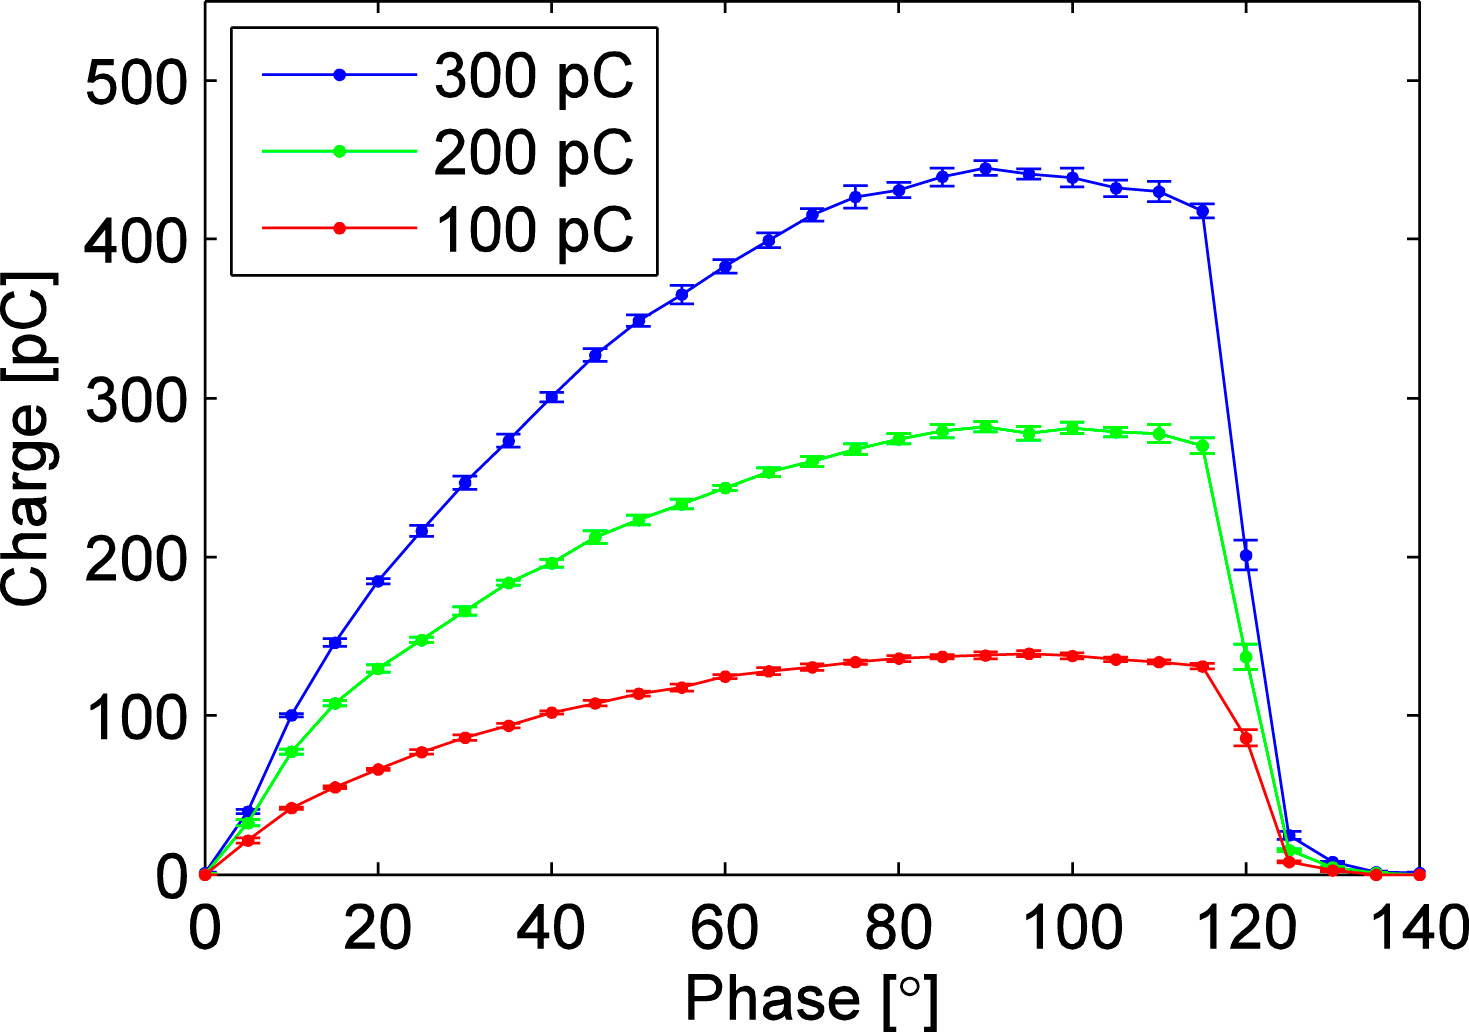
Figure 7. Measured bunch charge versus laser injection phase for three different bunch charges.
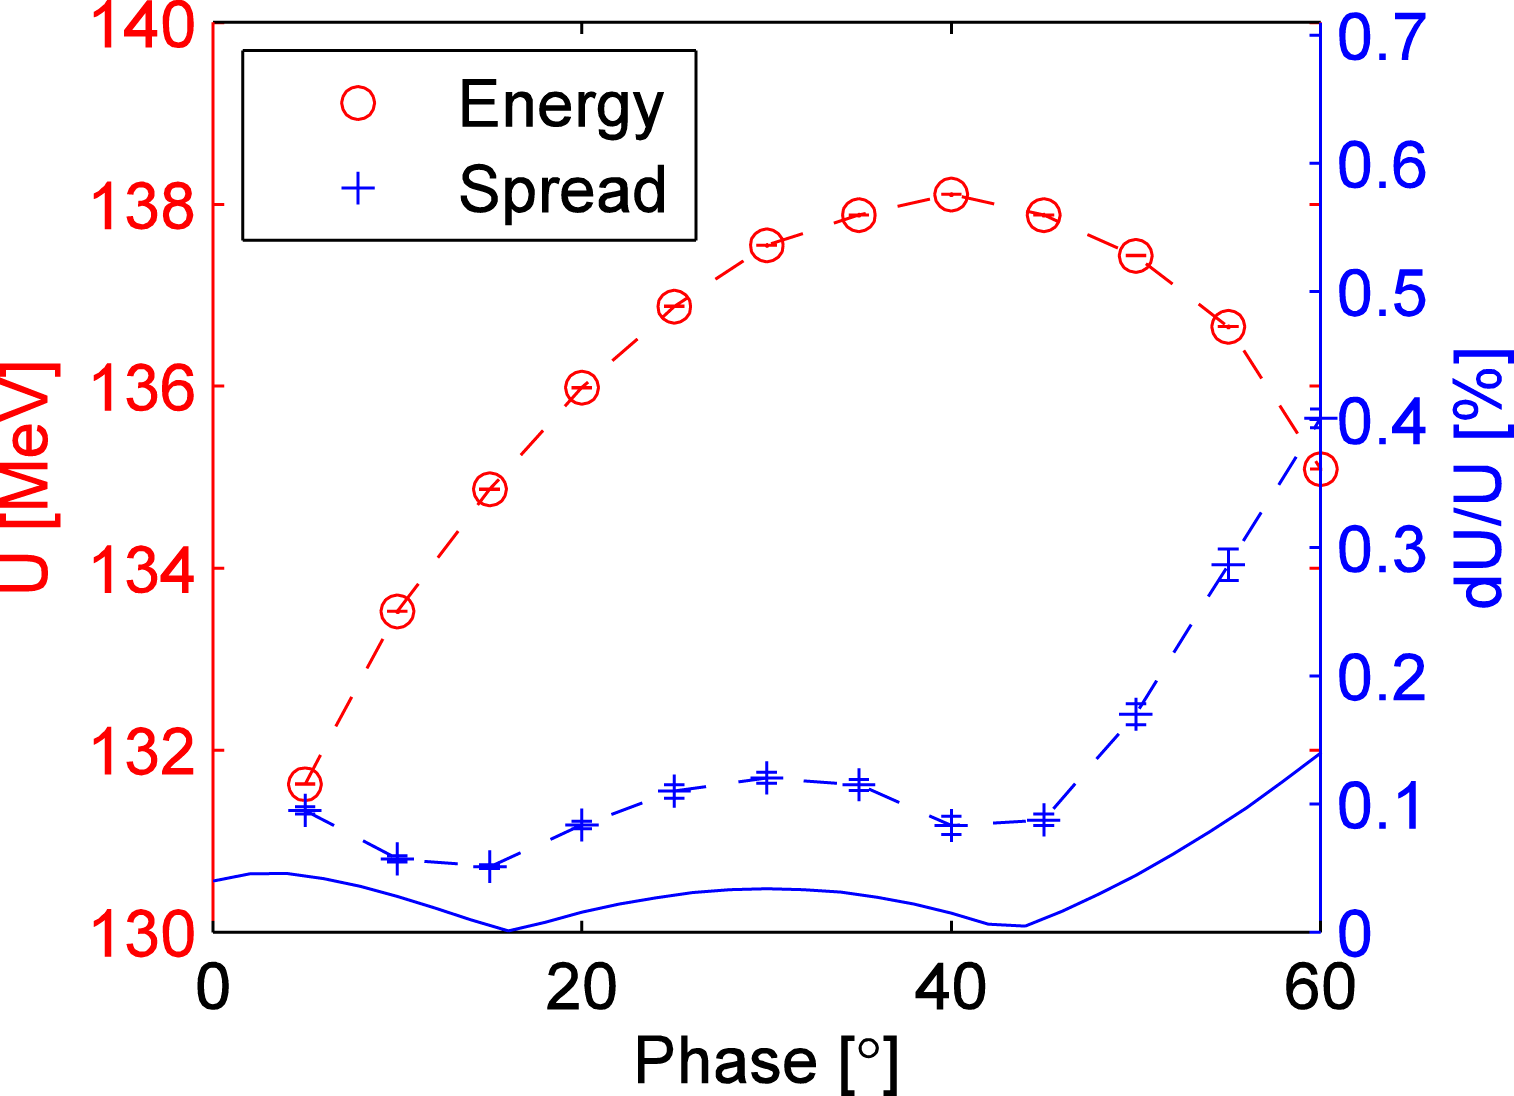
Figure 8. Electron energy and energy spread versus laser injection phase measured at the spectrometer D2.
2.2. Emittance measurement
In order to realize the target emittance of the PAL-XFEL injector an optimization study was carried out for various parameters, such as the laser beam transverse profile, laser pulse length, laser injection phase and gun energy.
The projected emittance of the electron beam is measured downstream of ‘ACC2’ using the single quad-scan technique, whereby the rms beam size, ![]() ${\it\sigma}$ is measured at the screen ‘Y5’ as the quadrupole strength,
${\it\sigma}$ is measured at the screen ‘Y5’ as the quadrupole strength, ![]() $k$, of ‘Q3’ is varied. Emittance measurements were done with 200 pC of charge using a longitudinally Gaussian distribution pulse with a FWHM of 3 ps, laser phase of
$k$, of ‘Q3’ is varied. Emittance measurements were done with 200 pC of charge using a longitudinally Gaussian distribution pulse with a FWHM of 3 ps, laser phase of ![]() $40^{\circ }$, gun energy of 5.75 MeV, and
$40^{\circ }$, gun energy of 5.75 MeV, and ![]() $-10^{\circ }$ off-crest acceleration in ‘ACC1’ with an accelerating field gradient of
$-10^{\circ }$ off-crest acceleration in ‘ACC1’ with an accelerating field gradient of ![]() $21~\text{MV}~\text{m}^{-1}$. In these measurement, the QE of the copper cathode is
$21~\text{MV}~\text{m}^{-1}$. In these measurement, the QE of the copper cathode is ![]() $1.26\times 10^{-4}$.
$1.26\times 10^{-4}$.
Figure 9 shows the three different transverse shapes of laser beam for the emittance measurement to determine the best shape. Figure 10 depicts the emittance as a function of the gun solenoid ‘S1’ current for three different transverse shapes of laser beam. The transverse shape #3 of laser beam is selected as the best among the three shapes.
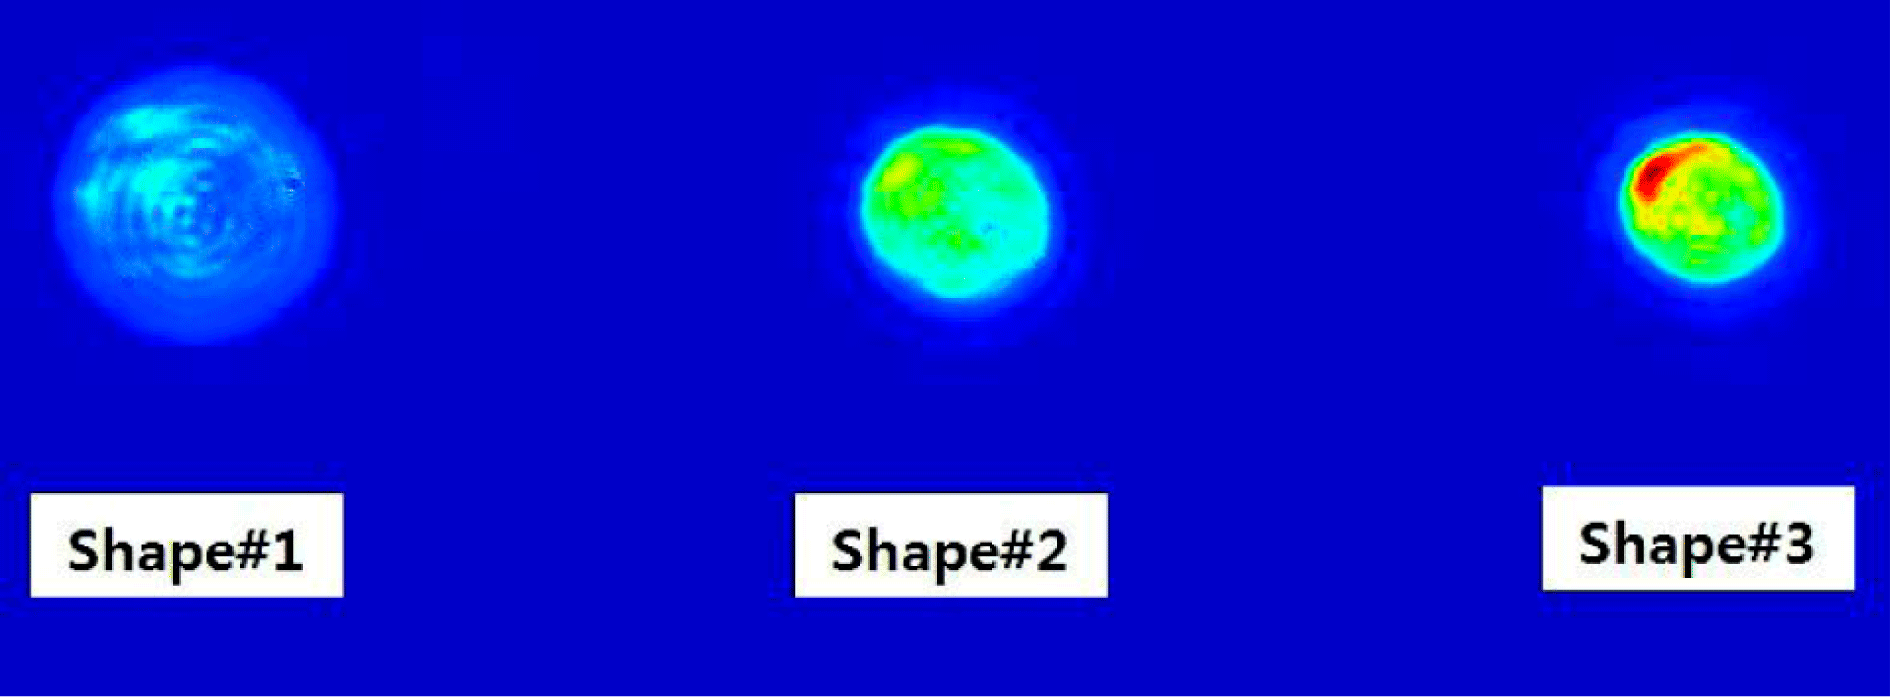
Figure 9. Three different transverse shapes of laser beam: Shape #1, #2 and #3.
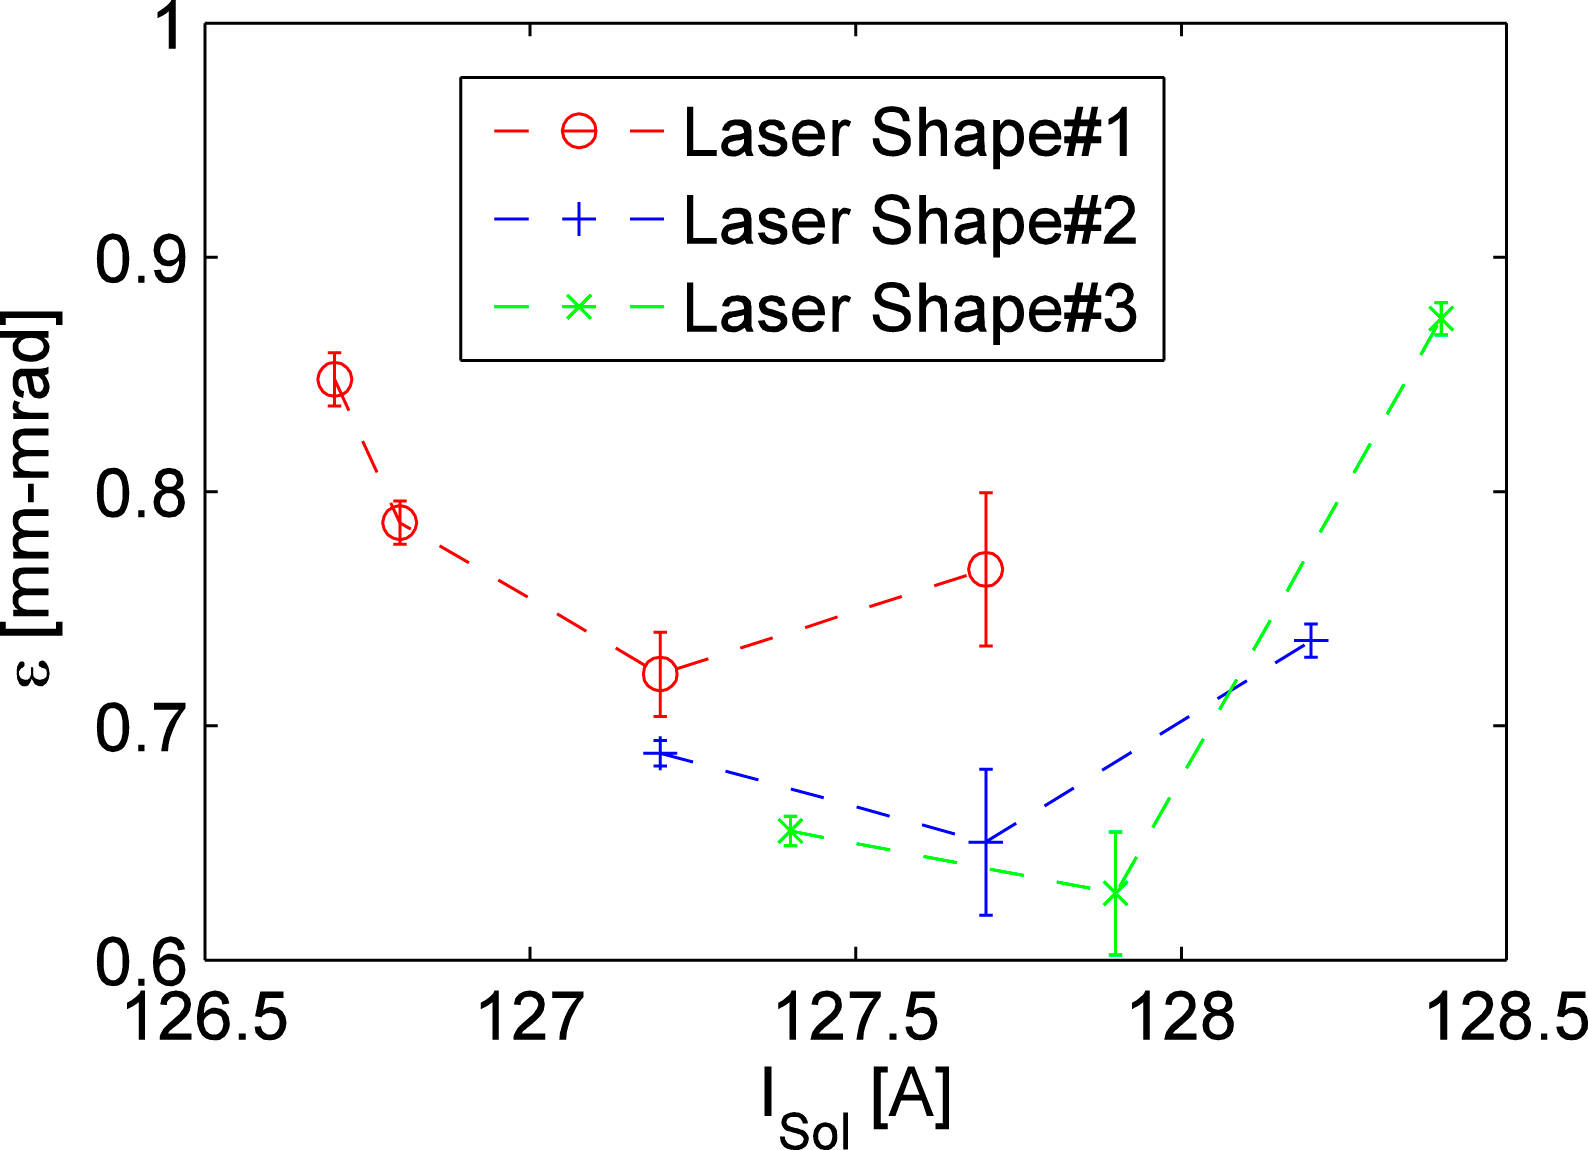
Figure 10. Emittance as a function of the gun solenoid current for three different shapes of laser beam.
Figure 11 depicts the emittance as a function of the gun solenoid ‘S1’ current for three different laser injection phases in the case of the laser beam transverse shape #2. The laser injection phase of ![]() $40^{\circ }$ is selected as the best among the three laser injection phases. The emittances as a function of the gun solenoid ‘S1’ current for three RF-gun energies of 5.25, 5.5 and 5.75 MeV are shown in Figure 12. The RF-gun energy of 5.5 MeV is selected as the best among the three beam energies.
$40^{\circ }$ is selected as the best among the three laser injection phases. The emittances as a function of the gun solenoid ‘S1’ current for three RF-gun energies of 5.25, 5.5 and 5.75 MeV are shown in Figure 12. The RF-gun energy of 5.5 MeV is selected as the best among the three beam energies.
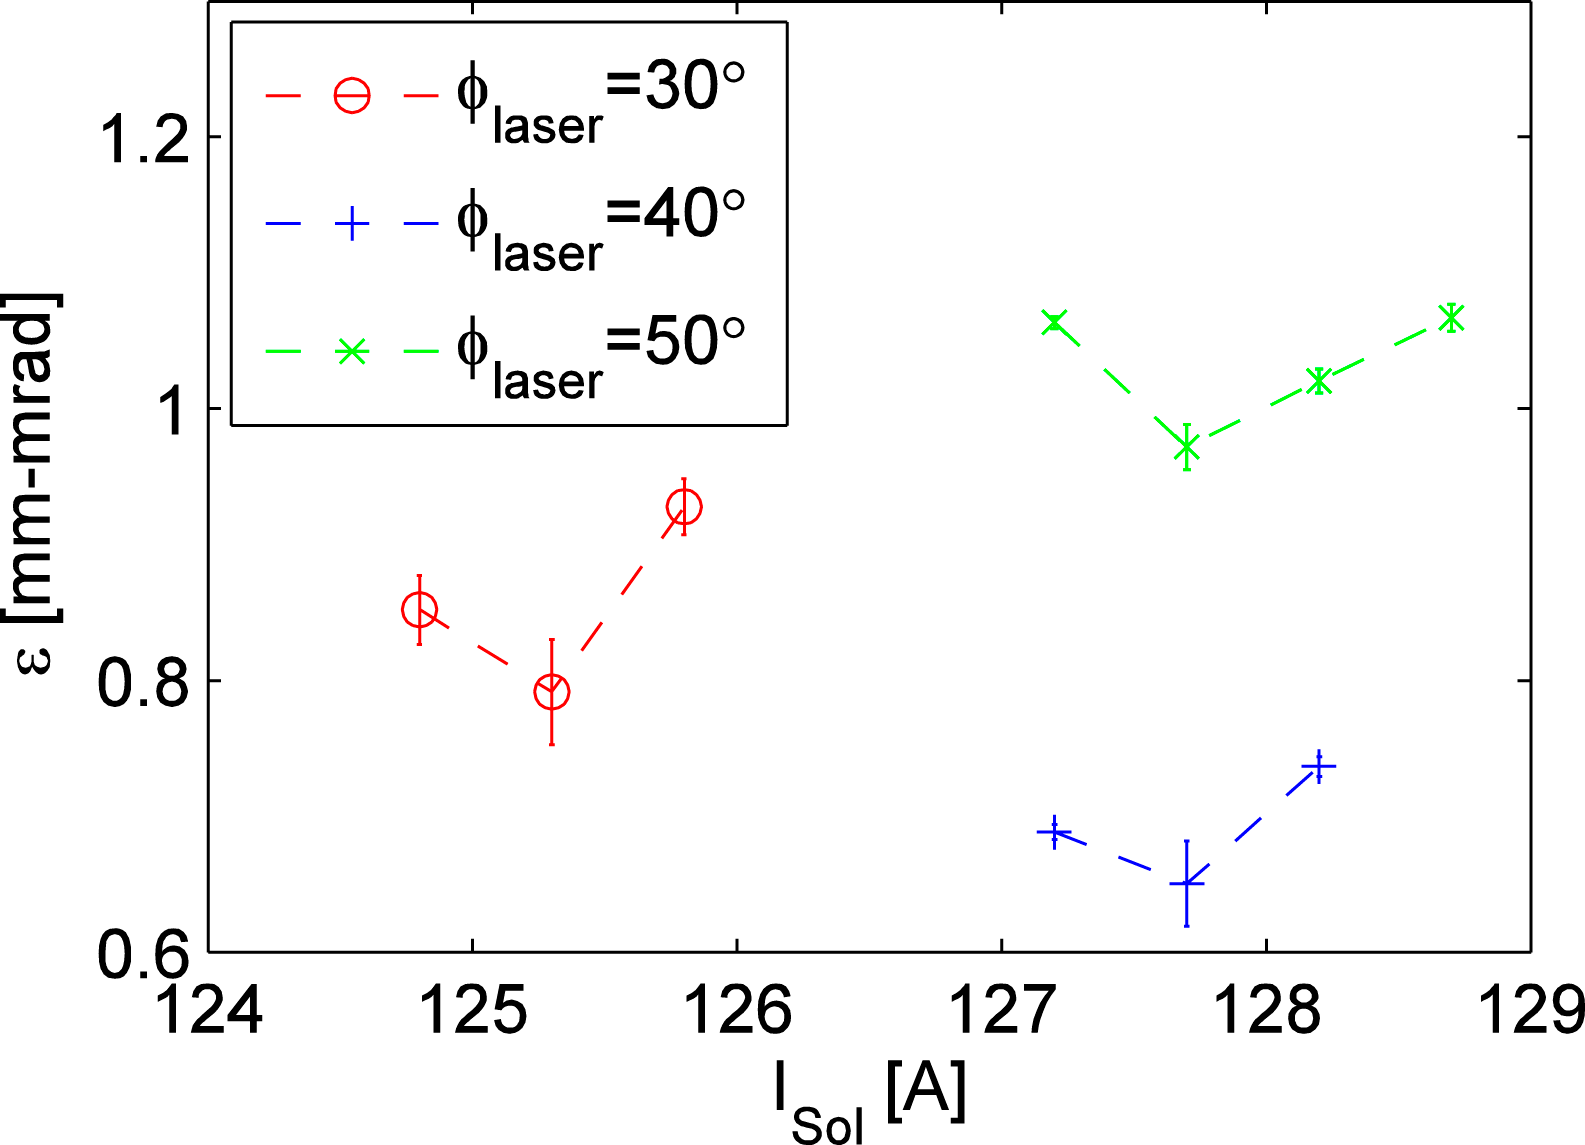
Figure 11. Emittance as a function of the gun solenoid current for three different laser injection phases using the laser beam transverse shape #2.
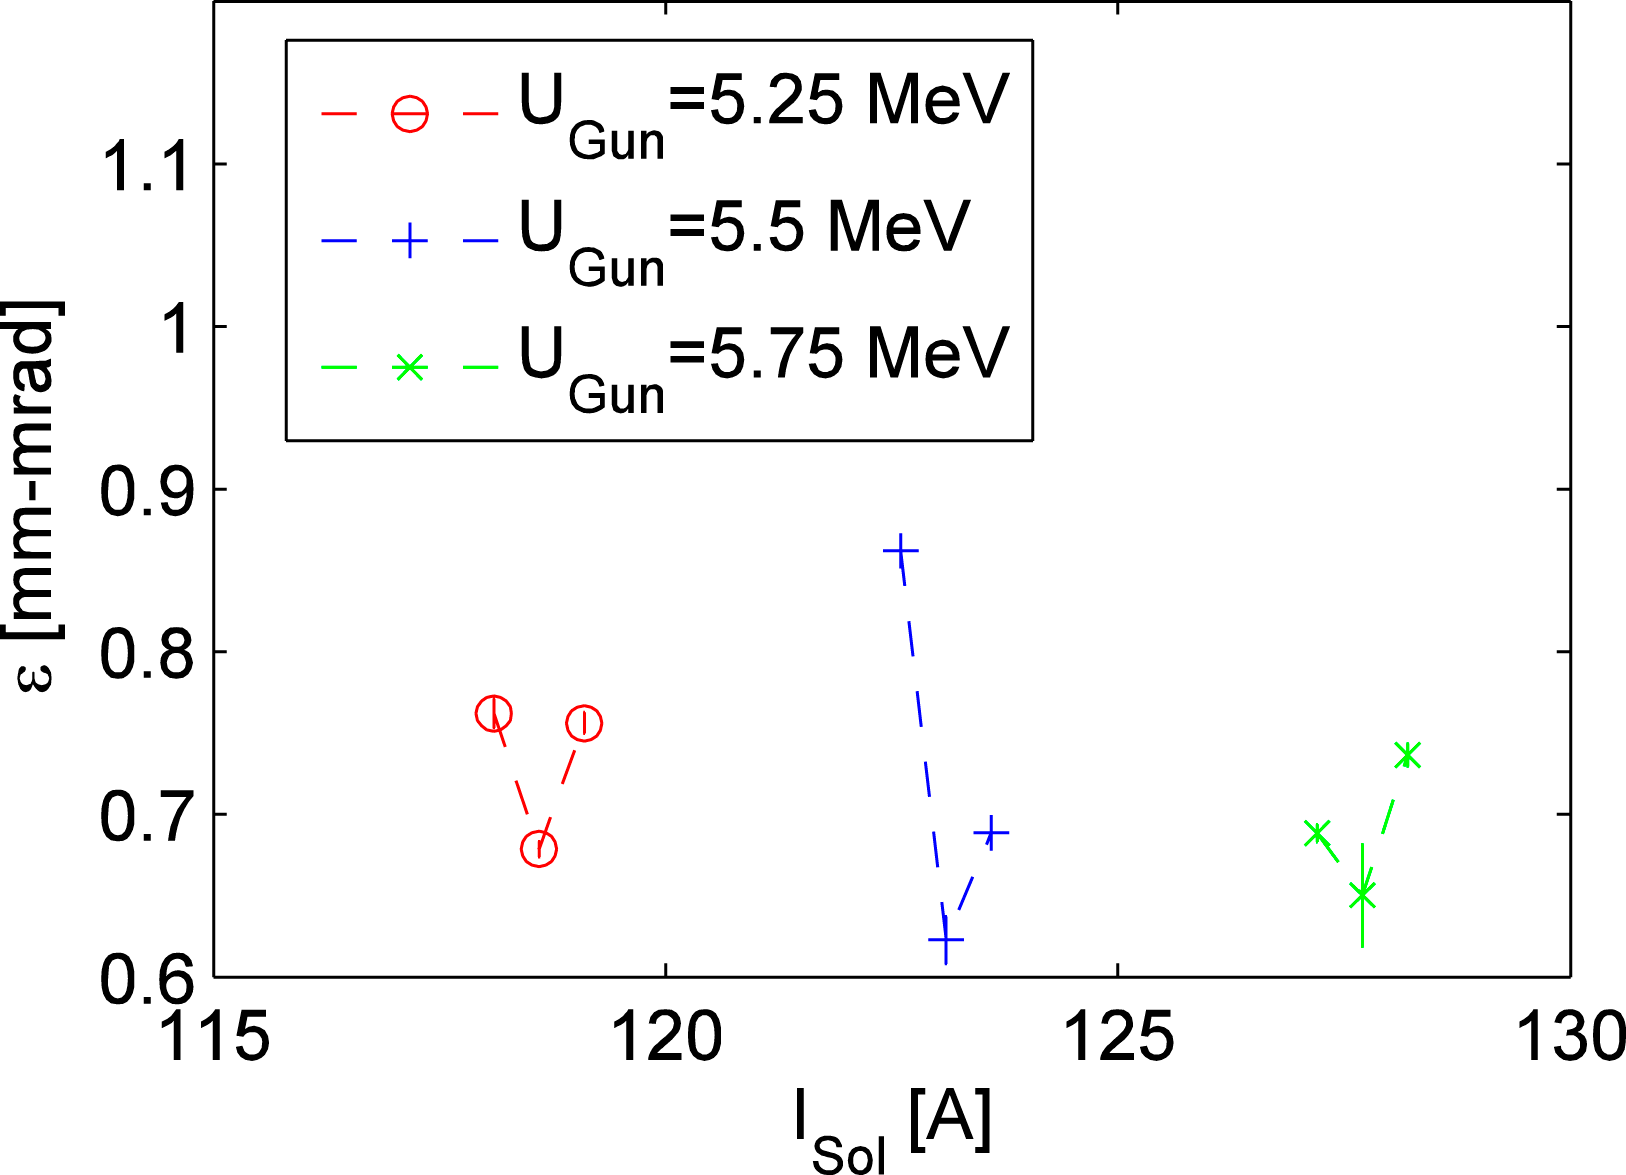
Figure 12. Emittance as a function of the gun solenoid current for three different beam energies using the laser beam transverse shape #2.
The emittance as a function of the solenoid ‘S1’ current for three different laser pulse lengths of 2, 3 and 4 ps are shown in Figure 13. The laser pulse length of 3 ps shows as the best among the three pulse lengths, unlike the simulation result showing the longest pulse as the best. In the numerical simulation using the ASTRA code the electron beam generated with a 5 ps laser pulse length has a smaller emittance than that of the 3 ps case[Reference Flöttmann7]. Through this optimization study, the transverse emittances measured at the ITF are ![]() ${\it\varepsilon}_{x}=0.481\pm 0.010~\text{mm}~\text{mrad}$ and
${\it\varepsilon}_{x}=0.481\pm 0.010~\text{mm}~\text{mrad}$ and ![]() ${\it\varepsilon}_{y}=0.597\pm 0.020~\text{mm}~\text{mrad}$. The horizontal emittance meets the specification, while the vertical emittance does not. A further optimization study is ongoing to reduce the emittance to below 0.5 mm mrad.
${\it\varepsilon}_{y}=0.597\pm 0.020~\text{mm}~\text{mrad}$. The horizontal emittance meets the specification, while the vertical emittance does not. A further optimization study is ongoing to reduce the emittance to below 0.5 mm mrad.

Figure 13. Emittance as a function of the gun solenoid current for three different bunch lengths in the case of an RF-gun energy of 5.5 MeV.
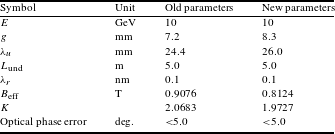
Table 3. Major parameters of the HXU undulator.
3. Undulator
For the PAL-XFEL, two undulator systems are under construction: 18 planar undulators for the hard X-ray line (called HXU) and six planar undulators with two additional EPUs for the soft X-ray line (called SXU). The two EPUs will be used for polarization control and installed at the end as the final stages of lasing. The major parameters of the HXU line were changed recently and the updated parameters are shown in Table 3. Changes include an increase of the minimum magnetic gap from 7.2 to 8.3 mm and a corresponding increase of the period length from 24.4 to 26.0 mm so that the radiation wavelength is unchanged at 0.1 nm at 10 GeV electron beam energy. The parameters of the EPUs are under study now, and the magnetic pole gap is 10.0 mm with a 44.0 mm magnetic period to match the resonance condition with the planar hybrid undulator for the soft X-ray undulator lines.
For the PAL-XFEL undulators, the EU-XFEL design and technology[Reference Altarelli, Brinkmann, Chergui, Decking, Dobson, Düsterer, Grübel, Graeff, Graafsma, Hajdu, Marangos, Pflüger, Redlin, Riley, Robinson, Rossbach, Schwarz, Tiedtke, Tschentscher, Vartaniants, Wabnitz, Weise, Wichmann, Witte, Wolf, Wulff and Yurkov8–Reference Pflueger, Bagha-Shanjani, Berndgen, Beckmann, Biermordt, Deron, Englisch, Karabekyan, Ketenoglu, Knoll, Li, Wolff-Fabris and Yakapov10] was adopted and further developed. The EU-XFEL design is well proven using standardization and optimization for mass serial production[Reference Englisch, Li and Pflueger9, Reference Pflueger, Bagha-Shanjani, Berndgen, Beckmann, Biermordt, Deron, Englisch, Karabekyan, Ketenoglu, Knoll, Li, Wolff-Fabris and Yakapov10] and was successfully used for the production of 91 undulators for the EU-XFEL.
The PAL-XFEL undulator is benchmarking the conceptual details of EU-XFEL undulators. Its key properties are:
(a) There is one standard mechanical system to be used for all planar undulators. It is designed for worst case magnetic loads and allows its use for both HXU and SXU without restrictions.
(b) In order to minimize girder deformation under magnetic loads, four support points are provided. Temperature-dependent bimetallic deformation is consequently avoided by careful material pairing.
(c) A state-of-the-art control system is used for motion control and device supervision. It is completely based on industrial components, which are available off the shelf.
(d) The gap is changed by four independent spindles with servo motors, which are synchronized electronically.
(e) The true gap is measured with two absolute linear encoders on both ends. They are used for the feedback of the motion control.
(f) EU-XFEL type Pole Height Tuning is used. The poles can be shifted by about
 $\pm 300~{\rm\mu}\text{m}$ and tilted by
  $\pm 4~\text{mrad}$ using tuning studs and locking screws. This is a big advance as compared to using conventional magnetic and/or non-magnetic shims. In contrast to shims, Pole Height Tuning is bi-polar and continuous. Magnetic shims are unipolar and only weaken poles. In addition they are only available in discrete steps. By using Pole Height Tuning an undulator can be readily pre-assembled at a supplier. Provided that suitable a magnetic measurement facility is available the tuning is readily done in house.
At PAL a full scale prototype undulator was built. It is based on the EU-XFEL concept with some modifications reflecting different magnetic periods and pole gaps. In addition, precision tilt meters were attached to the girders to monitor parallel motion. Unfortunately this prototype is based on the old magnetic period of 24.4 mm and old magnetic gap of 7.2 mm. But it is, however, a good test bed to check the mechanical integrity and to develop the entire pole tuning scheme. This prototype undulator is shown on the measurement bench in Figure 14. The completed undulator was mechanically tested by installing a precision external gap sensor comparing the rotary encoder values and the actual gaps.
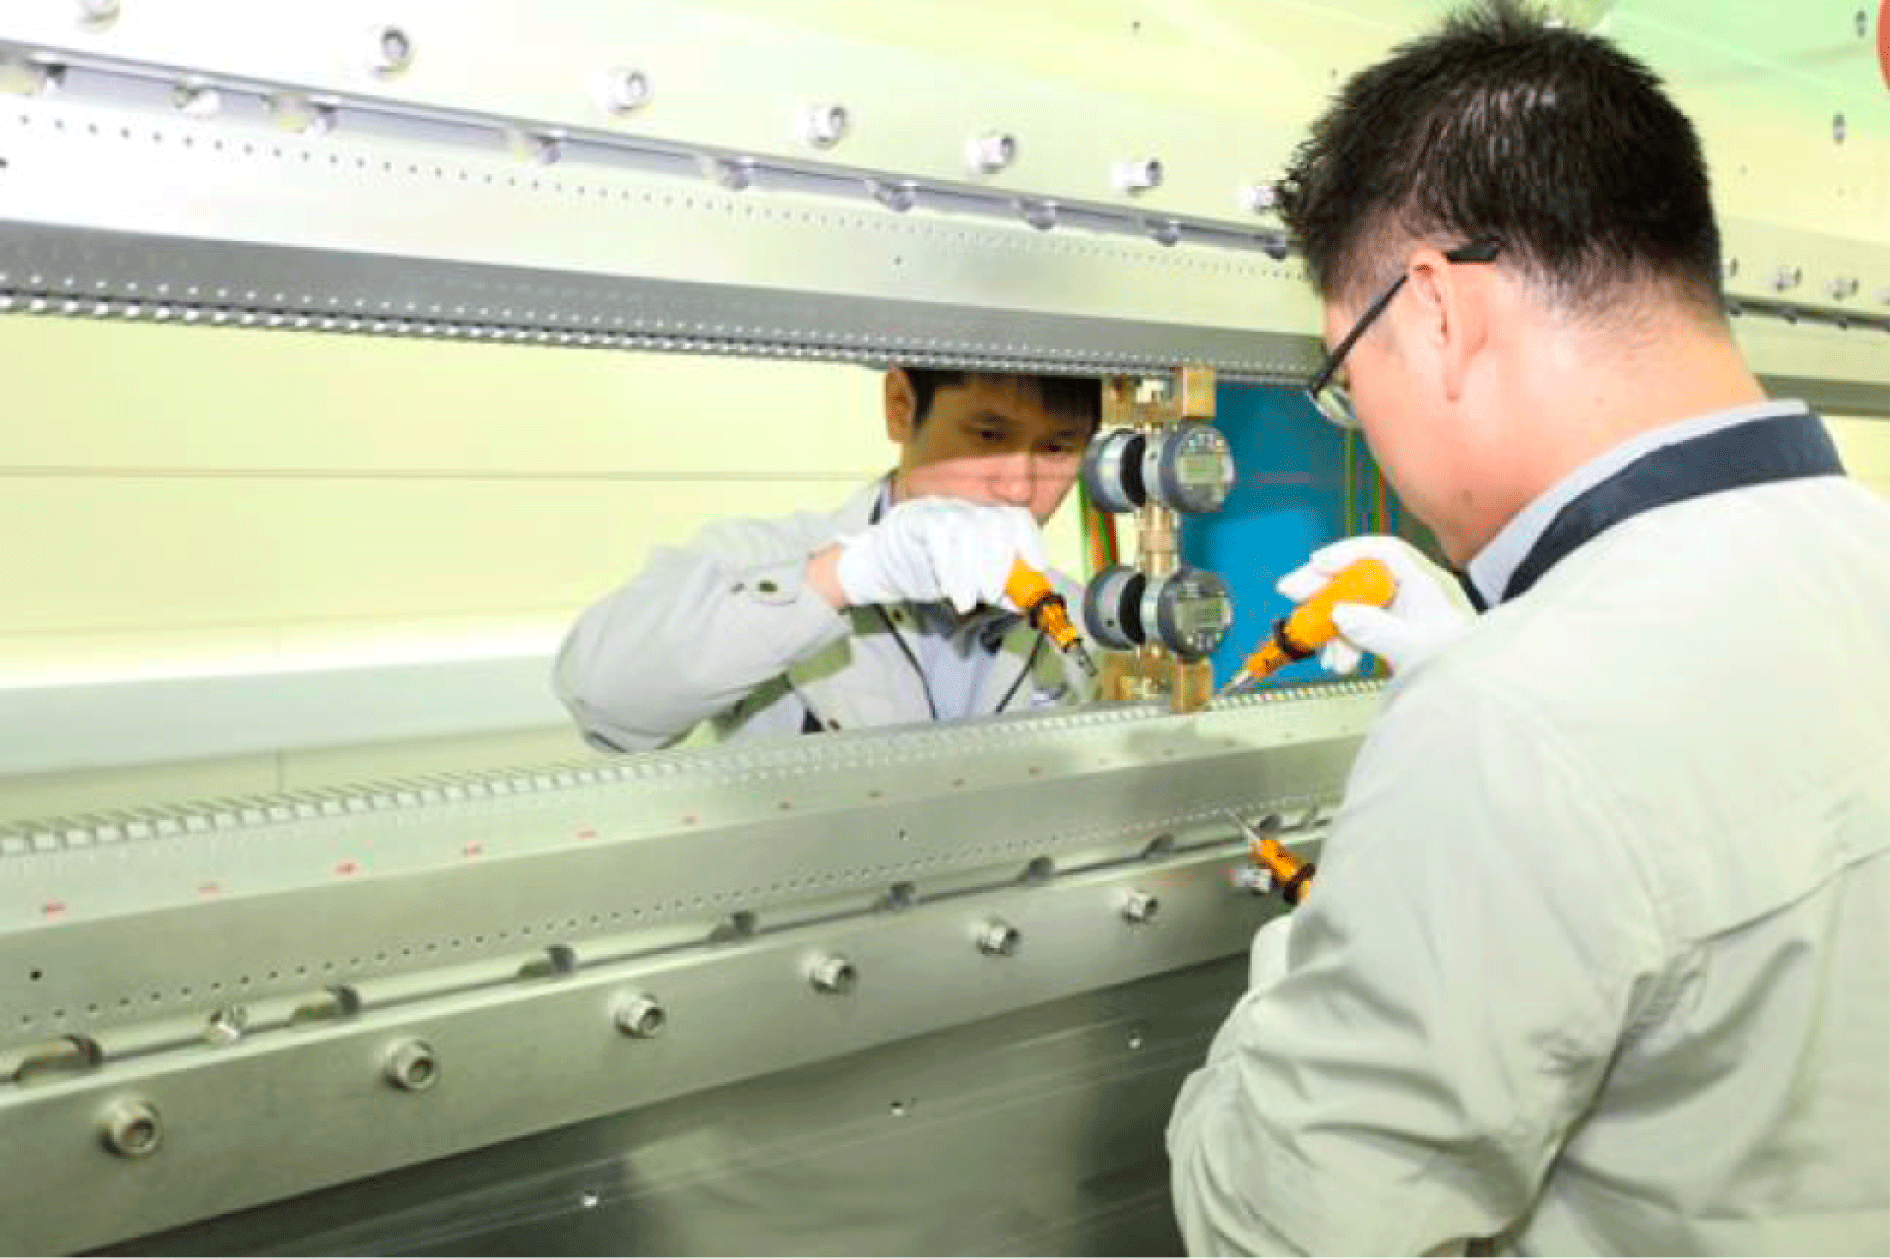
Figure 14. Prototype HX undulator undergoing the pole tuning procedure.
Hall scanning measurements and experiments to acquire the pole tuning effects as well as pole tuning experiments to improve the orbit and optical phase errors are being carried out. The field change for pole tuning height of ![]() $100~{\rm\mu}\text{m}$ at a 9.5 mm gap is shown in Figure 15. A 9.5 mm gap is chosen as the tuning gap to optimize the old parameter undulator for the whole working range of the undulator gap, which is 7.2 to 12.0 mm. The effect of pole height is measured to be linear: the
$100~{\rm\mu}\text{m}$ at a 9.5 mm gap is shown in Figure 15. A 9.5 mm gap is chosen as the tuning gap to optimize the old parameter undulator for the whole working range of the undulator gap, which is 7.2 to 12.0 mm. The effect of pole height is measured to be linear: the ![]() $100~{\rm\mu}\text{m}$ result is twice that of
$100~{\rm\mu}\text{m}$ result is twice that of ![]() $50~{\rm\mu}\text{m}$. The background fluctuation between the poles is
$50~{\rm\mu}\text{m}$. The background fluctuation between the poles is ![]() ${\approx}\!\pm 5\times 10^{-4}$. It can be explained by a random positioning error of the Hall probe during the measurements of only about
${\approx}\!\pm 5\times 10^{-4}$. It can be explained by a random positioning error of the Hall probe during the measurements of only about ![]() $3.0~{\rm\mu}\text{m}$. The field change under the tuned pole is largest. But there is an effect with opposite sign on the direct neighbor poles. This effect is small in amplitude but not in importance. The whole area on both sides has to be taken into account.
$3.0~{\rm\mu}\text{m}$. The field change under the tuned pole is largest. But there is an effect with opposite sign on the direct neighbor poles. This effect is small in amplitude but not in importance. The whole area on both sides has to be taken into account.
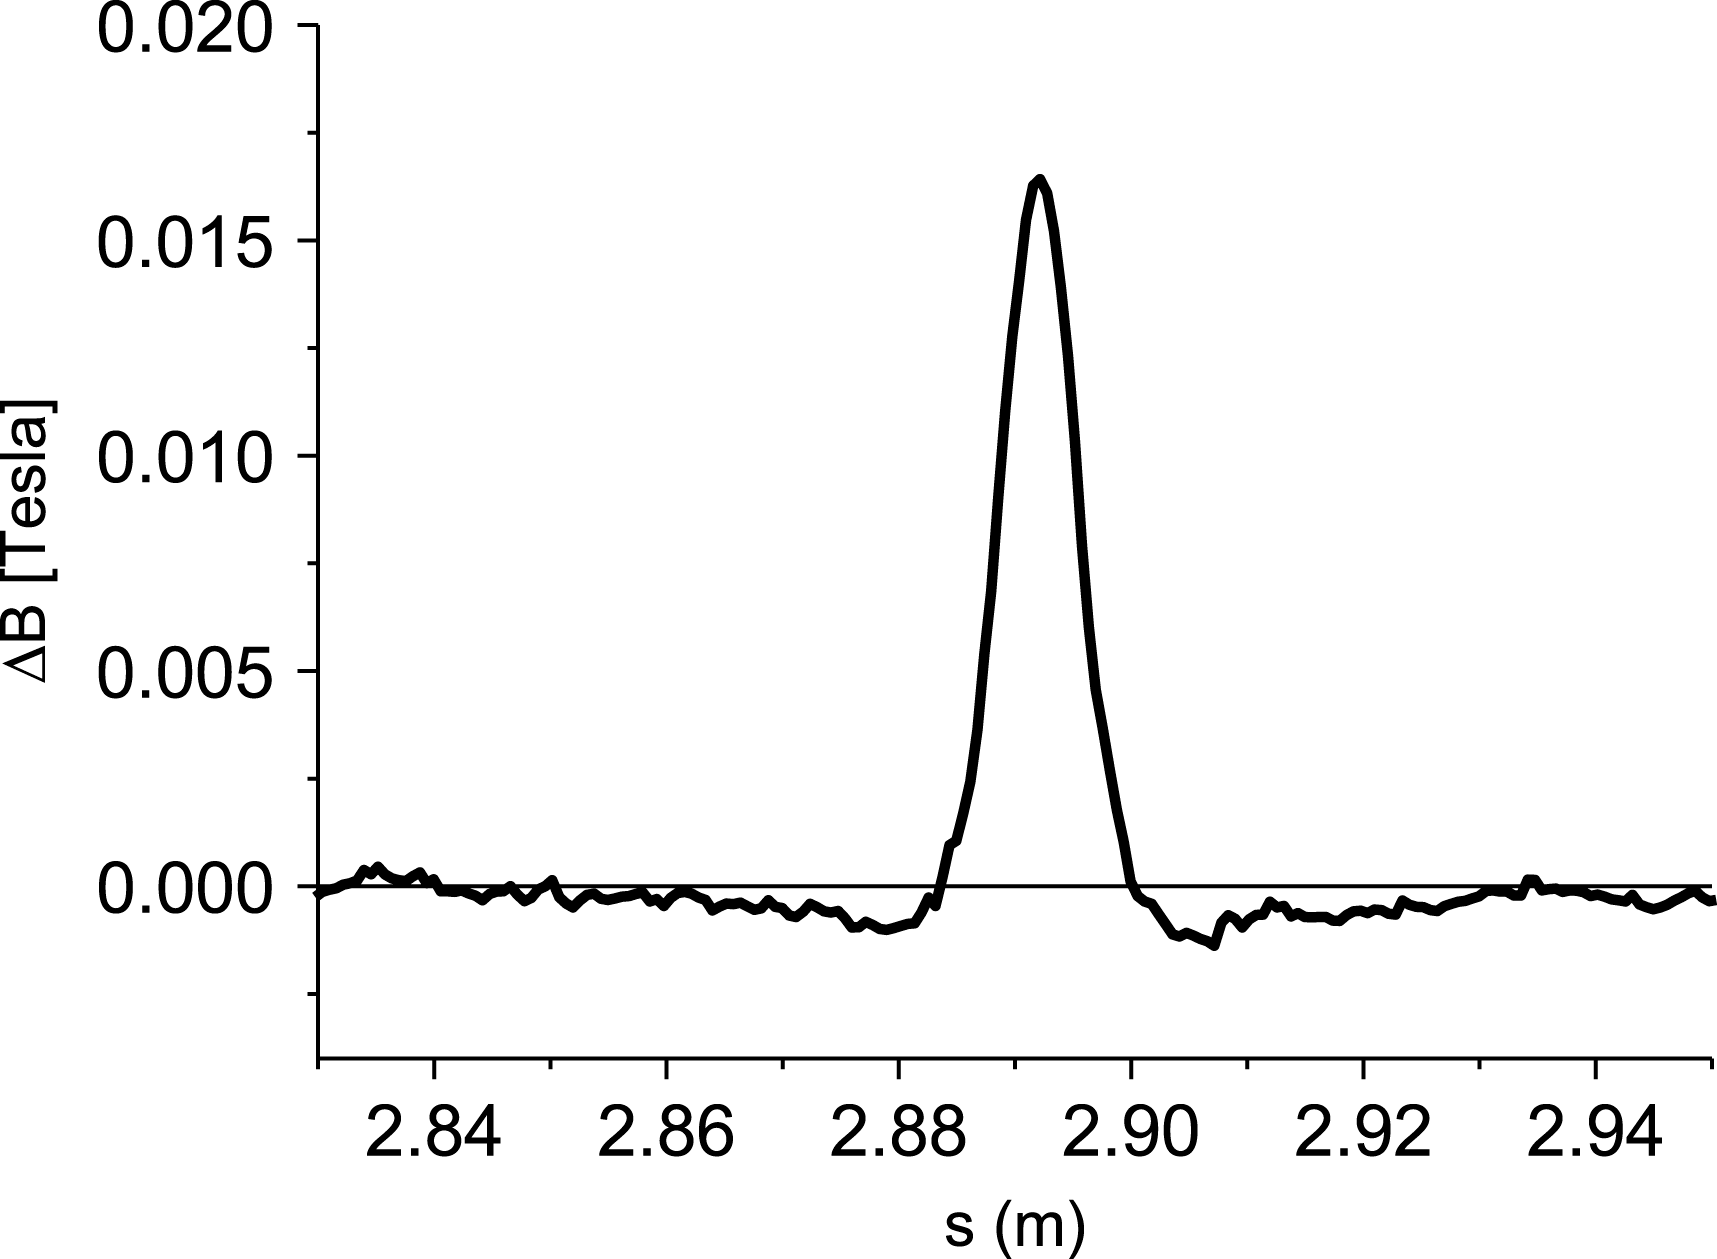
Figure 15. Measured effects of ![]() $100~{\rm\mu}\text{m}$ pole tuning at a 9.5 mm tuning gap. The residual fluctuation comes from the longitudinal positional error at the probe position, which is estimated to be about
$100~{\rm\mu}\text{m}$ pole tuning at a 9.5 mm tuning gap. The residual fluctuation comes from the longitudinal positional error at the probe position, which is estimated to be about ![]() $3.0~{\rm\mu}\text{m}$.
$3.0~{\rm\mu}\text{m}$.
For deeper analysis, field measurements need to be analyzed. First, for each pole a local ![]() $K$ is defined for each pole using the following definition[Reference Li, Abeghyan, Berndgen, Baha-Shanjani, Deron, Englisch, Karabekyan, Ketenoglu, Knoll, Wolff-Fabris, Viehweger, Yakopov and Pflueger11, Reference Li and Pflueger12]:
$K$ is defined for each pole using the following definition[Reference Li, Abeghyan, Berndgen, Baha-Shanjani, Deron, Englisch, Karabekyan, Ketenoglu, Knoll, Wolff-Fabris, Viehweger, Yakopov and Pflueger11, Reference Li and Pflueger12]:
This is a half-period field integral around the ![]() $j$th pole of the field profile. Fluctuations of local
$j$th pole of the field profile. Fluctuations of local ![]() $K$ from the average describe the error. An illustration of this equation is given in Figure 16.
$K$ from the average describe the error. An illustration of this equation is given in Figure 16.
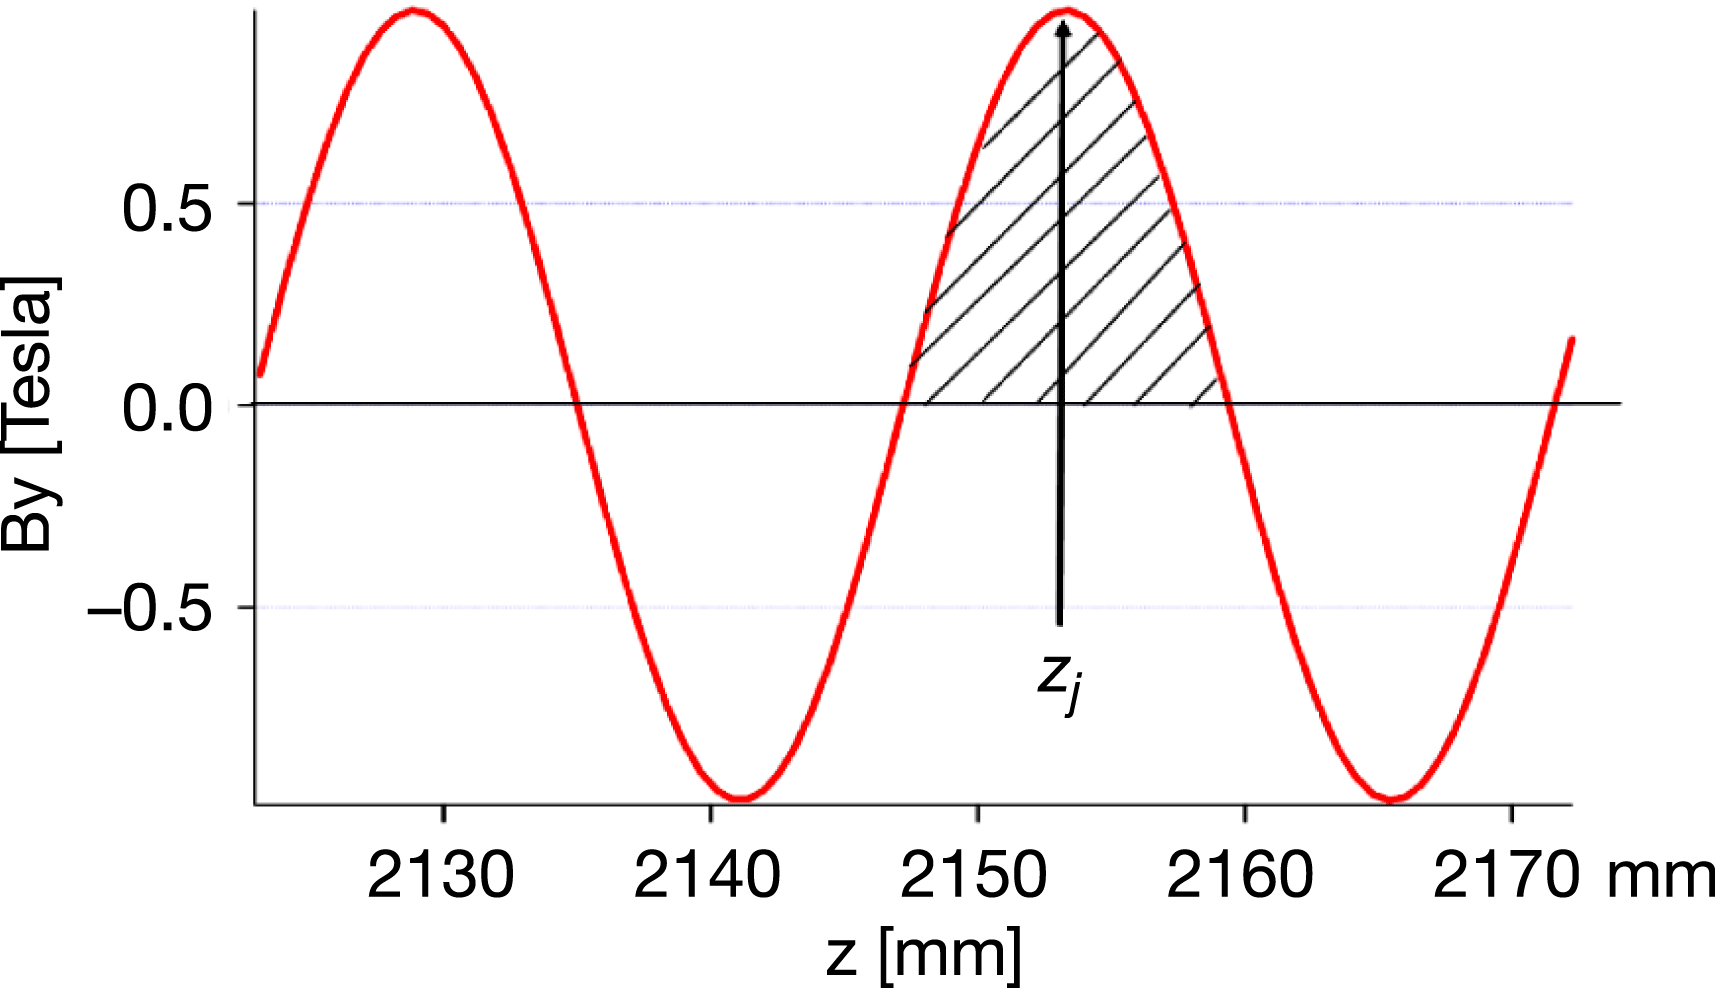
Figure 16. Integration over a half-period around the ![]() $j$th pole/peak position for the definition of the local-
$j$th pole/peak position for the definition of the local-![]() $K$ parameter.
$K$ parameter.
Second, several measurements are carried out to extract the impact of pole tuning on the changes of local ![]() $K$. In Figure 17, the measured local-
$K$. In Figure 17, the measured local-![]() $K$ changes resulting from pole tuning by
$K$ changes resulting from pole tuning by ![]() $100~{\rm\mu}\text{m}$ are shown for the tuning gap. The abscissa denotes the relative position: 0 is the tuned pole itself,
$100~{\rm\mu}\text{m}$ are shown for the tuning gap. The abscissa denotes the relative position: 0 is the tuned pole itself, ![]() $\pm 1$ the two next-neighbor poles etc. Measurements at five different positions are plotted, together with the standard deviation. The calculated signatures are averaged and symmetrized, then used to calculate the required corrections.
$\pm 1$ the two next-neighbor poles etc. Measurements at five different positions are plotted, together with the standard deviation. The calculated signatures are averaged and symmetrized, then used to calculate the required corrections.

Figure 17. The measured local-![]() $K$ changes due to a
$K$ changes due to a ![]() $100~{\rm\mu}\text{m}$ pole correction at the 9.5 mm tuning gap. The abscissa denotes the distance to the pole: 0 is the tuned pole itself,
$100~{\rm\mu}\text{m}$ pole correction at the 9.5 mm tuning gap. The abscissa denotes the distance to the pole: 0 is the tuned pole itself, ![]() $\pm 1$ the two next-neighbor poles etc.
$\pm 1$ the two next-neighbor poles etc.
Third, the corrections are calculated as described in Ref. [Reference Pflueger, Lu and Teichmann13]. A linear system of equations is set up connecting the pole shift on pole with index ![]() $j$ to the local-
$j$ to the local-![]() $K$ change on pole with index
$K$ change on pole with index ![]() $i$.
$i$.
For 203 periods there are 406 poles, resulting in a 406 by 406 system matrix. Since only three next-nearest neighbors are used, the matrix is diagonally dominant and there are only six side diagonals. This facilitates the solution and allows an iterative solution.
The results of the calculation are shown in Figure 18. Most of the poles need corrections within ![]() $\pm 50~{\rm\mu}\text{m}$, a small number of the poles need up to
$\pm 50~{\rm\mu}\text{m}$, a small number of the poles need up to ![]() $\pm 100~{\rm\mu}\text{m}$ pole correction, while none apart from the entrance and exit poles are above this figure. The effect of the pole tuning is demonstrated in Figure 19. The local
$\pm 100~{\rm\mu}\text{m}$ pole correction, while none apart from the entrance and exit poles are above this figure. The effect of the pole tuning is demonstrated in Figure 19. The local ![]() $K$s before (black dots) and after the tuning (red line) are shown. The RMS variation of the local
$K$s before (black dots) and after the tuning (red line) are shown. The RMS variation of the local ![]() $K$ dropped by an order of magnitude, from
$K$ dropped by an order of magnitude, from ![]() $1.32\times 10^{-2}$ before to
$1.32\times 10^{-2}$ before to ![]() $1.3\times 10^{-3}$ after the correction. Obviously the accuracy of the final
$1.3\times 10^{-3}$ after the correction. Obviously the accuracy of the final ![]() $K$ fluctuation depends on the measurement accuracy and the accuracy of the pole height tuning.
$K$ fluctuation depends on the measurement accuracy and the accuracy of the pole height tuning.
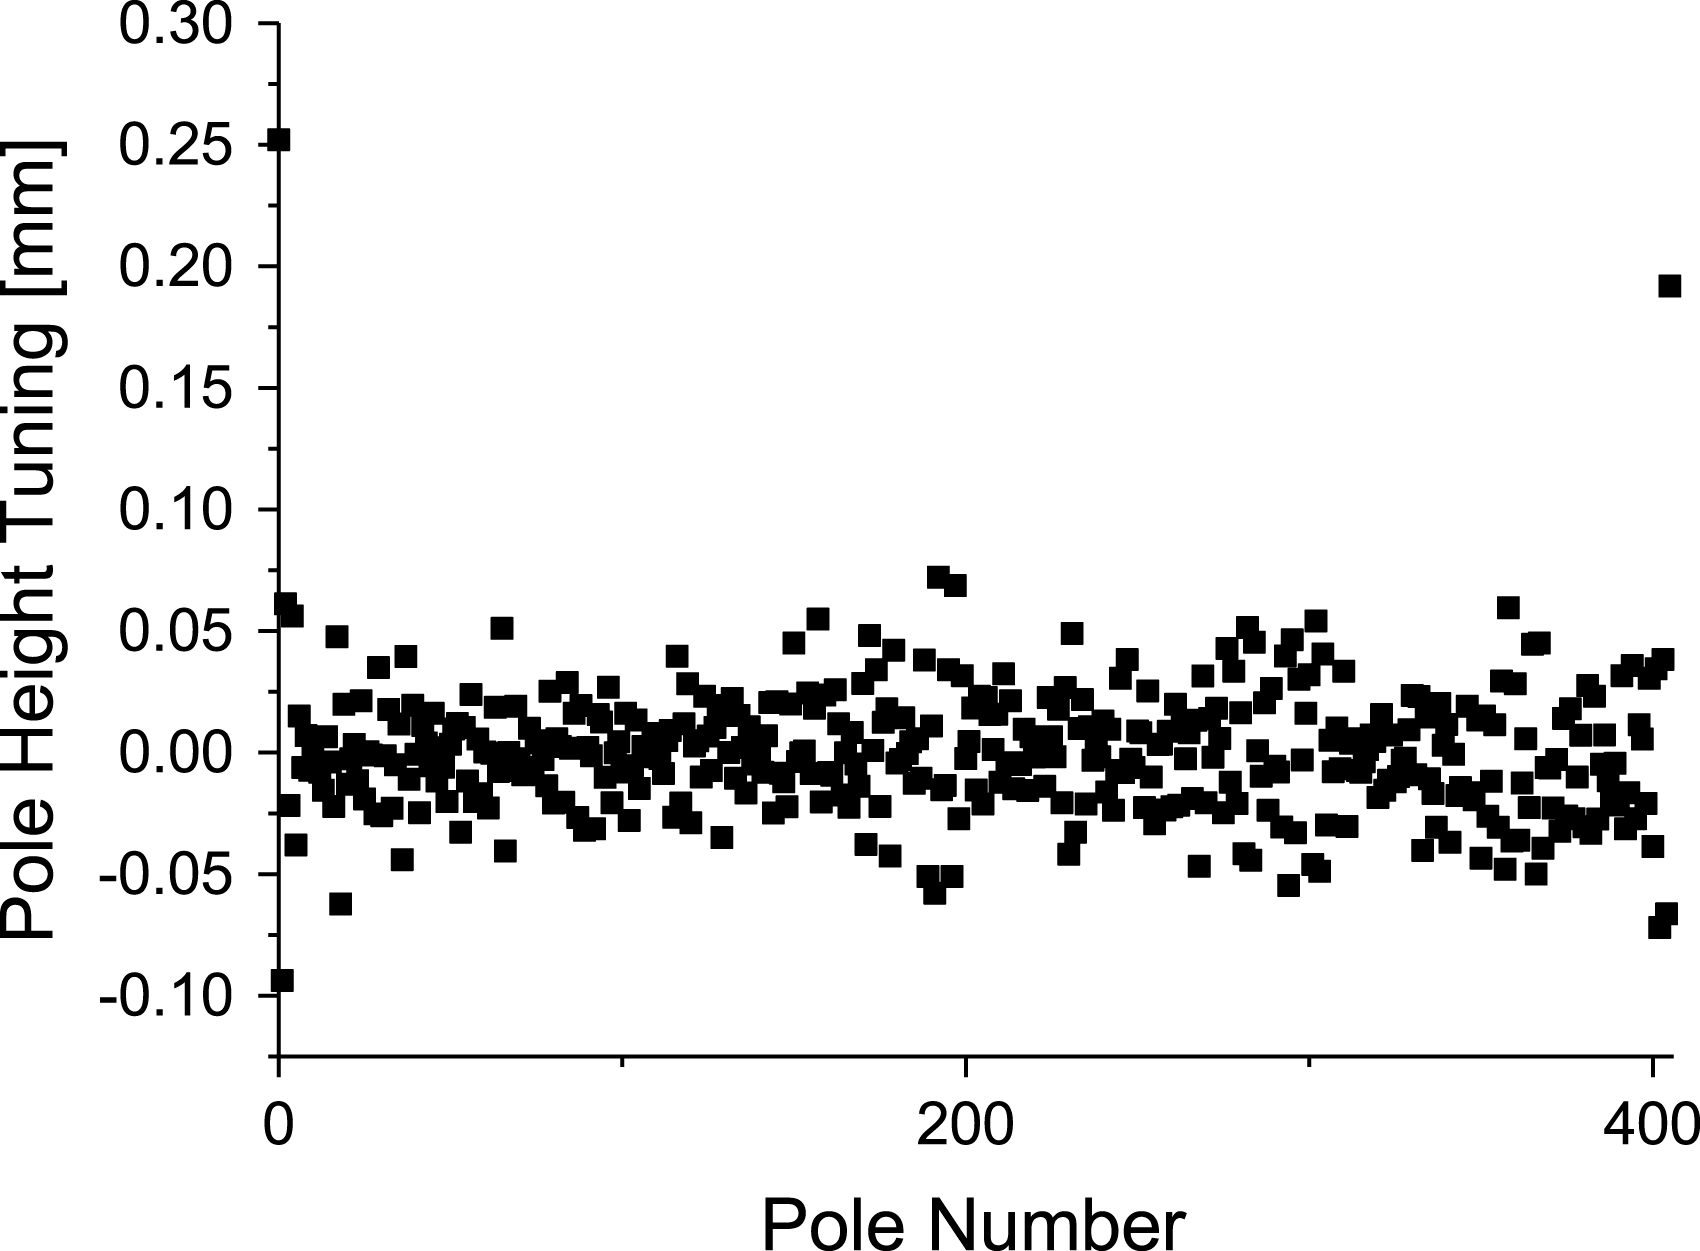
Figure 18. Calculated pole gap correction based on the initial magnetic measurement and local-![]() $K$ deviation. Most of poles need correction. The majority of those poles need a correction less than
$K$ deviation. Most of poles need correction. The majority of those poles need a correction less than ![]() $50~{\rm\mu}\text{m}$, some of them needed
$50~{\rm\mu}\text{m}$, some of them needed ![]() $100~{\rm\mu}\text{m}$ corrections. Except for the entrance and exit poles, which require larger correction, none are above this limit.
$100~{\rm\mu}\text{m}$ corrections. Except for the entrance and exit poles, which require larger correction, none are above this limit.
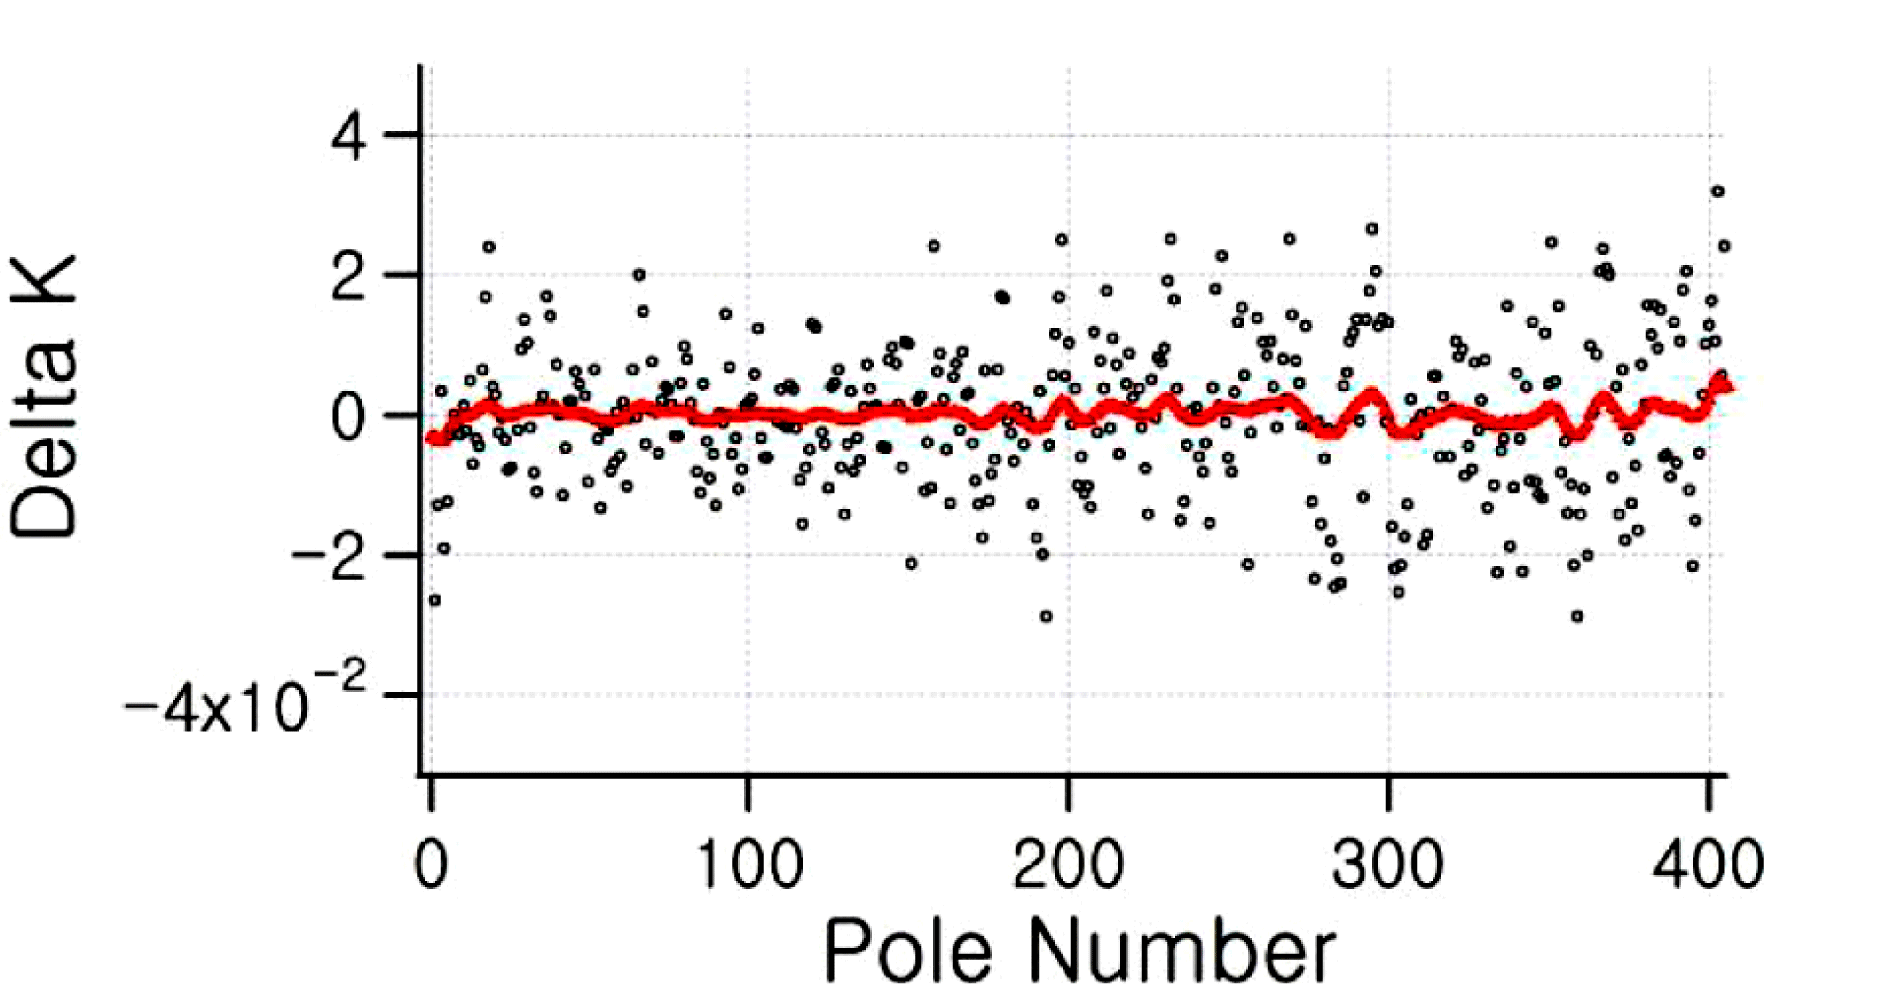
Figure 19. Deviation of local ![]() $K$ for each pole before (black) and after pole tuning (red). The standard deviation before correction was
$K$ for each pole before (black) and after pole tuning (red). The standard deviation before correction was ![]() $1.32\times 10^{-2}$, reduced to
$1.32\times 10^{-2}$, reduced to ![]() $1.3\times 10^{-3}$ after correction.
$1.3\times 10^{-3}$ after correction.
Finally, Figure 20 shows the measurement of gap reproducibility. Measurement is repeated six times and the peak fields of the each positive pole are calculated. The difference in the peak field between the measurements is calculated and shown in the figure. Between each measurement the gap was opened to 100 mm and closed to the measurement gap of 7.2 mm. The data scatter in the peak field is about ![]() $\pm 1.5$ G maximum. This difference translates to an approximate
$\pm 1.5$ G maximum. This difference translates to an approximate ![]() $\pm 1.0~{\rm\mu}\text{m}$ gap error. This error includes the mechanical hysteresis of the gap and the magnetic hysteresis of the pole, and is within our specification. Figure 21 shows the calculated phase jitter after pole tuning. The calculated rms phase jitter was
$\pm 1.0~{\rm\mu}\text{m}$ gap error. This error includes the mechanical hysteresis of the gap and the magnetic hysteresis of the pole, and is within our specification. Figure 21 shows the calculated phase jitter after pole tuning. The calculated rms phase jitter was ![]() $2.6^{\circ }$ rms, which is less than the specification of
$2.6^{\circ }$ rms, which is less than the specification of ![]() $5.0^{\circ }$. The phase jitter increases when the gap moves away from the tuning gap, but is still within the specification within the working gap (see Figure 22).
$5.0^{\circ }$. The phase jitter increases when the gap moves away from the tuning gap, but is still within the specification within the working gap (see Figure 22).

Figure 20. Measurement of gap reproducibility errors.
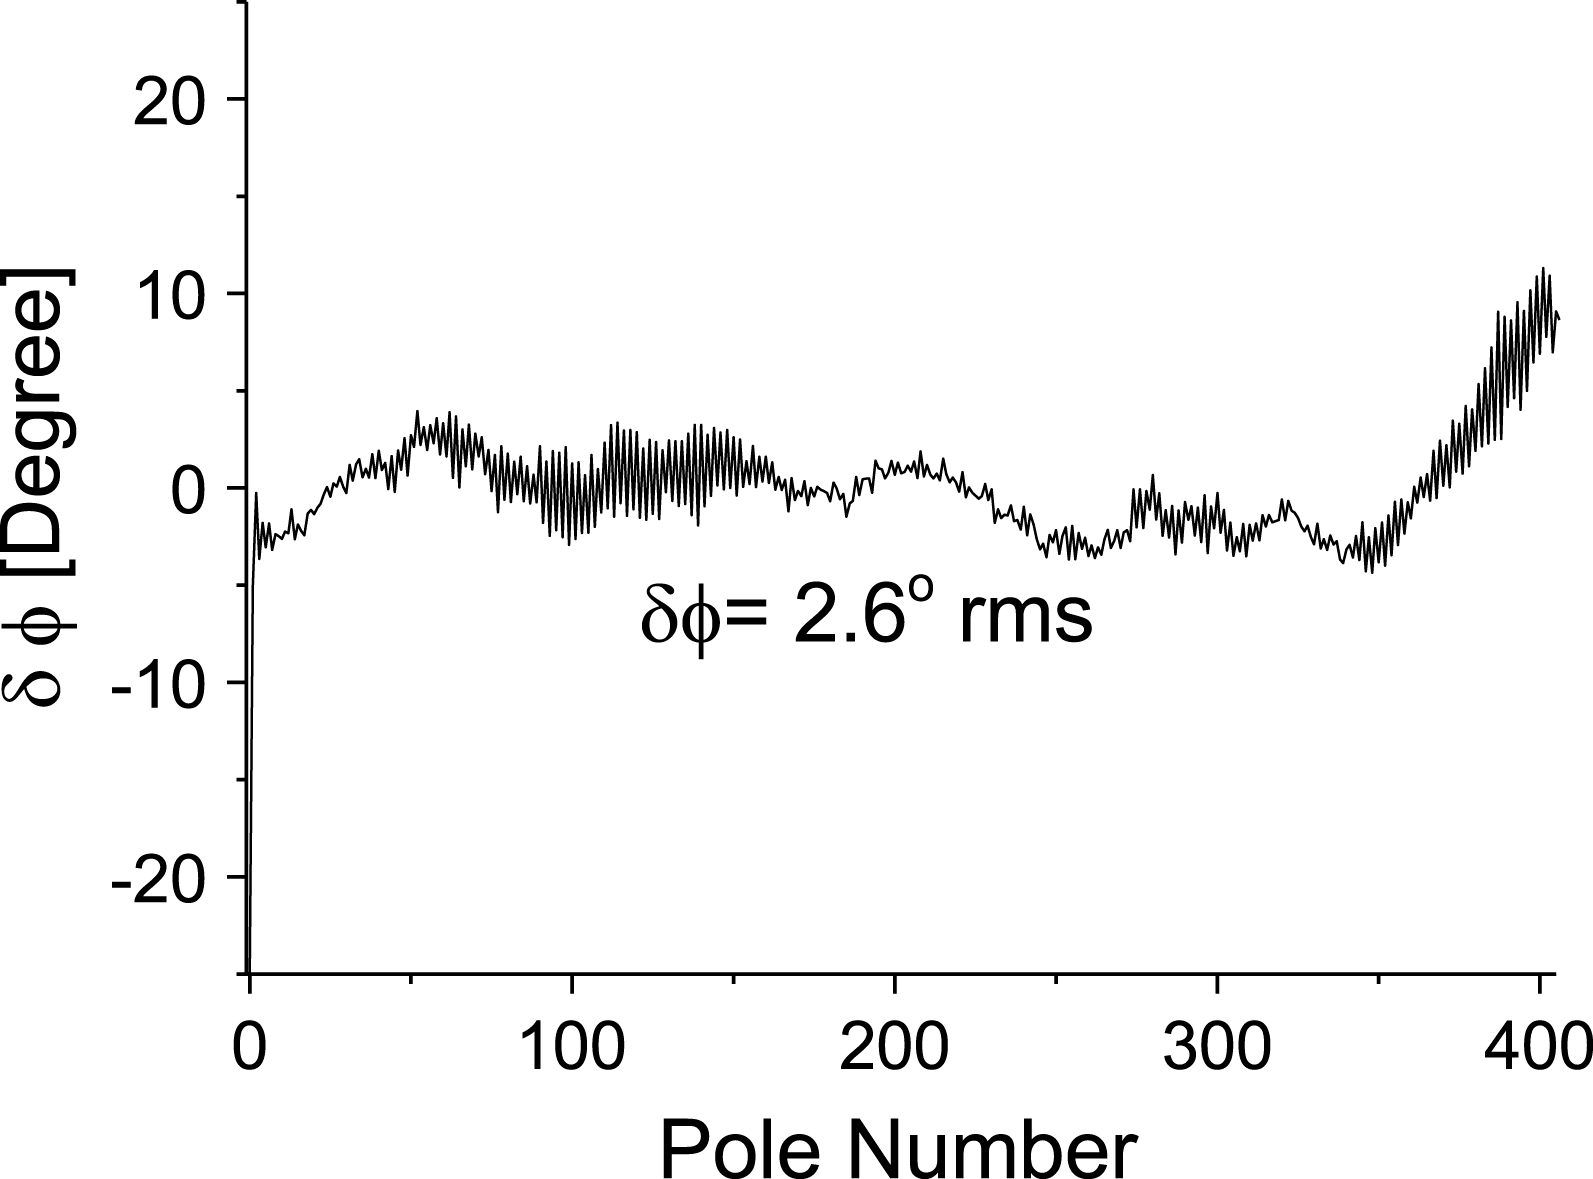
Figure 21. Optical phase error at the working gap of 9.5 mm. The rms phase jitter is ![]() $2.6^{\circ }$, which is within the specification of
$2.6^{\circ }$, which is within the specification of ![]() $5.0^{\circ }$.
$5.0^{\circ }$.
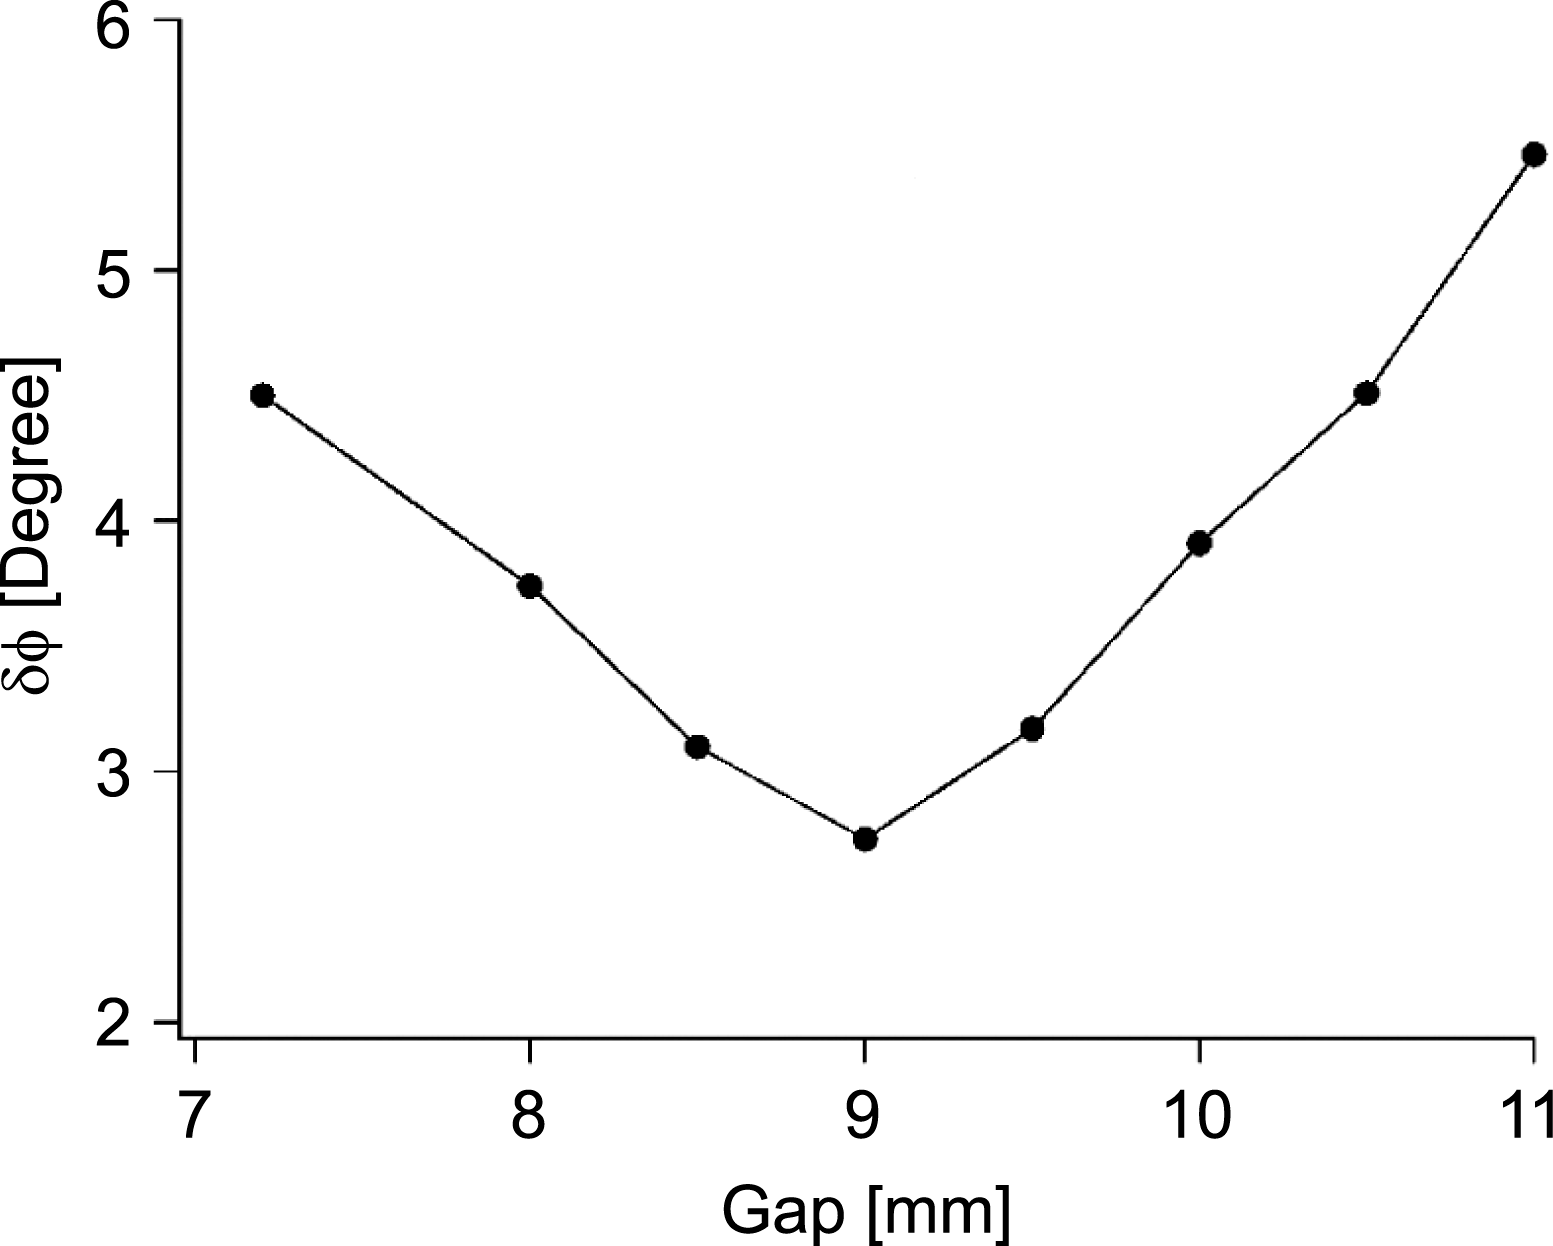
Figure 22. Gap dependence of the optical phase error.
4. Conclusion
In order to realize the target emittance of the PAL-XFEL injector an optimization study was carried out for various parameters, such as the laser beam transverse profile, laser pulse length, laser injection phase and gun energy. The transverse emittances measured at the ITF are ![]() ${\it\varepsilon}_{x}=0.481\pm 0.010~\text{mm}~\text{mrad}$ and
${\it\varepsilon}_{x}=0.481\pm 0.010~\text{mm}~\text{mrad}$ and ![]() ${\it\varepsilon}_{y}=0.597\pm 0.020~\text{mm}~\text{mrad}$. An undulator prototype based on the EU-XFEL design and modified for PAL-XFEL was built and tested. The local-
${\it\varepsilon}_{y}=0.597\pm 0.020~\text{mm}~\text{mrad}$. An undulator prototype based on the EU-XFEL design and modified for PAL-XFEL was built and tested. The local-![]() $K$ pole tuning procedure was developed and tested. For the field corrections the three next-nearest neighbors were included into the correction signatures. Tuning was very effective, reducing the local-
$K$ pole tuning procedure was developed and tested. For the field corrections the three next-nearest neighbors were included into the correction signatures. Tuning was very effective, reducing the local-![]() $K$ fluctuations by one order of magnitude. The major source of measurement errors is likely to come from the longitudinal positional error of the Hall probe during measurements. It has been demonstrated that gap setting can be tuned to
$K$ fluctuations by one order of magnitude. The major source of measurement errors is likely to come from the longitudinal positional error of the Hall probe during measurements. It has been demonstrated that gap setting can be tuned to ![]() $\pm 1~{\rm\mu}\text{m}$, corresponding to a field reproducibility better than
$\pm 1~{\rm\mu}\text{m}$, corresponding to a field reproducibility better than ![]() $2\times 10^{-4}$. This is considered sufficient for FEL operation. Moreover, measurements done at other gaps show that the undulator meets the phase jitter specs for all working gaps.
$2\times 10^{-4}$. This is considered sufficient for FEL operation. Moreover, measurements done at other gaps show that the undulator meets the phase jitter specs for all working gaps.
Acknowledgement
This research has been supported by the Ministry of Science, ICT and Future Planning of Korea.


