1 Introduction
Laser technology has advanced to the point where hitherto unobtainable intensities are now routinely achievable, and rapid progress is being made to increase intensities further[Reference Strickland and Mourou1]. The versatility of high power lasers has resulted in their use in a broad range of scientific fields, including novel particle accelerators, fusion research, laboratory astrophysics, condensed matter under high pressure, novel X-ray sources and strong-field quantum electrodynamics, among others. The potential for developing compact, high brightness particle and radiation sources has given a strong impetus to the development of the underpinning laser technology, including increasing the efficiency and repetition rate of the lasers. A result of this technological development can be seen in the new generation of ultrafast high power laser systems working at high repetition rate which have been built across Europe[Reference Danson, Hillier, Hopps and Neely2]. One of the most relevant and representative is the Centro de Laseres Pulsados[3] (CLPU) in Salamanca, Spain which has recently started operation. The CLPU has been founded by Spanish Ministry of Economy, Junta de Castilla y León and the University of Salamanca and its main system VEGA consists in a 30 fs pulse delivered in three different arms of 20 TW (VEGA 1), 200 TW (VEGA 2) and 1 PW (VEGA 3). CLPU has recently started operation phase, the first user access period on the VEGA 2 already started at the beginning of 2018 and a commissioning experiment on VEGA 3 is planned for 2019. VEGA 2 has been previously tested in different configurations depending on the focusing optics and targets used. One configuration is designed for underdense laser–matter interaction where VEGA 2 is focused (
![]() $F=130$
cm,
$F=130$
cm,
![]() $\unicode[STIX]{x1D719}_{L}=20~\unicode[STIX]{x03BC}\text{m}$
,
$\unicode[STIX]{x1D719}_{L}=20~\unicode[STIX]{x03BC}\text{m}$
,
![]() $Z_{r}=260~\unicode[STIX]{x03BC}\text{m}$
, where
$Z_{r}=260~\unicode[STIX]{x03BC}\text{m}$
, where
![]() $F$
is the focal length,
$F$
is the focal length,
![]() $\unicode[STIX]{x1D719}_{L}$
is the diameter of the laser focal spot and
$\unicode[STIX]{x1D719}_{L}$
is the diameter of the laser focal spot and
![]() $Z_{r}$
is the Rayleigh length) onto a low density gas-jet generating (via wake field mechanism[Reference Tajima and Dawson4–Reference Malka8]) electron beams with maximum energy up to 500 MeV and an X-ray betatron source with 10 keV characteristic critical energy[Reference Albert, Shah, Phuoc, Fitour, Burgy, Rousseau, Tafzi, Douillet, Lefrou and Rousse9–Reference Albert12]. The second configuration is designed for over critical density laser–matter interaction where VEGA 2 is focused (
$Z_{r}$
is the Rayleigh length) onto a low density gas-jet generating (via wake field mechanism[Reference Tajima and Dawson4–Reference Malka8]) electron beams with maximum energy up to 500 MeV and an X-ray betatron source with 10 keV characteristic critical energy[Reference Albert, Shah, Phuoc, Fitour, Burgy, Rousseau, Tafzi, Douillet, Lefrou and Rousse9–Reference Albert12]. The second configuration is designed for over critical density laser–matter interaction where VEGA 2 is focused (
![]() $F=40$
cm,
$F=40$
cm,
![]() $\unicode[STIX]{x1D719}_{L}=7~\unicode[STIX]{x03BC}\text{m}$
,
$\unicode[STIX]{x1D719}_{L}=7~\unicode[STIX]{x03BC}\text{m}$
,
![]() $Z_{r}=25~\unicode[STIX]{x03BC}\text{m}$
) onto a
$Z_{r}=25~\unicode[STIX]{x03BC}\text{m}$
) onto a
![]() $5~\unicode[STIX]{x03BC}\text{m}$
Al target generating (via target normal sheath acceleration (TNSA) mechanism[Reference Wilks, Langdon, Cowan, Roth, Singh, Hatchett, Key, Pennington, MacKinnon and Snavely13–Reference Snavely, Key, Hatchett, Cowan, Roth, Phillips, Stoyer, Henry, Sangster, Singh, Wilks, MacKinnon, Offenberger, Pennington, Yasuike, Langdon, Lasinski, Johnson, Perry and Campbell16]) a proton beam with a maximum energy of 10 MeV and average temperature of 2.5 MeV. In this paper both the commissioning experiments are reported and explained by describing the experimental setup and showing the capabilities of the VEGA system. Finally preliminary results are also given.
$5~\unicode[STIX]{x03BC}\text{m}$
Al target generating (via target normal sheath acceleration (TNSA) mechanism[Reference Wilks, Langdon, Cowan, Roth, Singh, Hatchett, Key, Pennington, MacKinnon and Snavely13–Reference Snavely, Key, Hatchett, Cowan, Roth, Phillips, Stoyer, Henry, Sangster, Singh, Wilks, MacKinnon, Offenberger, Pennington, Yasuike, Langdon, Lasinski, Johnson, Perry and Campbell16]) a proton beam with a maximum energy of 10 MeV and average temperature of 2.5 MeV. In this paper both the commissioning experiments are reported and explained by describing the experimental setup and showing the capabilities of the VEGA system. Finally preliminary results are also given.
2 The VEGA system
The VEGA laser is a chirp pulse amplification (CPA) titanium:sapphire system, with a central wavelength of 800 nm
![]() $\pm$
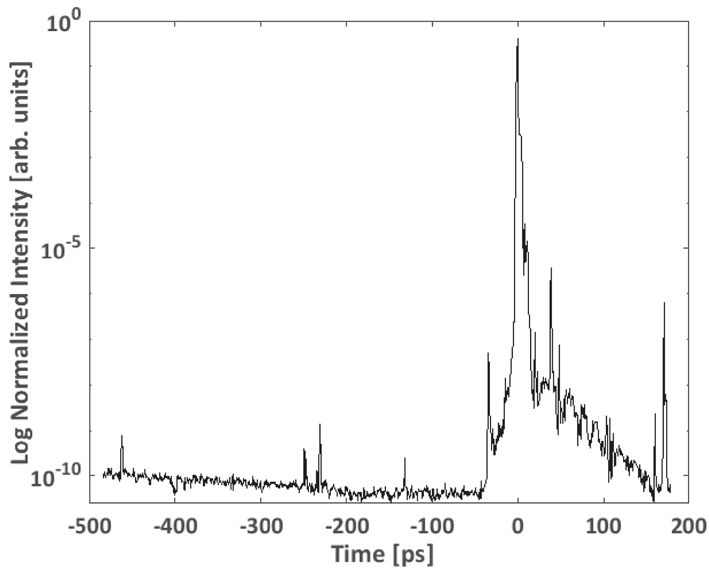
10 nm. It has three arms (see Figure 1) with maximum power 20 TW (VEGA 1), 200 TW (VEGA 2) and 1 PW (VEGA 3). The common front-end has a double CPA as well as an cross-polarized wave system that increases the contrast of the pulses significantly, as shown in Figure 2, making it suitable for high density targets.
$\pm$
10 nm. It has three arms (see Figure 1) with maximum power 20 TW (VEGA 1), 200 TW (VEGA 2) and 1 PW (VEGA 3). The common front-end has a double CPA as well as an cross-polarized wave system that increases the contrast of the pulses significantly, as shown in Figure 2, making it suitable for high density targets.
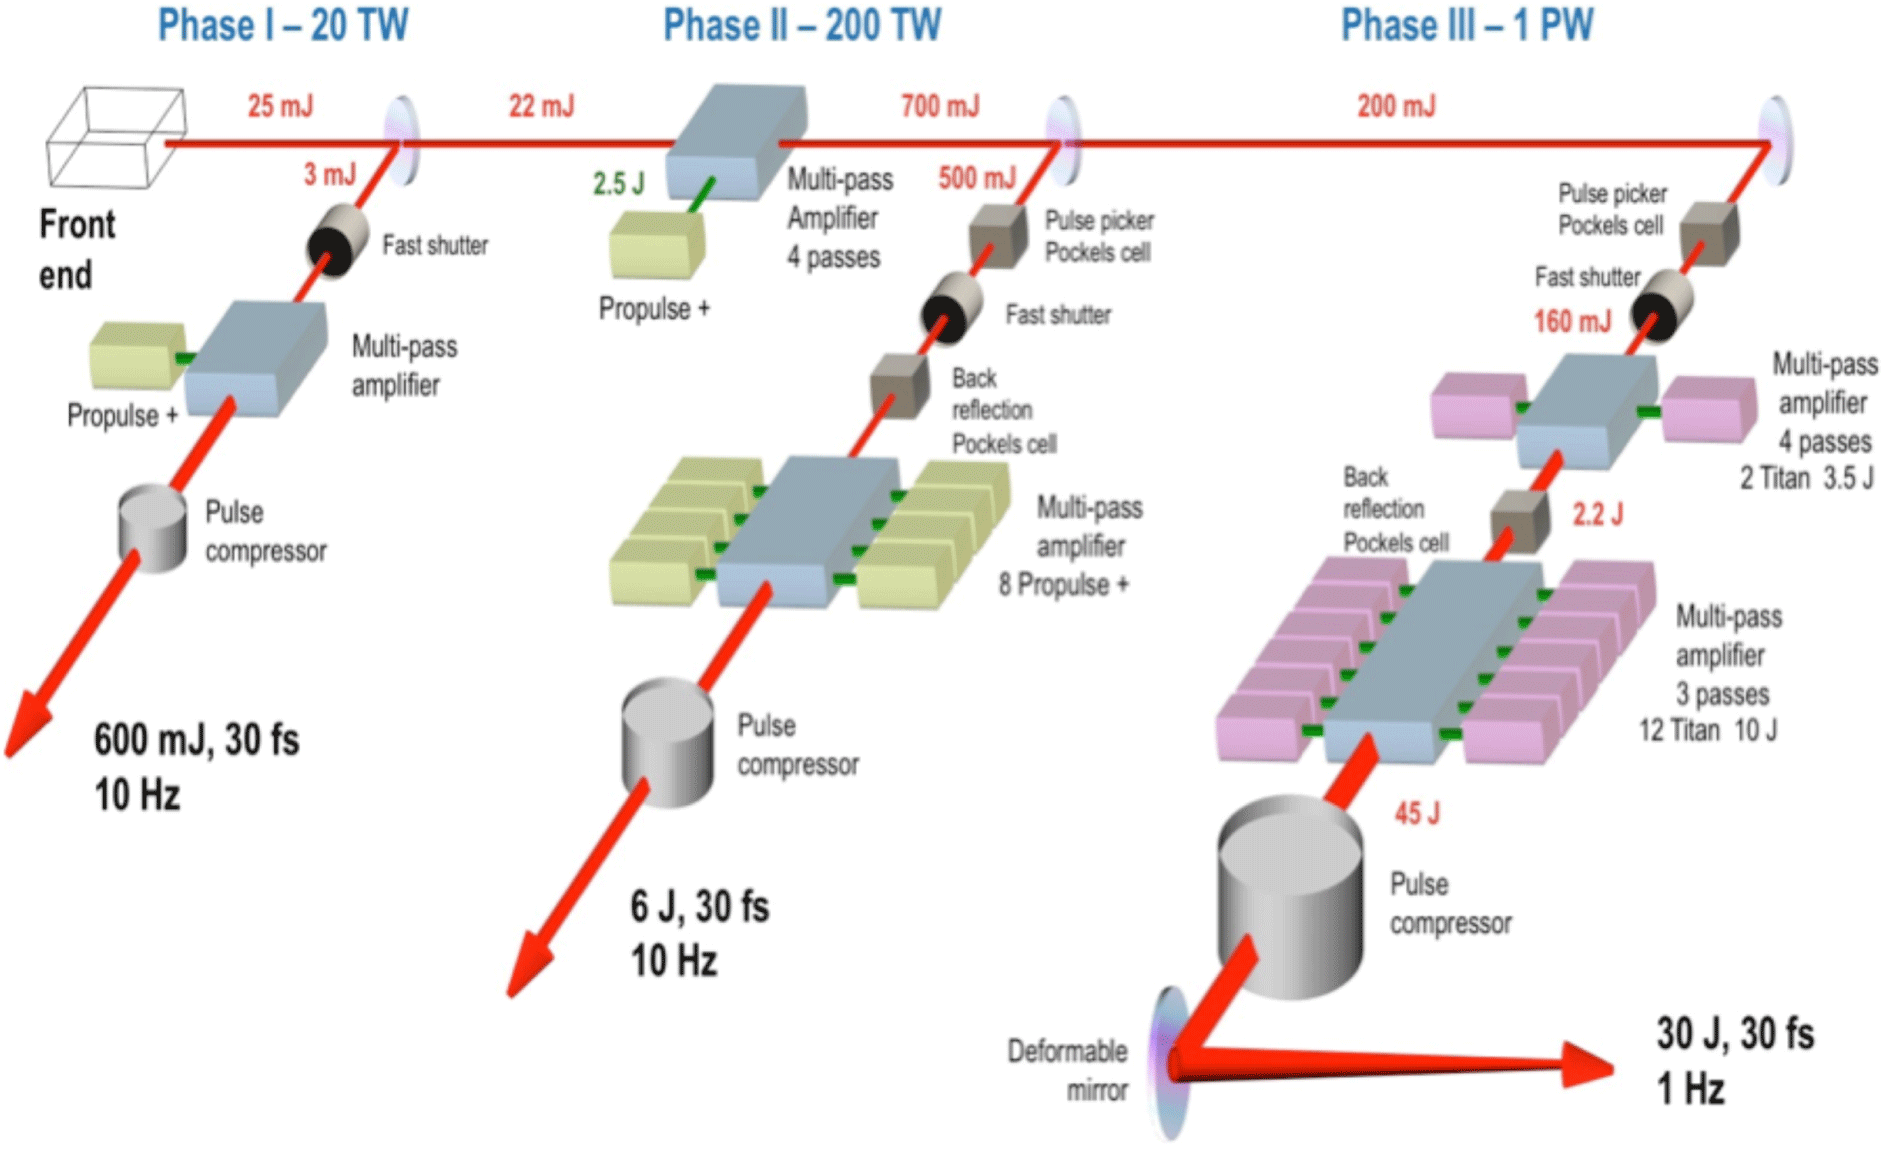
Figure 1. Schematic of the three VEGA systems.
The temporal contrast is: @ ns (pre-pulse)
![]() $5\times 10^{-10}$
;
$5\times 10^{-10}$
;
![]() $1$
ps
$1$
ps
![]() $2\times 10^{-5}$
;
$2\times 10^{-5}$
;
![]() $5$
ps
$5$
ps
![]() $5\times 10^{-8}$
;
$5\times 10^{-8}$
;
![]() $@~10~\text{ps}~8\times 10^{-9}$
;
$@~10~\text{ps}~8\times 10^{-9}$
;
![]() $100$
ps
$100$
ps
![]() $5\times 10^{-12}$
. Figure 2 shows a measurement of VEGA laser contrast just after the compressor.
$5\times 10^{-12}$
. Figure 2 shows a measurement of VEGA laser contrast just after the compressor.
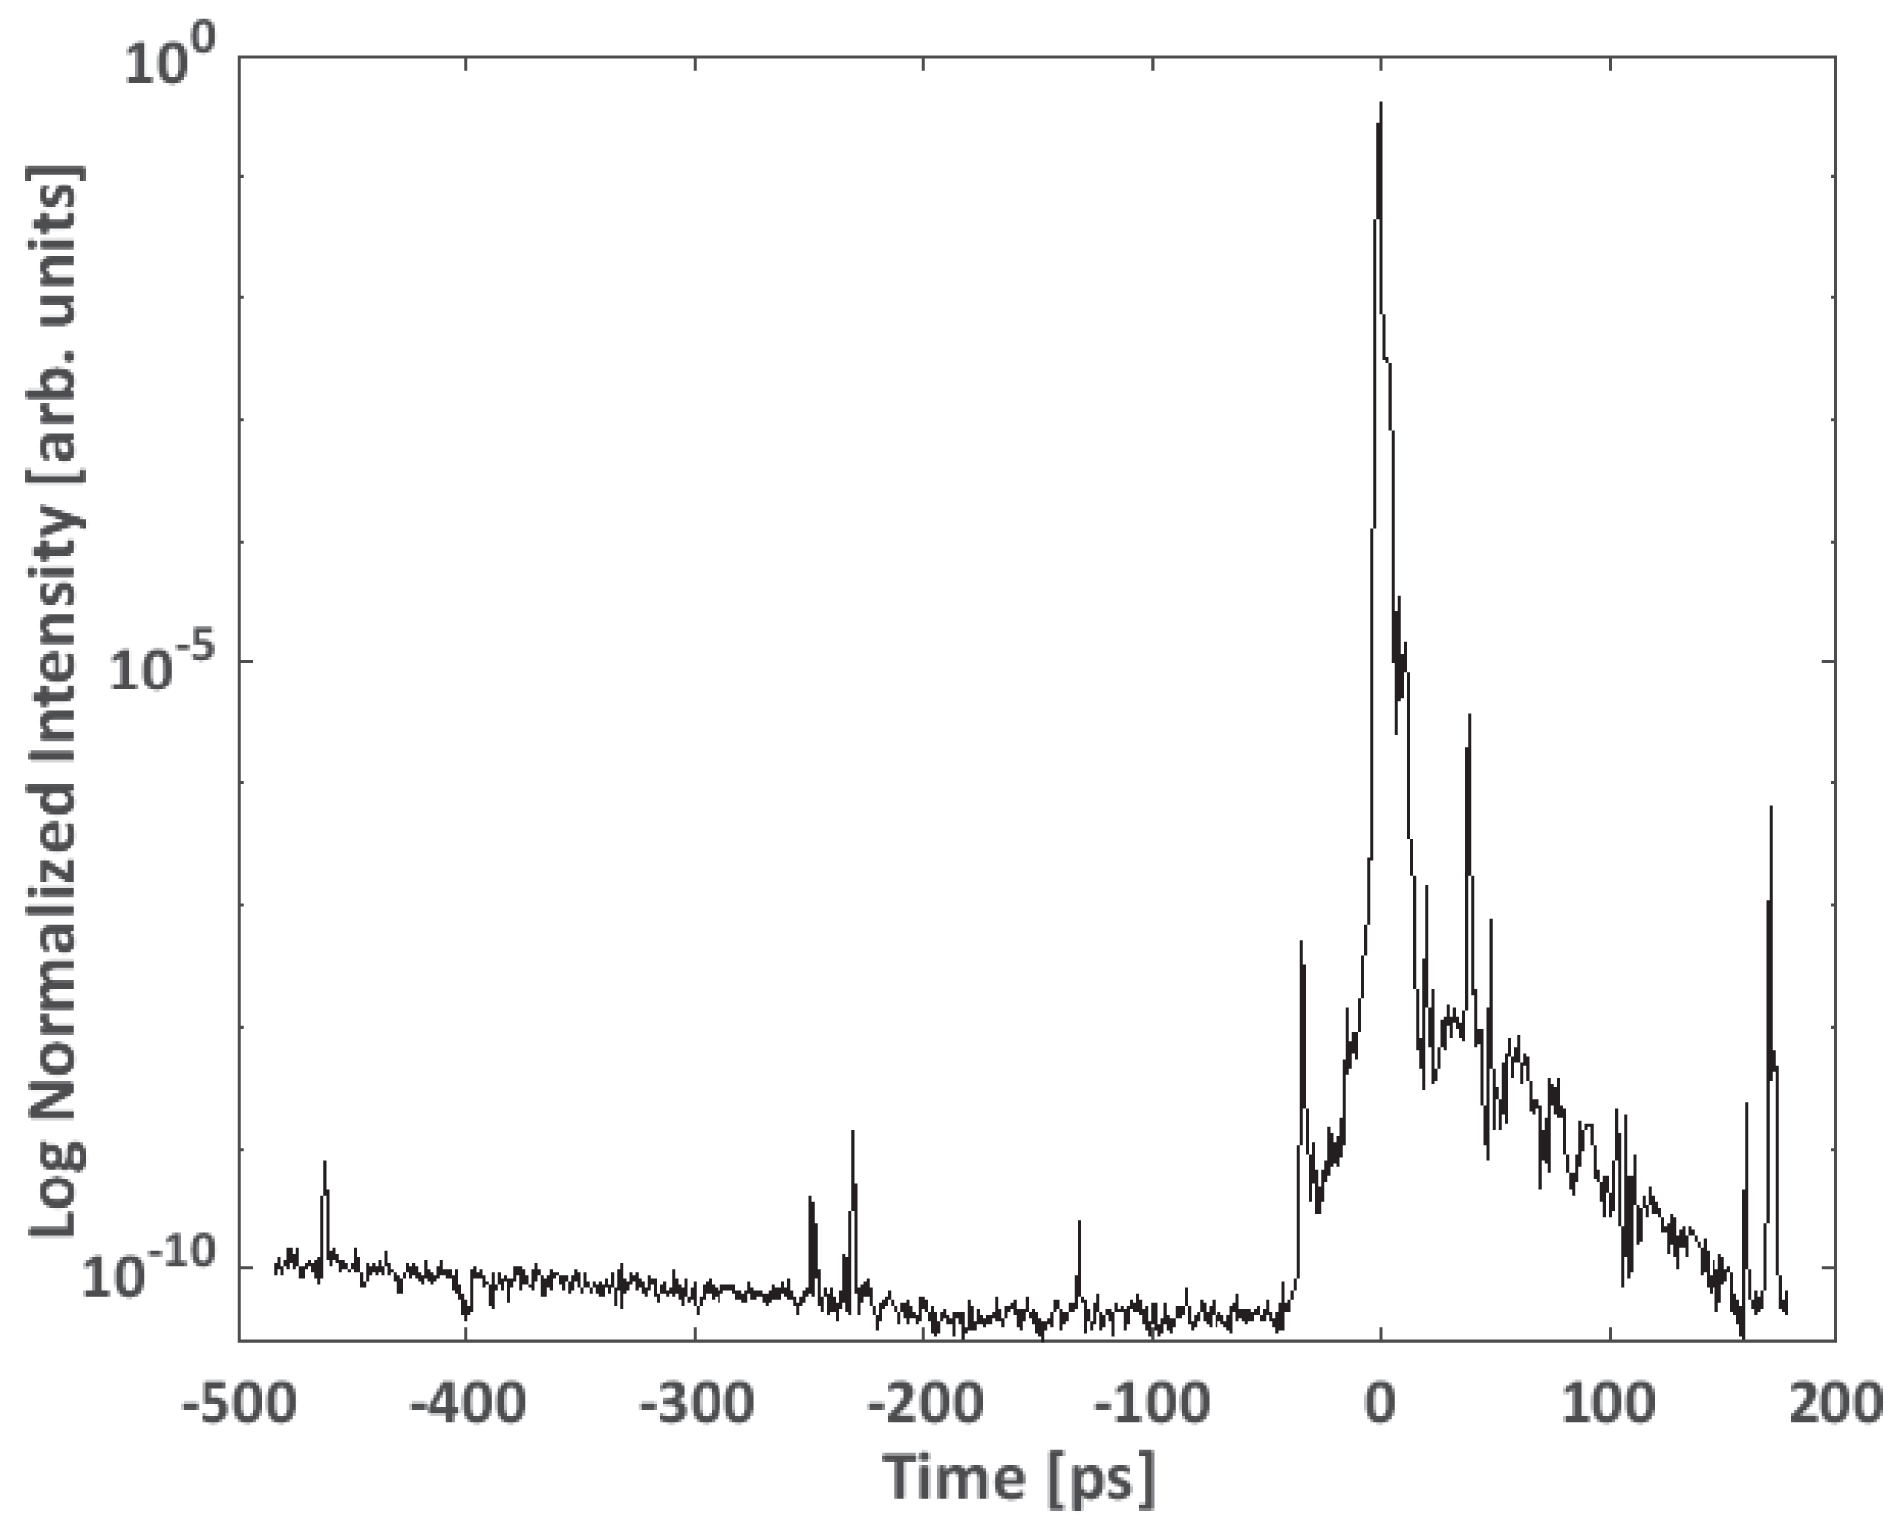
Figure 2. Contrast of VEGA 2, measured by Sequioa.
In April 2017 the first call for user access on the VEGA 2 system was lunched by CLPU, and thirty scientific proposals were received for a total amount of more than 500 days requested over the 100 days offered in the call. The VEGA 2 system has been offered at high repetition rate with some limitations mainly connected to targetry and diagnostics. In preparation of such user access we organized a series of commissioning experimental campaigns along 2017. The main goal of this campaign was to learn how to prepare the VEGA 2 system for future user access campaigns. In particular we prepared the VEGA 2 target area to be easily adaptable for different possible experimental setups by changing the laser focusing system and by implementing a simple system to split the main beam (via beam splitters) at different fractions among which
![]() $1\%/99\%$
and
$1\%/99\%$
and
![]() $10\%/90\%$
, and other possibilities such as
$10\%/90\%$
, and other possibilities such as
![]() $50\%/50\%$
are under development. Depending on the experimental requirements a probe beam can be focused by one of the parabolic mirrors or simply by optical lenses. Both the parabolic mirrors are protected by thin fused silica pellicles placed just in front of them. Laser pulse duration is routinely measured close to the target position by using a second order auto-correlator and compared with second harmonic optimization measurements.
$50\%/50\%$
are under development. Depending on the experimental requirements a probe beam can be focused by one of the parabolic mirrors or simply by optical lenses. Both the parabolic mirrors are protected by thin fused silica pellicles placed just in front of them. Laser pulse duration is routinely measured close to the target position by using a second order auto-correlator and compared with second harmonic optimization measurements.
3 The commissioning experimental campaign
The VEGA 2 target area currently offers two different configurations with the possibility of several laser probes depending on the experimental requests. For both the configurations the laser VEGA 2 has been delivered at 30 fs, with a maximum power of 150 TW corresponding to a maximum energy at the entrance of the compressor of around 7 J. The conversion efficiency
![]() $\unicode[STIX]{x1D702}$
from the entrance of the compressor up to the target is measured to be around 50% giving a total energy on target around 3.5 J. Assuming the same energy conversion efficiency for both the configurations the total laser intensity is estimated to be
$\unicode[STIX]{x1D702}$
from the entrance of the compressor up to the target is measured to be around 50% giving a total energy on target around 3.5 J. Assuming the same energy conversion efficiency for both the configurations the total laser intensity is estimated to be
![]() $I_{L}[\text{W}\cdot \text{cm}^{-2}]\sim 5.8\times 10^{21}/A[\unicode[STIX]{x03BC}\text{m}^{2}]$
, where
$I_{L}[\text{W}\cdot \text{cm}^{-2}]\sim 5.8\times 10^{21}/A[\unicode[STIX]{x03BC}\text{m}^{2}]$
, where
![]() $A[\unicode[STIX]{x03BC}\text{m}^{2}]=\unicode[STIX]{x1D70B}r_{L}^{2}$
.
$A[\unicode[STIX]{x03BC}\text{m}^{2}]=\unicode[STIX]{x1D70B}r_{L}^{2}$
.
3.1 Long focalization in gaseous targets
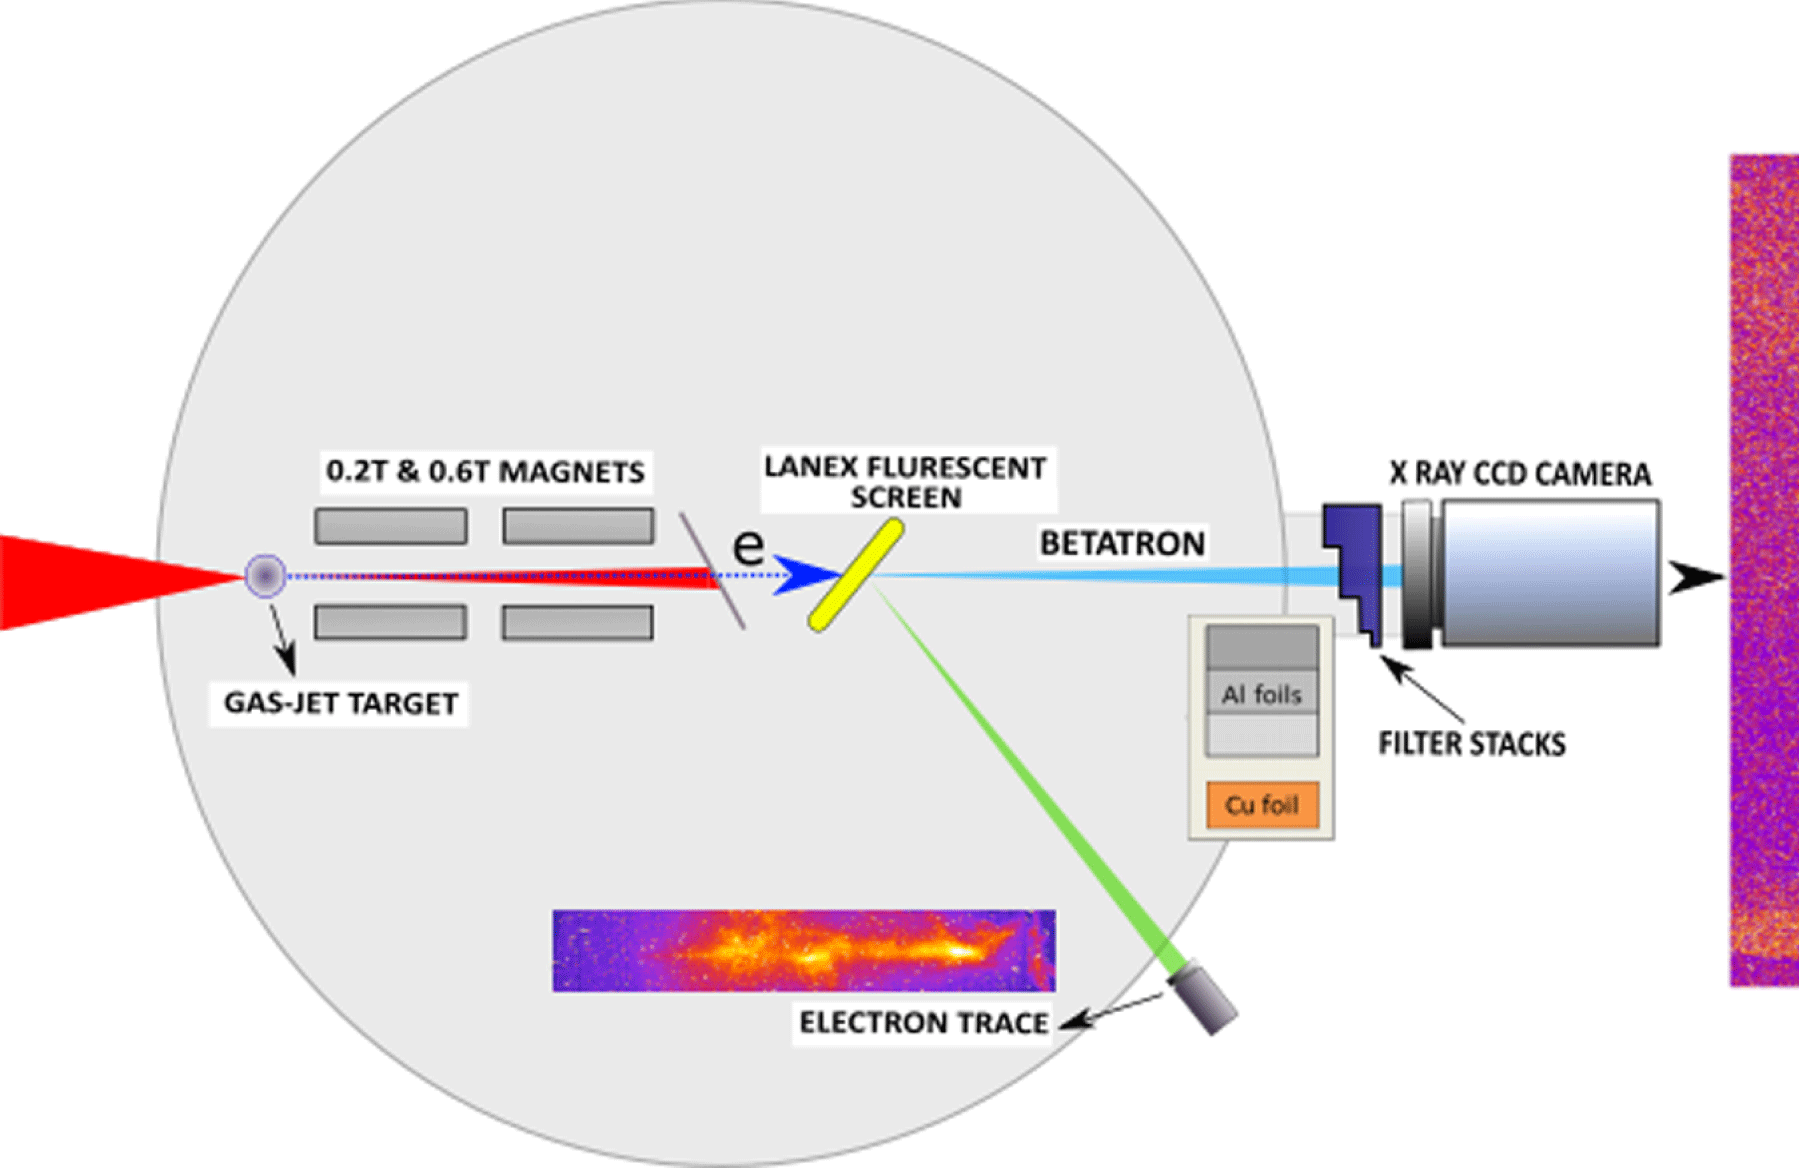
Figure 3. Long focal experimental setup.
VEGA 2 was focused by an
![]() $F/13$
parabolic mirror into a 5 mm thick gas jet placed at 30 cm far from the target chamber center (TCC), as shown in Figure 3. The laser beam waist has been measured (at low power) to be full width at half maximum (FWHM)
$F/13$
parabolic mirror into a 5 mm thick gas jet placed at 30 cm far from the target chamber center (TCC), as shown in Figure 3. The laser beam waist has been measured (at low power) to be full width at half maximum (FWHM)
![]() $17.7~\unicode[STIX]{x03BC}\text{m}\,\pm \,0.5~\unicode[STIX]{x03BC}\text{m}$
with less then 50% of the total energy in the FWHM giving a peak intensity within the FWHM of around
$17.7~\unicode[STIX]{x03BC}\text{m}\,\pm \,0.5~\unicode[STIX]{x03BC}\text{m}$
with less then 50% of the total energy in the FWHM giving a peak intensity within the FWHM of around
![]() $1.1\times 10^{19}~\text{W}\cdot \text{cm}^{-2}$
. Pulse duration has been adjusted during the experimental campaign to find the best acceleration performance by considering the relation between plasma frequency and laser pulse duration. Fully ionized plasma density has been fixed to
$1.1\times 10^{19}~\text{W}\cdot \text{cm}^{-2}$
. Pulse duration has been adjusted during the experimental campaign to find the best acceleration performance by considering the relation between plasma frequency and laser pulse duration. Fully ionized plasma density has been fixed to
![]() $1.2\times 10^{19}~\text{cm}^{-3}$
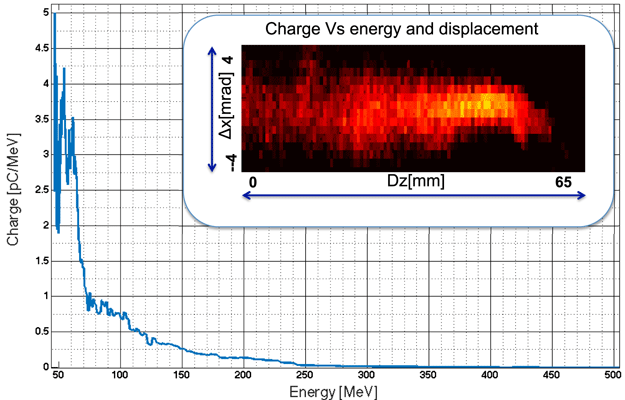
(over one order of magnitude larger than the threshold for the bubble regime) to maximize betatron radiation emission by generating a broad electron beam energy spectrum and leading to an increased accelerated charges (see Figure 4).
$1.2\times 10^{19}~\text{cm}^{-3}$
(over one order of magnitude larger than the threshold for the bubble regime) to maximize betatron radiation emission by generating a broad electron beam energy spectrum and leading to an increased accelerated charges (see Figure 4).

Figure 4. Typical broad electron spectrum measured with 1.2 Tesla magnetic spectrometer; inset: filtered image of measured electron energy spectrum.
Electron beams up to 500 MeV have been measured with an electron spectrometer composed by different magnet dipoles coupled with a lanex scintillating detector and an imaging system (see Figure 3). Betatron radiation has also been measured with typical synchrotron-like energy spectrum (see Figure 4) characterized by a critical energy of
![]() ${\approx}10$
keV. Betatron spectrum has been analysed with an X-ray CCD camera by using Ross filters technique. We estimated to have a peak brightness greater than
${\approx}10$
keV. Betatron spectrum has been analysed with an X-ray CCD camera by using Ross filters technique. We estimated to have a peak brightness greater than
![]() $10^{8}$
photons/srad at 0.1% BW per shot on average, with a divergence greater than
$10^{8}$
photons/srad at 0.1% BW per shot on average, with a divergence greater than
![]() $9.2\times 4.5$
mrad in horizontal and vertical directions. This betatron source has been also used as high frequency (short wavelength) probe to investigate a pre-heated warm dense aluminium sample and experimental results are now under analysis and will be published soon.
$9.2\times 4.5$
mrad in horizontal and vertical directions. This betatron source has been also used as high frequency (short wavelength) probe to investigate a pre-heated warm dense aluminium sample and experimental results are now under analysis and will be published soon.
3.2 Short focalization in solid targets
VEGA 2 was focused by an
![]() $F/4$
gold coated parabolic mirror onto
$F/4$
gold coated parabolic mirror onto
![]() $5~\unicode[STIX]{x03BC}\text{m}$
thick Al foil with an angle of
$5~\unicode[STIX]{x03BC}\text{m}$
thick Al foil with an angle of
![]() $10^{\circ }$
with respect to the normal of the foil (see Figure 5). The laser beam waist has been measured (at low power) to be FWHM
$10^{\circ }$
with respect to the normal of the foil (see Figure 5). The laser beam waist has been measured (at low power) to be FWHM
![]() $8~\unicode[STIX]{x03BC}\text{m}\pm 2~\unicode[STIX]{x03BC}\text{m}$
with 50% of the total energy in the FWHM giving a peak laser intensity within the FWHM of around
$8~\unicode[STIX]{x03BC}\text{m}\pm 2~\unicode[STIX]{x03BC}\text{m}$
with 50% of the total energy in the FWHM giving a peak laser intensity within the FWHM of around
![]() $I_{L}\simeq 2\times 10^{20}~\text{W}\cdot \text{cm}^{-2}$
. Laser pulse duration has been routinely measured to be 30 fs
$I_{L}\simeq 2\times 10^{20}~\text{W}\cdot \text{cm}^{-2}$
. Laser pulse duration has been routinely measured to be 30 fs
![]() $\pm \,3$
fs. A three-axis motorized target holder has been used holding 5 and
$\pm \,3$
fs. A three-axis motorized target holder has been used holding 5 and
![]() $10~\unicode[STIX]{x03BC}\text{m}$
thick Al foils. Target alignment was done prior to each shot with a resolution of around
$10~\unicode[STIX]{x03BC}\text{m}$
thick Al foils. Target alignment was done prior to each shot with a resolution of around
![]() $5~\unicode[STIX]{x03BC}\text{m}$
(
$5~\unicode[STIX]{x03BC}\text{m}$
(
![]() ${\leqslant}Z_{r}\sim 25~\unicode[STIX]{x03BC}\text{m}$
)
${\leqslant}Z_{r}\sim 25~\unicode[STIX]{x03BC}\text{m}$
)
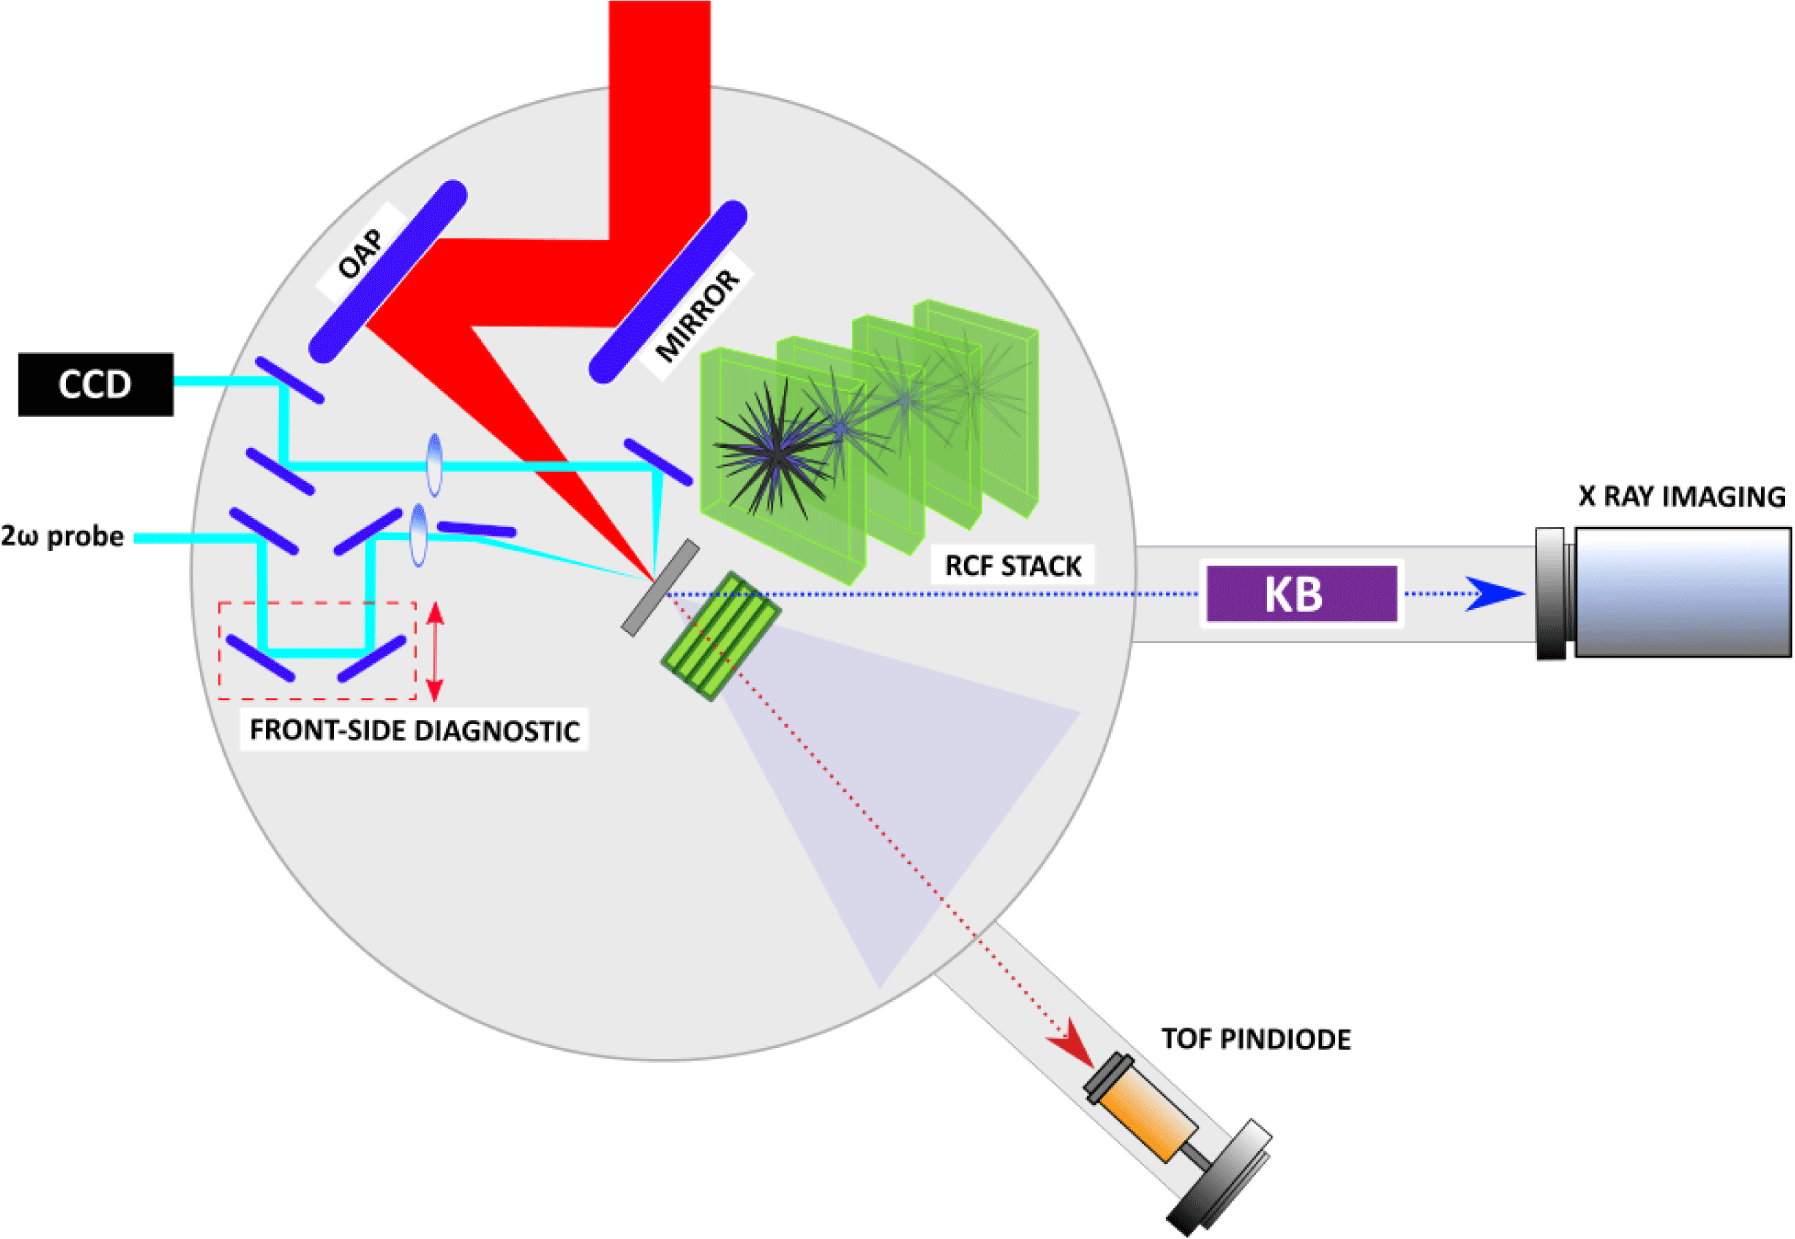
Figure 5. Short focal experimental setup.
For such laser intensities and so thin targets the control of laser pre-pulse[Reference Kaluza, Schreiber, Santala, Tsakiris, Eidmann, Meyer ter Vehn and Witte17] and plasma corona expansion is mandatory. A first measurement of the laser contrast just after the compressor has been done by the laser team and it is shown in Figure 2. We developed a simple front-side diagnostic to control the laser–target interaction by looking at plasma formation as a function of time in a time range of
![]() $\pm 300$
ps with respect to the main beam arrival. A small part of the main beam is extracted, doubled in frequency, and its polarization rotated
$\pm 300$
ps with respect to the main beam arrival. A small part of the main beam is extracted, doubled in frequency, and its polarization rotated
![]() $90^{\circ }$
with respect to the main laser and focused (counterpropagating with respect to the main laser pulse) on the front target surface with an angle of
$90^{\circ }$
with respect to the main laser and focused (counterpropagating with respect to the main laser pulse) on the front target surface with an angle of
![]() ${\approx}20^{\circ }$
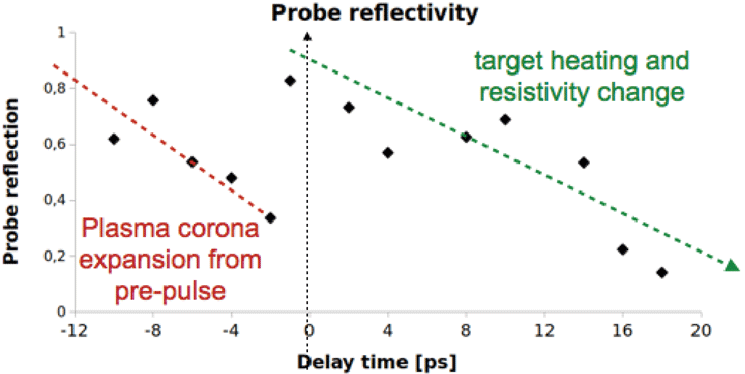
. The reflected beam was imaged onto an optical CCD camera, while a part of the transmitted beam is also recorded for reference. The setup is shown in Figure 5. Comparison of the amount of reflected probe beam at different delays will help for a preliminary interpretation and understanding of the laser contrast efficiency in laser–solid interaction; a further optimization of the diagnostic method will help to reconstruct the plasma density profile before, during and after the main pulse arrival by comparison to simulations. Figure 6 shows reflected fraction of the probe as a function of the chosen delay.
${\approx}20^{\circ }$
. The reflected beam was imaged onto an optical CCD camera, while a part of the transmitted beam is also recorded for reference. The setup is shown in Figure 5. Comparison of the amount of reflected probe beam at different delays will help for a preliminary interpretation and understanding of the laser contrast efficiency in laser–solid interaction; a further optimization of the diagnostic method will help to reconstruct the plasma density profile before, during and after the main pulse arrival by comparison to simulations. Figure 6 shows reflected fraction of the probe as a function of the chosen delay.
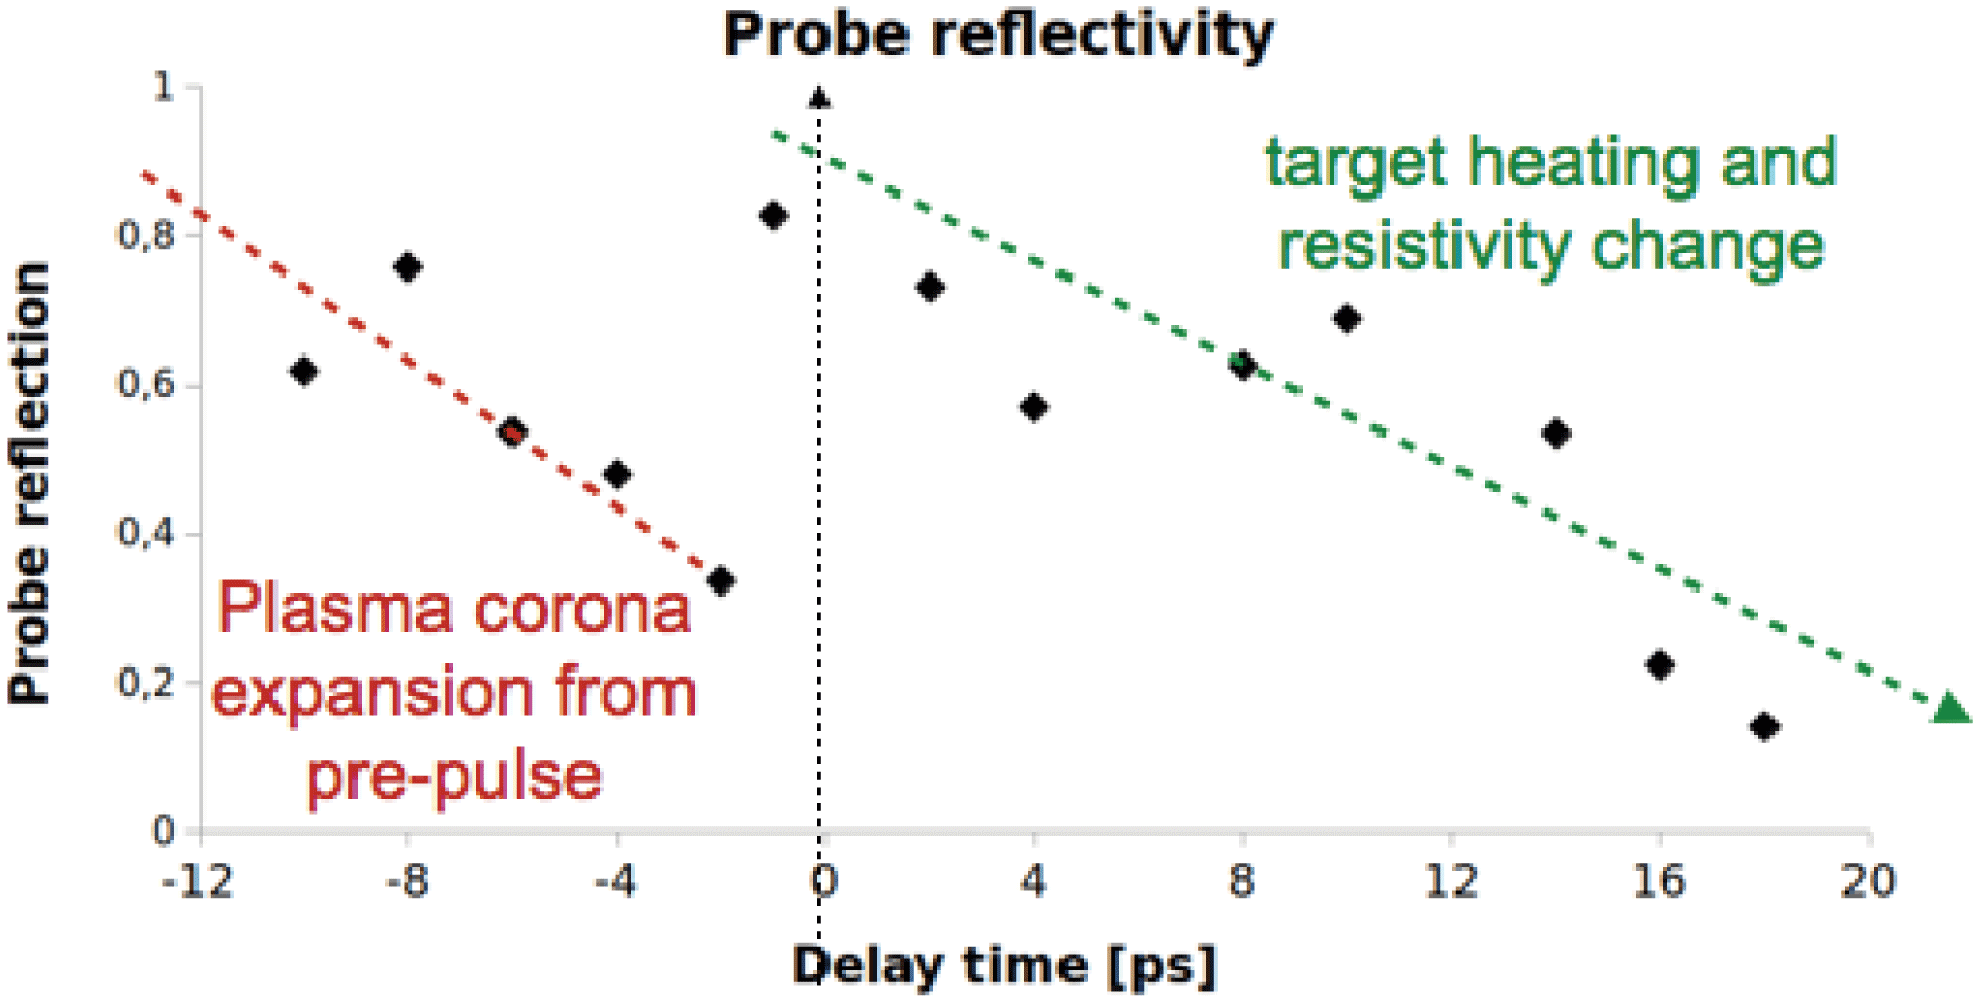
Figure 6. Normalized reflection of the probe at the target for different time delays with VEGA 2. Dotted lines are guides for eyes.
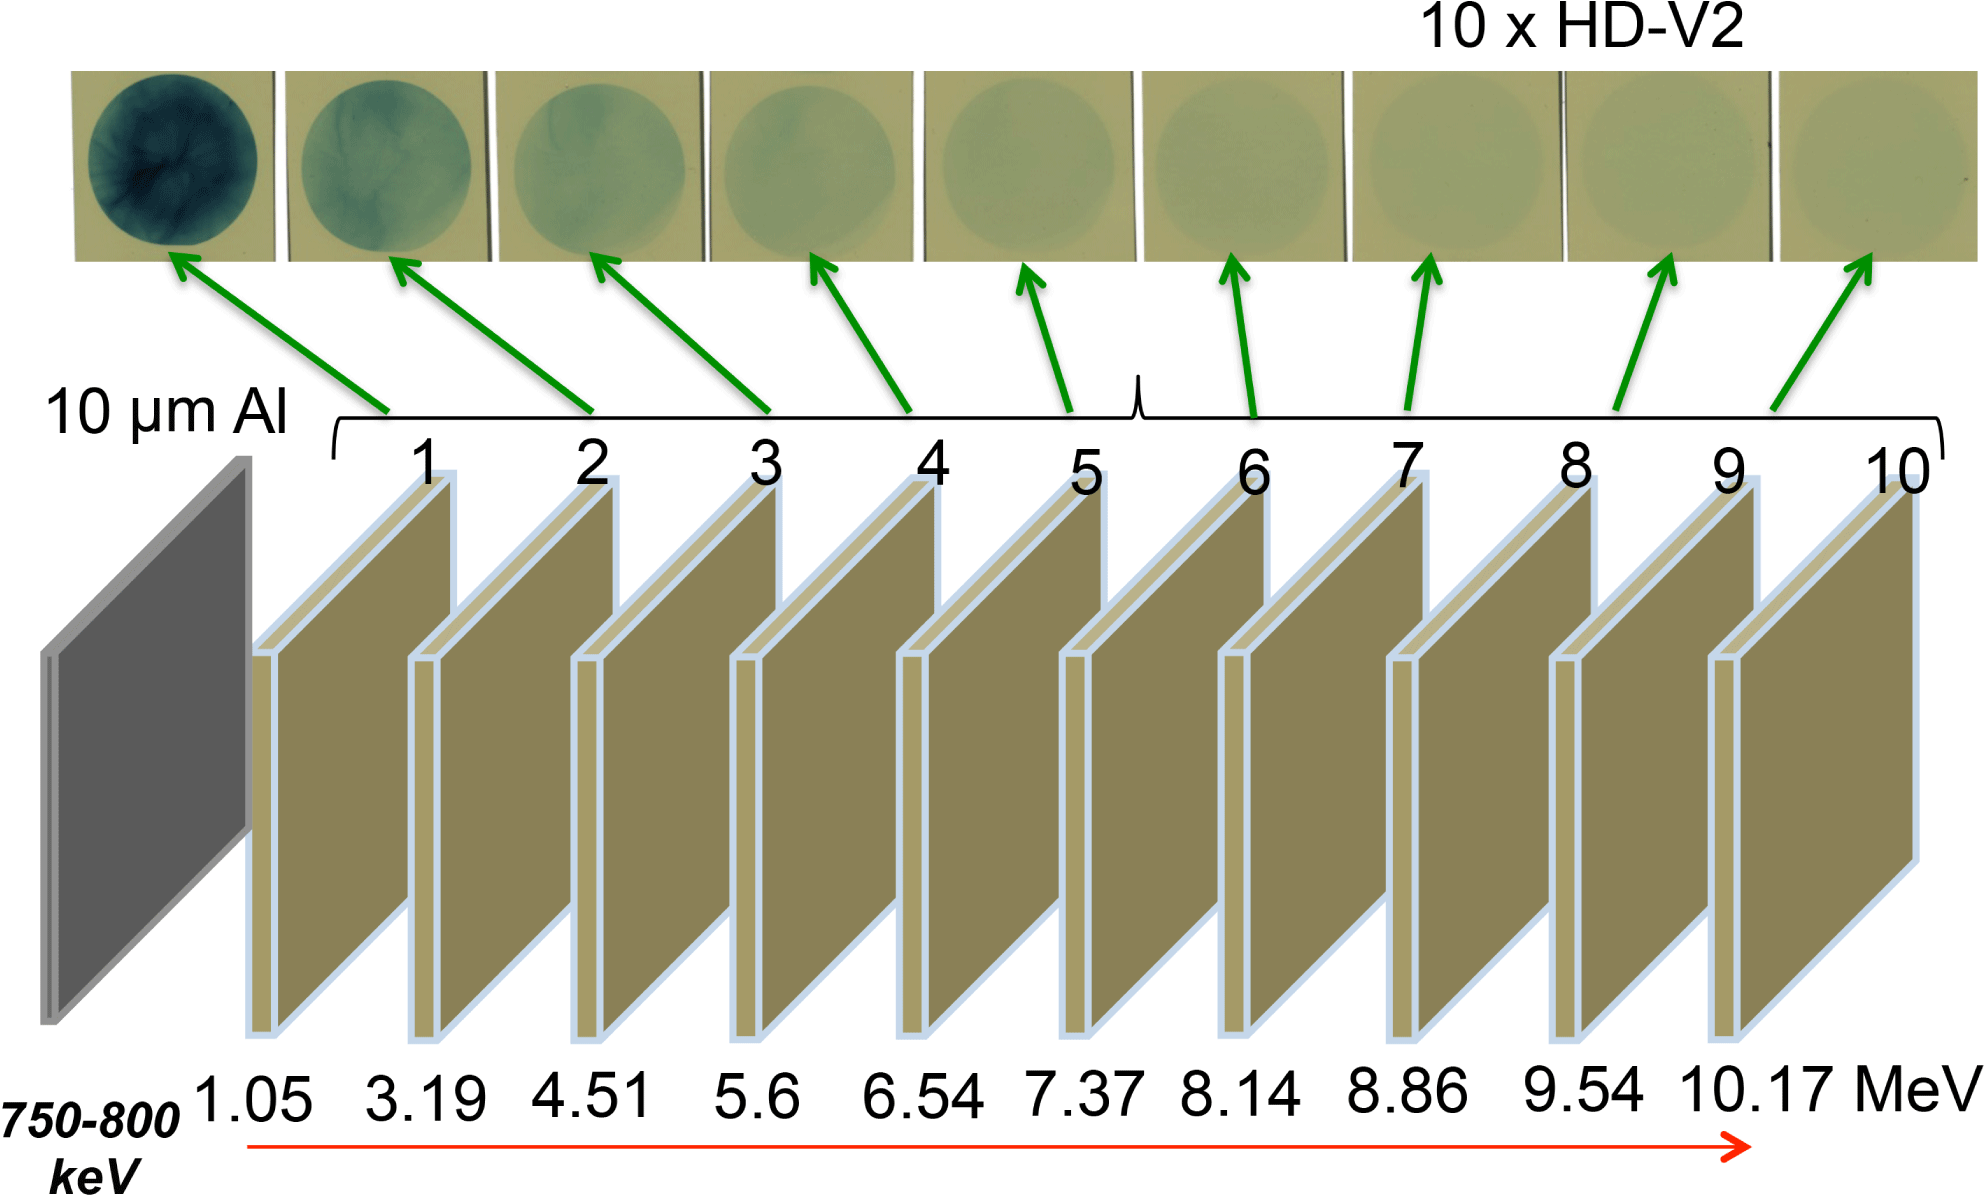
Figure 7. RCF stack design and experimental results.
Proton beam energies up to 10 MeV have been routinely measured with different diagnostic techniques. Proton spatial and energy distributions have been measured first with a stack of radio chromic films (RCFs) with the energy resolution limited by the number and thickness of RCF layers to
![]() $\unicode[STIX]{x0394}E\sim 0.5~\text{MeV}$
. Time of flight (ToF) measurements have been performed by using 1 ns time-resolved pin diode detector and with a 300 ps time-resolved micro channel plate (MCP) both placed 2.5 m far from the TCC as shown in Figure 5. Proton measurements were also checked by CR39 detectors placed beside the RCF stack and the ToF detectors. The measurements show TNSA-like proton energy spectrum with an averaged (the average is done over different acquisitions) mean temperature
$\unicode[STIX]{x0394}E\sim 0.5~\text{MeV}$
. Time of flight (ToF) measurements have been performed by using 1 ns time-resolved pin diode detector and with a 300 ps time-resolved micro channel plate (MCP) both placed 2.5 m far from the TCC as shown in Figure 5. Proton measurements were also checked by CR39 detectors placed beside the RCF stack and the ToF detectors. The measurements show TNSA-like proton energy spectrum with an averaged (the average is done over different acquisitions) mean temperature
![]() $\langle T_{\text{mean}}\rangle \sim 2.5$
MeV, an averaged maximum temperature
$\langle T_{\text{mean}}\rangle \sim 2.5$
MeV, an averaged maximum temperature
![]() $\langle T_{\max }\rangle \sim 9$
MeV and a divergence angle ranging between
$\langle T_{\max }\rangle \sim 9$
MeV and a divergence angle ranging between
![]() $20^{\circ }$
and
$20^{\circ }$
and
![]() $25^{\circ }$
FWHM. Figure 7 shows the RCF stack scheme with an example of experimental results.
$25^{\circ }$
FWHM. Figure 7 shows the RCF stack scheme with an example of experimental results.
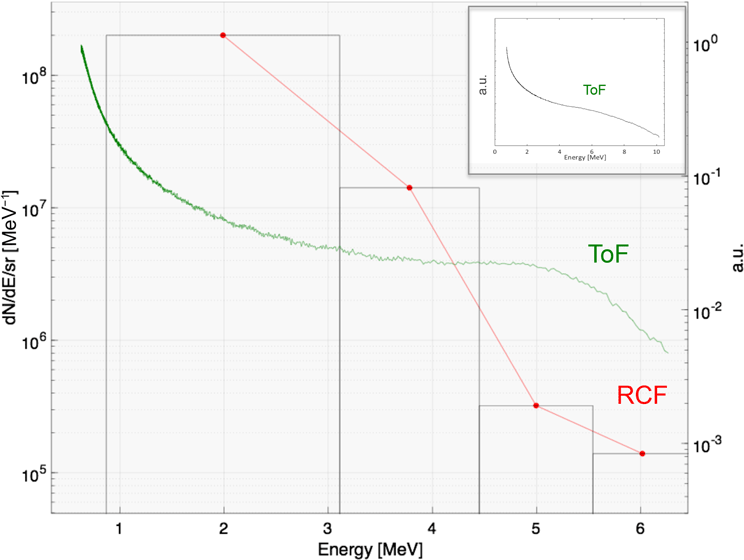
Figure 8 shows proton energy spectra obtained by both RCFs and ToF analysis and in the insertion an example of ToF spectrum with maximum energy up to 10 MeV. Maximum proton energies from 6 to 10 MeV have been routinely obtained and an estimation of the total number of protons per shot (
![]() ${\sim}10^{8}$
) has been done by calibrating the RCF detectors with well known proton sources[18]. ToF detectors are at the moment not absolutely calibrated and can only give information about the proton energy range.
${\sim}10^{8}$
) has been done by calibrating the RCF detectors with well known proton sources[18]. ToF detectors are at the moment not absolutely calibrated and can only give information about the proton energy range.
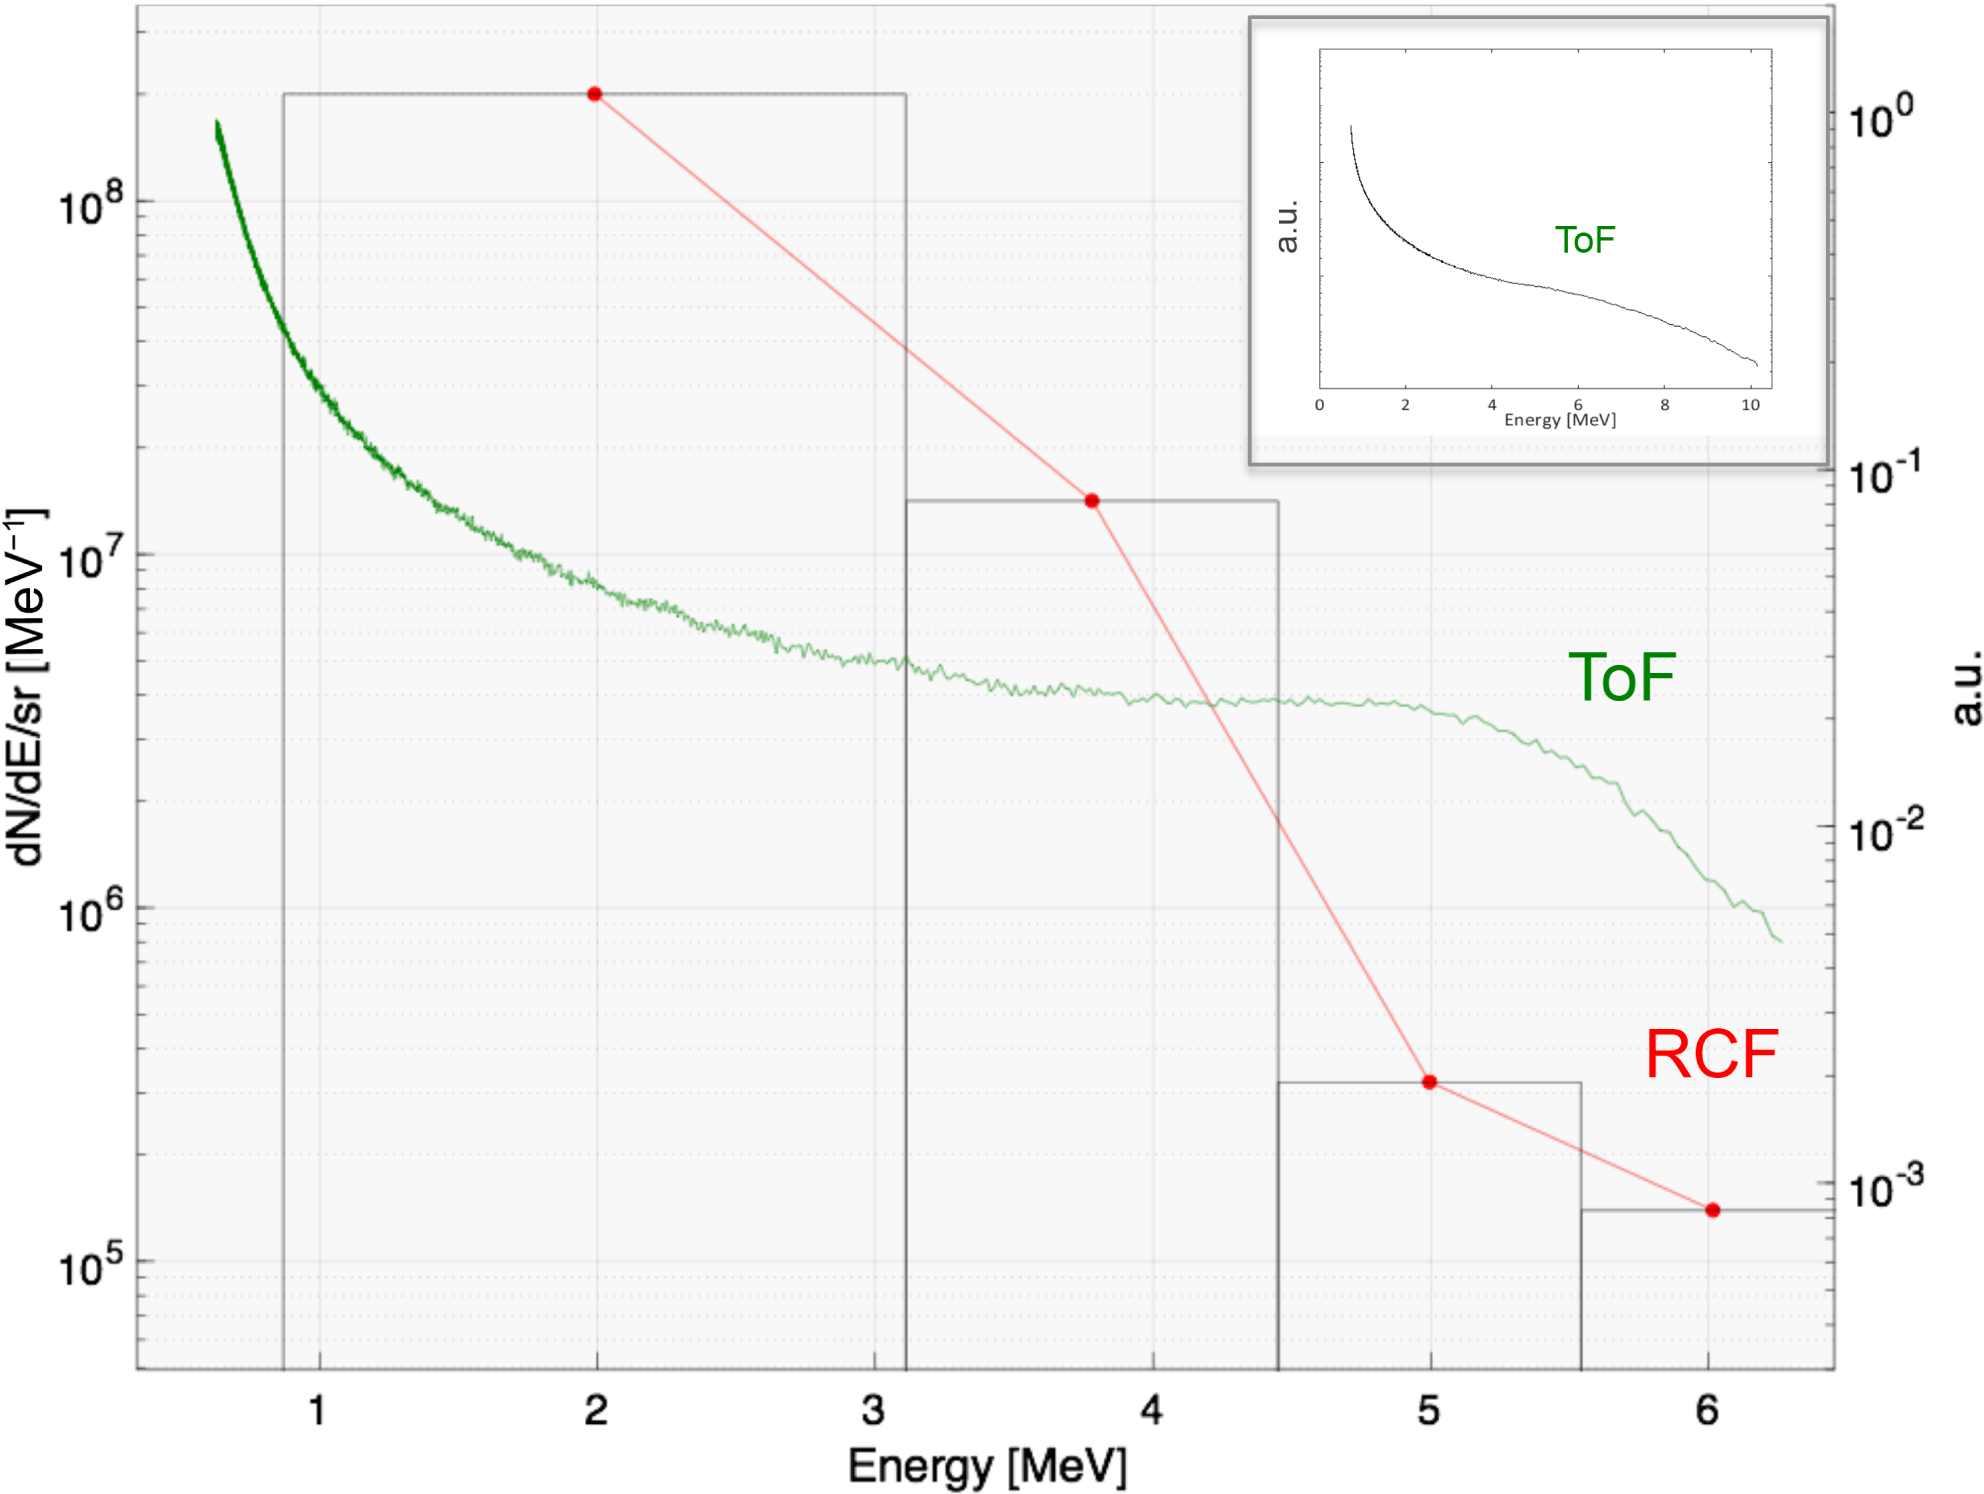
Figure 8. Proton spectrum obtained by both RCF (histogram) and ToF (continuous line) measurements for the same series of shots (by using special holed RCFs). Inset: example of typical proton spectrum obtained by ToF detection with maximum energy around 10 MeV.
Proton radiography of test objects has been performed with the obtained proton distribution and some results are shown in Figure 9 starting from left a piece of a leaf, a wing, a grid and the CLPU metal logo being radiographed. Analysis of the results is in progress and will be submitted soon for publication.

Figure 9. Proton radiography of (starting from left) a piece of leaf, a wing, a metallic grid and a CLPU metallic logo. The final image of the logo appears in the first RCF layer to be in a 20 mm
![]() $\times$
100 mm area which, according to the geometrical magnification
$\times$
100 mm area which, according to the geometrical magnification
![]() $M\sim 4$
, reproduces correctly the original dimensions of the logo which is 5 mm
$M\sim 4$
, reproduces correctly the original dimensions of the logo which is 5 mm
![]() $\times$
20 mm.
$\times$
20 mm.
TNSA proton acceleration mechanism is controlled by electron dynamics into the target. It is relevant to have information on the laser-driven electron population[Reference Volpe, Batani, Birindelli, Morace, Carpegiani, Xu, Liu, Zhang, Zhang, Lin, Liu, Wang, Zhu, Meng, Wang, Li, Sheng, Wei, Zhang, Santos and Spindloe19] which generates the quasi-static electric field[Reference Schreiber, Bell, Grüner, Schramm, Geissler, Schnürer, Ter-Avetisyan, Hegelich, Cobble, Brambrink, Fuchs, Audebert and Habs20, Reference Passoni and Lontano21] responsible for the proton acceleration. We imaged the electron beam travelling into the target by collecting and focusing incident
![]() $K_{\text{alpha}}$
radiation coming from hot electron interaction within the Al target (
$K_{\text{alpha}}$
radiation coming from hot electron interaction within the Al target (
![]() $h\unicode[STIX]{x1D714}\sim 1.5$
keV). Such radiation has been routinely collected by a remotely adjustable Kirk-Patrick Baez (KB) microscope, onto an X-ray CCD. The KB microscope was placed 1.2 m from TCC at
$h\unicode[STIX]{x1D714}\sim 1.5$
keV). Such radiation has been routinely collected by a remotely adjustable Kirk-Patrick Baez (KB) microscope, onto an X-ray CCD. The KB microscope was placed 1.2 m from TCC at
![]() $30^{\circ }$
with respect to the target normal and the CCD camera placed in the KB microscope focal plane. This compact X-ray
$30^{\circ }$
with respect to the target normal and the CCD camera placed in the KB microscope focal plane. This compact X-ray
![]() $K_{\text{alpha}}$
diagnostic has also been tested by performing radiography of a calibration grid. Figure 10 shows the diagnostic setup, an example of an obtained
$K_{\text{alpha}}$
diagnostic has also been tested by performing radiography of a calibration grid. Figure 10 shows the diagnostic setup, an example of an obtained
![]() $K_{\text{alpha}}$
spot, and results from X-ray radiography of a grid pattern.
$K_{\text{alpha}}$
spot, and results from X-ray radiography of a grid pattern.
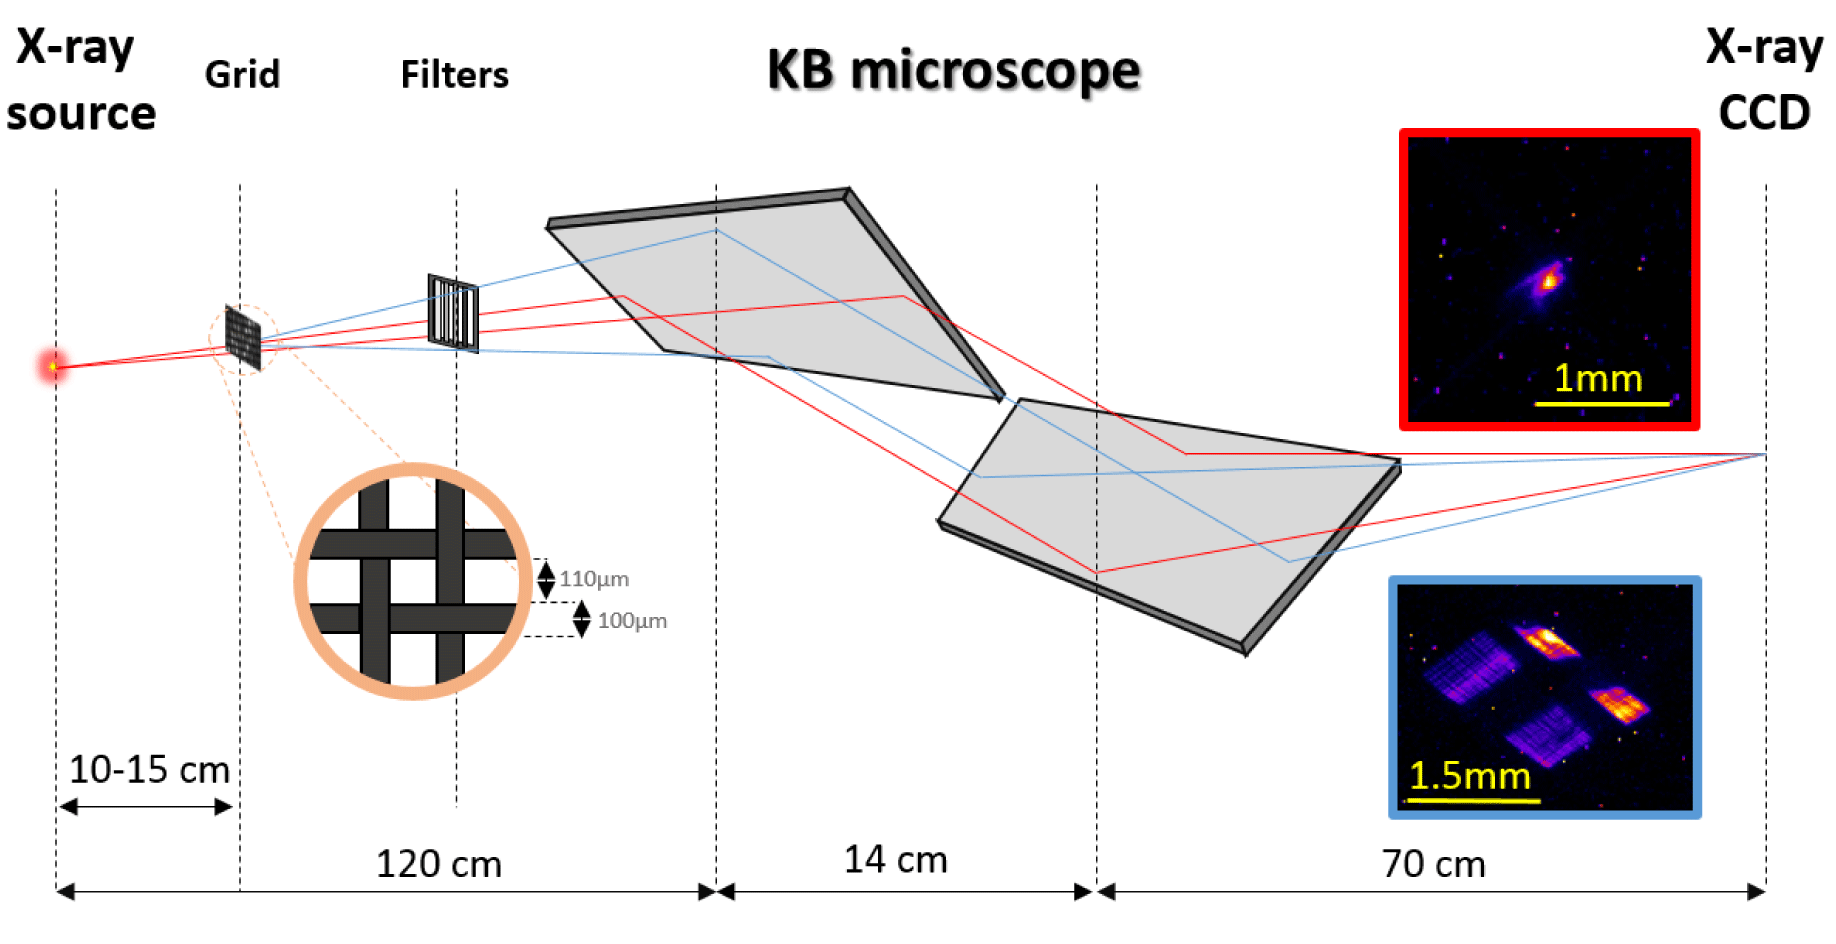
Figure 10. KB microscope setup. Inset (top right): image of the
![]() $K_{\text{alpha}}$
emission from fast electron beam travelling into the
$K_{\text{alpha}}$
emission from fast electron beam travelling into the
![]() $6~\unicode[STIX]{x03BC}\text{m}$
Al target. Inset (bottom right): magnified radiography of a calibration grid.
$6~\unicode[STIX]{x03BC}\text{m}$
Al target. Inset (bottom right): magnified radiography of a calibration grid.
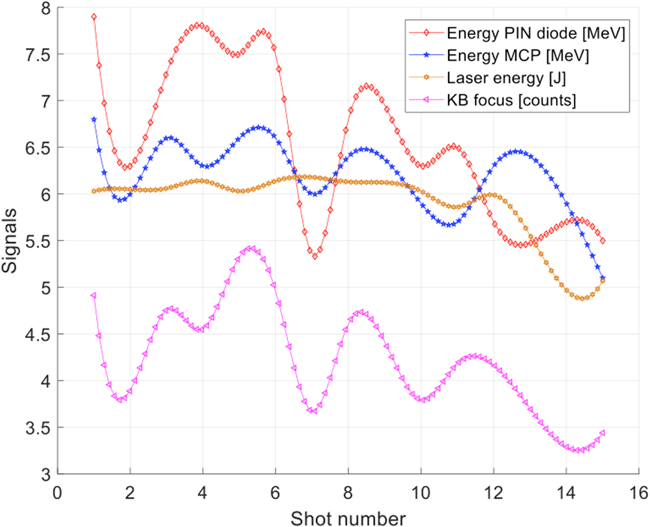
Proton production has been tested at a constant repetition rate mode and the VEGA 2 laser pulse operation has shown good stability in terms of shot-to-shot variation of the focal spot and total laser energy which results in a good reproducibility of the experimental data in all the diagnostics. The
![]() $K_{\text{alpha}}$
signal was used as a reference criterion for evaluating shot-to-shot fluctuation. Figure 11 shows an example of a series of shots comparing experimental data acquired from different installed diagnostics pin diode, multi-channel-plates and KB microscope. Clear correlation between results can be seen.
$K_{\text{alpha}}$
signal was used as a reference criterion for evaluating shot-to-shot fluctuation. Figure 11 shows an example of a series of shots comparing experimental data acquired from different installed diagnostics pin diode, multi-channel-plates and KB microscope. Clear correlation between results can be seen.
4 Conclusions
The first experimental campaigns on VEGA 2 target area have shown the potential of the 200 TW system demonstrating a good performance and stability of the VEGA 2 laser system with a large margin of improvement. A flexible and comprehensive targetry and a diagnostic system have been developed to support experimental activities in both long focal and short focal lengths configurations. It is worth noting that targetry and diagnostic systems need further development to match the repetition rate potential of the laser system. Indeed, target movement and alignment still need to be improved and optimized for working modes above 0.1 Hz. Diagnostic techniques are not always mature for high repetition rate acquisition that can reproduce the performance of the original passive detectors. In summary we have routinely obtained 0.5 GeV electron beams with more than 10 keV critical energy (synchrotron-like spectrum) X-ray betatron emission in the long focal length configuration and a TNSA-like proton spectrum with maximum energy of around 9 MeV in the short focal length configuration. In addition significant electromagnetic pulses have also been generated and measured during laser operation, in particular during the short focal campaign where laser intensities reach up to
![]() $10^{20}~\text{W}\cdot \text{cm}^{-2}$
.
$10^{20}~\text{W}\cdot \text{cm}^{-2}$
.
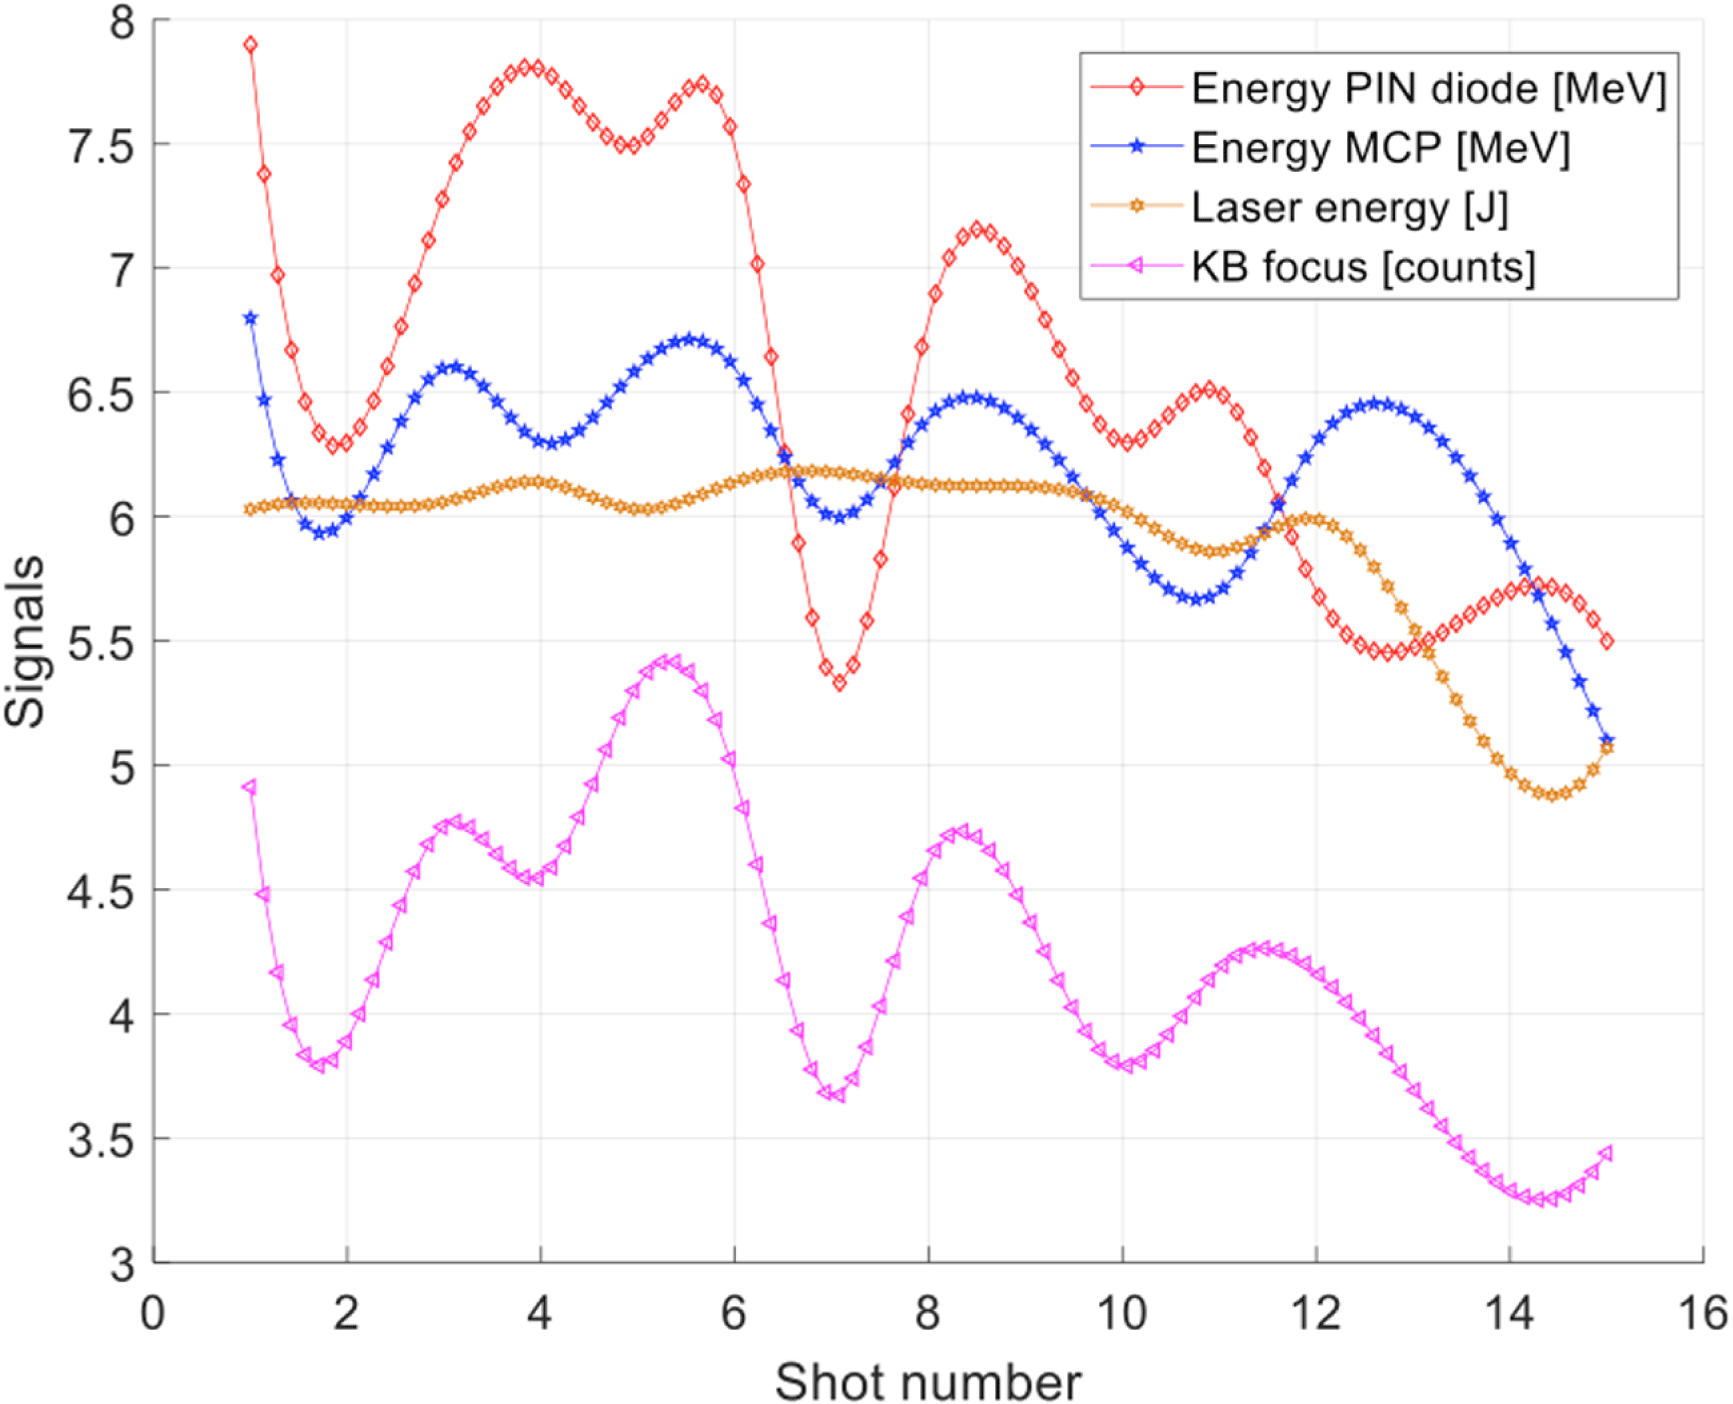
Figure 11. Example of experimental data for different diagnostics in place: (red, diamond points) maximum proton energy from pin diode ToF measurement, (blue, star points) maximum proton energy from MCP TOF measurements, (orange, circle points) laser energy and (purple, triangle points)
![]() $K_{\text{alpha}}$
integrated signal from KB X-ray focusing system. The lines are guides for eyes.
$K_{\text{alpha}}$
integrated signal from KB X-ray focusing system. The lines are guides for eyes.
Acknowledgements
The authors would like to thank all the CLPU workers that during the last 10 years were working hard in order to build and develop the facility, in particular, the CLPU scientific, laser and administrative divisions as well as the engineering and radio protection areas. Also, we would like to thank the Ministry of Science, the Castilla y Leon region and the University of Salamanca for the constant support during all the phases of construction and implementation of the CLPU facility. Support from Spanish Ministerio de Ciencia, Innovación y Universidades through the PALMA Grant No. FIS2016-81056-R, ICTS Equipment Grant No. EQC2018-005230-P; from LaserLab Europe IV Grant No. 654148 and from Junta de Castilla y León Grant No. CLP087U16 is acknowledged.
Author contributions
R. Fedosejevs and L. Volpe conceived, designed and oversaw respectively the electron acceleration and the proton acceleration experiments; G. Gatti and J. A. Perez supervised and operated both the experiments; X. Vaisseau, J. I. Apiñaniz, M. Huault, C. Salgado, G. Zeraouli, S. Malko, A. Longman, K. Li, and V. Ospina, performed the experiments and analysed the data; C. Mendez and Laser Team operated the laser and D. de Luis with engineer area supported experimental campaign with design and fabrication. L. Volpe wrote the first draft of the paper.


