1. Introduction
Quantitative trait loci (QTLs) have been detected for most major pig traits over the last decade (PigQTLDB; Hu et al., Reference Hu, Dracheva, Jang, Maglott, Bastiaansen, Rothschild and Reecy2005). Increasing the frequency of favourable QTL alleles through marker-assisted selection (MAS) may be very helpful for improving the efficiency of breeding schemes by reducing testing costs and increasing selection accuracy, especially when traits are difficult to measure, either because of the timing of the measurement (late in the animal's life or after slaughter) or because of their cost. Primary analyses are mostly based on single QTL single-trait tests: as a result of a genome scan for correlated traits of interest, many QTLs are often mapped for different traits with large confidence intervals in a given chromosomal region, possibly suggesting ghost QTLs (Lander & Botstein, Reference Lander and Botstein1989). Difficulty of measurements and multiple QTL detections are both characteristics of mapping for carcass composition traits and intramuscular fat content (IMF) in the Swine Leukocyte Antigen (SLA) region on porcine chromosome 7 (SSC7) (Bidanel & Rothschild, Reference Bidanel and Rothschild2002). In such situations, implementing multivariate QTL detections, i.e. setting up models for multiple correlated traits and/or multiple linked locations, can improve the power of detection and accuracy of localizations, and more precisely define the QTL pattern in that chromosomal region (Zeng, Reference Zeng1993, Reference Zeng1994; Korol et al., Reference Korol, Ronin and Kirzhner1995, Reference Korol, Ronin, Nevo and Hayes1998, Reference Korol, Ronin, Itskovich, Peng and Nevo2001; Ronin et al., Reference Ronin, Korol and Nevo1999; Kao et al., Reference Kao, Zeng and Teasdale1999; Nakamichi et al., Reference Nakamichi, Ukai and Kishino2001). In outbred designs, such strategies have long been limited due to high computing costs, but Gilbert & Le Roy (Reference Gilbert and Le Roy2007) proposed a multiple-step strategy to efficiently pre-select traits to perform multidimensional mapping. In iterative steps, genetic linkage due to pleiotropic chromosomal regions was described by using linear combinations of traits to reduce model dimensions. Finally, multiple-trait models including linked and single pleiotropic QTLs were fitted and tested against each other. To illustrate the technique, this strategy was applied in a Large White×Meishan pig cross to fatness and carcass composition traits in the SLA region where QTLs had already been described (Bidanel et al., Reference Bidanel, Milan, Iannuccelli, Amigues, Boscher, Bourgeois, Caritez, Gruand, Le Roy, Lagant, Quintanilla, Renard, Gellin, Ollivier and Chevalet2001, Reference Bidanel, Milan, Renard, Gruand and Mourot2002; Milan et al., Reference Milan, Bidanel, Iannuccelli, Riquet, Amigues, Gruand, Le Roy, Renard and Chevalet2002). The four carcass fatness characteristics are routinely recorded and efficiently selected in French pig populations (see Tribout et al., Reference Tribout, Caritez, Gogué, Gruand, Bouffaud, Billon, Péry, Griffon, Brenot, Le Tiran, Bussières, Le Roy and Bidanel2004). The fifth trait, intramuscular fat content (IMF), is not measured in the selection schemes and was recorded on a limited number of progeny in the experimental cross. In this paper, the multivariate techniques were aimed at improving the data analysis of IMF by taking advantage of the correlations between the traits, and marginally at better localizing the loci and identifying pleiotropic effects.
2. Materials and methods
(i) Animals, traits and genotyping
The PORQTL project was a large programme for QTL detection in Large White×Meishan F2 pigs carried out at INRA (Bidanel et al., Reference Bidanel, Milan, Iannuccelli, Amigues, Boscher, Bourgeois, Caritez, Gruand, Le Roy, Lagant, Quintanilla, Renard, Gellin, Ollivier and Chevalet2001). In this study, the following carcass composition traits were analysed:
– two carcass cuts, i.e. backfat (backfat) and leaf fat (leaf fat) weights,
– two backfat thicknesses measured shortly after slaughter using a Fat-O-Meater probe between the third and fourth lumbar vertebrae at 8 cm from the spine (BFT1) and beneath the last rib at 6 cm from the mid-dorsal line (BFT2),
– intramuscular fat content (IMF) of the longissimus lumborum muscle.
Phenotypic data were adjusted for systematic environmental effects (and slaughter weight for carcass cuts) as described in Milan et al. (Reference Milan, Bidanel, Iannuccelli, Riquet, Amigues, Gruand, Le Roy, Renard and Chevalet2002). Further details on the measures can be found in Bidanel et al. (Reference Bidanel, Milan, Iannuccelli, Amigues, Boscher, Bourgeois, Caritez, Gruand, Le Roy, Lagant, Quintanilla, Renard, Gellin, Ollivier and Chevalet2001), Milan et al. (Reference Milan, Bidanel, Iannuccelli, Riquet, Amigues, Gruand, Le Roy, Renard and Chevalet2002) and Bidanel et al. (Reference Bidanel, Milan, Renard, Gruand and Mourot2002).
Due to measurement costs, only a subsample of 236 F2 males, offspring from 4 F1 boars and 16 F1 sows, were measured for IMF within the PORQTL project, whereas almost 500 carcass adiposity measurements were available. In this study, all analyses were restricted to the subsample in order to increase information on the IMF distribution among the progeny while not creating a missing data structure in multiple-trait tests.
A total of 10 microsatellite markers were genotyped for all F0, F1 and F2 pigs as described in Bidanel et al. (Reference Bidanel, Milan, Iannuccelli, Amigues, Boscher, Bourgeois, Caritez, Gruand, Le Roy, Lagant, Quintanilla, Renard, Gellin, Ollivier and Chevalet2001). A multipoint linkage analysis was carried out for males, females and both sexes with CriMap software version 2.4 (Green et al., Reference Green, Falls and Crooks1990) in order to calculate the genetic maps. The sex-averaged map of SSC7 is presented in Fig. 1.
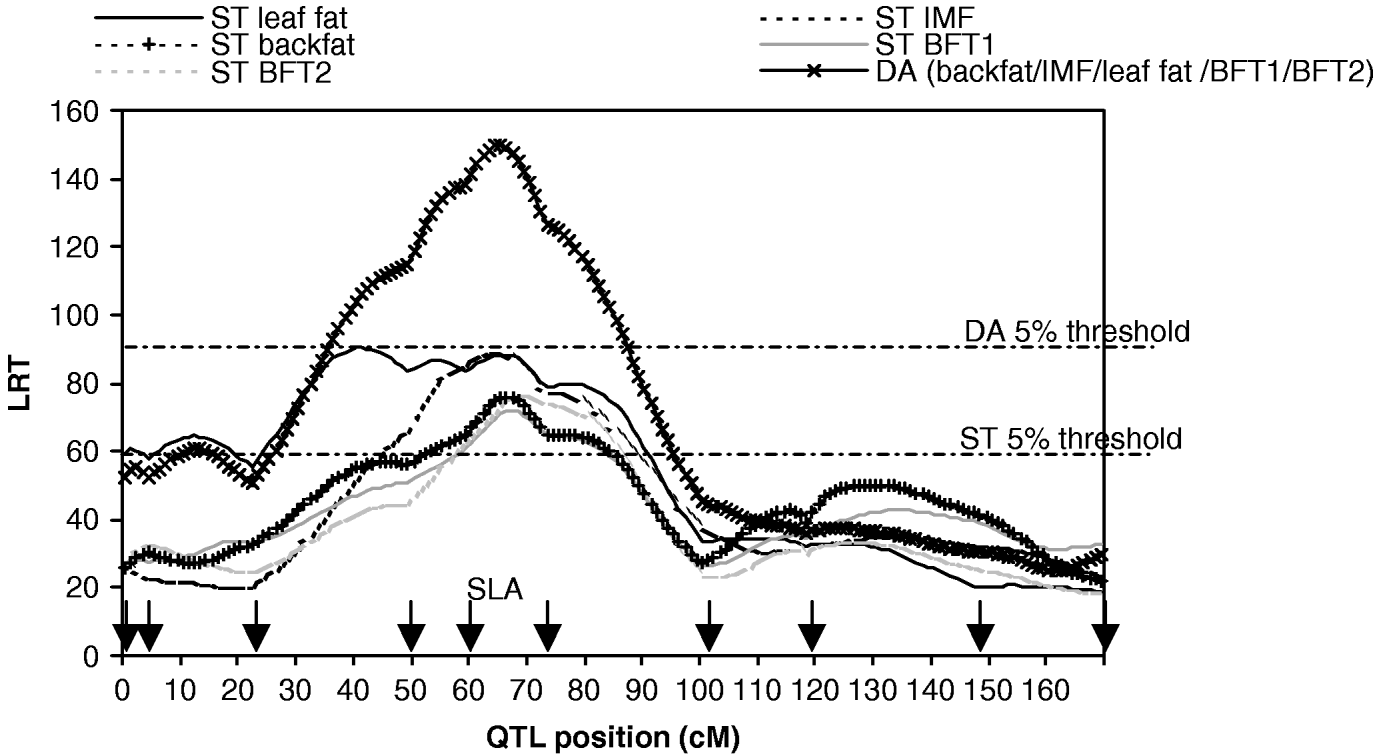
Fig. 1. Likelihood ratio test on SSC7, single-trait single-QTL detection (ST) and five-trait single-QTL detection (DA). Arrows indicate marker positions. The 5% thresholds are the maximum 5% chromosome-wide thresholds among the studied traits.
(ii) QTL detection methods
The basis of the QTL detection technique in the QTLMAP software has been described in Le Roy et al. (Reference Le Roy, Elsen, Boichard, Mangin, Bidanel and Goffinet1998), Elsen et al. (Reference Elsen, Mangin, Goffinet, Boichard and Le Roy1999), Goffinet et al. (Reference Goffinet, Le Roy, Boichard, Elsen and Mangin1999) and Mangin et al. (Reference Mangin, Goffinet, Le Roy, Boichard and Elsen1999) for usual single-trait single QTL detections (ST). Interval mapping was used and a mixture of full- and half-sib families was assumed with no hypothesis about the number of QTL alleles and the allele frequencies within founder populations. In QTLMAP, test statistics were approximate likelihood ratio tests (LRT), retaining only the most probable sire haplotype and all dam phases with a probability higher than 0·1; the likelihood was linearized within full-sib families (Le Roy et al., Reference Le Roy, Elsen, Boichard, Mangin, Bidanel and Goffinet1998). In practice all phases were built with certainty.
For the multivariate tests (Gilbert & Le Roy, Reference Gilbert and Le Roy2007), we note M pq the model involving p traits and q QTLs (p=1 to 5 and q=0 to 2 in this study). Note that the following hold:
– two-QTL models M p2 represent a group of models where each QTL is pleiotropic on all p traits (for p>1),
– from M p1 to M 10, nested models are obtained by removing traits from p to 1,
– from M p2 to M p0, one pleiotropic QTL model M p1 is tested versus two pleiotropic linked QTLs if M p1 is significant, or else M p0 is used as the null hypothesis.
Multiple-trait tests were based on two complementary approaches:
– a multivariate approach, where the joint influence on the traits was assumed to follow a multinormal distribution (MV under one-QTL models (Gilbert & Le Roy, Reference Gilbert and Le Roy2003), MV2 under two-QTL models (Gilbert & Le Roy, Reference Gilbert and Le Roy2007)),
– a univariate likelihood, where the joint influence was described using a linear combination of the traits. This linear combination was treated as a normally distributed new trait in QTL mapping models. At each position, two progeny groups were defined depending on the sire haplotype inherited at that position. A discriminant analysis was then applied to compute the linear combination of the traits which best discriminated the haplotypic progeny groups, i.e. which maximized the ratio of the between-group variability (variability due to the putative QTL at that position) and the within-group variability (variability due to any other factor). Its computation has been detailed in Gilbert & Le Roy (Reference Gilbert and Le Roy2003) for the no-QTL model M p0 and the one-QTL model M p1 (DA), and in Gilbert & Le Roy (Reference Gilbert and Le Roy2007) for the two-QTL model M p2, where both QTLs can determine the traits (DA2).
Significance levels were estimated by Monte Carlo simulations, trait values being simulated with multinormal distributions (see Gilbert & Le Roy, Reference Gilbert and Le Roy2003, Reference Gilbert and Le Roy2007). When the null hypothesis was ‘no QTL’, independently of the genotypes, null means were simulated and variances corresponded to the known heritability of the traits. When the null hypothesis was ‘one QTL’, firstly genotypes were simulated for markers together with a putative QTL located at the position of the maximum of the test statistic estimated under the corresponding M k1 model. Then, trait values were jointly simulated for the k traits under an additive multinormal model, conditional on the QTL genotype. The simulated QTL effects were equal to the effects estimated at the maximum of the test statistic obtained while testing the one-QTL model for k traits with an MV test. Two thousand simulations were carried out for M k0 versus M k1 tests, but only 200 simulations could be performed for M k0 or M k1 versus M k2 tests, due to excessive computing times. The approximations of Harrel & Davies (Reference Harrel and Davis1982) to the simulated distribution were applied to finally assess the thresholds. For single-trait tests, the type I errors α considered were systematically corrected to account for the number of traits k, using an approximated Bonferroni correction: for an expected αexpected error, the test error αtest was αtest=αexpected/k.
(iii) Strategy for systematic analysis
The successive steps for multidimensional analyses were as follows:
(1) to test each trait separately for zero-QTL (M 10), one-QTL (M 11) or two-QTL (M 12) models,
(2) to select the groups of traits jointly determined by the chromosomal region, with successive tests of M k0 versus M k1, k=p to 2 in a backward selection (see below),
(3) to apply different genetic models for each group of traits so as to: (a) test a full two pleiotropic QTL model, (b) apply submodels if necessary.
The three steps (1) to (3a) could be run automatically, first using the single-trait methods, i.e. ST for the single-QTL tests (Le Roy et al., Reference Le Roy, Elsen, Boichard, Mangin, Bidanel and Goffinet1998), ST2 for the two-QTL tests (Gilbert & Le Roy, Reference Gilbert and Le Roy2007) and the DA technique to deal with the multiple-trait selection of models. Tests of submodels (3b) were based on multivariate techniques and were hence time-consuming. Only pertinent submodels were pre-selected based on the M 12 and M k1 tests applied.
The backward selection of the traits in step (2) was performed using DA according to the following procedure:
(2a) an analysis with a k=p trait model was performed,
(2b) when the test for one pleiotropic QTL was significant, the trait with the lowest contribution to the linear combination at the maximum of the test statistic was excluded,
(2c) an analysis with a k−1 trait model,
(2d) if the test with k−1 traits was at least as significant as the test with k traits, a new selection of traits following steps (2b) to (2c) was run. When the test with k – 1 traits was less significant than the test with k traits, the selection stopped and the model with k traits was considered as the most appropriate model.
After a first selection process from steps (2a) to (2d), a new analysis was carried out considering only the group of the removed traits, to have the opportunity to map a different genetic mechanism for this other group in the region.
3. Results
(i) Single-trait single-QTL results
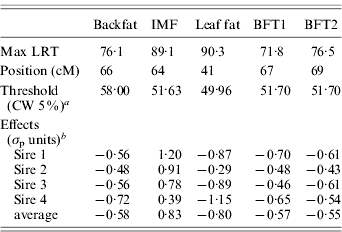
The results of M 10 versus M 11 tests for each trait (Table 1, Fig. 1) showed highly significant QTLs in a 30 cM region in the SLA neighbourhood for the five traits.
Table 1. Single-trait single-QTL analysis: value, position and QTL allele substitution effects at the maximum of the test
a CW, chromosome-wide.
b Allele substitution effects (Meishan – Large White); σp, phenotypic standard deviation.
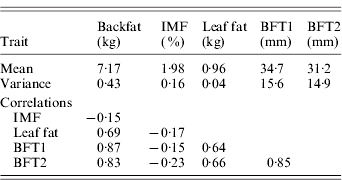
The estimated substitution effects were large and similar for the four sires. Meishan alleles increased IMF, but decreased BFT1, BFT2, leaf fat and backfat, in accordance with the correlations between the traits corrected for environmental effects (Table 2). The high and positive correlations between carcass measurements followed expectation but the low negative correlations with IMF were contrary to published parameter estimates (Sellier, Reference Sellier, Rothschild and Ruvinsky1998), and may suggest the segregation of major cryptic alleles in the specific population studied.
Table 2. Phenotypic variances and phenotypic correlations
(ii) Single-trait linked QTL analyses
Only leaf fat analysis showed a significant maximum test statistic at the 5% chromosome-wide level (Fig. 2) for linked QTL tests. The most likely positions for the QTL were 1 and 67 cM, with average effects of −0·26σp (phenotypic standard deviation) and −0·57σp for the first and second positions, respectively. The maximum likelihood for the one-QTL model M 11 was highly significant at 41 cM with an estimate of −0·80σp for the average QTL effect. It could thus be interpreted as evidence for a ‘ghost QTL’ as described by Martinez & Curnow (Reference Martinez and Curnow1992).
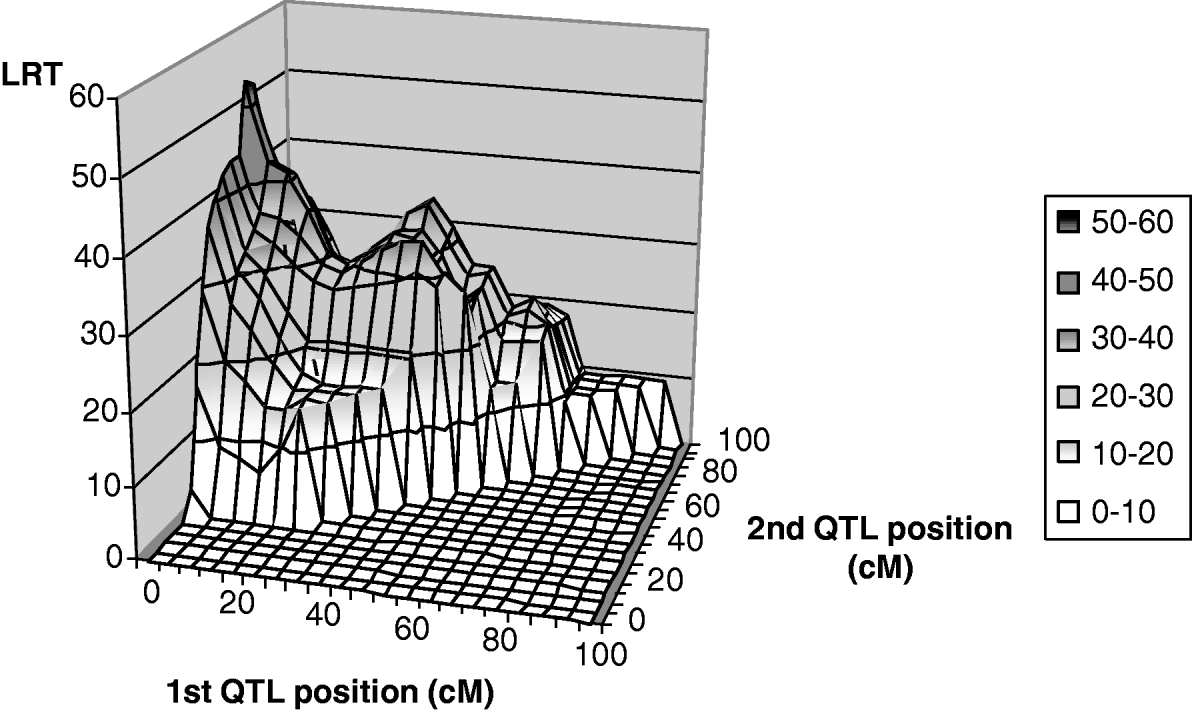
Fig. 2. Two-QTL grid-search for leaf fat: test statistic profile, detail from position 0 to 100 cM.
(iii) Multiple-trait single-QTL analyses
The results for the test of M 50 versus M 51 with MV and DA (Table 3, Fig. 1) showed strong evidence for a pleiotropic chromosomal region, with a maximum test statistic located around 64 cM. Average effects estimated with MV were very similar to those separately estimated under M 11. The residual correlations – excluding the QTL – estimated for that model were all positive except for the correlation between IMF and BFT1 (−0·07), the remaining correlations with IMF ranging from 0·01 to 0·08.
Table 3. Joint analysis of the five traits using a multivariate likelihood (MV) and a discriminant variable (DA), and successive selection of traits with DA

a CW, chromosome-wide.
b Allele substitution effects (Meishan – Large White); σp, phenotypic standard deviation.
Selection of groups of traits by single-QTL analyses
From the M 51 model a selection of significant traits was applied as described previously (Table 3). Excluding BFT1, which contributed only 0·36% to the linear combination, the test statistic with four traits remained the same and the likelihood profile was identical. The two backfat thicknesses were similarly removed from the joint analysis with no major change in the results, so the final model retained only IMF and leaf fat, which contributed equally to the linear combination. The general likelihood profile along the linkage group remained very similar during the selection process (not shown). The QTL effects and the correlation between the traits beside the QTL influence for M 21 were estimated with the MV multivariate technique at the position of the maximum of the test statistic (65 cM): the average estimated substitution effects were 0·83σp for IMF and −0·75σp for leaf fat, so this locus induced a genetic correlation between IMF and leaf fat in contrast to the literature but in accordance with Table 1. The residual correlation beside the QTL was estimated at 0·05.
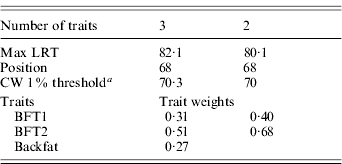
The three traits excluded – BFT1, BFT2 and backfat – were jointly analysed with DA (Table 4). The analysis was significant at a 1% type I level, and remained as significant after removing backfat from the test. The average substitution effects were 0·57σp and 0·59σp, respectively, for BFT1 and BFT2, with a residual correlation (0·81) similar to their phenotypic correlation.
Table 4. Trait selection using DA, for BFT1, BFT2 and BWT
a CW, chromosome-wide.
Based on these analyses, we distinguished three groups of traits referring to potentially different genetic patterns in this chromosomal region: (1) IMF+leaf fat, (2) BFT1+BFT2, and (3) backfat. From that point, pleiotropic regions were tested for the segregation of pleiotropic linked QTLs (M 21 versus M 22) using DA2.
(v) IMF and leaf fat
With IMF and leaf fat, the DA2 test statistic was maximized for the two positions 0 and 66 cM, with a value of 91·5, significant at the 1% chromosome-wide level. Submodels of M 22 where the two QTLs are not pleiotropic were then tested. A first model with two non-pleiotropic QTLs was rejected in comparison with the model with two pleiotropic QTLs. Then, a new model, combining one QTL affecting only leaf fat and one pleiotropic QTL for IMF and leaf fat, was tested in comparison with the following: (1) a single pleiotropic QTL model M 21 (where the new model was the alternative hypothesis); (2) a two pleiotropic QTL model (where the new model was the null hypothesis). M 21 was rejected at the 1% level, whereas the second model could not be rejected. Using MV2 to estimate the corresponding effects and residual correlation, we finally retained a model with two QTLs, the first one at 0 cM with an effect of −0·22σp on leaf fat, and the second one at 66 cM, with pleiotropic effects of −0·59σp and 0·83σp on leaf fat and IMF, respectively. This was highly consistent with the single-trait results. The residual correlation was −0·19, close to the phenotypic correlation for these data.
(vi) BFT1 and BFT2
For BFT1 and BFT2, the DA2 maximum (positions 69 and 140 cM) was slightly below the 5% threshold. Conversely, the tests with MV2 were highly significant (74·4, the threshold for a 0·01 type I error being 63·7) with most likely positions at 40 and 70 cM and estimated effects of −0·27σp and −0·32σp for BFT1, and −0·28σp and −0·38σp for BFT2, respectively. This difference suggests that at least two (at positions 40 and 70 cM) or three loci (with an additional position at 140 cM suggested by the LRT profiles for BFT1 and BFT2 in Fig. 1) were influencing these traits, with complex interactions that can not be handled in the current models (Gilbert & Le Roy, Reference Gilbert and Le Roy2007). The residual correlation (0·85) remained unchanged compared with previous tests.
(vii) Joint analysis of the two groups of traits
A last test was conducted to compare the hypothesis of two pleiotropic QTLs, each influencing one of the groups of traits, versus the hypothesis of one pleiotropic QTL determining the four traits. The maximum of the test statistic was very close to zero for adjacent positions around 70 cM and thus was not significant. For this region and until additional markers and recombination events are available, we thus can not conclude that different loci are actually segregating.
4. Discussion and conclusion
This paper is an application of the methodology presented in Gilbert & Le Roy (2003, Reference Gilbert and Le Roy2004, Reference Gilbert and Le Roy2007), with some additional submodels used to increase the power of detection and the understanding of the genetic pattern of QTLs influencing IMF, a major trait for meat quality but one that is difficult to measure. The analysis concluded with a model (Fig. 3) pointing out at least two additional regions compared with the single-trait single-QTL detections previously conducted, around 0 cM and 140 cM. Moreover, the QTL locations were clarified compared with our earlier studies, resolving a ghost QTL for leaf fat in two different locations and identifying at least two locations for backfat thickness.
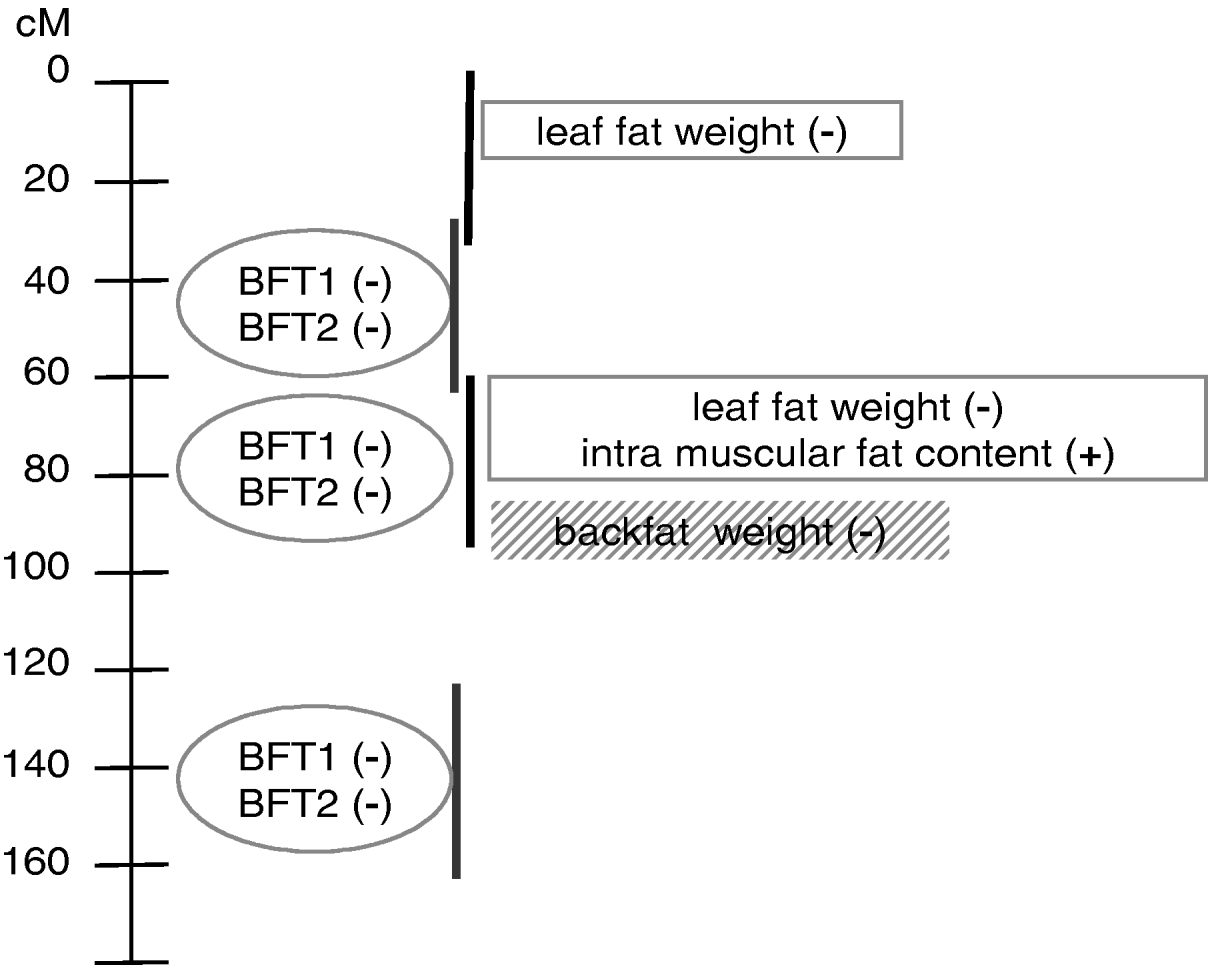
Fig. 3. Summary of QTL model segregation for carcass composition on SSC7 using multidimensional models for detection. Four chromosomal regions, represented by vertical lines, were detected using three groups of traits distinguished by the ovals, rectangles and shaded rectangle. (+), increasing effect from Meishan alleles; (−), increasing effect from Large White alleles.
Among QTL detection studies on the same data set, Quintanilla et al. (Reference Quintanilla, Milan and Bidanel2002) conducted two-QTL single-trait tests. They found a significant result on SSC7, with two QTLs located at positions 70 and 113 cM, affecting average daily gain between 3 and 10 weeks. In contrast, they found no significant result for average backfat thickness during growth. The multiple-trait approach used in the present study certainly helped in reaching significance. Knott et al. (Reference Knott, Markulnd, Haley, Andersson, Davies, Ellegren, Fredholm, Hansson, Hoyhem, Lundström, Moller and Andersson1998) detected linked QTLs for the percentage of abdominal fat in a Wild Boar×Large White cross on SSC5 and SSCX, but did not find anything on SSC7. de Koning et al. (Reference de Koning, Rattink, Harlizius, van Arendonk, Brascamp and Groenen2000) also pointed out the possibility of QTL linkage for backfat thickness on SSC7.
Fixation of QTL alleles in grand-parental breeds was strongly suggested by the homogeneity of the QTL effect estimates for the F1 sires in the present study. However, previous genome scans for fatness (Bidanel et al., Reference Bidanel, Milan, Iannuccelli, Amigues, Boscher, Bourgeois, Caritez, Gruand, Le Roy, Lagant, Quintanilla, Renard, Gellin, Ollivier and Chevalet2001), IMF (Bidanel et al., Reference Bidanel, Milan, Renard, Gruand and Mourot2002) and carcass composition (Milan et al., Reference Milan, Bidanel, Iannuccelli, Riquet, Amigues, Gruand, Le Roy, Renard and Chevalet2002) pointed out QTLs with similar effects with line-cross (Haley et al., Reference Haley, Knott and Elsen1994) and sib-family models, but they later failed to detect linkage for fatness on SSC7 using line-cross models (Quintanilla et al., Reference Quintanilla, Milan and Bidanel2002), as did Knott et al. (Reference Knott, Markulnd, Haley, Andersson, Davies, Ellegren, Fredholm, Hansson, Hoyhem, Lundström, Moller and Andersson1998) in a cross between Wild Boar and Large White. Moreover, de Koning et al. (Reference de Koning, Janss, Rattink, van Oers, de Vries, Groenen, van der Poel, de Groot, Brascamp and van Arendonk1999) reported segregation of QTL alleles for fatness on SSC7 in the Meishan and Dutch breeds. But if this is true, further line-cross analysis should be more powerful (Alfonso & Haley, Reference Alfonso and Haley1998) and give more accurate estimates so that the QTL mapping might be refined. Finally, studies taking account of interactions with the QTLs segregating on other chromosomes should be carried out to obtain a complete picture of the genetic pattern of the traits.
The model with at least three chromosomal regions affecting the traits was finally based on six individual patterns (Fig. 3) which could not be explicitly separated in this study, due to the high number of loci that should be jointly considered. Among those six QTL regions, three were mapped in the very narrow region surrounding the SLA microsatellite. To distinguish among them using the interval mapping techniques, simulation studies (Knott & Haley, Reference Knott and Haley2000; Korol et al., Reference Korol, Ronin, Itskovich, Peng and Nevo2001; Gilbert & Le Roy, Reference Gilbert and Le Roy2007) showed that a higher number of informative recombinant individuals should be genotyped for genetic markers located between the different QTLs. Alternative methods, such as IBD techniques in linkage disequilibrium approaches, the production of new informative recombinations by, for example, backcross designs and the genotyping of additional markers, would be necessary at this stage to narrow the confidence interval for the QTLs.
Three different groups of traits related to different physiological functions were identified. The first group corresponded to internal fat characteristics, i.e. intramuscular fat content and leaf fat weight. The second group concerned external fat, with two highly correlated measures of backfat thickness. Different effects between the groups might be related to different kinetics for fat deposition or differences in composition between external and internal fat. Finally, backfat weight the day after slaughtering seemed isolated in a third group. This differential pattern between the two backfat thickness measurements at slaughter and the backfat weight 24 hours later could be related to the general shape of the backfat, due to different carcass lengths for example, or to fat composition, which may induce different fat weight losses the day after slaughter, suggesting a technological interest for these loci. It is not clear, however, whether the loci influencing backfat weight and thicknesses in the SLA regions were actually different, or whether the model including BFT1 and BFT2 did explain most of the weight variability. However, the second and potential third loci involved in backfat variability seemed to affect only thickness.
Moreover, the differences for ‘internal’ fat and ‘external’ fat on SSC7 were related to a positive effect of the Meishan alleles on intramuscular fat content, associated with a negative influence on the other traits for all the QTLs, indicating a cryptic favourable allele for IMF segregating in the Large White breed. Cryptic alleles for fatness have been described previously on SSC7, essentially concerning backfat thickness (Moser et al., Reference Moser, Mueller, Beeckmann, Yue and Geldermann1998; Rohrer & Keele, Reference Rohrer and Keele1998; de Koning et al., Reference de Koning, Janss, Rattink, van Oers, de Vries, Groenen, van der Poel, de Groot, Brascamp and van Arendonk1999), but they did not seem to be fixed in the grand-parental breeds (de Koning et al., Reference de Koning, Janss, Rattink, van Oers, de Vries, Groenen, van der Poel, de Groot, Brascamp and van Arendonk1999). But the residual correlations beside the QTL effects estimated in our study between IMF and the carcass composition traits were at most close to zero. Other cryptic alleles or more complex mechanisms might thus be driving the genetic correlations between those traits in that particular cross. Combined with narrowed locations, the additional information about the function of the loci will aid searches for functional and positional candidate genes and may help genetic improvement of IMF content, and correlatively meat quality, with no deterioration of carcass composition. Indeed marker-assisted selection appears particularly interesting since accurate phenotyping is expensive and phenotypic and genetic correlations with traits of interest are unfavourable – as IMF compared with genetic parameters of carcass composition and fatness in commercial populations. The identification of a specific locus to be selected for in commercial populations – with no deterioration of the carcass composition – would thus be of major interest.


