1 Introduction
The Pendred Syndrome gene, PDS, also named SLC26A4 gene (MIM #605646), located on chromosome 7q31, encodes pendrin, a hydrophobic transmembrane protein composed of 780 amino acids with 11–12 trans-membrane domains (Everett et al., Reference Everett, Glaser, Beck, Idol, Buchs, Heyman, Adawi, Hazani, Nassir, Baxevanis, Sheffield and Green1997; Royaux et al., Reference Royaux, Suzuki, Mori, Katoh, Everett, Kohn and Green2000). Pendrin is expressed in various tissues including principally thyroid, inner ear and kidney. Functional analysis showed that pendrin is an apical transporter of iodide in thyroid cells (Scott et al., Reference Scott, Wang, Kreman, Sheffield and Karniski1999; Bidart et al., Reference Bidart, Mian, Lazar, Russo, Filetti, Caillou and Schlumberger2000; Belguith-Maalej et al., Reference Belguith-Maalej, Rebuffat, Charfeddine, Mnif, Nadir, Abid, Ghorbel, Peraldi-Roux, Ayadi and Hadj-Kacem2011), and it mediates secretion of HCO3− into the endolymph in the cochlea (Wangemann et al., Reference Wangemann, Nakaya, Wu, Maganti, Itza, Sanneman, Harbidge, Billings and Marcus2007).
Using Tunisian families affected with autoimmune thyroid disease (AITD), Hadj Kacem et al. have shown the involvement of SLC26A4 gene in the genetic susceptibility of these diseases (Hadj Kacem et al., Reference Hadj Kacem, Rebai, Kaffel, Masmoudi, Abid and Ayadi2003).
Recently, we have shown a differential expression pattern of SLC26A4 gene in AITD tissues. In fact, the SLC26A4 gene expression follows the physiological state of thyroid: the expression pattern shift from high level in Grave's disease (GD) to reduced level in Hashimoto thyroiditis (HT) (Belguith-Maalej et al., Reference Belguith-Maalej, Rebuffat, Charfeddine, Mnif, Nadir, Abid, Ghorbel, Peraldi-Roux, Ayadi and Hadj-Kacem2011). This pathogenic SLC26A4 expression variation could be due either to SLC26A4 sequence variations and/or molecular environment (transcription factor, hormones and iodide level). Exploring the genomic sequence of SLC26A4 gene seems to be primordial. Therefore, recently, the SLC26A4 exonic sequences were explored in patients affected with GD (Hadj-Kacem et al., Reference Hadj-Kacem, Kallel, Belguith-Maalej, Mnif, Charfeddine, Ghorbel, Abid, Ayadi and Masmoudi2010). In this study, Hadj Kacem et al. suggested an eventual defective effect of the identified polymorphism. On the other hand, investigating SLC26A4 non-coding region is also important since large intronic sequence may include functional polymorphism, microRNA and may harbour the sequence of other genes (Zhou & Lin, Reference Zhou and Lin2008). Intronic microsatellite repeats constitute widespread regulatory elements of alternative splicing (Hui et al., Reference Hui, Hung, Heiner, Schreiner, Neumuller, Reither, Haas and Bindereif2005), may affect the gene expression level by modulating the movement of RNA polymerase (Peck & Wang, Reference Peck and Wang1985). Indeed, it has been reported that shorter CA-repeat length is associated with an increased expression of epidermal growth factor receptor (EGFR) in lung carcinoma (Sueoka-Aragane et al., Reference Sueoka-Aragane, Imai, Komiya, Sato, Tomimasu, Hisatomi, Sakuragi, Mitsuoka, Hayashi, Nakachi and Sueoka2008; Suzuki et al., Reference Suzuki, Kageyama, Shinmura, Okudela, Bunai, Nagura, Igarashi, Kiyose, Mori, Tao, Goto, Takamochi, Mochizuki, Suzuki, Ohashi, Ogawa, Yamada, Niwa, Tsuneyoshi and Sugimura2008).
In this study, we identified two new polymorphic microsatellite markers located in intron 10 (rs59736472) close to D7S2459 and in intron 20 (rs57250751). Our case-control association study showed a significant association of the D7S2459 and rs59736472 markers with autoimmune hypo-thyroiditis. Moreover, we suggested the association of longer alleles of intron 10 with HT diseases.
Subjects and methods
Subjects
One hundred and forty-six unrelated Tunisian patients with GD (32 men and 114 women), 90 unrelated Tunisian patients with HT (7 men and 83 women) and 72 unrelated Tunisian patients with primary idiopathic myxidoma PIM (8 men and 64 women) were included in this study. Data gathered from the patient group were compared with those obtained from a control population of 212 unrelated healthy subjects (110 men and 102 women) originating from the same area with no clinical evidence or family history of AITD and inflammatory joint disease. Informed consent was obtained from all participants.
Genetic studies: genotyping of newly identified microsatellite markers
Tandem Repeat Finder (TRF) Software was used to identify two new polymorphic microsatellite markers located at introns 10 ((AT)n(AC)nAAAC(AT)nTCTC(AT)n) and 20 ((TTA)n). DNA from all patients was genotyped with these two markers, in addition to D7S2459 previously explored (Hadj Kacem et al., Reference Hadj Kacem, Rebai, Kaffel, Masmoudi, Abid and Ayadi2003).
Genetic analysis was performed on genomic DNA extracted from blood leucocytes using a standard phenol–chloroform procedure (Kawasaki, Reference Kawasaki, Innis, Gelfand, Sninsky and White1990). Fluorescent primers designed to amplify the microsatellite markers are listed in Table 1. Microsatellite markers were amplified in 96-well Falcon flexi plates by the PCR using Applied Biosystems thermocycler (GeneAmp® PCR system 2700). PCRs were performed in a final volume of 15 μl, containing 50 ng of genomic DNA, 0·16 μM of each primer and 9 μl of True Allele™ PCR Premix kit (Applied Biosystems, Foster City, CA).
Table 1. Primer pairs sequences used in SLC26A4 genotyping

Each PCR was performed using a hot-start procedure, and amplification was carried out using 38 cycles of denaturation at 94 °C for 30 s, with annealing at 55 °C for 30 s, and elongation at 72 °C for 45 s, followed by a final elongation at 72 °C for 7 min. Then 2 μl of each sample were denatured at 96 °C for 3 min in presence of 7·5 μl of formamide and 0·5 of GeneScan™–500 ROX™ Size Standard (Applied Biosystems, Warrington, UK). Fluorescently labelled alleles were analysed on an ABI PRISM® 3100-Avant genetic analyser (Applied Biosystems, HITACHI High-Technologies Corporation, Japan). For each microsatellite marker, four homozygotic DNAs were sequenced to verify allele sequences and sizes using Applied Biosystem ABI PRISM® 3100 Avant.
Statistical analysis
The allele distribution among unrelated patients versus controls was compared using the Chi-square (χ2) test, Kolmogorov–Smirnov (KS) and the Clump analysis program (Sham & Curtis, Reference Sham and Curtis1995). The KS test was ensured by comparing the observed divergence (D obs) to the critical divergence (D crit) at 5% of significance, calculated according to the following formula:
The Clump analysis program is suited for the analysis of multi-allelic markers and has been designed to overcome problems occurring in sparse contingency tables. Statistical significance was reached when P<0·05, Mantel–Haenszel test and Fisher's exact test was used when necessary. Odds ratios (ORs) were calculated using the Epi-Info software (version 3.5.3).
Estimated heterozygosity (HETEst) and polymorphisms information content (PIC) were calculated by HET program provided by J. Ott (Utility Programs for Analysis of Genetic Linkage). The observed heterozygosity (HETObs) was calculated manually.
Haplotypes were inferred using PHASE 2.1.1, a computational tool based on Bayesian methods, developed by Stephens and associates (Stephens et al., Reference Stephens, Smith and Donnelly2001; Stephens & Donnelly, Reference Stephens and Donnelly2003; Stephens & Scheet, Reference Stephens and Scheet2005). Linkage disequilibrium and Hardy–Weinberg disequilibrium were performed with GDA program by Paul O. Lewis and Dmitri Zaykin designed to accompany the book ‘Genetic Data Analysis’ by Bruce S. Weir (1996, Sinauer Associates).
Results and discussion
SLC26A4 gene plays a crucial role in thyroid hormonogenesis. Since 2003, we reported the involvement of SLC26A4 gene in the genetic susceptibility of AITD using family and population-based designs (Hadj Kacem et al., Reference Hadj Kacem, Rebai, Kaffel, Masmoudi, Abid and Ayadi2003). In that study, the case-control analysis showed a significant association of the intragenic marker D7S2459 with HT and/or PIM.
In the present work, we identified new microsatellite markers into the SLC26A4 gene intronic sequences using TRF Software (Benson, Reference Benson1999). Two new polymorphic microsatellite markers, rs59736472 and rs57250751, located at introns 10 and 20, respectively, were found polymorphic (build129; http://www.ncbi.nlm.nih.gov/SNP/snp_ref.cgi?rs=59736472 and http://www.ncbi.nlm.nih.gov/SNP/snp_ref.cgi?rs=57250751, respectively).
A case-control study, based on 308 unrelated AITD patients and 212 controls, was carried out with the rs59736472 and rs57250751, in addition to D7S2459 previously explored (Hadj Kacem et al., Reference Hadj Kacem, Rebai, Kaffel, Masmoudi, Abid and Ayadi2003).
Three alleles with sizes 106, 112 and 115 bp were observed for the rs57250751 (HETEst=0·49, HETObs=0·467, PIC=0·37) (Table 2). The comparison of the allelic distribution between patients affected with AITD and control data showed no significant difference (χ2=1·63, df=2, P=44). This result was maintained with different subgroups (GD, HT and PIM) (Table 3). The D7S2459 microsatellite marker polymorphism analysis revealed 12 alleles with size ranging from 134 to 156 bp. At 350 bp downstream of D7S2459, the rs59736472 microsatellite marker polymorphism in SLC26A4 gene revealed 12 alleles ranging from 29 to 41 repetitions (HETEst=0·814, HETObs=0·744, PIC=0·788) (Table 4). While the D7S2459 was not significantly associated with AITD (χ2=4·44, df=7, P=0·728), a positive association was observed with HTA (χ2=15·95, df=7, P=0·025) and particularly with HT (χ2=19·77, df=6, P=0·003) (Table 3), confirming previously reported data gathered from 54 HT patients and 154 controls (Hadj Kacem et al., Reference Hadj Kacem, Rebai, Kaffel, Masmoudi, Abid and Ayadi2003).
Table 2. Allele frequencies of rs57250751 microsatellite marker in GD, HT and PIM patients and controls

a Grave's disease.
b Hashimoto thyroiditis.
c Primary idiopathic myxidoma.
Table 3. Association of rs 59736472 and D7S2459 microsatellite makers with HTA subgroup
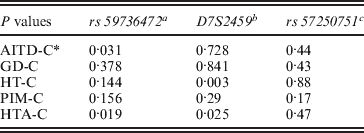
a rs59736472: a significant association was observed with all AITD patients and with HTA subgroup.
b D7S2459: no significant association was observed with AITD, however, a positive association was found with HTA and especially with HT.
c rs57250751: no significant difference in allelic distribution between patients affected with AITD and control was observed.
* : Control.
Table 4. Allele frequencies of rs59736472 microsatellite marker in GD, HT and PIM cases and controls
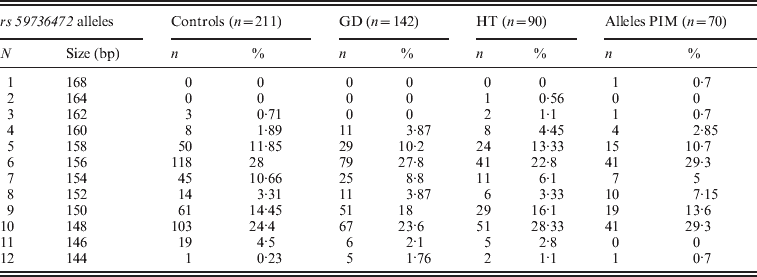
On the other hand, a significant association was observed with rs59736472 and all AITD patients (χ2=16·939, df=8, P=0·031) and HTA subgroup (χ2=18·34; df=8; P=0.019). This association was not maintained with different subgroups (GD, HT or PIM) (P>0·05) (Table 3).
Considering the three intronic markers and using PHASE program, we were able to determine 94 haplotypes with 60 in healthy control group, 55 in both patients affected with GD or HTA, 42 in HT patients and 45 in PIM patients.
Case-control analysis in different subgroups, provided by PHASE, was in accordance with results mentioned above. In fact, a significant association was maintained with HTA (P=0·01) and HT (P=0·03). However, there are no difference in haplotype distribution between GD patients and control group (P>0·05). In HT subgroup, the gender effect was excluded (P>0·05).
To refine the analysis, a case-control study was performed considering haplotypes with frequencies >5%. The remained haplotypes (<5%) were pooled together (Table 5). As result, the statistical significance of the association with HTA was lost (P>0·05); however, it was confirmed with HT patients (χ2=24·04, df=6, P=0·001) (Table 5).
Table 5. Haplotype distribution between controls and AITD patients
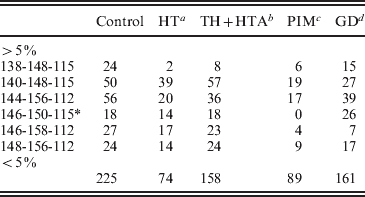
A case-control study was performed considering haplotypes with frequencies >5%. The remained haplotypes (<5%) were pooled together.
a χ2=24·04, df=6, P=0·001.
b χ2=11·69, df=6, P=0·069.
c χ2=3·77, df=5, P=0·58.
d χ2=13·13, df=6, P<0·041.
* : χ2 analysis was performed considering haplotype 146-150-115 ranged with haplotypes with frequencies <5%
Haplotype specific analysis showed that the 140-148-115 haplotype may increase the risk of HT (χ2=9·8, 1 df, P=0·0017, OR=2·07, IC [1·27–3·36]). The predispositional effect of this haplotype could be related either to a functional polymorphism in LD with the ‘risky’ haplotype, or to a pathogenic length of intron 10, generated by the two closed markers D7S2459 and rs59736472.
In fact, several studies suggested that dinucleotide repeat inducing intron-length variability have influence on gene expression (mRNA splice, stability and half-life) (Croston et al., Reference Croston, Kerrigan, Lira, Marshak and Kadonaga1991; Lu et al., 1993; Beutler et al., Reference Beutler, Gelbart and Demina1998; Bharaj et al., Reference Bharaj, Scorilas, Giai and Diamandis2000; Sharma et al., Reference Sharma, Kumar, Brahmachari and Ramachandran2007).
In this regard, our previous studies showed variability in SLC26A4 gene expression among AITD patients (Belguith-Maalej et al., Reference Belguith-Maalej, Rebuffat, Charfeddine, Mnif, Nadir, Abid, Ghorbel, Peraldi-Roux, Ayadi and Hadj-Kacem2011). Thus, on the assumption that the intron-length polymorphism could be pathogenic, identifying the risk length seems to be exciting.
In line with this suggestion, we assumed that In10 marker is the sum of the number of repeats observed in D7S2459 and rs59736472 microsatellite markers (Fig. 1). Considering the Best pairs option outputted by PHASE, we calculated the number of repetitions for both markers for each individual. In total, 15 alleles were observed with size ranging from 45 to 59 repeats (Table 6). Three major alleles were identified, the 47, 53 and 55, with a frequency more than 50% in patients and controls. GDA result indicated that the In10 marker is in Hardy–Weinberg equilibrium (P=0·04).

Fig. 1. D7S2459 and rs59736472 microsatellite markers located in intron 10 used in this study. In10 marker is the sum of the number of repeats observed in D7S2459 and rs59736472 microsatellite markers.
Table 6. In10 dinucleotide repetition distribution between controls and HT subjects*
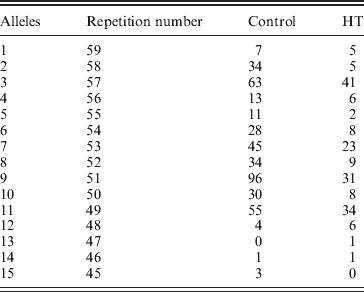
* : In10 marker is the sum of the number of repeats observed in D7S2459 and rs59736472 microsatellite markers
The comparison of the allelic distribution (alleles >56 repeats were pooled together) between HT patients and controls data showed a significant difference (χ2=24·52; 11 df; P=0·011). However, no significant statistical result was found using the KS test (D obs=0·08<D crit=0·120). The highest deviation of KS test was reached at allele 55 (with respect to the cumulative increasing order from the smallest to the longest allele) (Fig. 2). In addition, using clump analysis program, all Chi-squared obtained values (T1, T2, T3 and T4) are significant with 10 000 sets of simulations. We repeated the statistical analysis in clumping the major alleles whose lengths are ⩾55 in the same case of χ2 test. Our result shows a predispositional effect imposed by the 55 allele (χ2=6·32, 1 df, P=0·011, p c=0·012, OR=1·74, IC [1·1–2·76]). Thus, HT disease was significantly associated with longer dinucleotide repeat among intron 10. Several studies have shown that intronic long dinucleotide repeats (n⩾12) are more likely to display length polymorphisms and may act as functional-regulator of transcription (Dib et al., Reference Dib, Faure, Fizames, Samson, Drouot, Vignal, Millasseau, Marc, Hazan, Seboun, Lathrop, Gyapay, Morissette and Weissenbach1996; Wren et al., Reference Wren, Forgacs, Fondon, Pertsemlidis, Cheng, Gallardo, Williams, Shohet, Minna and Garner2000).
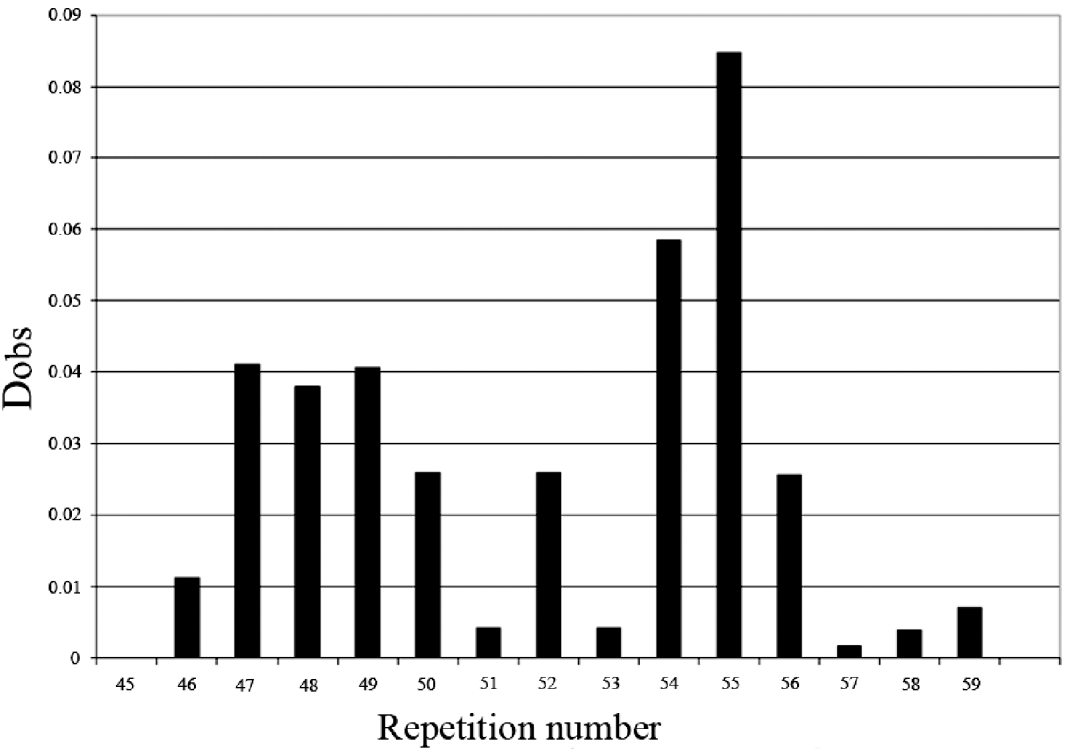
Fig. 2. KS representation: distribution of the repeat size in intron 10 of SLC26A4 gene.
In fact, the change in SLC26A4 intron 10 lengths could give rise to an aberrant splice and/or gene expression defect. In this regard, the length of EGFR CA repeat polymorphism in lung carcinoma is inversely related with level of EGFR protein expression in the carcinoma (Suzuki et al., Reference Suzuki, Kageyama, Shinmura, Okudela, Bunai, Nagura, Igarashi, Kiyose, Mori, Tao, Goto, Takamochi, Mochizuki, Suzuki, Ohashi, Ogawa, Yamada, Niwa, Tsuneyoshi and Sugimura2008). Moreover, increasing the length of intron may substantially delay mRNA maturation (Kandul & Noor, Reference Kandul and Noor2009; Farlow et al., Reference Farlow, Dolezal, Hua and Schlotterer2012). Given this interest, in future research we plan to explore the correlation between SLC26A4 gene expression defect in AITD tissues (Belguith-Maalej et al., Reference Belguith-Maalej, Rebuffat, Charfeddine, Mnif, Nadir, Abid, Ghorbel, Peraldi-Roux, Ayadi and Hadj-Kacem2011) and intron 10 length polymorphisms. Although SLC26A4 gene intron 10 length displays a significant positive association with HT disease, it remains unclear whether the contribution of this variation in the genetic susceptibility to HT arises from its functional role or because it is in linkage disequilibrium with other polymorphisms. Thus, we also intend to examine the relationship between SLC26A4 gene variation previously reported (Hadj-Kacem et al., Reference Hadj-Kacem, Kallel, Belguith-Maalej, Mnif, Charfeddine, Ghorbel, Abid, Ayadi and Masmoudi2010) and this variation in intron 10.
In conclusion, our work highlights the association of polymorphisms of intron 10 length with HT disease. By its variable length, the intron 10 polymorphisms could be an additional functional candidate to explain the SLC26A4 involvement in AITD diseases.
We thank all the subjects participating in this study. This work was supported by the Ministry of High Education and Scientific Research of Tunisia.
Declaration of interest
There are no conflicts of interest.


