INTRODUCTION
Campylobacter spp. are the most frequently identified pathogens in patients with gastroenteritis. The health burden is high and is estimated to be 1800 disability-adjusted life years (DALY) per year in The Netherlands (population 16 million) [Reference Havelaar1]. This is mainly caused by post-infectious sequelae such as reactive arthritis and Guillain–Barré syndrome [Reference Havelaar2]. In industrialized countries, the epidemiology of Campylobacter infections is built upon population-based culture studies [Reference De Wit3, Reference Wheeler4]. These studies yield a figure of 75 000 symptomatic infections annually in The Netherlands, i.e. once per 200 person life-years [Reference De Wit3]. The number of positive Campylobacter cultures peaks in the first years of life with a significant later peak in young adults, especially females [Reference Van Pelt5, Reference Samuel6].
In developing countries, infection pressure is much greater and the number of infections is consequently much higher, varying from 0·4 to 1·5 symptomatic Campylobacter infections per person annually [Reference Rajan and Mathan7–Reference Coker9]. Furthermore, children in developing countries are repeatedly infected with new strains although many of these infections are asymptomatic [Reference Glass8]. Interestingly, in both developed and developing countries, very young children have the highest rate of symptomatic infections, which declines rapidly in the first 3 years of life. Campylobacter infections in the first year of life are most often associated with bloody diarrhoea, whereas at higher ages infections are generally mild.
Serological methods are of great help when investigating infectious disease epidemiology. Very few seroepidemiological studies into Campylobacter infections have been performed and the methodology used in these studies is not always straightforward [Reference Belongia10, Reference Linneberg11]. In the current study, we describe the seroprevalence of Campylobacter in a sex- and age-stratified sample of the general population of The Netherlands. Using a binary mixture model, we show that it is possible to estimate the infection pressure of Campylobacter in the Dutch population.
METHODS
Patients
Serum samples were derived from the PIENTER database [Reference De Melker and Conyn-van Spaendonck12]. Briefly, in order to establish a serum bank of the Dutch general population, eight municipalities with probabilities proportional to their population size were sampled within each of five geographical Dutch regions with similar population sizes. For the complete PIENTER database, an age-stratified sample (age groups <1, 1–4, 5–9 …, 75–79 years) of 380 individuals was randomly selected from each municipality. In each of the first two strata 40 individuals were sampled, while in each of the following strata 20 individuals were sampled. Subjects were requested to give a blood sample and to complete a questionnaire. From all individuals information on gender and urbanization was also included in the database. Samples and data were collected during the period from October 1995 to December 1996. The response rate was 55%. The original national serum bank included 8359 sera of which 456 were analysed for this study.
We randomly selected these 456 samples stratified by 21 categories with almost equal numbers for age (0, 1–4, 5–14, 15–34 males, 15–34 females, 35–64 and >64 years) and three degrees of urbanization (low, intermediate, high). With this age stratification, there are relatively more young children in our sample because this age group has the highest rate of symptomatic infections [Reference Allos13]. Based on seroprevalence rates for IgG from Belongia et al. [Reference Belongia10] hypothetical datasets of increasing size were analysed as described in the following section. Age and degree of urbanization became significant at a sample size of 210. We also took into account the uncertainties regarding different assay systems for detection of anti-Campylobacter antibodies and the different nature of the population, and estimated that a sample of at least twice the calculated sample size of 210 would suffice.
Serological testing of samples
IgA, IgM and IgG antibody reactivity against Campylobacter spp. was measured using an ELISA as described previously [Reference Ang14]. The antigen used for the ELISA was an acid glycine extract of C. jejuni strain SSDZ-01. Data for all isotypes were expressed as ratios. The ratio was calculated by dividing the mean optical density (OD) value of the serum, tested in duplicate, by the median OD value of the reference sample that was included in triplicate on each ELISA plate. Specificity of the Campylobacter ELISA was investigated by pre-incubating serum samples from individuals with documented Campylobacter infection and healthy controls with known anti-Campylobacter IgG reactivity with bacterial suspensions of the following species: C. jejuni, C. coli, C. upsaliensis, C. lari, C. fetus, C. hyointestinalis, Helicobacter pylori, Legionella pneumophila. After pre-incubation the samples were centrifuged and further tested by ELISA. Results from the inhibition ELISA are expressed as OD values.
Statistical analysis and modelling
Describing the dependencies on age, we attempted to impose small a priori constraints on the shapes of the age dependencies of the serology measurements and Campylobacter incidence by modelling with spline functions [Reference Ramsay15]. Sex and degree of urbanization were added to the model as covariables and as interaction terms with the splines in order to study the age dependency in males and females, and in urban and rural areas. The significance of the contribution of the covariables, splines and interaction terms was tested with the multivariate Wald test [Reference Harrell16]. Using the estimated model parameters, the overall average changes with age in the various subgroups were plotted, together with 90% confidence limits. Informally this allows evaluation of the significance of differences in level between subgroups at different ages, comparable to an α of ~0·05. Calculations were performed in Dyalog APL v. 8.2.5 (Dyalog, UK).
Estimates of the seroprevalence were based on classification of sera into (sero)negatives and (sero)-positives by means of a binary distribution mixture approach [Reference Gilks17]. Observed ratios were log-transformed and a binary mixture of normal distributions was fitted by means of maximum likelihood. In short, the serological sample can be classified into two subclasses (labelled positive and negative). Either subclass can be described by a lognormal distribution of OD values. The positive subclass has higher OD values than the negative subclass (this is not a real assumption, only a definition to avoid ambiguity in identifying subclasses). Subclasses are independent of age (i.e. age groups may have different numbers of seropositives but the shapes of the positive and negative components are the same). No prior assumptions were made about the means and variances of either distribution. These characteristics were estimated from the observed data, as well as the number in either class – the seroprevalence. Note that this classification method does not assume that any individual in the observed population should have the same threshold (i.e. being classified as seropositive). Rather, any individual observed OD is interpreted as having a probability of being positive that is a function of the observed OD value. Therefore the binary distribution mixture method does not ignore heterogeneity in serological response in individual subjects. In age-stratified samples the seroprevalence (i.e. the number positive) was estimated for each age group while mixture components were kept the same for all ages. Numerical procedures were programmed in Mathematica v. 6.0 (Wolfram Research, USA).
RESULTS
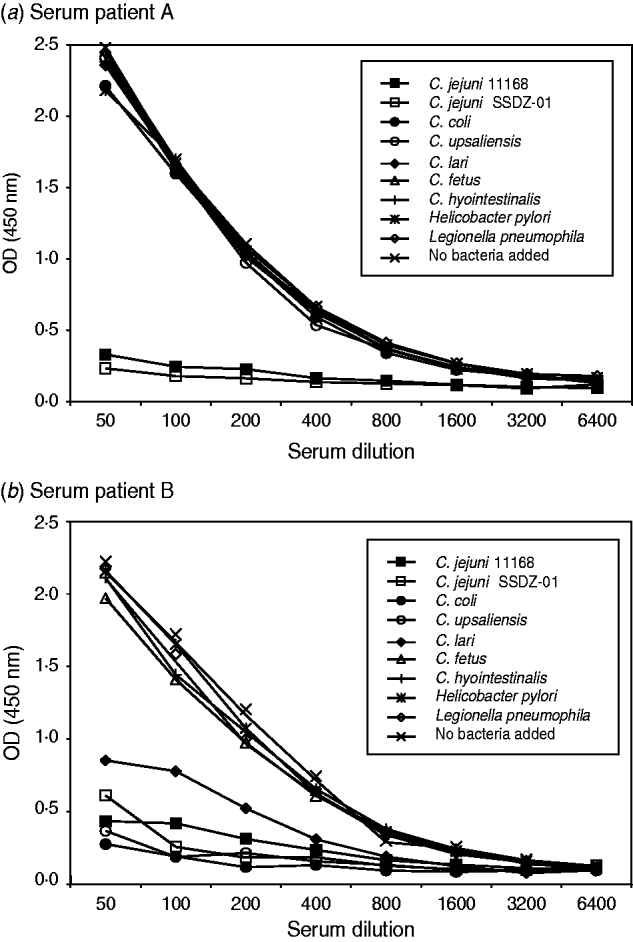
To investigate the specificity of the Campylobacter ELISA we performed inhibition ELISA experiments. We incubated serum samples of known IgG anti-Campylobacter reactivity with bacterial suspensions from various Campylobacter spp. and possible cross-reacting species such as H. pylori and L. pneumophila. During this incubation antibodies directed against the bacteria in the suspension were captured and this led to a decrease in OD value in the Campylobacter ELISA. Two patterns of reactivity were observed. In several serum samples reactivity in the Campylobacter ELISA could only be inhibited by incubation with C. jejuni bacterial suspensions, indicative of specific reactivity to C. jejuni (Fig. 1 a). Other samples had a broader pattern of reactivity. In those samples reactivity in the ELISA could also be decreased by C. coli, C. lari and C. upsaliensis (Fig. 1 b). There was no significant reduction in anti-Campylobacter reactivity following incubation with non-thermophilic Campylobacter spp. such as C. fetus and C. hyointestinalis, and H. pylori or L. pneumophila. Together, these results demonstrate that our ELISA system can specifically detect antibody reactivity against thermophilic Campylobacter spp.

Fig. 1. Specificity of Campylobacter IgG reactivity. Serum from seropositive individuals was incubated with bacterial suspensions before testing for IgG antibodies with C. jejuni as antigen source. (a) Anti-C. jejuni reactivity could be reduced by incubation with C. jejuni suspensions only, or (b) from suspensions with thermophilic Campylobacter spp., but not with suspensions of non-thermophilic Campylobacter spp., Helicobacter pylori or Legionella pneumophila. OD, Optical density.
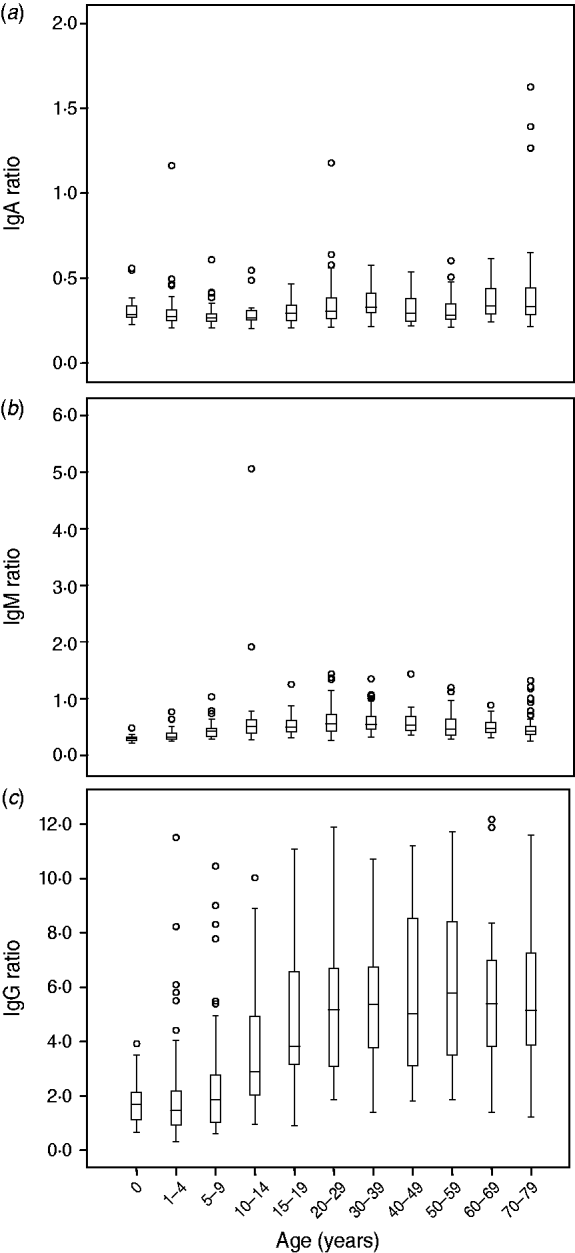
For all three isotypes IgA, IgM and IgG we investigated the relationship between age, sex, urbanization, and reactivity to Campylobacter. IgA ratios gradually increase with age although the ratios remain low (Fig. 2 a). No significant differences were shown with regard to sex. The degree of urbanization contributes significantly to the model (P<0·01), slightly higher anti-Campylobacter IgA levels were found in rural areas. For IgM, we observed a significant gradual increase in level of IgM antibodies from 0 years to 10–30 years, with a slight decrease observed thereafter (Fig. 2 b). No significant differences in IgM ratios were seen with regard to sex. The degree of urbanization slightly contributed to the model (P<0·05) but not in a clear age-dependent manner.

Fig. 2. Levels of IgA, IgM and IgG anti-Campylobacter antibodies per age group. Anti-Campylobacter antibody levels are expressed as ratios.
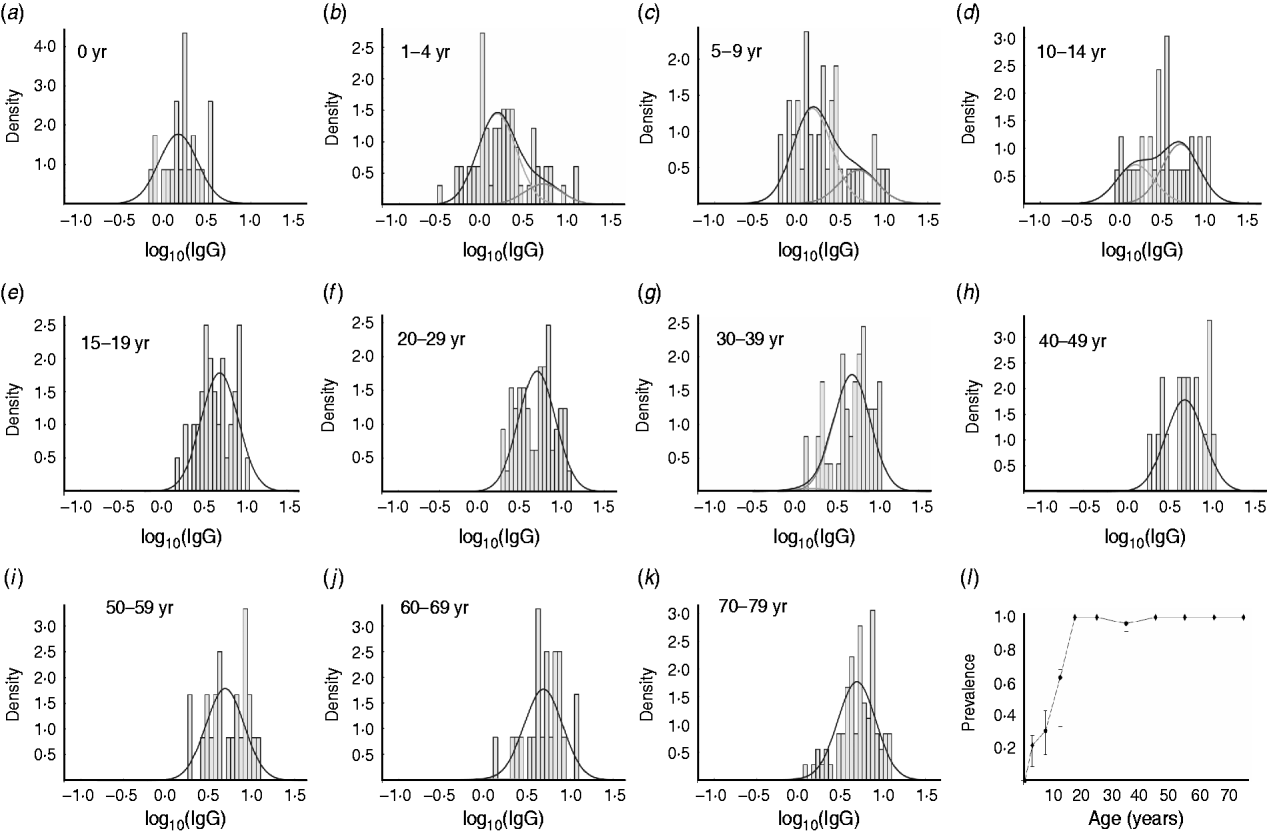
In the analysis of the data for IgG we used a binary mixture model. From Figure 3 a–k, it can be deduced that with increasing age, the number of seropositive individuals within each age group increases correspondingly. In the 15–19 years age group almost all individuals are seropositive. The number of seropositive individuals within each age group is also shown in Figure 3 l. This figure clearly shows the increase in seroprevalence during childhood and adolescence. There is an increase with age in both the number of seropositive individuals in any age group, and the mean levels of anti-Campylobacter IgG antibodies (Fig. 2 c).

Fig. 3. Frequency distribution of anti-Campylobacter IgG ratios in sera from different age groups and fitted components of binary mixture. (a–k) Distribution per age group. The line (—) in each figure indicates the distribution of the total group of sera, whereas the histograms indicate the distribution of each component. In (a), all individuals are in the component with lower IgG level (‘seronegative’) and in each consecutive panel, the number of individuals in the component with the higher IgG level (‘seropositive’) increases. (l) Estimated prevalence (number ‘seropositive’) for each age group.
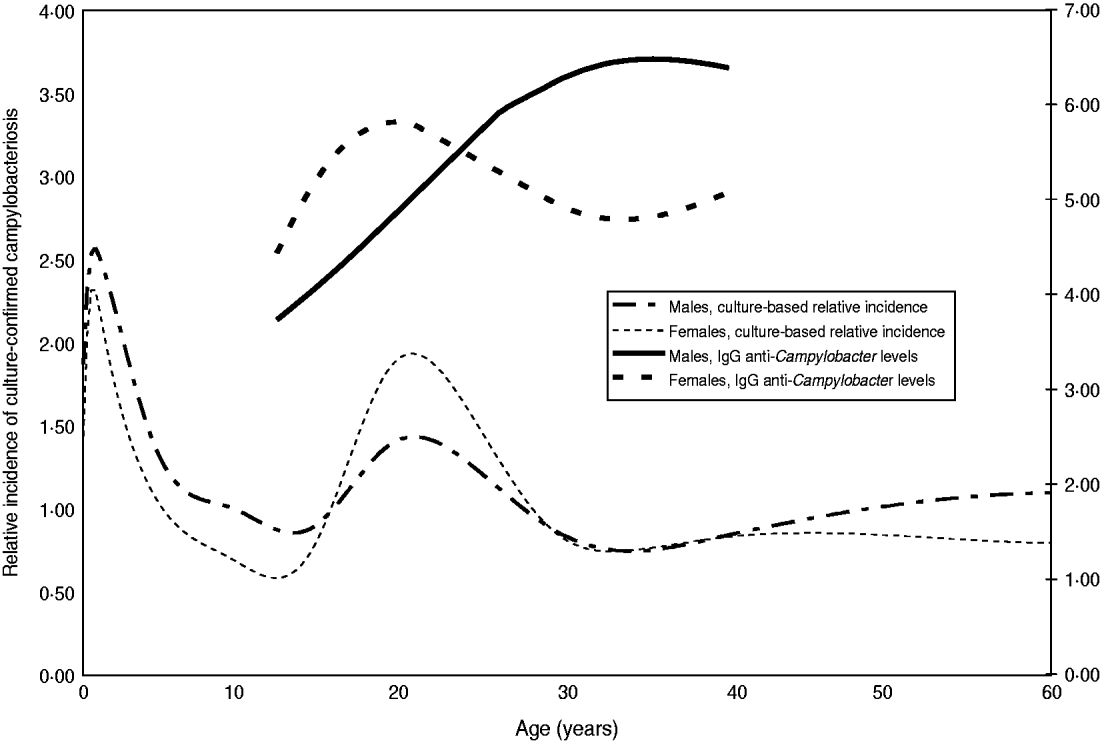
The relationship between IgG antibody levels and sex and age showed several interesting patterns. The age-related increase of IgG is faster in girls than in boys up to age 20 years at which point it does not increase further. In males IgG ratios increase until about age 35 years and at that age it is significantly higher in males than in females (Fig. 4). For females, this serological pattern parallels the incidence of culture-confirmed symptomatic Campylobacter infections in The Netherlands. Males are clearly slower in reaching their maximum anti-Campylobacter IgG levels. Above the age of 60 years the levels decrease in males while in females they become higher again. In age groups <25 years we observed higher levels of anti-Campylobacter IgG in individuals living in urbanized regions corresponding with a higher incidence (data not shown).

Fig. 4. Estimated levels of anti-Campylobacter IgG per age group according to sex, compared with culture-based relative incidence. The estimated age distribution of laboratory-confirmed Campylobacter infections in The Netherlands (2003–2006) is plotted for males and females for an average degree of urbanization. The 90% confidence interval is very small and has been omitted. Similarly the fitted average levels have been plotted for the IgG ratio. For the IgG ratio only the age trajectories were plotted that comprise significant differences between males and females, i.e. where the 90% CI (not plotted) did not overlap (12–20 years and 28–40 years).
DISCUSSION
Using a highly specific ELISA for detection of antibodies against thermophilic Campylobacter spp., we found that the seroprevalence for Campylobacter spp. in The Netherlands shows a linear increase during childhood reaching 100% in young adulthood. Our inhibition ELISA experiments demonstrate the specificity of our assay for detecting antibodies against thermophilic Campylobacter spp. The assay not only detects antibodies against C. jejuni, but is also capable of detecting antibodies directed against other diarrhoea-causing Campylobacter spp. The lack of inhibition by incubation with H. pylori, L. pneumophila and non-thermophilic Campylobacter spp. convincingly demonstrates that the measured antibody levels are not caused by cross-reactive or specific reactivity but truly represent antibody reactivity against diarrhoea-causing Campylobacter spp.
The binary mixture approach is methodologically attractive. Using this method, it is not necessary to define a cut-off for seronegativity. In many cases, this is theoretically impossible because it can never be stated with certainty that an individual has never had any contact with a pathogen. Furthermore, binary mixture modelling of serological data acknowledges the heterogeneity of the immune response. Most serological tests can be validated for detecting a recent infection, but the binary mixture approach also allows epidemiological studies based on the same serological assays. It is important to bear in mind that cut-off levels for seropositivity intended for detecting a recent acute infection can not be used for epidemiological purposes.
Comparing incidences of gastrointestinal infections based on culture-based surveillance is highly dependent on the organization of the healthcare system. Seroepidemiology in a general population sample eliminates this potential source of bias. In the current study, we tested a random sample of the Dutch population derived from the PIENTER database, which allowed us to draw conclusions at the national level [Reference De Melker and Conyn-van Spaendonck12]. A potential limitation of this approach is that national serum collections representing the whole population are only available on a very limited scale. This will hamper the widespread use of this relatively easy method to perform epidemiological studies. We have found similar results using serum samples from hospital serum collections (C. W. Ang, unpublished observations). The selection of samples will be facilitated by this finding. Another problem using serological assays to predict infection rates is inter-laboratory variation, even when using the same assay. Therefore, rigorous validation of tests is needed before drawing any conclusions. Alternatively, all samples should be tested at a single laboratory. When these prerequisites are met, the use of seroepidemiology will allow for direct comparison of the infection pressure between different countries or regions [Reference Simonsen18].
Comparison of our findings with other studies is not straightforward because it is the first of its design. Belongia et al. tested serum samples from rural and non-rural children in the USA [Reference Belongia10]. Seropositivity was defined as a ‘positive test in 2 or more immunoglobulin classes’, where positive was higher than the mean+2 s.e. of a reference population [Reference Blaser and Duncan19]. Despite their very high cut-off levels for a presumably symptom-free population, they found a gradual increase in seropositivity ranging from 30–40% in 1- to 4-year-olds to 60–85% in 15- to 18-year-olds. In a Danish study, observed percentages were much lower, up to 32% in adults, but this may be due to different criteria for seropositivity [Reference Linneberg11]. Therefore, despite different approaches, both studies found the same pattern of age-dependent increase of seropositivity in industrialized countries.
In developing countries, the same pattern can be observed although the kinetics of becoming seropositive may be increased. In Africa and South America, there was a gradual increase in total anti-Campylobacter immunoglobulin levels in children followed up during the first 2 years of life [Reference Martin20, Reference Figueroa21]. In Bangladesh, children acquired IgA, IgM and IgG antibodies against Campylobacter early in life, with a fall in IgG levels after the age of 5 years [Reference Blaser22].
The most surprising finding is the almost linear increase in IgG seroprevalence during childhood and adolescence. At age 20 years, almost all individuals are seropositive. This implies an average yearly increase of about 5%. It is difficult to provide accurate estimates on the number of infections and re-infections because there are very limited data on immune responses following Campylobacter infections in children in industrialized countries. In adults, the half-life of Campylobacter IgG has been estimated to be around 2 years (P. F. M. Teunis et al., unpublished observations) and it would therefore be unrealistic to assume that individuals remain seropositive for life. Combined with the observations that in adults anti-Campylobacter IgG levels remain high and re-infection in already seropositive individuals does occur [Reference Baqar23], the yearly infection rate is likely to be >5%.
The increase in seroprevalence with age, in combination with an increase in level of IgG response is indicative of repeated infections with Campylobacter, leading to an antibody response. Based on the incidence of symptomatic Campylobacter infections, the majority of these infections are asymptomatic. The possibility remains that the immune system is boosted by dead bacteria in food or fomites. However, living bacteria give much stronger stimulation to the immune system and more severe forms of Campylobacter enteritis elicit a stronger humoral immune response [Reference Rollwagen24].
It remains unclear whether the measured immunoglobulin levels can be interpreted as a measure of protection against a symptomatic course of the infection. Well documented cases of re-infection despite pre-existing antibody levels have been described [Reference Baqar23]. Our data on the influence of sex and urbanization on antibody levels demonstrate several differences with regard to both parameters. However, they can not be interpreted easily and there is only limited agreement between data derived from culture-based surveillance systems and our serological studies. We were unable to reproduce the findings of Belongia et al. with regard to higher anti-Campylobacter antibody levels in rural children [Reference Belongia10]. In contrast, in The Netherlands, individuals living in urbanized regions have higher anti-Campylobacter levels compared to the rural population. These inconsistencies may also depend on different local conditions and definitions of ‘rural’ vs. ‘urban’ between countries.
In conclusion, this seroepidemiological study indicates that almost all individuals in The Netherlands have multiple Campylobacter contacts leading to an antibody response during their lives. Most of these immune response-eliciting events pass with no, or only mild, gastrointestinal symptoms.
ACKNOWLEDGEMENTS
The authors thank Mrs Marijke Maas and Mr Milton Gilbert for excellent technical assistance.
DECLARATION OF INTEREST
None.


