INTRODUCTION
Salmonella is an important zoonotic pathogen linked with serious animal and human disease. In animals, Salmonella infections can be responsible for chronic diarrhoea with associated weight loss and poor production, as well as abortion and in severe cases death. It is one of the most common causes of foodborne infections in man [Reference Plym Forshell and Wierup1] and non-typhoidal Salmonella accounts for an estimated 1·4 million infections annually in the USA with 15 000 hospitalizations and 400 deaths in 2001 [Reference Mead2, Reference Voetsch3]. There were also 155 540 confirmed cases of human salmonellosis reported in the European Union in 2007 [Reference Lahuerta, Helwigh and Makela4]. Salmonella enterica subsp. enterica, which contains over 2500 serovars [Reference Popoff, Bockemühl and Gheesling5], is responsible for the majority of infections.
Epidemic serovar strains have emerged in different host species, regions and at different times. During the 1980s and 1990s S. Typhimurium DT104, associated with a multidrug resistance (MDR), emerged in cattle. During the same period, S. Enteritidis phage type (PT)4 and related types emerged in poultry. In the UK S. Enteritidis and S. Typhimurium accounted for over 66% of human isolations [6] and are the prevalent causes of human inflammatory gastroenteritis [Reference Rodrigue, Tauxe and Rowe7]. MDR S. Newport has emerged as a problem serovar in cattle and humans in the USA [Reference Gupta8], whereas in the UK this serovar does not express resistance to antibiotics and is associated with tenfold less human infections [Reference Lahuerta, Helwigh and Makela4, 9]. S. Dublin is the most common serotype associated with abortion in cattle, and has been consistently the most prevalent serovar in cattle in the UK [10] but is not associated with severe human infections.
During Salmonella outbreaks it is important to undertake epidemiological tracing, for which a number of molecular techniques such as random amplification of polymorphic DNA (RAPD), pulsed-field gel electrophoresis (PFGE), and multi-locus sequence typing (MLST) are available (for review see [Reference Karama and Gyles11]). Of these PFGE is the most commonly used, sorting strains by the size and banding patterns of the total genomic content after digestion of genomic DNA with infrequent cutting restriction endonucleases. PFGE can indicate acquisition or loss, but not location, of large genomic fragments by fragment size analyses [Reference Ribot12].
A more research-oriented molecular method is comparative genomic hybridization (CGH) using microarrays. This has become a powerful tool for the interrogation of differences between closely related bacterial species. Salmonella has been a target for CGH microarray [Reference Porwollik13, Reference Chan14] with comparisons made both between subspecies and within them. These studies have led to the identification of the core and variable components of S. enterica subspecies I [Reference Anjum15]. However, the outputs of the array data are limited by the genes printed on the array such that novel genes cannot be detected nor can genomic rearrangements be identified [Reference Anjum15].
A limitation of all currently used methods for typing, including CGH array approaches, is the inability to identify accurately major alterations to the genome such as deletions, insertions, inversions or other rearrangements that may be intimately associated with the emergence of a particular bacterial strain. While next-generation whole-genome sequencing is becoming readily available, it is currently not practical to use this technology to screen emergent strains routinely.
In this study we wished to assess a novel technology, optical genetic mapping, that generates a physical map of the bacterial chromosome for the comparison of pre-epidemic and epidemic strains of Salmonella. This method has the capacity to combine greater resolution, positional information and the identification of novel insertions to an extent that is lacking in PFGE and CGH. In brief, specific restriction endonucleases cut the DNA of a bacterium that has been immobilized on a derivatized glass slide. The restriction fragments are fluorescently labelled in situ which are then visualized and photographed. The mass of each fragment is determined by the intensity of fluorescence and partial genome maps are developed. These are assembled by overlapping segments into a genome optical map using alignment software [Reference Lim16].
In the current study we selected strains of interest from the four serovars Typhimurium, Newport, Enteritidis, and Dublin to be screened by the optical mapping technique. For S. Typhimurium these spanned the period of the epidemic for phage-type DT104 and had variant resistance profiles from before, during and after the epidemic period. The S. Enteritidis isolate chosen had a phage type (PT11) that is less frequently associated with human disease than other phage types such as PT4 which is commonly associated with human disease. Representative UK and USA S. Newport strains were chosen to compare geographical variation within the same serovar. Finally recent S. Dublin strains isolated from cattle showing clinical symptoms were chosen to monitor an outbreak in progress.
METHOD
Bacterial strains
Sources of the Salmonella enterica strains used in this study are listed in Table 1. In-silico maps of those sequenced: S. Dublin CT_02021853 (GenBank CP001144.1), S. Enteritidis P125109 (GenBank AM933172), S. Typhimurium NCTC13348 (Sanger Institute) [Reference Dougan, Barrow and Achtman17], S. Typhimurium LT2 (GenBank AE006468), S. Newport SL254 (GenBank CP001113), S. Gallinarum 287/91 (GenBank AM933173), S. Agona SL483 (GenBank CP001138), S. Paratyphi B (GenBank CP000886), S. Schwarzengrund CVM19633 (GenBank CP001127), S. Choleraesuis SC-B67 (GenBank AE017220), S. Heidelberg SL476 (GenBank CP001120), S. Paratyphi A AKU_12601 (GenBank FM200053), S. Paratyphi A ATCC9150 (GenBank CP000026), S. Typhi CT18 (GenBank AL513382), S. Typhi Ty2 (GenBank AE014613), S. enterica sbsp. arizonae 62:z4,z23:– (GenBank CP000880), were used as reference mapped strains.
Table 1. Strain list
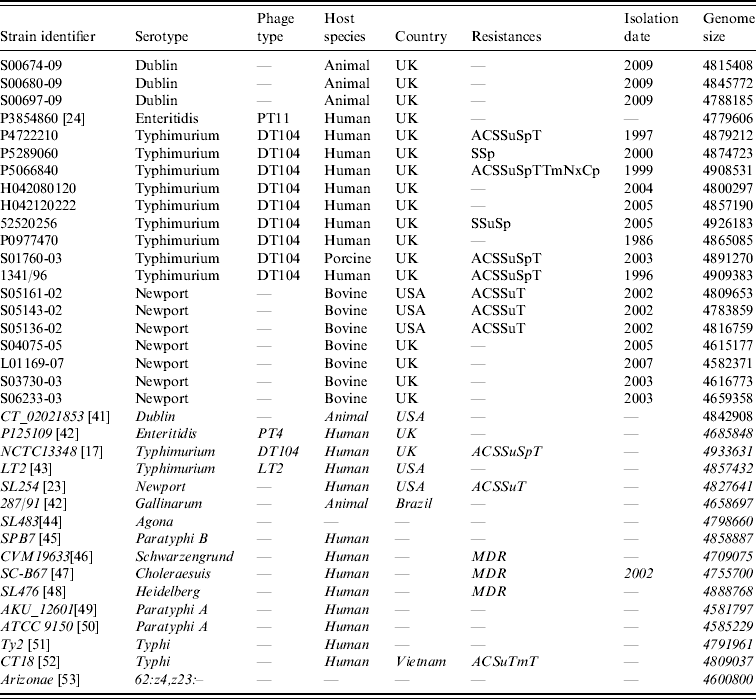
Strains in italics have been genome sequenced and the sequences were used to derive in silico optical genetic maps.
Optical mapping
Optical maps were prepared by OpGen (USA) following the method presented in Zhou et al. [Reference Zhou18]. In brief, following gentle lysis and dilution, high-molecular-mass genomic DNA molecules were spread and immobilized onto derivatized glass slides and digested with NcoI. The DNA digests were stained with YOYO01 fluorescent dye, and photographed using a fluorescent microscope interfaced with a digital camera. Automated image-analysis software located and sized fragments, and assembled multiple scans into whole-chromosome optical maps.
RESULTS
Genome alignment relationships
The OpGen MapSolver software was used to create an unweighted pair group method with arithmetic mean (UPGMA) to create a phylogenetic tree of the optical maps from the available in-silco Salmonella sequences and those generated from the 20 test strains (Fig. 1). The clustering predominantly grouped the test strains with their respective ‘control’ sequenced strains. The sequenced S. Dublin and three S. Dublin test strains showed the least variation, with 0·3% difference within the group. The nine S. Typhimurium DT104 test strains showed little variation also with 0·8% difference within the group regardless of resistance profile. The exception to this is strain H042080120, which is an atypical sensitive DT104 and groups closer to the LT2 strain. The seven S. Newport test strains clustered into two groups which will be discussed below. The S. Enteritidis test PT11 strain P3854860 clustered closer to the S. Dublin strains than to the control S. Enteritidis PT4 strain P125109, which was closer to the sequenced Gallinarum strain with a 1·8% difference.
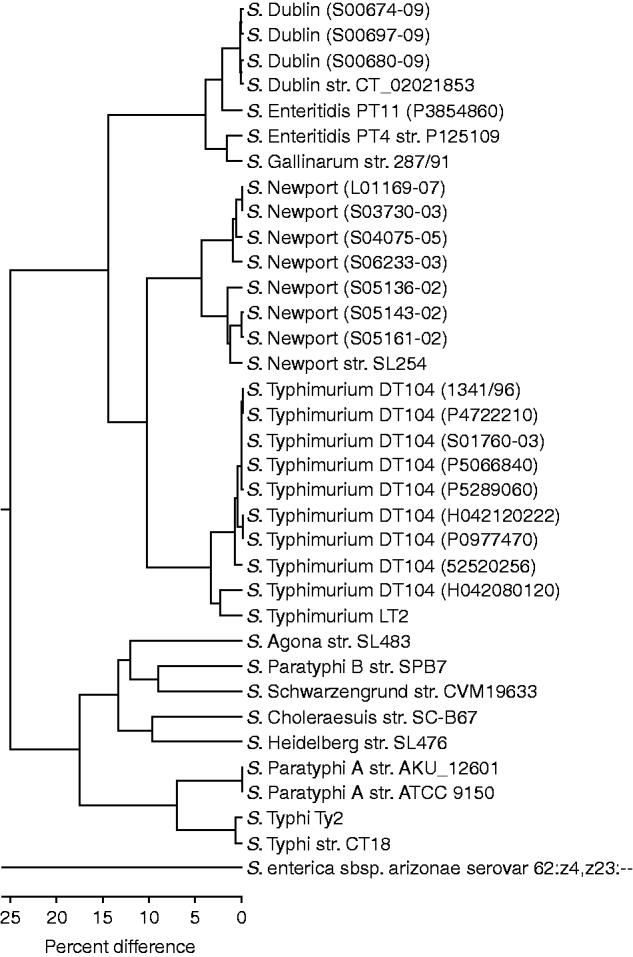
Fig. 1. UPGMA clustering of in-silco optical maps and 20 test strains. Strains grouping close to their sequenced reference strain are shown (note the distance between S. arizonae and the other Salmonella strains is 93·7%).
S. enterica subsp. arizonae (subsp. IIIa) serovar 62:z4,z23:-- showed 93·7% divergence from the serovars from subsp. I. The branch with serovars Agona, Choleraesuis, Heidelberg, Paratyphi A, Paratyphi B, Schwarzengrund, Typhi showed 25% divergence form that branch containing Dublin, Enteritidis, Gallinarum, Newport, and Typhimurium.
The in-silico optical maps of the sequenced S. Typhimurium LT2 and MDR DT104 were compared (Fig. 2). The regions identified as mobile elements and their genomic coordinates for LT2 by Hermans et al. [Reference Hermans19] and for DT104 by Cooke et al. [Reference Cooke20], are highlighted. The variation between the strains is predominantly in these regions associated with mobile elements, notably prophages. S. Typhimurium LT2 contains the regions of the bacteriophages Fels-1 and Fels-2 that are absent from DT104. Fels-1 has been shown to contain the genes sodCIII (superoxide dismutase), nanH (neuraminidase) and grvA. DT104 contains prophage 1 (ST104), prophage 3, prophage 4 and the Salmonella Genomic Island 1 (SGI1) that are absent from the LT2 strain. This later region contains the genes that confer antibiotic resistance to DT104 strains [Reference Boyd21]. Both strains show the presence of Gifsy-1 and Gifsy-2, two lambda-like phages that have been associated with virulence [Reference Brüssow, Canchaya and Hardt22].
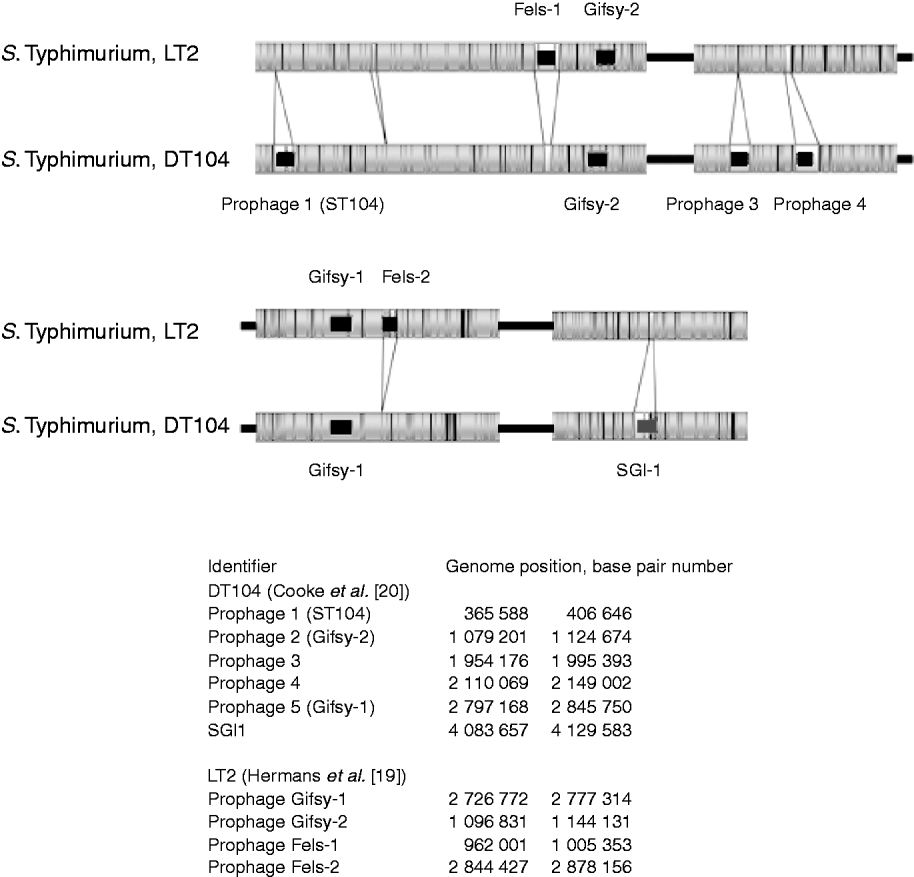
Fig. 2. Comparison of optical maps of sequenced Salmonella enterica subsp. enterica serovar Typhimurium strains LT2 and DT104. Prophage regions identified by Hermans et al. [Reference Hermans19] and Cooke et al. [Reference Cooke20] highlighted in black, the Salmonella Genomic Island 1 (SGI1) containing MDR genes, in dark grey. Genomic location of prophages listed in the bottom part of the figure. The figure shows that the majority of variance between strains is due to prophage regions.
Variation within the S. Typhimurium test strains
The upper part of Figure 3 shows regions of variation between the S. Typhimurium test strain 52520256 and the sequenced DT104. A 40-kb insert downstream from prophage 5 was identified, that is absent from the sequenced strain. This insert is located upstream of genes related to purine metabolism (purM and purN) and ppk (polyphosphate kinase) and downstream of guaB (inositol-5-monophosphate dehydrogenase).
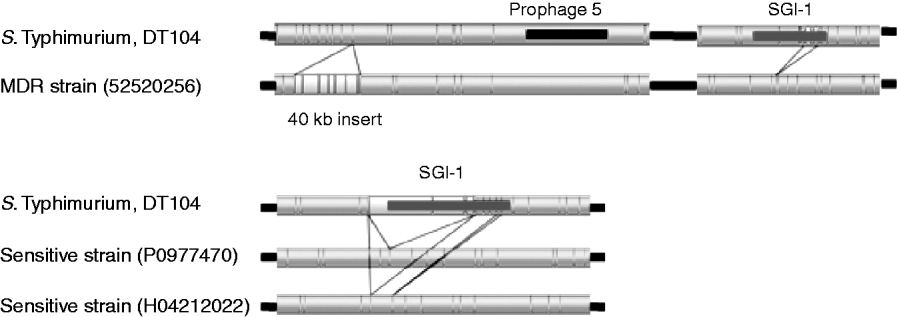
Fig. 3. Comparison of sequenced DT104 strain to three DT104 field isolates. Resistant strain 52520256 shows a 40-kB insert downstream of prophage 5 and a variant SGI1 region with part of the region missing. Two sensitive strains P0977470 and H04212022 show the absence of the SGI1 region.
Strains 52520256 (Fig. 3) and P5289060 (not shown) are antibiotic resistant but have different profiles from the penta-resistant profile of the sequenced strain. These differences in resistance profile were visible by optical mapping, with partial deletions in the region of SGI-1 in the test strains, between bases 4115969 and 4124741 for strain 52520256 and between bases 4112582 and 4122042 for strain P5289060. This region encompasses the second ‘resistance cassette’ of the genomic island including, for 52520256, the genes tet(G), groE1/int1, bla PSE-1, qacEΔ1, sul1 and tnpA, and for P5289060 the genes floR, tetR, tet(G), groE1/int1, bla PSE-1 and qacEΔ1 [Reference Boyd21].
The lower part of Figure 3 shows the total absence of the SGI-1 region from two strains, P0977470 and H04212022, both of which are sensitive to the panel of antibiotics that the sequenced strain is resistant to. Aside from the variation in SGI-1, the insertion in 52520256 and the atypical strain H042080120, the optical mapping technique revealed the largely clonal nature of strains from the phage-type DT104.
Variation within the S. Newport test strains
Figure 4 shows the comparison of the optical maps from the sequenced S. Newport strain, a representative USA strain and a representative UK strain. It shows three general regions of divergence and their associated genes obtained from the annotated strain information [Reference Ravel23]. The UK (S04075) strain lacks a portion of the Gifsy-2 phage, a portion of the Gifsy-1 phage and a region associated with the genes cpxR, fieF and sodA.
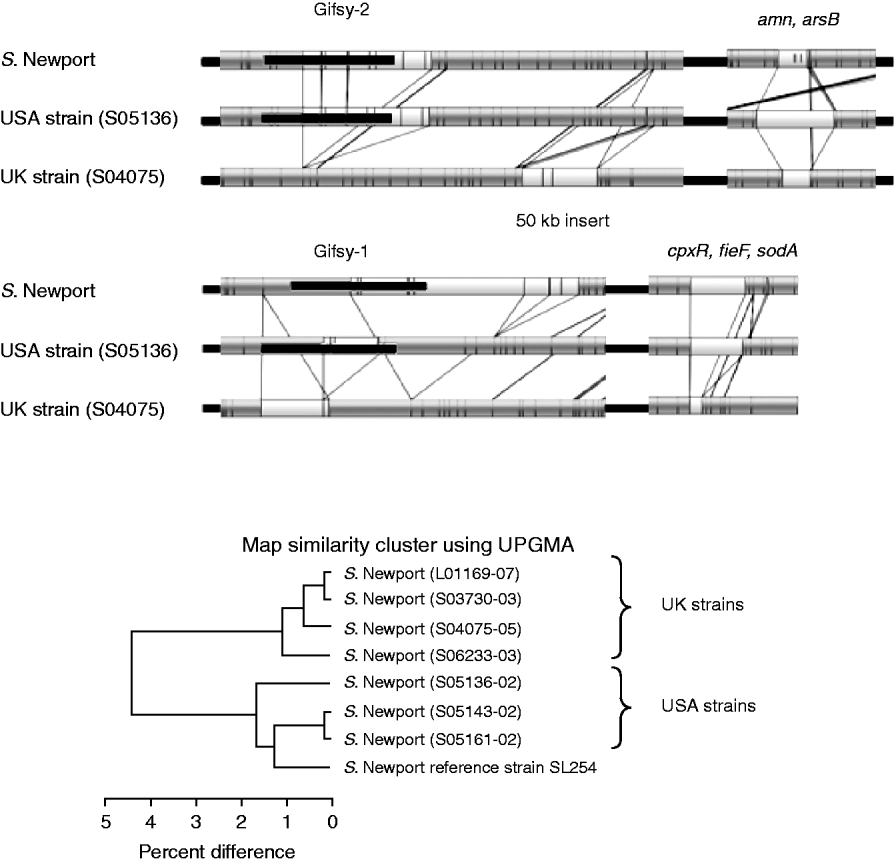
Fig. 4. Top panels: Comparison between optical maps from sequenced S. Newport, strain S05136 (USA) and strain S04075 (UK). The absence of portions of Gifsy-2, Gifsy-1 and genes cpxR, fieF and sodA, from the UK strain is illustrated; also shown is variation in the region around amn and arsB genes. Lower panel: UPGMA clustering of sequenced S. Newport strain with seven field strains. Strains L01169-07, S03730-03, S04075-05 and S06233-03 from the UK. Strains S05136-02, S05143-02 and S05161-02 are like the sequenced strain from the USA. UK and USA strains group into two distinct groups.
Other specific differences are revealed. The UK (S04075) strain also has an additional ~50-kb insert, upstream of Gifsy-2, that is absent from the sequenced and USA strain. The same strain, as well as the UK strain S03730-03, has a further ~40-kb insert downstream of the location of Gifsy-1. There are also variations for the USA test strain (S05136) compared to the sequenced and UK strain in a region associated with the genes amn and arsB.
The general variation between UK and USA strains is shown by UPGMA clustering in the lower part of Figure 4. It shows that there is a clear geographical grouping to the strains, with the four UK strains (on top) grouping away from the USA strains and the sequenced strain, which also had a USA origin.
Variation between the S. Enteritidis test strains and sequenced PT4
Figure 5 shows the comparison between the sequenced S. Enteritidis strain, which is from PT4, and the test strain which is PT11. The optical maps show that there are several insertions in the PT11 genome which are absent from PT4. These insertions contribute to the fact that the PT11 genome is around 100 kb greater than the PT4 genome [Reference Pan24]. The UPGMA clustering, in the lower part of Figure 5, shows that PT11 groups closer to the S. Dublin sequenced and test strains than to the sequenced S. Enteritidis PT4 strain. The PT4 strain grouped closer to S. Gallinarum.
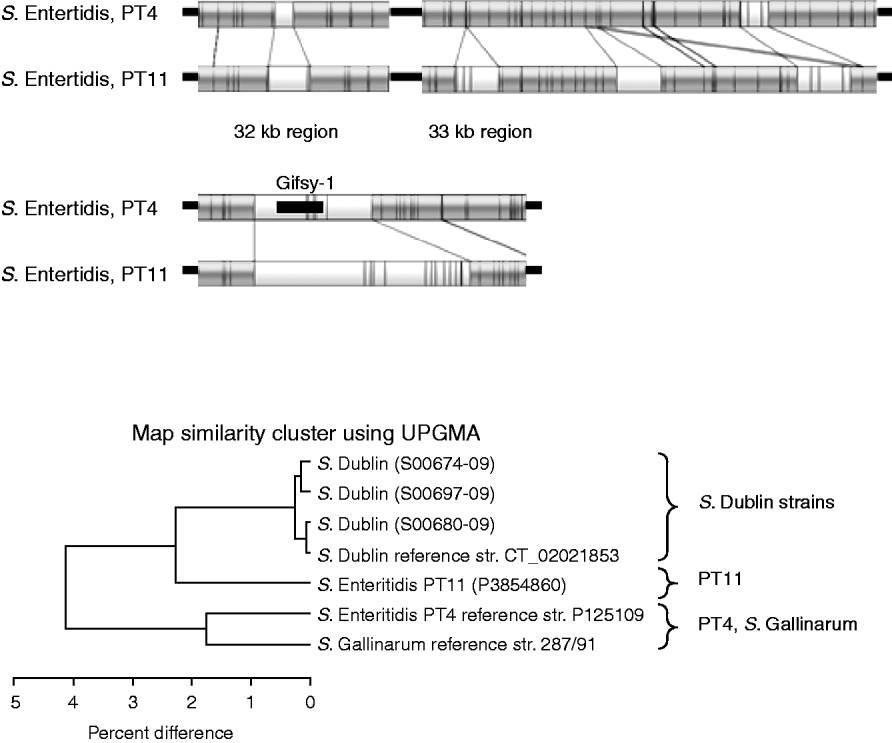
Fig. 5. Top panels: Comparison of optical maps of sequenced S. Enteritidis PT4 and strain P3854860 (PT11). Additional regions present in PT11 strain, including around Gifsy-1 phage are illustrated. Lower panel: UPGMA clustering of S. Enteritidis strains with sequenced S. Gallinarum and the four S. Dublin strains. The PT11 strain is more similar to the S. Dublin strains than to the PT4 strain.
DISCUSSION
The optical mapping technique has been used to compare representative strains from four serovars of epidemiological interest to the in-silico maps produced from the available sequenced strains. The technique has the advantage of allowing a greater degree of discrimination between strains, and to identify novel insertion regions as well as providing a backbone for sequencing projects.
With the serovar Typhimurium the technique was able to discriminate between multidrug resistant and sensitive strains, to the degree that it could distinguish the strains with variant Salmonella Genomic Islands. Since the composition of the classical S. Typhimurium DT104 SGI1 has been described [Reference Boyd21] other examples with different resistance profiles have been identified. Variants SGI-A to SGI-O have been described in Typhimurium and also in Proteus mirabilis, and a variant genomic island with a different lineage, termed SGI2 has also been described [Reference Boyd25–Reference Mulvey27]. In addition, a secondary attachment for SGI1 has been discovered via R1 plasmid-mediated transformation with S. Typhimurium LT2. This is located in the intergenic region between the chromosomal sodB and purR genes [Reference Doublet28]. The ability of optical mapping to quickly identify variation in SGI1-related regions demonstrates its ability to monitor the evolving nature of chromosomally based antibiotic resistance.
A 40-kb insert was identified in UK strain 52520256, between the genes ppk and guaB. The gene ppk codes for a polyphosphate kinase and the disruption of its transcription may have implications for the fitness of the strain; ppk mutants have been shown to have reduced survival and sensitivity to weak organic acids [Reference Brown and Kornberg29, Reference Price-Carter30]. Polyphosphate is synthesized in response to high salt levels, nitrogen limitation and amino-acid starvation. Polyphosphate also stimulates ATP-dependent proteolysis of certain ribosomal proteins after a shift from a rich to minimal media [Reference Kuroda31]. Phenotypic screening of strain 52520256 through the Phenotypic MicroArray (Biolog, USA) system revealed a dysfunctional metabolism for the majority of sole nitrogen and phosphate sources (data not shown) and this may be due to the interference with ppk by the genomic insertion. This is a topic for future study. The importance of identifying and assessing the impact of such insertions on metabolism is important when considering epidemicity. Such regions could subsequently be the target of sequencing and allow the progression of bacterial pathogenicity to be monitored.
The technique also confirmed that the variation between DT104 and LT2 lies in the previously reported phage regions [Reference Hermans19, Reference Cooke20] and this is suggestive of their role in the evolution of bacterial pathogens by the horizontal gene transfer facilitated by mobile genetic elements. Fels-1 and Fels-2 are absent from DT104 and prophages 1 (ST104), 3, 4 and SGI1 are absent from LT2. Fels-1 contains sodCIII, a superoxide dismutase and nanH, a neuraminidase, and its presence has been suggested as a factor for increasing virulence [Reference Jermyn and Boyd32, Reference Figueroa-Bossi33].
Optical mapping allowed the differentiation between S. Newport strains from UK and USA origin and flagged up regions of difference that may have been missed by more conventional techniques. In the case of USA MDR Newport strains the resistance profile is given by a plasmid (of around 150 kb) which is missing in the UK strains [Reference Wu34]. The reasons why this plasmid is only present in strains with a USA origin is not known; however, the variations in phage may be of some importance. Currently the optical mapping technique in unable to detect, interrogate and compare plasmids as their genome size is too small. Therefore other techniques should be used in conjunction with the method when considering the impact of plasmids on epidemicity, antibiotic resistance and virulence.
The UK strains lack some of the Gifsy-1 and -2 phage regions. Gifsy-2 has been shown to contain genes involved in Salmonella virulence in mice. SseI codes for a type III effector protein, sodC-1 for a superoxide dismutase and the gene gtgE which has also been associated with virulence [Reference Brüssow, Canchaya and Hardt22]. Curing S. Typhimurium of Gifsy-2 has been shown to reduce the ability of the bacteria to cause systemic disease in mice [Reference Figueroa-Bossi and Bossi35].
In addition the USA strains are shown to have a region containing the genes sodA, fieF and cpxR. The sodA gene encodes superoxide dismutase, fieF encodes a cation efflux pump and cpxR (with cpxA, a membrane sensor), makes up a two-component regulatory system which has been implicated in response to osmolarity in E. coli [Reference Jubelin36], porin expression in antibiotic resistance [Reference Sun37] and virulence in Typhimurium [Reference Humphreys38]. The presence of the additional superoxide dismutases, sodA and sodC-1, may confer a greater ability for the strains from the USA lineage to survive in the intracellular environment of the host, as they provide protection against the oxidative burst of host cell defences. There was also variation around genes amn and arsB codes for a arsenical resistance protein [Reference Carlin39].
The presence in the USA strains of regions and genes associated with intracellular survival and increased pathogenicity may go some way to explaining their greater prevalence in cases of salmonellosis.
Recent studies by Pan et al. [Reference Pan24] showed by MLST, CGH and various phenotypic analyses that S. Enteritidis PT11 possibly belongs to a distinct clonal lineage compared to S. Enteritidis phage types 4, 8, 9a, and 13. These four phage types are prevalent in terms of human and poultry isolations [10] and appear to be closely related [Reference Lan, Reeves and Octavia40]. It is possibly significant that the one representative PT11 selected for study showed a distinct optical genetic map and was more closely related to S. Dublin than the sequenced PT4. Given this data, this PT11 strain has been selected for full genome sequencing (Hayward et al., unpublished observations).
The S. Dublin strains that were mapped showed a large degree of homogeneity, both between themselves and when compared to the sequenced strain. The test strains had a UK origin while the sequenced strain came from the USA. This lack of variation shows that the serovar displays a level of genetic stability, and is perhaps indicative of the level of its adaptation to and success within its bovine host environment.
Overall the optical mapping of serovars from S. enterica subsp. enterica has demonstrated the usefulness of this technique when considering strains with animal and human health implications. It allows the presence of novel insertions and genomic rearrangements to be detected. It can also distinguish variations in genomic islands that can be connected to a change in resistance profiles. When used in conjunction with a backbone of a previously sequenced strain it can allow the monitoring of phage content and therefore the possible acquisition of pathogenic determinants. The greater level of discrimination over more traditional typing and research methods makes this an important addition to the arsenal of tools available to the microbiologist.
ACKNOWLEDGEMENTS
Funding for this work was from the Food and Farming Group of Defra through project OZ0324.
DECLARATION OF INTEREST
None.


