INTRODUCTION
Healthcare workers (HCWs) have an increased risk of contracting bloodborne virus diseases. The World Health Organization (WHO) estimated that in 2000, 16000 hepatitis C (HCV), 66 000 hepatitis B (HBV), and 1000 human immunodeficiency virus (HIV) infections occurred worldwide in HCWs due to their occupational exposure to percutaneous injuries [Reference Prüss-Üstün, Rapiti and Hutin1]. Needlestick injury (NSI) can have serious economic and psychological consequences as there are high costs for health systems and society, and emotional impact can be severe and long lasting even when a serious infection is not transmitted.
In Singapore, a retrospective study showed an incidence of 82 injuries in one hospital between 1997 and 2000 [Reference Ng2], and a similar study in another institution in the country reported 347 incidents between 1992 and 1997, giving an incidence rate of 2·2 NSI/100 HCWs per year [Reference Ling, Wee and Chan3]. In the National University Hospital (NUH), a tertiary teaching hospital, the Occupational Health Clinic (OHC) was established in 2013. It manages occupational diseases, staff vaccinations and evaluates staff exposed to infectious diseases in the hospital and promotes safety and health in the workplace. This study attempts to estimate the magnitude of the NSI problem in NUH and provide the baseline for monitoring trends in NSI rates to inform evaluation of needlestick prevention programmes.
METHODS
NSI was defined as puncture wounds resulting from the usage of hypodermic needles, suture needles, blood collection needles, intravenous (IV) cannulas, winged needle IV sets, IV stylets and needle components of IV delivery systems [Reference Seng4].
The study was a non-interventional Quality Improvement Project on management of NSIs in the OHC, approved under the institutional research guidelines. A retrospective cohort review of the NSI cases in NUH was employed to determine the injury rate, causation, and epidemiological profile of NSIs. Anonymized data were collected from the OHC registry log from 1 January to 31 December 2014. All NSI cases were reviewed at the OHC and included walk-in or referred cases from the emergency department or Electronic Hospital Occurrence Reporting system. The latter is an online reporting system where staff can self-report accidents, incidents or near misses.
Descriptive statistics such as frequency, mean, standard deviation, and percentage were used to analyse variables. The location of NSI incident, and occupation of victims were evaluated and incidence rates were calculated per number of employees provided by the Human Resources department. Analysis of the risk of sustaining recurrent NSI according to occupation and location was performed using the Cox proportional hazards model with Firth's penalized likelihood, and expressed as hazard ratios and corresponding 95% confidence intervals (CIs). R statistical software v. 3.03 (R Core Team, R Foundation for Statistical Computing, Austria) was used to perform all statistical analyses.
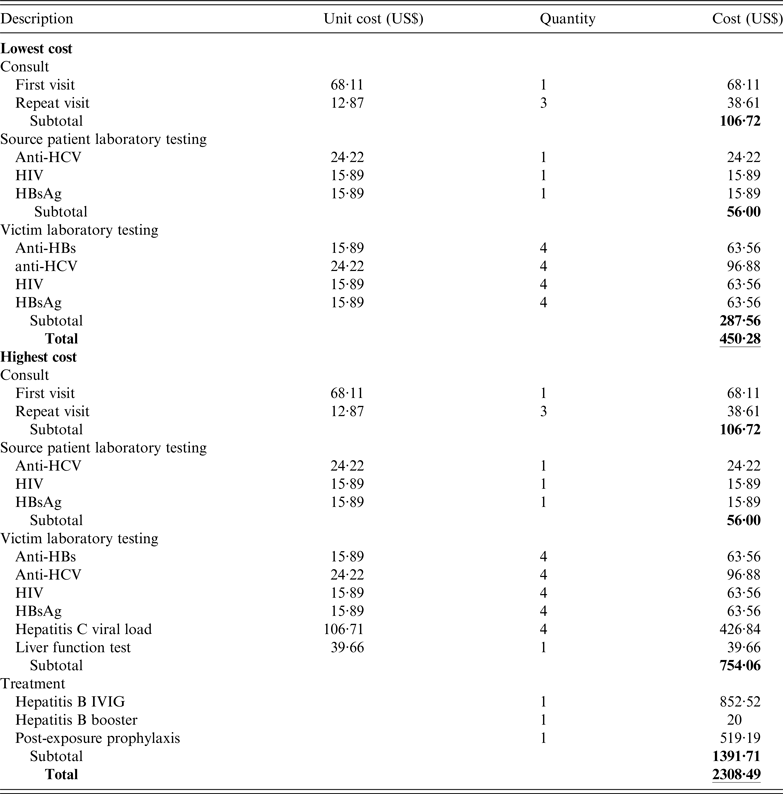
The associated cost of NSIs varies depending on the disease profile of source patients and clinical indications. Costs included consultation charges, laboratory investigations, post-exposure prophylaxis (PEP) and hepatitis B booster vaccinations if necessary. In the event of an incident, screening of blood samples from both injured HCWs and source patients was undertaken, and repeated for HCWs at 1, 3 and 6 months post-incident to check for seroconversion. Investigations included anti-HBs antibody, HBsAg, anti-HCV antibody, HIV antibody, and if necessary, liver function tests and HCV viral load. PEP with antiretroviral drugs and HBV IV immunoglobulin was administered to HCWs where incidents involved high-risk source patients with HIV and HBV, respectively.
The costs were estimated based on the charges in NUH in 2014, and assuming there was no loss to follow up. The lowest estimated cost was based on cases where the source patient was negative for HBV, HCV and HIV testing and highest estimated cost was based on cases where the source patient proved positive for these viruses.
Ethical standards
The authors assert that all procedures contributing to this work complied with the ethical standards of relevant national and institutional committees.
RESULTS
In 2014 there were a total of 244 incident NSI cases in 5957 employees (647 doctors, 3198 nurses, 1044 allied health professionals, 1068 ancillary staff) in NUH. Most injuries were sustained by doctors (56·6%) followed by nurses (34·8%), and the remainder were allied health professionals (4·9%) and ancillary staff (3·7%). The overall incidence of NSI for all staff was 4·1/100 HCWs (95% CI 3·6–4·6) with corresponding rates for doctors and nurses of 21·3 (95% CI 18·2–24·5) and 2·7 (95% CI 2·1–3·2), respectively.
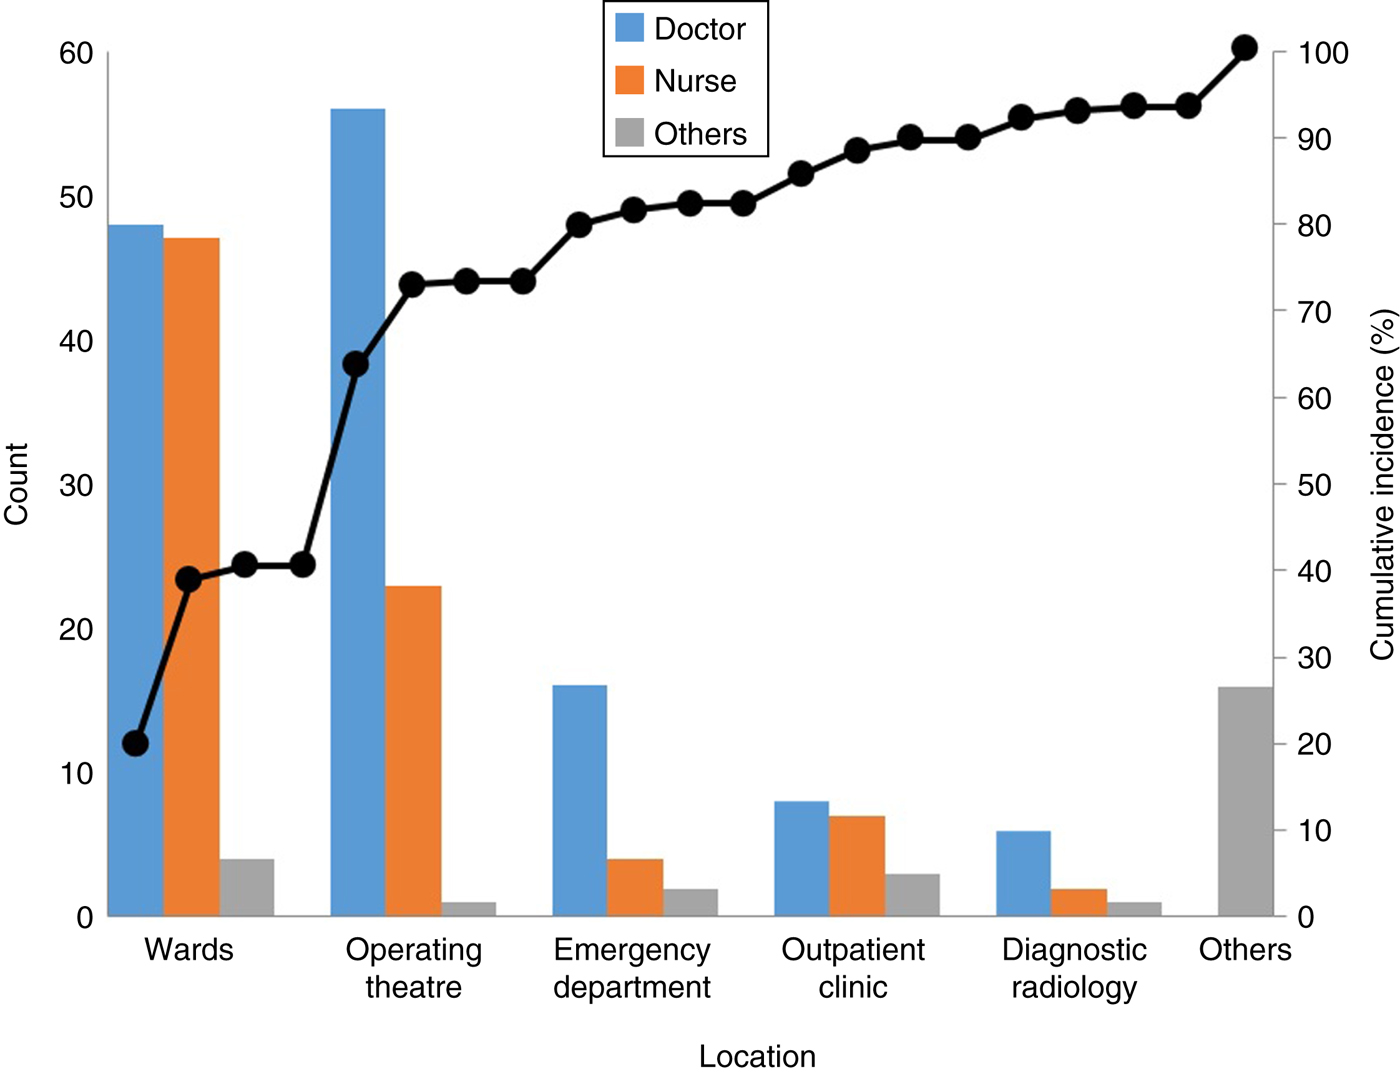
Figure 1 shows that majority of NSI cases occurred in the hospital wards (40%) and operating theatres (33%). Other departments including diagnostic radiology and outpatient clinic accounted for 18% of cases and the remainder (9%) occurred in the emergency department. There were 27 cases of repeated NSIs within individual HCWs. Doctors were 1·62 times (hazard ratio) more likely to have a recurrent injury than nurses (95% CI 0·69–3·83) and recurrent NSIs were 1·21 times more frequent in operating theatre staff compared to ward staff (95% CI 0·46–3·21).

Fig. 1. Location of needlestick injury cases.
There were no cases of occupationally acquired bloodborne virus infection documented during the study period.
Cost estimation
An estimation of the costs associated with NSIs in the survey period is given in Table 1. This ranged from US$450 for cases involving non-seroconverted patients to US$2308 for cases requiring the greatest extended follow up. The corresponding estimated annualized cost range was US$ 109 800 to US$ 563 152 for all 244 NSIs. Other costs such as the emotional burden to HCWs and their families were not quantifiable.
Table 1. Cost estimation

DISCUSSION
The incidence of NSIs in NUH was 4·1/100 HCWs per year in 2014, which was double the rate (2·2 NSI/100 HCWs per year) reported from a previous study in Singapore in 1997 [Reference Ling, Wee and Chan3]. This may be due either to an actual decrease in the numbers of NSI incidents or to increase in reporting as a result of better awareness. In addition to data from incident reports and infection control records as used in the earlier study, our study also included walk-in patients or referred cases from the emergency department. Comparative NSI rates/100 HCWs per year reported from other countries were 4·9 in Thailand [Reference Chaiwarith5], 0·78–5·15 in the UK [Reference Elder and Paterson6] and 9·6 in the United States [Reference Rapiti, Prüss-Üstün and Hutin7]. The WHO has estimated an average of 20–470 NSI/100 HCWs per year [Reference Prüss-Üstün, Rapiti and Hutin8].
We found that more NSIs were sustained by doctors (56·6%, 21·3/100 per year) compared to nurses (34·8%, 2·7/100 per year). This contrasts with several other studies where nurses sustained more injuries than doctors in China (72·7% vs. 18·0%) [Reference Zhang9], Ireland (49% vs. 36%) [Reference Kevitt and Hayes10] and Japan (51·9% vs. 34·4%) [Reference Yoshikawa11]. This variation could be due to different reporting systems and national work practices. While both doctors and trained nurses can perform phlebotomy and insert an IV cannula, there are certain procedures that only doctors can perform, such as arterial blood gas sampling or surgical procedures, e.g. suturing or needle aspirations. The higher NSI rates and in particular recurrent injuries in doctors found in our study is therefore likely due to their performing more high-risk procedures involving sharps than nursing staff. It also suggests that some doctors were not using the correct procedures to protect themselves, or simply not learning from their mistakes.
This finding represents an opportunity for intervention. We have identified areas for improvement in our hospital, which include increased use of existing and additional universally compatible, safety-engineered devices (SEDs). This can be done through education, certification as well as an increased awareness of NSI prevention through broadcasting of performance data and instructional messages. Other long-term recommendations could include ongoing surveillance of NSI cases and mandatory reporting of near-miss incidents, root-cause analyses of selected NSI cases, and enforcing the use of SEDs [Reference Whitby, McLaws and Slater12].
Most of our NSI cases occurred in the wards (40·6%), operating theatre (32·8%) and the emergency department (9·0%), which is similar to reports from Saudi Arabia [Reference Memish13], Serbia [Reference Marković-Denić14] and Japan [Reference Yoshikawa11]. This is consistent with the greater number of general and high-risk procedures undertaken in these areas.
NSIs in healthcare settings are potentially associated with the occupational transmission of more than 20 pathogens [15]. Costs associated with NSIs include initial visit and follow-up reviews of injured healthcare personnel. Costs due to each NSI in the United States are estimated to range from US$71 to US$4838 [Reference O'Malley16]. If there is seroconversion of NSI victims, the costs will be even greater due to confirmatory tests, medical care, time lost at work, job restrictions and associated litigation. Annual cost of NSIs ranged from US$ 109 800 to US$ 563 152, and this could potentially be translated into savings for the hospital.
The strength of this study is that it provides comprehensive data on the incidence, frequency of occurrence in HCWs, and the locations of NSIs in a large university hospital in Singapore. However, a significant limitation is the extent that NSIs might go unreported by staff which is problematic in any voluntary, non-effort-free system. To achieve the aim of a reduction in such injuries, reporting rates must necessarily be high, to allow meaningful comparisons of incidents between HCWs and across clinical practice. Under-reporting of NSIs remains a considerable problem and has been estimated to vary from 18% to 70% in the United States [Reference Henry and Campbell17, Reference Mangione, Gerberding and Cummings18]. This can be addressed through regular audits and increasing reporting rates through an improved reporting system with a more user-friendly platform [Reference Seng4]. As yet, there is no national registry in Singapore to allow meaningful comparison of NSI rates and as the OHC in the NUH was only set up towards end of 2013, there are no available data from previous years for comparison. However, the baseline data presented here will allow us to monitor future trends through continued surveillance. A further qualitative root-cause analysis project is planned using a mixed methodological approach to include in-depth interviews of HCWs and management personnel. It is hoped that this will serve to inform the design of a targeted needlestick prevention programme along the lines of that recommended by CDC [Reference O'Malley16].
In conclusion, this study reports an unacceptably high incidence of NSIs sustained by HCWs, particularly in doctors in our university hospital. Most incidents occurred in wards and operating theatres, and incurred significant economic costs. All health service providers should seek to provide a safe workplace with a low incidence of NSIs and facilitate the reporting of all injuries and near misses. This will help to create an environment where prevention of such injuries is given priority and ensure that when incidents do occur, they are managed efficiently and lessons are learned on each occasion. A combination of good epidemiological data and qualitative evidence will help in the design, implementation and evaluation of a prevention programme to reduce NSIs.
ACKNOWLEDGEMENTS
We thank the National University Hospital Division of Infectious Diseases and Occupational Health Clinic for providing the resources to organize and support this study.
This research received no specific grant from any funding agency, commercial or not-for-profit sectors.
DECLARATION OF INTEREST
None.


