Hostname: page-component-745bb68f8f-5r2nc Total loading time: 0 Render date: 2025-01-26T17:38:26.854Z Has data issue: false hasContentIssue false

Modelling vaccination programmes against measles in Taiwan

Published online by Cambridge University Press:  26 October 2006

S. C. CHEN
Affiliation:
Ecotoxicological Modelling Centre, Department of Bioenvironmental Systems Engineering, National Taiwan University, Taipei, Taiwan, ROC
C. F. CHANG
Affiliation:
Ecotoxicological Modelling Centre, Department of Bioenvironmental Systems Engineering, National Taiwan University, Taipei, Taiwan, ROC
L. J. JOU
Affiliation:
Ecotoxicological Modelling Centre, Department of Bioenvironmental Systems Engineering, National Taiwan University, Taipei, Taiwan, ROC Department of Biomechatronic Engineering, National Ilan University, Ilan, Taiwan, ROC
C. M. LIAO*
Affiliation:
Ecotoxicological Modelling Centre, Department of Bioenvironmental Systems Engineering, National Taiwan University, Taipei, Taiwan, ROC
*
*Corresponding author: Dr C. M. Liao, Ecotoxicological Modelling Centre, Department of Bioenvironmental Systems Engineering, National Taiwan University, Taipei, Taiwan 10617, ROC. (Email: [email protected])
Rights & Permissions [Opens in a new window]

Summary

Vaccination has proved a powerful defence against measles. We reappraise measles seroepidemiological data in Taiwan from 1974 to 2004 having robust age-stratified serological information on exposure and immunity to quantitatively characterize measles vaccination programmes. We dynamically model measles seroepidemiology to estimate age-dependent intensity of infection associated with the effects of different contact patterns on pre- and post-vaccination. The WAIFM (who acquires infection from whom) contact matrix is employed to describe the transmission between and within each age group. A deterministic SEIR (susceptible–exposed–infected–recovery) model is used to capture subpopulation dynamics. Our study shows that mass regional or nationwide vaccination programmes could greatly reduce the potential for a major measles epidemic and have strong direct effects on the potential impact of childhood vaccination. We parameterize a predictive model that should reduce the socio-economic costs of measles surveillance in Taiwan and thereby encourage its continuance, especially for preschool children.

Type
Research Article
Copyright
Copyright © Cambridge University Press 2006

INTRODUCTION

Measles virus is one of the most contagious diseases known to humans and is a major killer of children in the developing countries of Africa and South America. The high mortality rate associated with measles virus infection results from increased susceptibility to opportunistic infections [Reference Carabin1]. Measles had been endemic with a 2-year epidemic cycle in Taiwan until the introduction of the universal measles immunization programme (two doses, one at age 9 months and the other at age 15 months) in 1978 [Reference Huang2Reference Lee6]. However, there were still several epidemic outbreaks in 1985, 1988, and 1989 with 2219, 1386, and 1060 reported cases, respectively. The 1985 epidemic resulted in a total of 97 deaths (mortality rate equal to 1·7 deaths/100 000 population aged <15 years). In January 1989, an outbreak of measles occurred among elementary and junior high-schoolchildren at a rural village, Li-Tse, in northeastern Taiwan, demonstrating that the disease spread from younger (aged 5–9 years) to older schoolchildren (⩾10 years) and pre-schoolchildren (⩽4 years) in both the Taipei city and suburban areas of Taipei county [Reference Lee3, Reference Lee7]. Therefore, measles surveillance has been established based on passive reporting since 1985. Moreover, the government established a national goal of measles elimination by 2000 [Reference Huang2, Reference Lee4Reference Lee6].

Several countries have established serological surveillance to provide supplementary data as the basis for immunization and public health planning programmes. The European Sero-Epidemiology Network (ESEN) collected data through large serological surveys of measles, mumps and rubella antibodies and has recently performed surveys in eight participating European countries [Reference Edmunds8]. Seroepidemiology can be defined as the systematic collection and testing of blood samples from a target population or a representative sample. Seroepidemiological data can measure the population susceptibility profile and identify current and past experiences with infectious diseases by means of antibody and antigen tests. Serological survey of measles has been investigated for different countries such as Italy [Reference Manfredi9], Zambia [Reference Scott10], and European countries [Reference Edmunds8, Reference Wallinga11].

Mathematical models are useful in investigating the potential impact of changes in vaccination programmes, e.g. the introduction of mass vaccination campaigns or changes in the age of vaccination and changes in effective vaccination coverage in those serological surveys that facilitate several important epidemiological parameters. We use prevaccination seroepidemiology to estimate the age-specific force of infection (FOI), which is defined as the per capita rate of acquisition of infection converted from seronegativity to seropositivity [Reference Anderson and May12]. Finally, the age-specific transmission rate could be described by the basic reproduction ratio, R 0, quantifying the transmissibility of any infectious disease, which is defined as the expected number of successful secondary infections cases generated by a typical primary infected case in an entirely susceptible population [Reference Anderson and May12Reference Diekmann and Heesterbeek14]. This quantifies the transmissibility of the potential of the infection in a given population. Contact process may be seen as the infectious disease transmission route from the infectious to susceptible where the transmissibility varied with heterogeneous contact patterns based on different age of individuals or settings [Reference Edmunds, OCallaghan and Nokes15, Reference Wallinga, Edmunds and Kretzschmar16]. In light of the contact matrix models, the WAIFW (who acquires infection from whom) matrix was commonly used to control the transmission within and between each age group in the spread of airborne infections [Reference Kanaan and Farrington17Reference Amaku20].

Here we use a relatively parsimonious individual-based mechanistic model that allows us to accurately capture the overall effects of pre- and post-vaccination epidemiology of measles on the subpopulation dynamics. To achieve this objective, we employed the standard deterministic compartmental model known as the susceptible–exposed–infected–recovery (SEIR) model to provide a mechanistic bridge between theoretical models and empirical data [Reference Anderson and May12]. The SEIR model is a cornerstone of epidemiology, as it provides a simple mechanistic model for microparasite dynamics and can represent the transmission dynamics for populations [Reference Earn21Reference Mills, Robins and Lipsitch24].

The aims of this study are twofold: (1) to compare the pre- and post-vaccination epidemiology of measles in a national context by using mathematical modelling concepts; (2) to provide useful parameter values for further refining childhood vaccination modelling and perspectives toward measles elimination.

MATERIALS AND METHODS

Quantitative seroepidemiological data

Seroepidemiological data is the powerful information that provides us with the immune proportion of the host before the disease outbreak. We can combine the vaccine effectiveness with the results of the seropositive level from post-vaccination to estimate the level of herd immunity of the interesting population. In this study, we adopted the limited data of the seropositive level in Taiwan from 1974 to 2004 to estimate the age-specific FOIs and R 0 by linking the age group-specific transmission contact patterns for pre- and post-vaccination epidemiology of measles. Based on the surveys sites of measles vaccination, the nationwide data adopted from Huang et al. [Reference Huang2], Lee et al. [Reference Lee6] and Chiu et al. [Reference Chiu25] were used in the age-specific modelling scheme, whereas the regional settings of Taiwan data adopted from Lee et al. [Reference Lee5] were used in the population-specific modelling scheme. We assumed that these samples are representative of the random sampling population. We estimated that the average vaccination coverage ranged from 2% to 8% in 1974–1977. However, the values were higher from 21% to 55% in 1978–1990 as the universal measles immunization programme was instituted in 1978, whereas the values ranged from 71% to 88% in 1991–2004.

The serum sample was tested by the usual quantitative enzyme immunoassay (EIA) kit and Enzyme-linked immunosorbent assay (ELISA) kit (Table 1). The first published EIA and ELISA systems differed in assay design, yet both techniques are based on the principle of immunoassay with an enzyme. We thus ignored the difference between test kits in our study. Furthermore, we treated the seroepidemiological data from Lee et al. [Reference Lee6] as prevaccination data while other data were treated as post-vaccination data in estimating R 0. Figure 1(a, b) shows the epidemics of the confirmed cases of measles outbreaks from 1985 to 1992 associated with data from 1993 to 2004 (adopted from Center of Disease Control Taiwan, ROC), indicating that measles outbreaks occurred in 1985, 1988–1989, and 1992 (Fig. 1 a). The recent number of confirmed cases of measles was <40 (Fig. 1 b).
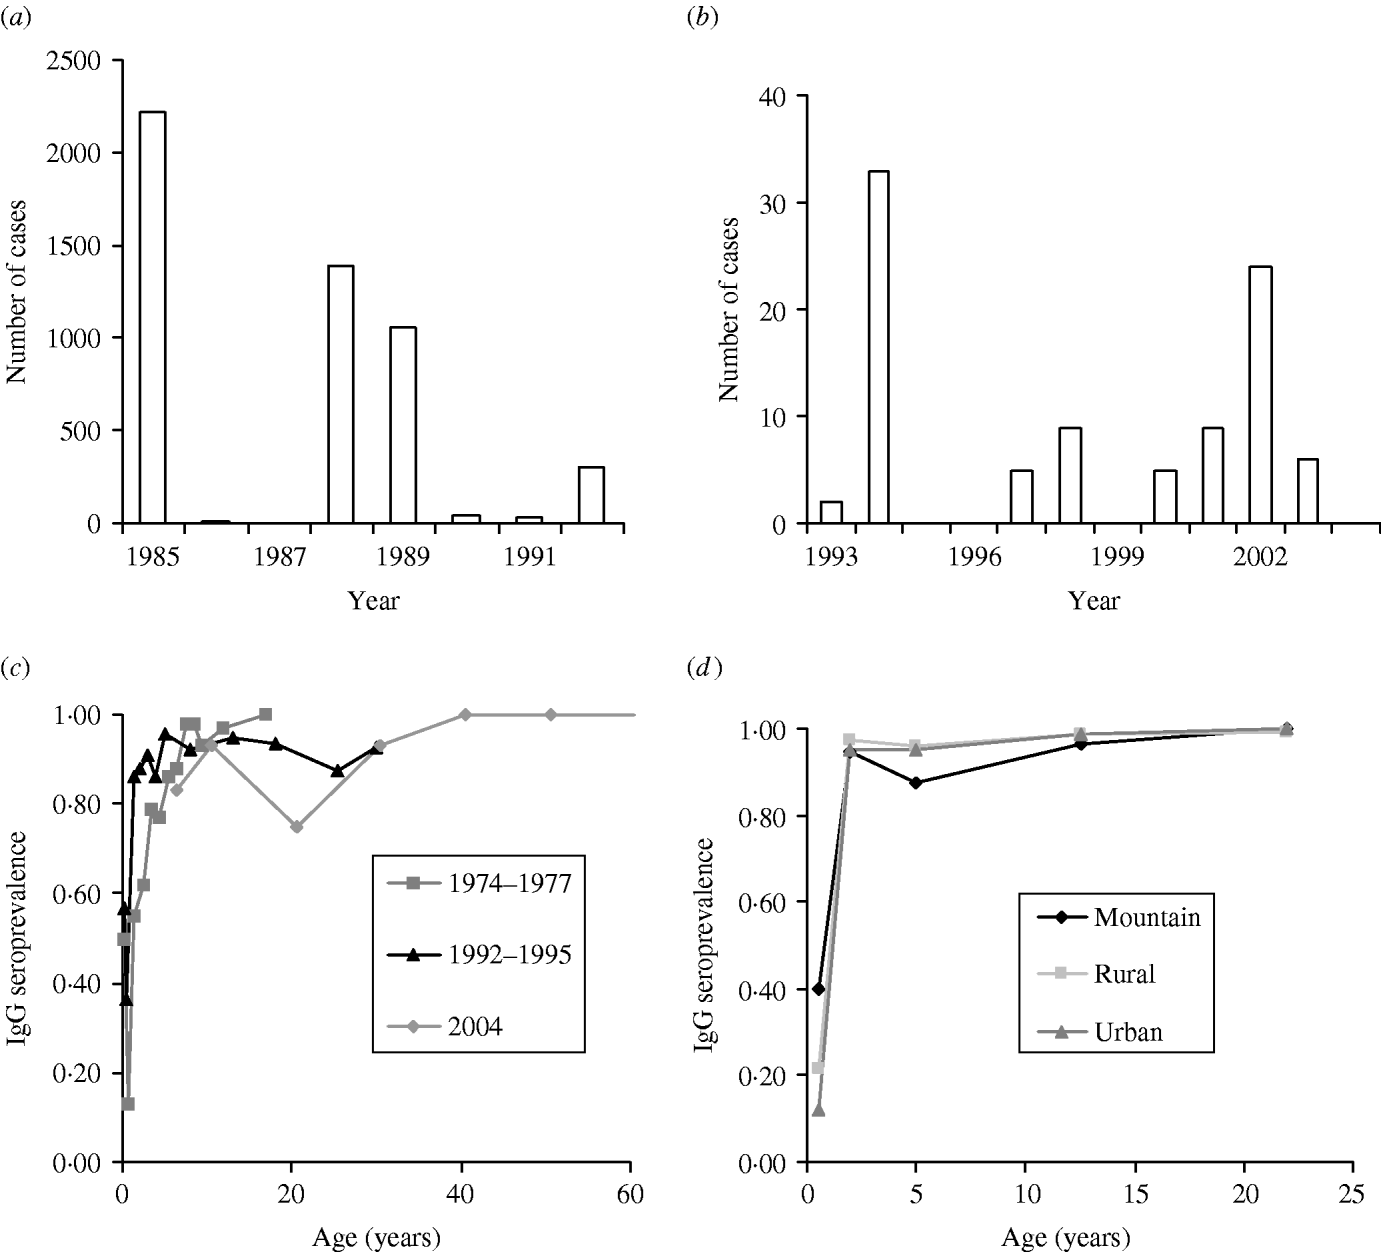
Fig. 1. Quantitative epidemiology of measles outbreak: Number of cases for (a) 1985–1992 and (b) 1993–2004 and age-specific IgG seroprevalence for (c) 1974–1977, 1992–1995, and 2004, and (d) among different populations in mountain, rural, and urban regions.

Table 1. Measles serological survey data and vaccination strategies in Taiwan

* Enzyme-Linked Immunosorbent Assay (ELISA) kit.

Enzyme Immunoassay (EIA) kit.

The profile of measles immunoglobulin G (IgG) seroprevalence indicates the age-specific measles IgG seroprevalence for 1974–1977, 1991–1992, and 2004 (Fig. 1 c) and the age-/population-specific measles IgG seroprevalence for 1995–1997 (Fig. 1 d). The IgG seroprevalences are increasing approximately with age, indicating that the existing antibody was contributed by the vaccinated and infected persons before serum testing. We used a dynamic model of seroepidemiology to describe the profile of age-specific seroprevalence of measles [Reference Yu26],

(1)
\!\eqalign {S^{ \plus } \lpar a \rpar \equals \tab 1\! \minus\! \exp \left\{ {{k_{\setnum{1}} } \over {k_{\setnum{2}}\hskip 0 ^{\setnum{2}} }}\lsqb \lpar k_{\setnum{2}} \lpar a \minus L_{C} \rpar \plus 1 \rpar} \right. \cr \times \left.{ \exp\! \lpar\! \minus k_{\setnum{2}} \lpar a \minus L_{C} \rpar \rpar \minus 1 \rsqb \right\bigg\}}\comma} \hskip 19.979mm

where S +(a) is the proportion of seropositive individuals to measles at a specific age group a, k 1 and k 2 are fitting parameters that can be estimated by fitting eqn (1) to seroprevalence data (Fig. 1 c, d), and L C is the average duration of maternal immunity for measles that is ≈3 months [Reference Anderson and May12].

Age-specific FOI for pre- and post-vaccination

The FOI, that depends on the number of infectious individuals and mixing patterns within a population in a given time period (e.g. 1 year), reflects the proportion of susceptible persons in the model population who acquired new infections during that time period. The FOI can be directly estimated from the serological data of pre- and post-vaccination [Reference Anderson and May12],

(2)
1 \minus S_{\setnum{0}}^{ \plus } \lpar a\rpar \equals {X \over N} \equals x \equals \exp \! \left(\! { \minus\! \int_{\setnum{0}}^{a} \! \! {\lambda _{\setnum{0}} \lpar a\rpar {\rm d}a} } \!\right)\comma \hfill
(3)
1 \minus S_{\setnum{0}}^{ \plus \prime} \lpar a\rpar \equals {{X \hskip 1pt\prime} \over N} \equals x \prime \equals \exp \! \left( \!{ \minus \! \int_{\setnum{0}}^{a} \! \! {\lambda _{\setnum{0}}\hskip -4 {\prime }\hskip 2 \lpar a\rpar } {\rm d}a} \! \right)\comma\hfill

here S 0+(a) and S_{\setnum{0}}^{ \plus \prime } \lpar a\rpar are the age group-specific proportion of seropositive individuals of the pre- and post-vaccination, respectively, 1 – S 0+(a) is equal to the susceptible number X divided by the population number N, representing the susceptible proportion of the population N, and λ0(a) and λ′(a) are the pre- and post-vaccination FOIs at a specific age group a, respectively. We assume that the recovered number of the population N will not be a susceptible number again. We further assume that the post-vaccination data reflect a post-vaccination equilibrium situation and we state that a time span long enough to allow the onset of a post-vaccination equilibrium is passed. For post-vaccination modelling, we assume that the contribution of the proportion of seropositive is vaccinated on an individual basis only.

We further considered the following five age groups based on the social behaviours, corresponding to the major school grades in Taiwan: 0–1 (babies), 2–3 (toddlers), 4–6 (preschool), 7–14 (primary school), and 15–35 (adults). The five age groups were chosen to account for the fact of high prevalence in children throughout the world, which plays a very important role.

Contact pattern model

The contact pattern is a complicated process which depends on contact frequency, number of contacts of infectious persons, virulence of the pathogen, and the appropriate mode of the transmission route. The processes therefore provide the information necessary to focus on the available control measures and determine the effectiveness of elimination programmes. We use WAIFW to determine the transmission within and between each age group occurs at different rates due in part to a lack of transmission frequency information of susceptible and infectious [Reference Anderson and May12].

We adopt three contact pattern matrices to describe the specific transmission to account for the human behaviour and population settings (Appendix 1). Matrix \tilde{\beta }_{m\setnum{1}} \lpar {a\comma a \hskip .5\prime } \rpar structure [eqn (A1)] is chosen to reflect the transmission rate that depends only on the age of the susceptible [i.e. β(a, a′)=β(a)] to compare its predictions with those of more plausible structures. Matrix \tilde{\beta }_{m\setnum{2}} \lpar {a\comma a \hskip .5\prime } \rpar structure [eqn (A2)] corresponds to the transmission process for those in the first four age groups being primarily from contacts within their own age group against a general background common to all individuals, indicating the large amount within age group mixing. On the other hand, matrix \tilde{\beta }_{m\setnum{3}} \lpar {a\comma a \hskip .5\prime } \rpar structure [eqn (A3)] shows that there is a unique coefficient (β2) describing the transmission among susceptible and infectious in age group 2 associated with the other two coefficients (β1 and β3) for other contacts among children aged <6 years; whereas adolescents and adults are described as being likely to acquire infection from a wider range of age groups. We further treat β(a, a′)=β(a′, a) for \tilde{\beta }_{m\setnum{2}} \lpar {a\comma a \hskip .5\prime } \rpar and \tilde{\beta }_{m\setnum{3}} \lpar {a\comma a \hskip .5\prime } \rpar to reflect a symmetry relation, indicating that the individuals in age group a make contact with individuals in age group a′ at the same rate as which individuals in age group a′ make effective contact with individuals in age group a, where a and a′ represent ages of susceptible and infectious individuals, respectively. High levels of mixing within age groups are a unique feature of the child age groups.

The five elements in the three contact pattern matrices can be estimated by a relationship that links age group-specific FOI and the WAIFW matrix [Reference Anderson and May12],

(\vskip17(4))
\eqalign {\lpar 1 \minus p\rpar \lambda \lpar a\rpar \equals \tab \sum\limits_{a \hskip .5\prime \equals \setnum{1}}^{\setnum{5}} \tilde{\beta }\lpar a\comma a \hskip .5{\prime} \rpar \lpar {\rm exp} \lpar \!\minus \psi \lpar a \hskip .5\prime \minus 1\rpar \rpar \cr \tab \minus \exp \! \lpar\! \! \minus \psi \lpar a \hskip .5\prime \rpar \rpar \rpar \comma } \hfill

where λ(a) is the FOI at a specific age group a, p is the coverage rate of measles vaccination, \tilde{\beta }\lpar a\comma a \hskip .5\prime \rpar denotes the WAIFW matrix, and ψ(a) is the age-independent constant defined as \psi \lpar a\rpar \equals \sum\nolimits_{a\hskip .5 \prime \equals \setnum{1}}^{\setnum{5}} {\lambda \lpar a \hskip .5 \prime \rpar \lpar \bar{t}\lpar a \hskip .5 \prime \rpar \minus \bar{t}\lpar a \hskip .5 \prime \minus 1\rpar \rpar } in that (a) is the mean age of age group a. The age-specific value of R 0(a) for an infection in age group a can be determined based on the known FOI and transmission rate as [Reference Anderson and May12],

(5)
R_{\setnum{0}} \lpar a\rpar \equals \sum\limits_{a \hskip .5\prime \equals \setnum{1}}^{\setnum{5}} {\tilde{\beta }\lpar a\comma a \hskip .5\prime \rpar \lpar \bar{t}\lpar a \hskip .5\prime \rpar \minus \bar{t}\lpar a \hskip .5\prime \minus 1\rpar \rpar }. \hfill

In the heterogeneous population, R 0(a) as the summation of the average number of secondary cases arising in age group a′=1−5 from a case in age group a [Reference Diekmann, Heesterbeek and Metz13, Reference Diekmann and Heesterbeek14]. We further estimate the mean R 0 for a population by averaging the R 0(a) estimates to reflect the overall spread of the infection. Self-sustaining transmission occurs when R 0 is >1, allowing amplification of case numbers from one round of infection to the next. The chain of human-to-human transmission will inevitably die out when R 0<1.

Vaccination dynamics

For an analysis of latency, an exposed but latent class E (exposed) transforms the model from SIR to SEIR because latency always affects time-dependent phenomena, such as the speed of the epidemiological response to changes in immunization or the speed of an epidemic. Generally, measles has incubation, latent, and infectious periods of 8–13 days, 6–9 days, and 6–7 days, respectively [Reference Anderson and May12]. We address the vaccination dynamics using a relatively parsimonious individual-based SEIR model with homogeneous mixing to capture the effect of pre- and post-vacccination on population dynamics (Appendix 2).

RESULTS

Age-specific FOIs

We characterize the age-specific IgG seroprevalence by fitting function S +(a) [eqn (1)] to published data (Fig. 1 c, d), resulting in the fitted parameters k 1 and k 2 that are estimated to be 1·3, 0·7 (1978–1977); 33·7, 3·7 (1992–1995); 26·5, 3 (1995–1996 Mountain); 7, 1·4 (1997 Rural); 5·8, 1·3 (1997 Urban); and 1·5, 0·7 (2004), respectively. We estimate the age group-specific FOIs by eqns (2) and (3) to take into account the different contact patterns among the major school grades in Taiwan (Table 2). The FOI of age group 2 is higher than those of other age groups, indicating the FOI of age group 2 decreasing from 1974 to 2004, corresponding to the decreasing number of cases of measles epidemics in Taiwan (Table 2, Fig. 1 a, b).

Table 2. Estimated age-specific force of infection of measles from 1974 to 2004 in five age groups

Our results show that the peak values of FOIs are estimated to be 0·5, 0·37, and 0·07 year−1 for 1974–1977, 1992–1995, and 2004, respectively, indicating that the FOIs decreased after the measles vaccination programmes (Fig. 2 a). The vaccination policy was modified several times due to measles outbreaks in 1985, 1988–1989, and 1992 and this may explain the decreasing FOIs. The recommended ages for vaccination have been changed several times since 1978: two doses at ages 9 and 15 months in 1984, one dose at age 12 months in January 1988, and two doses at ages 9 and 15 months in May 1988 due to the eruption of measles outbreaks [Reference Lee6]. On the other hand, the age-/population-specific FOIs, taking into account the populations in mountain, urban, and rural regions in Taiwan, indicate that prevaccination FOIs are greater than post-vaccination FOIs. However, the patterns of population-specific post-vaccination FOIs are slightly different (Fig. 2 b). Different regional settings reflect the complicated contact pattern or the transmission probability.
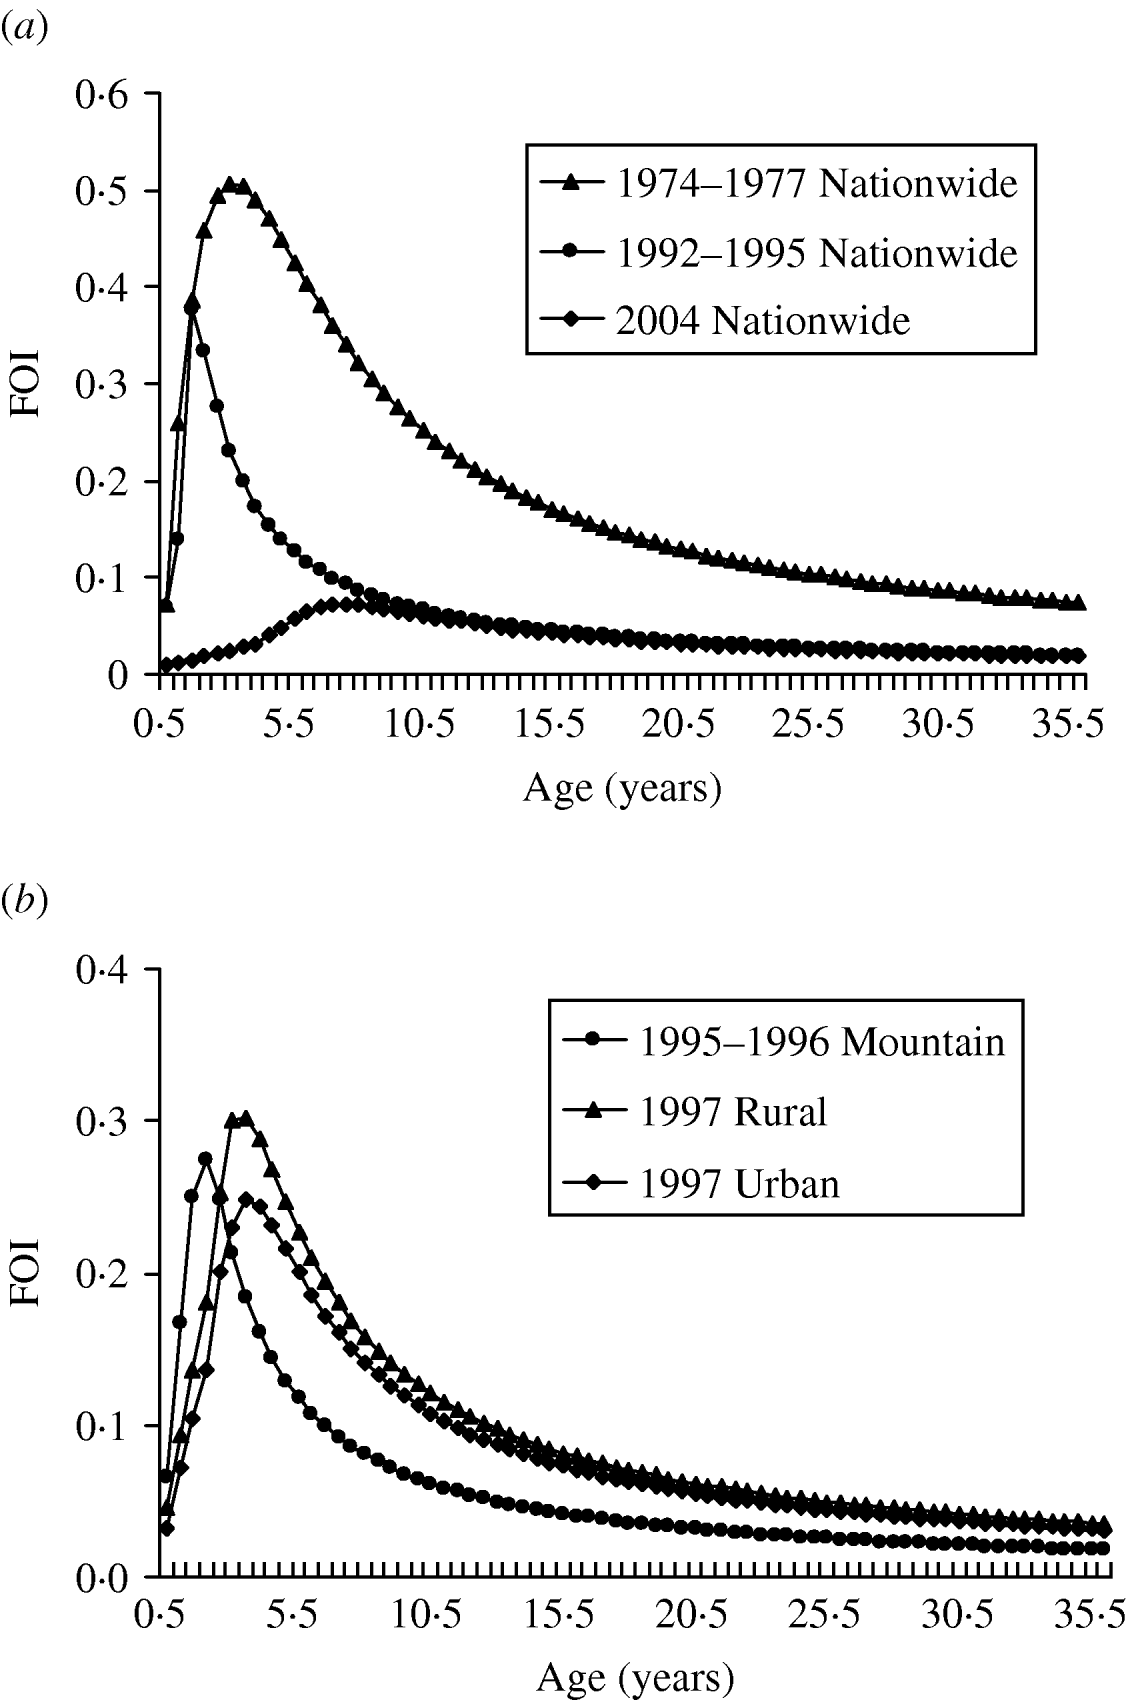
Fig. 2. Estimates of age-specific force of infection (FOI). (a) 1974–1977, 1992–1995, and 2004 nationwide vaccination programmes and (b) different populations of mountain (1995–1996), rural (1997), and urban (1997) regions.

Age-/population-specific R 0 estimates

The choice of contact pattern matrix structures can strongly influence the age group-specific R 0 estimates (Fig. 3). The age group-specific R 0 estimates based on \tilde{\beta }_{m\setnum{1}} \lpar a\comma a \hskip .5\prime \rpar and \tilde{\beta }_{m\setnum{3}} \lpar a\comma a \hskip .5\prime \rpar have the similar profiles that are different from contact pattern \tilde{\beta }_{m\setnum{2}} \lpar {a\comma a \hskip .5\prime } \rpar (Fig. 3 a, b). The highest values of age group-specific R 0 are estimated to be 13·2 and 16·1 for age groups 2 and 4 for \tilde{\beta }_{m\setnum{1}} \lpar a\comma a\hskip .5 \prime \rpar and \tilde{\beta }_{m\setnum{2}} \lpar a\comma a \hskip .5\prime \rpar, respectively, whereas it is 6·05 for age group 2 for \tilde{\beta }_{m\setnum{3}} \lpar a\comma a \hskip .5\prime \rpar in 1974–1977 (Fig. 3 a). The age group-specific R 0 estimates have very similar profiles for the three contact patterns in 2004 (Fig. 3 c).

Fig. 3. Estimates of age group-specific basic reproduction ratio varied with three contact pattern matrices structures of \tilde{\beta }_{m\setnum{1}} \lpar {a\comma a \hskip .5\prime } \rpar, \tilde{\beta }_{m\setnum{2}} \lpar {a\comma a \hskip .5\prime } \rpar and \tilde{\beta }_{m\setnum{3}} \lpar {a\comma a \hskip .5\prime } \rpar (see Appendix 1). The five age groups are 0–1, 2–3, 4–6, 7–14, and 15–35 years. (a) 1974–1977, (b) 1992–1995, and (c) 2004 nationwide vaccination programmes.

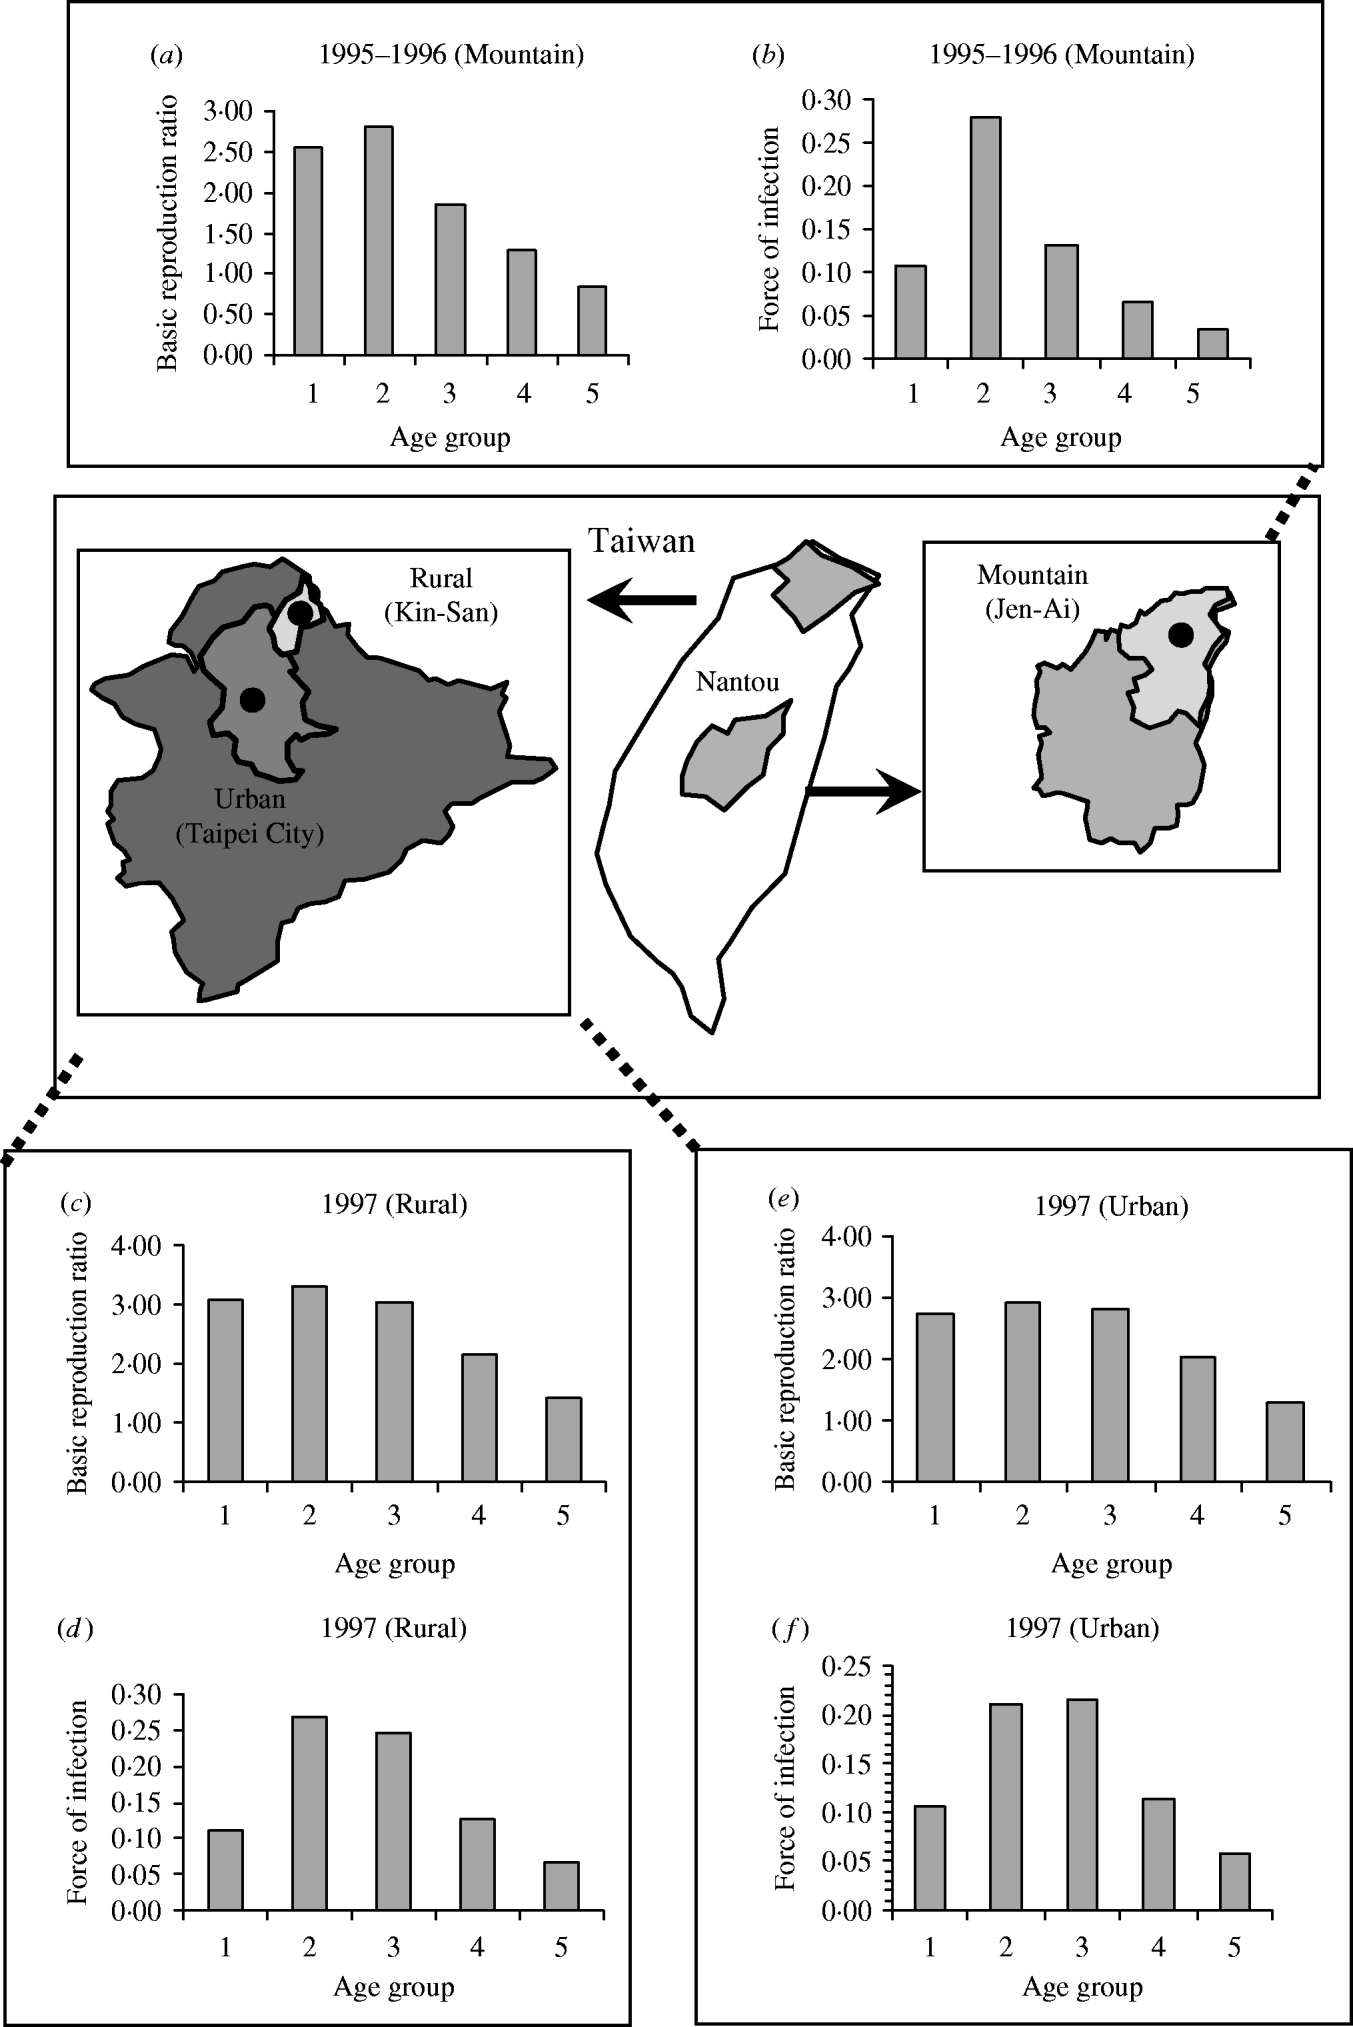
Figure 4 shows the age-/population-specific R 0 (Fig. 4 a, c, e) and FOIs (Fig. 4 b, d, f) for mountain, rural, and urban regions for specific contact pattern \tilde{\beta }_{m\setnum{2}} \lpar a\comma a \prime \rpar, taking into account the age groups being primarily from contacts within their own age group. The age group-specific R 0 estimates are still high at age group 2 for the three regional population settings (Fig. 4 a, c, e) in that the population-specific average R 0 estimates are 2·24, 2·51, and 1·83, whereas the average FOIs are 0·14, 0·16, and 0·12 year−1 for the urban, rural, and mountain regions, respectively.

Fig. 4. Age group-/population-specific basic reproduction ratio and force of infection estimates based on specific contact matrix \tilde{\beta }_{m\setnum{2}} \lpar {a\comma a \hskip .5\prime } \rpar. (a, b) Mountain (1995–1996), (c, d) rural (1997), and (e, f) urban (1997) regions.

Measles vaccination effectiveness on R 0

Figure 5 shows the effective reproduction ratio estimates of all age groups including the nationwide R 0 (1978, 1992, and 2004) and regional population-specific R 0 (1995, 1996), indicating that R 0 had declined because of the implementation of measles vaccination, although there are still a few cases of measles currently occurring in Taiwan. Figure 5 also indicates that the average prevaccination R 0 estimates are 8·00, 7·07, and 4·78, whereas for the post-vaccination R 0 estimates in 2004 are 1·64, 1·48, and 1·51, respectively for the contact pattern matrices \tilde{\beta }_{m\setnum{1}} \lpar a\comma a\hskip .5 \prime \rpar, \tilde{\beta }_{m\setnum{2}} \lpar a\comma a \hskip .5\prime \rpar, and \tilde{\beta }_{m\setnum{3}} \lpar a\comma a \hskip .5\prime \rpar based on the 1978 criteria year that separates pre- and post-vaccination.

Fig. 5. Measles vaccination effect on effective reproduction ratio (R 0) estimates that derived from eqn (5) using proposed three contact patterns (see Appendix 1) in that R 0 estimates averaged out mass regional and nationwide measles vaccination campaigns. The measles vaccination criteria year was set in 1978 to separate pre- and post-vaccination.

Pre- and post-vaccination dynamics

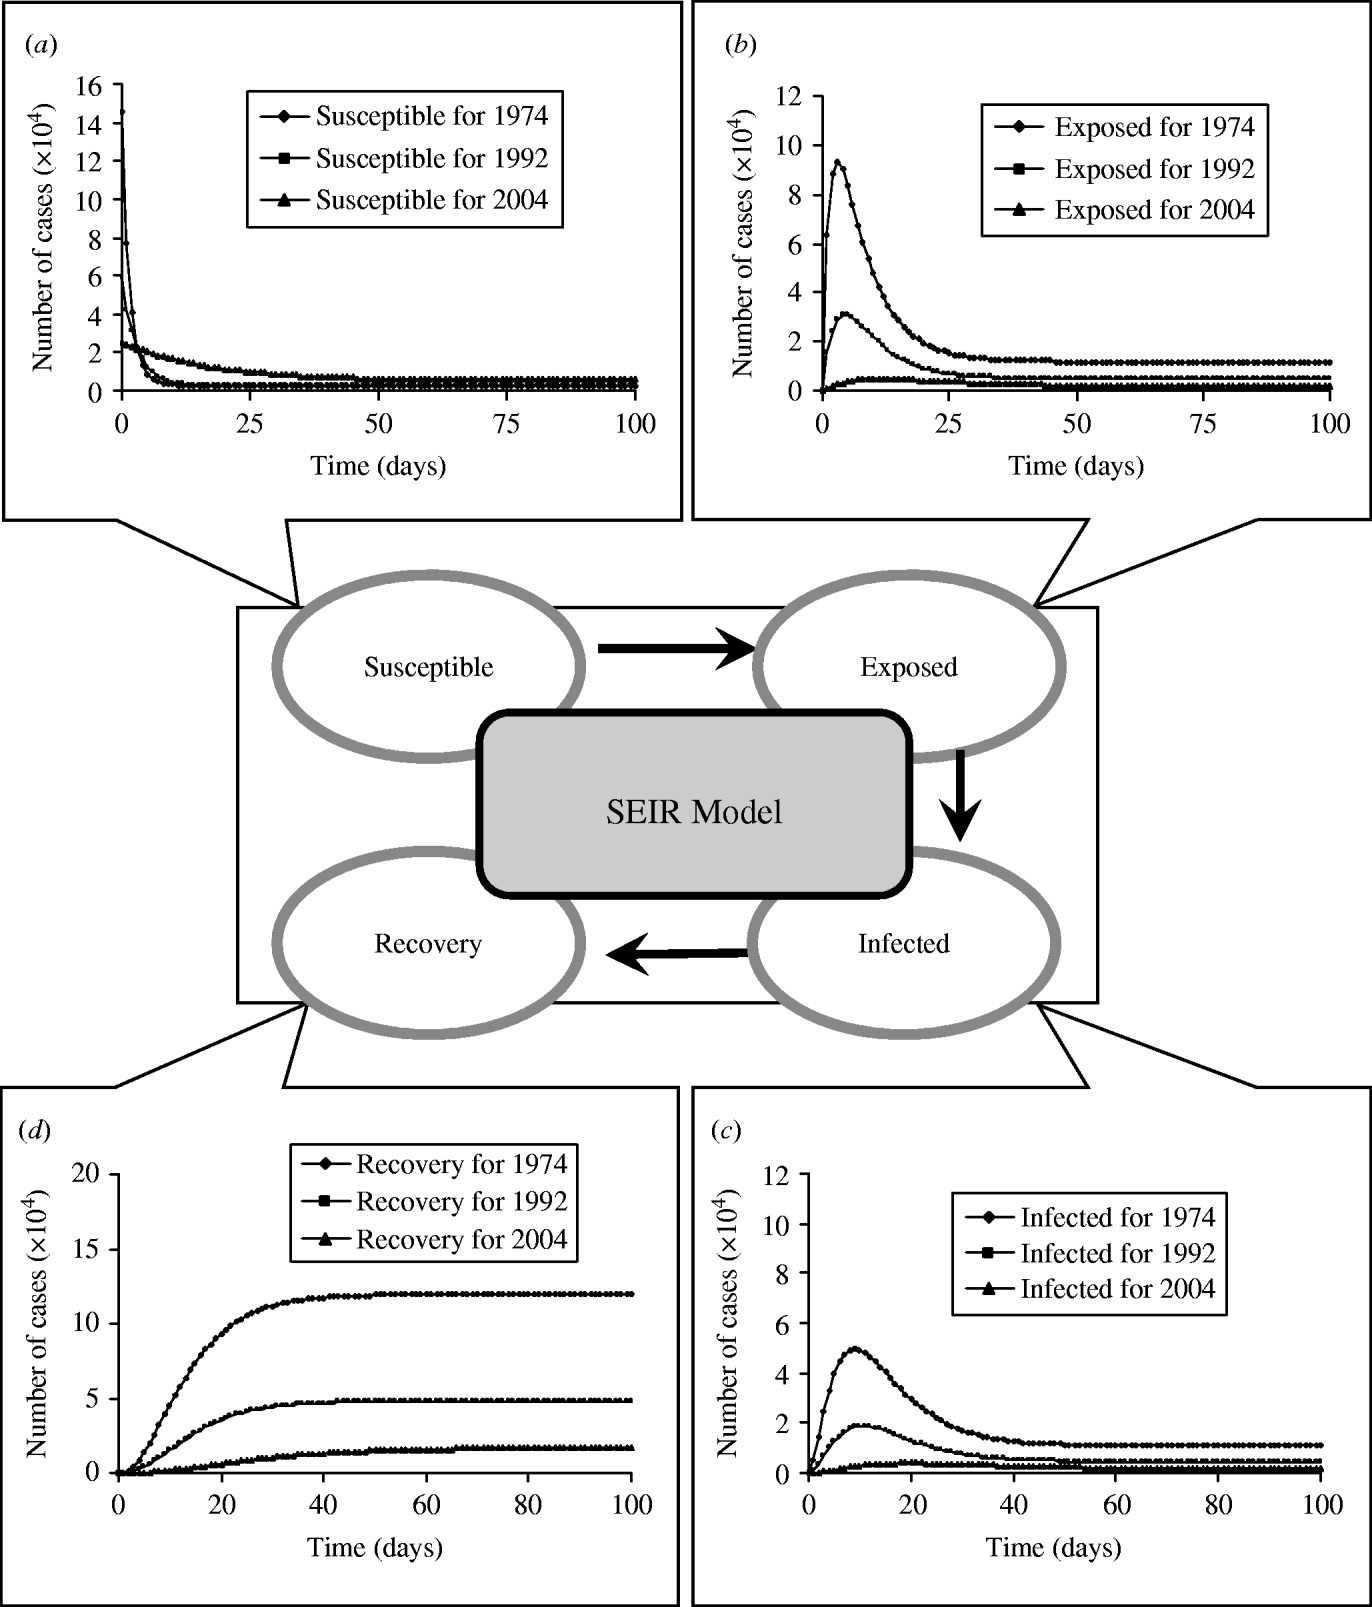
We formulate a mathematical model characterizing the nationwide SEIR population dynamics in terms of various FOIs and the realistic numbers of population in the specific years of 1974–1977, 1992–1995, and 2004 to describe the epidemic dynamics at age group 2 (2–3 years old) (Fig. 6). When an epidemic starts to spread, the number of susceptibles (S) decrease, whereas exposed (E), infected (I), and recovery (R) increase until each infected becomes immunized. The results show that the level of peak infected numbers of cases are decreasing from 4·96×104 (1974–1977), 1·87×104 (1992–1995) to 0·38×104 (2004), whereas the onset times of peak infected number are 9, 11, and 20 days for 1974–1977, 1992–1995, and 2004, respectively (Fig. 6 c). Delay time may provide buffer periods for government to adopt the appropriate control measures to prevent the potential transmission. We also illustrate the age-/time-dependent SEIR model by the response surface representations to capture the SEIR populations with the prevaccination FOIs in 1974–1977 (Fig. 7).

Fig. 6. Pre- and post-vaccination dynamics. Time evolution of (a) susceptible, (b) exposed, (c) infected, and (d) recovery numbers of case predicted by a standard SEIR model for age group 2 (2–3 years) from the realistic population.

Fig. 7. Prevaccination age-specific force-of-infection estimates in 1974–1977 represented by response surfaces of SEIR population dynamics.

DISCUSSION

The design of effective elimination programmes for measles is often hampered by the lack of basic seroepidemiological information. In this study, we reappraised the published measles seroepidemiological data in Taiwan from 1974 to 2004, having robust age-stratified serological information on exposure and immunity following community-based studies. Combining this with a standard SEIR structure in that the transmission between and within each age group occurs at different rates and is controlled by the WAIFW matrix, we were able to parameterize a seroepidemiological model to further predict the impact of vaccination programmes on measles elimination. Our central findings concerning the effectiveness of measles immunization programmes and the potential impact of mass vaccination seem robust to key model assumptions and the limitations of the input data.

We presume measles transmission between and within each age group experiencing homogeneous mixing, although the model reasonably predicts measles dynamics of pre- and post-vaccination. Kanaan & Farrington [Reference Kanaan and Farrington17] used a Bayesian approach to evaluate the 22 models of the contact-pattern matrices by reviewing published models to obtain prior model probabilities based on published frequency and expert opinions, recommending that the assortative mixing model is a best model type among those surveyed. Our results show the age-/population-specific R 0 at the mountain, rural, and urban regions for specific contact pattern \tilde{\beta }_{m\setnum{2}} \lpar {a\comma a \hskip .5 \prime } \rpar (Fig. 4 a, c, e), taking into account that the age groups are primarily from contacts within their own age group, indicating that the matrix \tilde{\beta }_{m\setnum{2}} \lpar {a\comma a \hskip .5 \prime } \rpar is a more realistic and accurate matrix compared with the other two contact matrices. Edmunds et al. [Reference Edmunds8] suggested that it is acceptable to use the epidemiological parameters such as the age-specific FOIs and R 0 for different countries to modify the measles transmission, indicating that the epidemiological parameters seem similar for different population settings. Glass et al. [Reference Glass, Kappey and Grenfell27] further revealed that heterogeneity in vaccination coverage can lead to a much increased rate of infection among unvaccinated individuals associated with a simultaneous drop in the average age at infection, suggesting the potential effect of heterogeneity in measles vaccination on population immunity. In future work, we may consult, among others, Babad et al. in England and Wales [Reference Babad28], Roberts & Tobias in New Zealand [Reference Roberts and Tobias29], and Manfredi et al. in Italy [Reference Manfredi30] for more useful applications of measles modelling in a nationwide-scale study and implicate the proposed model to the other common contagious diseases of childhood such as chickenpox.

Wallinga et al. [Reference Wallinga, Edmunds and Kretzschmar16] pointed out that quantitative study in social networks research of human contact patterns have recently begun to characterize relevant network structures, and mathematical modelling is shedding new light on how specific aspects of contact patterns can alter the spread of infectious diseases and the evolution of the infective agents. Moreover, Wallinga et al. [Reference Wallinga, Edmunds and Kretzschmar16] also provided three network characteristics that may have an important bearing on the spread of infectious diseases – the average number of contacts, the network's transitivity and the characteristic path length. Matthews & Woolhouse [Reference Matthews and Woolhouse31] also suggested that the transmission model could compose of biological information, epidemiology information, real-time data, and demographic information to precisely describe the model. Consequently, a combination of theoretical and empirical research is needed to increase our understanding of the impact of human contact networks on the spread and evolution of infectious agents, and to assess the implications for the planning of public heath policy.

Although a useful insight can certainly be gained from more complex models such as the time-series SEIR model used to analyse both endemic cycle and episodic outbreaks in measles [Reference Bjørnstad, Finkenstädt and Grenfell32], the key benefits of models such as those presented here are the logical straightforwardness and relative simplicity of the results. We conclude that even simplified models areuseful in assessing alternate strategies for control and guiding research in further refining childhood vaccination modelling for eradication of disease by mass regional or nationwide vaccination campaigns.

APPENDIX 1. Contact pattern matrices

The transmission between and within each age group occurs at different rates and is controlled by the following three WAIFW matrices:

(A 1)
\tilde{\beta }_{m\setnum{1}} \lpar a\comma a \hskip .5 \prime \rpar \equals \left( {\matrix{ {\beta _{\setnum{1}} } \tab {\beta _{\setnum{1}} } \tab {\beta _{\setnum{1}} } \tab {\beta _{\setnum{1}} } \tab {\beta _{\setnum{1}} } \cr {\beta _{\setnum{2}} } \tab {\beta _{\setnum{2}} } \tab {\beta _{\setnum{2}} } \tab {\beta _{\setnum{2}} } \tab {\beta _{\setnum{2}} } \cr {\beta _{\setnum{3}} } \tab {\beta _{\setnum{3}} } \tab {\beta _{\setnum{3}} } \tab {\beta _{\setnum{3}} } \tab {\beta _{\setnum{3}} } \cr {\beta _{\setnum{4}} } \tab {\beta _{\setnum{4}} } \tab {\beta _{\setnum{4}} } \tab {\beta _{\setnum{4}} } \tab {\beta _{\setnum{4}} } \cr {\beta _{\setnum{5}} } \tab {\beta _{\setnum{5}} } \tab {\beta _{\setnum{5}} } \tab {\beta _{\setnum{5}} } \tab {\beta _{\setnum{5}} } \cr } } \right)\comma
(A 2)
\tilde{\beta }_{m\setnum{2}} \lpar a\comma a \hskip .5 \prime \rpar \equals \left( {\matrix{ {\beta _{\setnum{1}} } \tab {\beta _{\setnum{5}} } \tab {\beta _{\setnum{5}} } \tab {\beta _{\setnum{5}} } \tab {\beta _{\setnum{5}} } \cr {\beta _{\setnum{5}} } \tab {\beta _{\setnum{2}} } \tab {\beta _{\setnum{5}} } \tab {\beta _{\setnum{5}} } \tab {\beta _{\setnum{5}} } \cr {\beta _{\setnum{5}} } \tab {\beta _{\setnum{5}} } \tab {\beta _{\setnum{3}} } \tab {\beta _{\setnum{5}} } \tab {\beta _{\setnum{5}} } \cr {\beta _{\setnum{5}} } \tab {\beta _{\setnum{5}} } \tab {\beta _{\setnum{5}} } \tab {\beta _{\setnum{4}} } \tab {\beta _{\setnum{5}} } \cr {\beta _{\setnum{5}} } \tab {\beta _{\setnum{5}} } \tab {\beta _{\setnum{5}} } \tab {\beta _{\setnum{5}} } \tab {\beta _{\setnum{5}} } \cr } } \right)\comma
(A 3)
\tilde{\beta }_{m\setnum{3}} \lpar a\comma a \hskip .5 \prime \rpar \equals \left( {\matrix{ {\beta _{\setnum{1}} } \tab {\beta _{\setnum{1}} } \tab {\beta _{\setnum{3}} } \tab {\beta _{\setnum{4}} } \tab {\beta _{\setnum{5}} } \cr {\beta _{\setnum{1}} } \tab {\beta _{\setnum{2}} } \tab {\beta _{\setnum{3}} } \tab {\beta _{\setnum{4}} } \tab {\beta _{\setnum{5}} } \cr {\beta _{\setnum{3}} } \tab {\beta _{\setnum{3}} } \tab {\beta _{\setnum{3}} } \tab {\beta _{\setnum{4}} } \tab {\beta _{\setnum{5}} } \cr {\beta _{\setnum{4}} } \tab {\beta _{\setnum{4}} } \tab {\beta _{\setnum{4}} } \tab {\beta _{\setnum{4}} } \tab {\beta _{\setnum{5}} } \cr {\beta _{\setnum{5}} } \tab {\beta _{\setnum{5}} } \tab {\beta _{\setnum{5}} } \tab {\beta _{\setnum{5}} } \tab {\beta _{\setnum{5}} } \cr } } \right)\comma

where \beta \lpar a\comma a \hskip .5 \prime \rpar is the transmission rate describing the probability that an infective of age a′ will be infected by a susceptible of age a.

APPENDIX 2. SEIR model

The standard SEIR model categorizes individuals into five distinct age groups: 0–1 (babies), 2–3 (toddlers), 4–6 (preschool), 7–14 (primary school), and 15–35 (adults). Within each age class, the population is subdivided into susceptible (S), exposed (E), infected (I), and recovery (R) groups. Therefore, the dynamics of measles vaccination can be modelled straightforwardly using a simple parameterized set of differential equations as

(A 4)
{{{\rm dS}} \over {{\rm d}t}} \equals \minus \lambda {\rm S}\lpar t\rpar \minus \mu {\rm S}\lpar t\rpar \comma
(A 5)
{{{\rm dE}} \over {{\rm d}t}} \equals \lambda {\rm S}\lpar t\rpar \minus \sigma {\rm E}\lpar t\rpar \minus \mu {\rm E}\lpar t\rpar \comma
(A 6)
{{{\rm dI}} \over {{\rm d}t}} \equals \sigma {\rm E}\lpar t\rpar \minus \upsilon {\rm I}\lpar t\rpar \minus \mu {\rm I}\lpar t\rpar \comma
(A 7)
{{{\rm dR}} \over {{\rm d}t}} \equals \upsilon {\rm I}\lpar t\rpar \minus \mu {\rm R}\lpar t\rpar \comma
(A 8)
N\lpar t\rpar \equals {\rm S}\lpar t\rpar \plus {\rm E}\lpar t\rpar \plus {\rm I}\lpar t\rpar \plus {\rm R}\lpar t\rpar \comma

where N(t), S(t), E(t), I(t), and R(t) are the number of total population, susceptible, exposed, infected, and recovery at time t, respectively, λ is the FOI per unit time (year−1), σ is the rate at which an exposed individual becomes infectious per unit time that is equal to 0·143 day−1 (1/measles incubation period of 7 days), υ is the rate at which an infectious individual recovers per unit time (day−1), μ is the birth rate and death rate that is equal to 0·013 year−1 (1/human average lifetime of 75 years), and N is the population number that can be adopted from the Department of Statistics, Minister of the Interior.

DECLARATION OF INTEREST

None.

References

REFERENCES

1. Carabin, H, et al. The cost of measles in industrialized countries. Vaccine 2003; 21: 41674177.CrossRefGoogle Scholar
2. Huang, CL, et al. Humoral and cellular immune response after measles vaccination in Taiwan. Journal of Microbiology, Immunology and Infection 2005; 38: 169175.Google ScholarPubMed
3. Lee, MS, et al. Epidemiology of measles in Taiwan: dynamics of transmission and timeliness of reporting during an epidemic in 1988–9. Epidemiology and Infection 1995; 114: 345359.CrossRefGoogle ScholarPubMed
4. Lee, MS, et al. Protective titres of measles neutralizing antibody. Journal of Medical Virology 2000; 62: 511517.3.0.CO;2-Z>CrossRefGoogle Scholar
5. Lee, MS, et al. Measles seroepidemiology and decay rate of vaccine-induced measles IgG titers in Taiwan, 1995–1997. Vaccine 2001; 19: 46444651.CrossRefGoogle ScholarPubMed
6. Lee, MS, et al. Measles IgG seroprevalence prior to mass vaccination in Taiwan. International Journal of Infectious Diseases 2002; 6: 4247.CrossRefGoogle ScholarPubMed
7. Lee, MS, et al. Seroepidemiology and evaluation of passive surveillance during 1988–1989 measles outbreak in Taiwan. International Journal of Epidemiology 1992; 21: 11651174.CrossRefGoogle ScholarPubMed
8. Edmunds, WJ, et al. The pre-vaccination epidemiology of measles, mumps and rubella in Europe: implications for modelling studies. Epidemiology and Infection 2000; 125: 635650.CrossRefGoogle ScholarPubMed
9. Manfredi, P, et al. Measles elimination in Italy: projected impact of the National Elimination Plan. Epidemiology and Infection 2005; 133: 8797.CrossRefGoogle ScholarPubMed
10. Scott, S, et al. Estimating the force of measles virus infection from hospitalized cases in Lusaka, Zambia. Vaccine 2004; 23: 732738.CrossRefGoogle ScholarPubMed
11. Wallinga, J, et al. Estimation of measles reproduction ratios and prospects for elimination of measles by vaccination in some Western European countries. Epidemiology and Infection 2001; 127: 281295.CrossRefGoogle ScholarPubMed
12. Anderson, RM, May, RM. Infectious Disease of Humans: dynamics and control. Oxford: Oxford University Press, 1991.CrossRefGoogle Scholar
13. Diekmann, O, Heesterbeek, JAP, Metz, AJ. On the definition and the computation of the basic reproduction ratio R 0 in models for infectious diseases in heterogeneous populations. Journal of Mathematical Biology 1990; 28: 365382.CrossRefGoogle ScholarPubMed
14. Diekmann, O, Heesterbeek, JAP. Mathematical Epidemiology of Infectious Disease: model building, analysis and interpretation. New York: John Wiley & Sons, 2000.Google Scholar
15. Edmunds, WJ, OCallaghan, CJ, Nokes, DJ. Who mixes with whom? A method to determine the contact patterns of adults that may lead to the spread of airborne infections. Proceedings of the Royal Society of London, Series B: Biological Sciences 1997; 264: 949957.CrossRefGoogle Scholar
16. Wallinga, J, Edmunds, WJ, Kretzschmar, M. Perspective: human contact patterns and the spread of airborne infectious diseases. Trends in Microbiology 1999; 7: 372377.CrossRefGoogle ScholarPubMed
17. Kanaan, MN, Farrington, CP. Matrix models for childhood infections: a Bayesian approach with applications to rubella and mumps. Epidemiology and Infection 2005; 133: 10091021.CrossRefGoogle ScholarPubMed
18. Dietz, K, Schenzle, D. Proportionate mixing models for age-dependent infection transmission. Journal of Mathematical Biology 1985; 22: 117120.CrossRefGoogle ScholarPubMed
19. Hethcote, HW, Van Ark, JW. Epidemiologic models for heterogeneous populations – proportionate mixing, parameter-estimation, and immunization programs. Mathematical Biosciences 1987; 84: 85118.CrossRefGoogle Scholar
20. Amaku, M, et al. Vaccination against rubella: Analysis of the temporal evolution of the age-dependent force of infection and the effects of different contact patterns. Physical Review E 2003; 67: 051907.CrossRefGoogle ScholarPubMed
21. Earn, DJD, et al. A simple model for complex dynamical transitions in epidemics. Science 2000; 287: 667670.CrossRefGoogle ScholarPubMed
22. Gani, R, Leach, S. Transmission potential of smallpox in contemporary populations. Nature 2001; 414: 748751.CrossRefGoogle ScholarPubMed
23. Scherer, A, McLean, A. Mathematical models of vaccination. British Medical Bulletin 2002; 62: 187199.CrossRefGoogle ScholarPubMed
24. Mills, CE, Robins, JM, Lipsitch, M. Transmissibility of 1918 pandemic influenza. Nature 2004; 432: 904906.CrossRefGoogle ScholarPubMed
25. Chiu, HH, et al. Seroepidemiological study of measles after the 1992 nationwide MMR revaccination program in Taiwan. Journal of Medical Virology 1997; 51: 3235.3.0.CO;2-T>CrossRefGoogle ScholarPubMed
26. Yu, ALF, et al. Varicella transmission in two samples of children with different social behaviour in the State of Sao Paulo, Brazil. Epidemiology and Infection 2001; 127: 493500.CrossRefGoogle ScholarPubMed
27. Glass, K, Kappey, J, Grenfell, BT. The effect of heterogeneity in measles vaccination on population immunity. Epidemiology and Infection 2004; 132: 675683.CrossRefGoogle ScholarPubMed
28. Babad, HR, et al. Predicting the impact of measles vaccination in England and Wales: model validation and analysis of policy options. Epidemiology and Infection 1995; 114: 319344.CrossRefGoogle ScholarPubMed
29. Roberts, MG, Tobias, MI. Predicting and preventing measles epidemics in New Zealand: application of mathematical model. Epidemiology and Infection 2000; 124: 279287.CrossRefGoogle ScholarPubMed
30. Manfredi, P, et al. Measles elimination in Italy: projected impact of the national elimination plan. Epidemiology and Infection 2005; 133: 8797.CrossRefGoogle ScholarPubMed
31. Matthews, L, Woolhouse, M. New approaches to quantifying the spread of infection. Nature Reviews Microbiology 2005; 3: 529536.CrossRefGoogle ScholarPubMed
32. Bjørnstad, ON, Finkenstädt, BF, Grenfell, BT. Dynamics of measles epidemics: Estimating scaling of transmission rates using a time series SIR model. Ecological Monographs 2002; 72: 169184.CrossRefGoogle Scholar
Figure 0

Fig. 1. Quantitative epidemiology of measles outbreak: Number of cases for (a) 1985–1992 and (b) 1993–2004 and age-specific IgG seroprevalence for (c) 1974–1977, 1992–1995, and 2004, and (d) among different populations in mountain, rural, and urban regions.

Figure 1

Table 1. Measles serological survey data and vaccination strategies in Taiwan

Figure 2

Table 2. Estimated age-specific force of infection of measles from 1974 to 2004 in five age groups

Figure 3

Fig. 2. Estimates of age-specific force of infection (FOI). (a) 1974–1977, 1992–1995, and 2004 nationwide vaccination programmes and (b) different populations of mountain (1995–1996), rural (1997), and urban (1997) regions.

Figure 4

Fig. 3. Estimates of age group-specific basic reproduction ratio varied with three contact pattern matrices structures of \tilde{\beta }_{m\setnum{1}} \lpar {a\comma a \hskip .5\prime } \rpar, \tilde{\beta }_{m\setnum{2}} \lpar {a\comma a \hskip .5\prime } \rpar and \tilde{\beta }_{m\setnum{3}} \lpar {a\comma a \hskip .5\prime } \rpar (see Appendix 1). The five age groups are 0–1, 2–3, 4–6, 7–14, and 15–35 years. (a) 1974–1977, (b) 1992–1995, and (c) 2004 nationwide vaccination programmes.

Figure 5

Fig. 4. Age group-/population-specific basic reproduction ratio and force of infection estimates based on specific contact matrix \tilde{\beta }_{m\setnum{2}} \lpar {a\comma a \hskip .5\prime } \rpar. (a, b) Mountain (1995–1996), (c, d) rural (1997), and (e, f) urban (1997) regions.

Figure 6

Fig. 5. Measles vaccination effect on effective reproduction ratio (R0) estimates that derived from eqn (5) using proposed three contact patterns (see Appendix 1) in that R0 estimates averaged out mass regional and nationwide measles vaccination campaigns. The measles vaccination criteria year was set in 1978 to separate pre- and post-vaccination.

Figure 7

Fig. 6. Pre- and post-vaccination dynamics. Time evolution of (a) susceptible, (b) exposed, (c) infected, and (d) recovery numbers of case predicted by a standard SEIR model for age group 2 (2–3 years) from the realistic population.

Figure 8

Fig. 7. Prevaccination age-specific force-of-infection estimates in 1974–1977 represented by response surfaces of SEIR population dynamics.