INTRODUCTION
Dengue is an arboviral infection transmitted by mosquitoes, in particular Aedes aegypti [Reference Gubler and Trent1]. Dengue is the most important emerging viral disease in the subtropics and tropics and accounts for major morbidity, mortality and economic cost in these areas [Reference Gubler2]. The geographical range of dengue transmission is increasing, and global warming has been blamed for the spread of dengue [Reference Wilder-Smith and Gubler3–Reference Griffiths5] Mosquitoes require standing water to breed, as well as warm ambient temperature for adult mosquito feeding behaviour and mortality [Reference Hales6]. Favourable meteorological variables such as temperature, humidity and rainfall may therefore lead to increased vector proliferation [Reference Bangs7–Reference Jury12]. The distinct seasonal fluctuations of dengue in most tropical areas may also be due to weather variables [Reference Hu13]. However, the association between such variables appears to differ from country to country: temperature and relative humidity seem to be strongly correlated in some countries [Reference Brunkard, Cifuentes and Rothenberg9, Reference Koopman14, Reference Wu15], but another study found rainfall but not temperature to be associated with dengue [Reference Chadee16]. Within the same country, there can also be spatial variability in the effect of temperature and rainfall [Reference Thammapalo17]. Such spatial variability requires location-specific identification of main weather and climatic factors associated with dengue activity. In addition to seasonal variability, there appear to be annual oscillations associated with a cyclical pattern with epidemic peaks every 3–7 years [Reference Bangs7, Reference Jury12, Reference Hu13, Reference Hales18, Reference Schwartz19]. The El Niño Southern Oscillation (ENSO) is a systematic pattern of global climate variability which affects the climate with droughts and extended wet periods every 2–7 years [20]. The Southern Oscillation refers to a major air pressure shift between the Asian and east Pacific regions whose best-known extremes are El Niño events. ENSO has been shown to be associated with monthly dengue activity in several countries [Reference Bangs7, Reference Fuller, Troyo and Beier11–Reference Hu13, Reference Cazelles21, Reference Zell22].
Singapore is a city-state in South East Asia, and is endemic for dengue with clear seasonal and year to year variations [Reference Ooi, Goh and Gubler23, Reference Wilder-Smith24]. We investigated the association between weather and ENSO with dengue in Singapore. Our objectives were to assess linkages between microclimate and longer-term ENSO-related weather changes on the weekly notifications of dengue cases in Singapore.
METHODS
Data
Data on weekly human dengue cases were collated from the Weekly Infectious Disease Bulletin, which is freely available on the website of the Singapore Ministry of Health (MOH) [25]. All notified and registered dengue cases were laboratory confirmed. The laboratory assays were polymerase chain reaction (PCR) and/or NS1 antigen (in the first 5 days of illness) and/or a positive dengue IgM after day 5 of illness. The case definition for dengue was based on the 2009 World Health Organization's criteria for dengue, and can be found on the MOH's website [26]. The data were presented in 52 epidemiological weekly intervals for each year between 2001 and 2008. For the same time period, we obtained the following weather variables from the Meteorological Services Division of the National Environment Agency (NEA), Singapore: mean/minimum/maximum daily temperature, mean daily rainfall, mean/minimum/maximum relative humidity, mean hours of sunshine and mean hours of cloud in Singapore.
In order to ensure that the meteorological data was analysed in the same scale as dengue notifications, we aggregated the data into the 52 epidemiological calendar weeks. In addition, we also obtained information on the Southern Oscillation Index (SOI), which is computed using monthly mean sea-level pressure anomalies at Tahiti and Darwin [20]. The SOI is a measure of long-term climate variability, with sustained negative values of the SOI indicating El Niño episodes, with corresponding sustained warming of the central and eastern tropical Pacific Ocean, and positive values of the SOI associated with stronger Pacific winds and warmer sea temperatures to the north of Australia, also known as the La Niña effect [27].
Statistical model
We used a Poisson model, which included extensions to incorporate autocorrelation of the order of 2 in the data as well as overdispersion [Reference Schwartz28], and which was previously applied to air pollution time-series data [Reference Katsouyanni29]. To accommodate annual seasonality in the data, we included a sinusoidal function in the model. The model is briefly described below.
The number of dengue cases at week t is assumed to follow an overdispersed Poisson distribution with mean and variance given as follows:
The sinusoidal function incorporated in the model [Reference Katsouyanni29] was defined by:
The covariance of Y t is assumed to be of the form αA ½RA ½, where A is a diagonal matrix with A t=E(Y t), α is a scalar to account for overdispersion, and R is a symmetric autocorrelation matrix generated by an autoregressive model. The model is run in Stata software (StataCorp., USA) using a code that fits a log-linear model using the iterative weighted least squares method via the nonlinear command. Initial estimates for the model were obtained from a previous standard Poisson regression.
The mean absolute percentage error (MAPE) was used to compare between competing Poisson models, with various autoregressive terms. Models with lower MAPE values indicate a better fit. The calculation of MAPE is given by:
where n is the total number of weeks of data, Y t and ![]() are the observed and predicted number of dengue cases respectively at week t. We found that an autoregressive term of the order of 2 provided the lowest MAPE of 0·47.
are the observed and predicted number of dengue cases respectively at week t. We found that an autoregressive term of the order of 2 provided the lowest MAPE of 0·47.
We performed univariate analyses to identify individual meteorological variables that were related to dengue notifications, and we set out to quantify the optimal lag period (in weeks). For each meteorological variable we ran 13 different univariate models, each encompassing a different lag period (from lag 0 to lag 12 weeks), resulting in a total of 130 models. Starting from the most significant variable identified in the univariate analysis, we sequentially added the next most significant variable, and examined whether the variable remained significant. This process was repeated until we were left with all significant variables in the final multivariate model. In terms of model fit, we looked at whether the residuals had any autocorrelation, by examining the autocorrelation plots. In addition, we looked for interaction effects by outbreak year and periods where El Niño was prevalent. An outbreak year was defined as a year where the maximum weekly number of cases of dengue exceeded twice the standard deviation (i.e. 212) of the mean weekly cases for the entire period (i.e. years 2003, 2004, 2005, 2007, 2008), and El Niño year was an indicator variable created, which took on a value of 1 for years between 2002–2003 and 2006–2007, and 0 otherwise. Data analysis was performed in Stata v. 10.2 (StataCorp) and all tests were evaluated at the 5% level of significance.
RESULTS
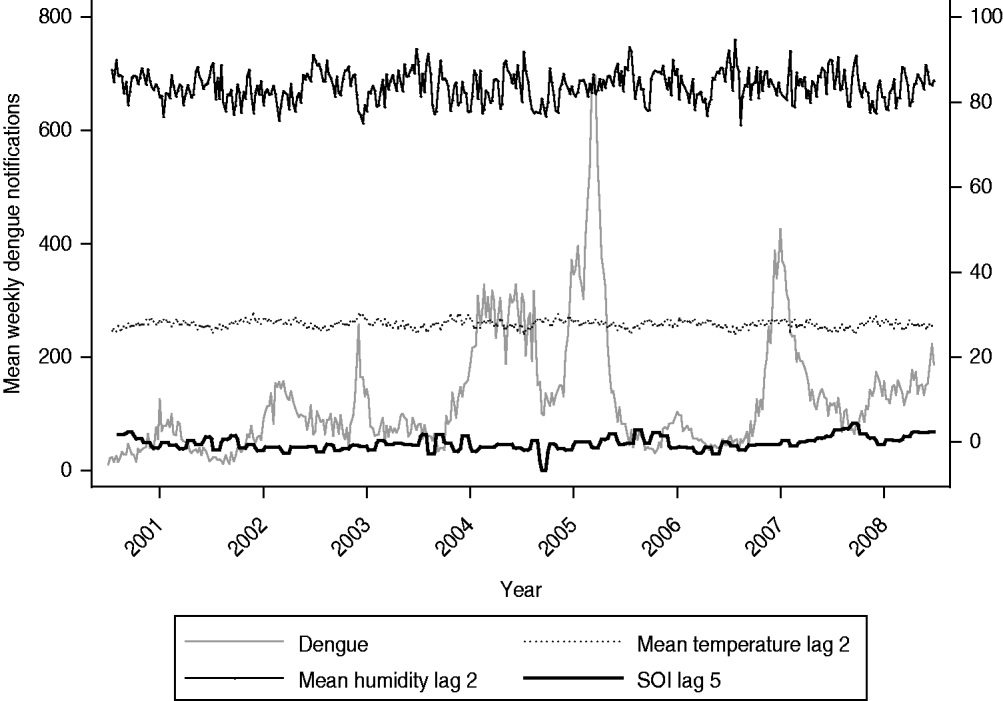
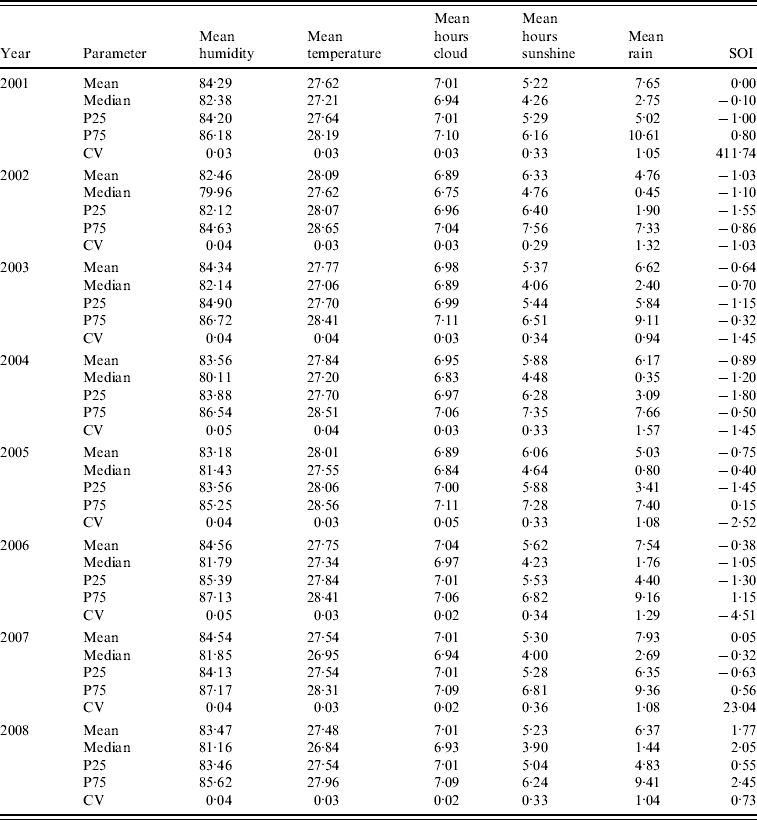
Figure 1 shows surveillance data on dengue notifications exhibiting a clear cyclical trend in Singapore from 2001 to 2008, with peak number of cases generally seen in June or September. Mean weekly cases increased over the years from 2001 to 2005. Subsequently, the number fell to 59 in 2006 and increased again to 167 in 2007 and 130 in 2008. In addition to the seasonal cyclical trends, we also observed that there were five years where the maximum weekly cases surged above the outbreak threshold. In particular, years 2005 and 2007 were characterized by an unusually large number of maximum weekly dengue cases. The total number of dengue cases for these two years was also unusually high. Any statistical model aimed at characterizing dengue trends needs to account for these specific features in the trends. Table 1 describes the SOI values across the years 2001–2008 in Singapore. The SOI values exhibited clear temporal trends, ranging from −1·8 in 2004 to 0·5 in 2008. Similarly, the meteorological variables exhibited seasonal patterns from 2001 to 2008 (Table 1). When we specifically compared the coefficient of variation (CV) across the variables, we observed that rainfall had the largest value, indicating that the weekly variability was much higher for rainfall than for the other variables.

Fig. 1. Weekly dengue notifications, along with humidity, temperature and Southern Oscillation Index (SOI) from 2001 to 2008.
Table 1. Temporal variation in meteorological variables from 2001 to 2008

SOI, Southern Oscillation Index; P25, 25th percentile; P75, 75th percentile,CV, coefficient of variation.
In the univariate analysis (data not shown), we observed a number of variables associated with weekly dengue notifications. For SOI, we found that the effect was strongest at week 5, with a coefficient of −0·03 (P<0·001). There was a significant negative association with mean relative humidity at week 2 (coefficient −0·02, P<0·001). Conversely, for mean temperature, our results indicated a significant positive association with dengue cases at week 2 (coefficient 0·13, P<0·001). Regarding mean hours of cloud, sunshine and amount of rainfall, the relationship was weaker, occurring at weeks 4, 10 and 1, respectively. However, there was a significant correlation between mean temperature and hours of cloud (ρ=−0·41, P<0·001), hours of sunshine (ρ=0·62, P<0·001) and amount of rainfall (ρ=−0·53, P<0·001), indicating presence of confounding.
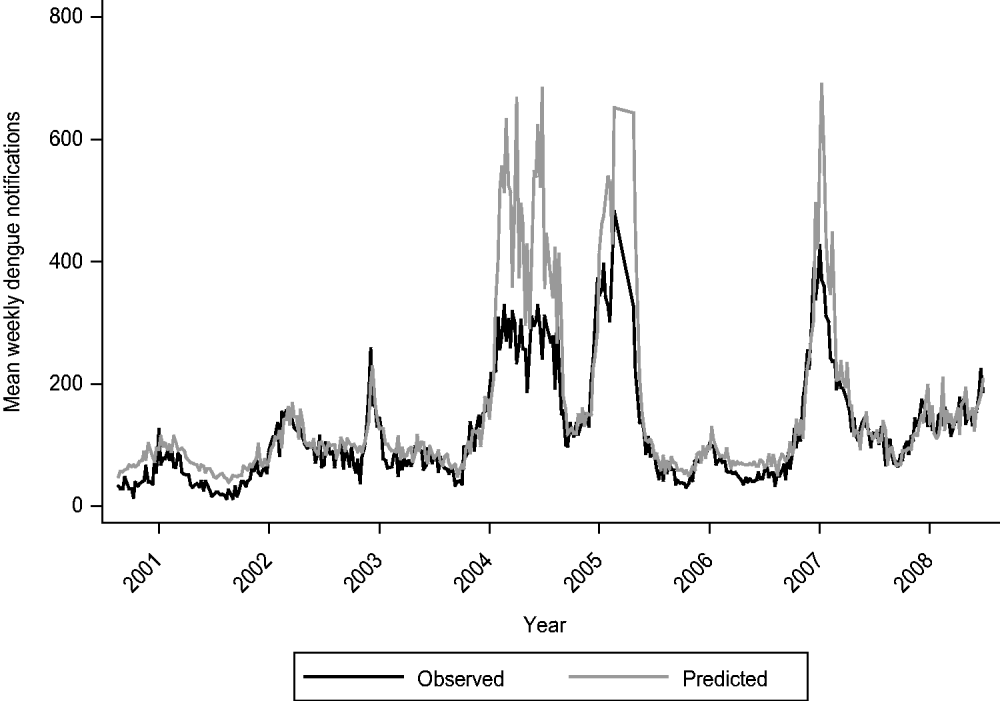
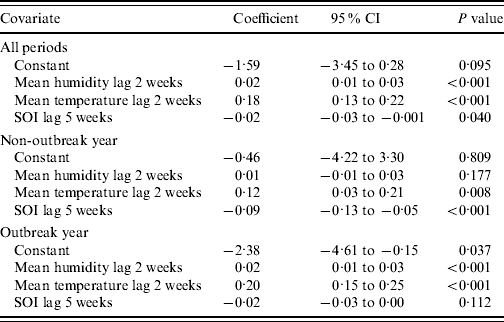
In the multivariate analysis, we found only SOI, mean daily relative humidity, and temperature values to be significantly and independently associated with dengue notifications (Table 2). The coefficients were −0·02 (95% CI −0·03 to −0·001), 0·02 (95% CI 0·01–0·03) and 0·18 (95% CI 0·13–0·22) for SOI, relative humidity and temperature, respectively. Figure 1 highlights the temporal trends in these three variables. Tests for interaction revealed that the effects of SOI, relative humidity and temperature on dengue infections did not vary according to periods where El Niño was prevalent. However, for periods associated with an outbreak, we did find a significant interaction effect (P<0·001 for SOI, P=0·019 for relative humidity, P<0·001 for temperature). In Table 2, we report the results for the multivariate analysis, stratified by outbreak year. Generally, we observed that the effects of weather variables were greater during periods of outbreak, as evident from the larger magnitude of the coefficients. Figure 2 shows the fit between the observed and predicted values from our final multivariate model. In general, the model fit the data well, as shown by a high adjusted r 2 value of 0·91. However, the model tends to over-predict dengue cases during periods of outbreak, and hence the usefulness of our model to predict dengue outbreaks needs further evaluation.

Fig. 2. Observed vs. predicted dengue notifications from 2001 to 2008.
Table 2. Multivariate relationship between dengue fever and the Southern Oscillation Index (SOI) and mean relative humidity and mean temperature

CI, Confidence interval.
Poisson model with adjustment for autocorrelation and seasonality.
DISCUSSION
In this study, we used a Poisson model with autocorrelation terms to explore the relationship between notifications of dengue in Singapore and seasonal meteorological variables and long-term climate variability (SOI). We found that both short-term meteorological alterations (in particular relative humidity and temperature) and long-term climate variability (as measured by the SOI index) worked in tandem to affect the weekly distribution of dengue infections in Singapore. The effect of meteorological variables was more pronounced during periods of dengue outbreaks, and this suggests to us that the relationship between weather and dengue is moderated by periods of known dengue outbreaks. Relative humidity and temperature operated at a lag of 2 weeks, whereas SOI worked at the longer period of 5 weeks. Mean hours of cloud cover, sunshine and rainfall were significantly associated with dengue notifications in the univariate analysis, but not in the multivariate analysis. Only temperature and relative humidity remained significant predictors in the multivariate analysis; the other variables were no longer significant after we accounted for relative humidity and temperature, indicating presence of confounding.
Our finding that relative humidity was positively associated with dengue notifications is consistent with previous findings [Reference Brunkard, Cifuentes and Rothenberg9, Reference Tong and Hu30, Reference Tong, Hu and McMichael31]. Vapour pressure (relative humidity) was shown to be a predictor of dengue risk, with an odds ratio of 1·3 for each unit increase (P<0·001) [Reference Hales6]. We found a lag period of 2 weeks between relative humidity and dengue infections, which was similar to one study [Reference Brunkard, Cifuentes and Rothenberg9], although other studies have reported different lag periods of 0–4 weeks [Reference Tong, Hu and McMichael31], 7 weeks [Reference Depradine and Lovell10], 8 weeks [Reference Tong and Hu30] and 5–20 weeks [Reference Hii32]. Our 2-week lag period for temperature was also different to those lag periods reported in the literature which ranged from 1 week [Reference Brunkard, Cifuentes and Rothenberg9], to 12 and 16 weeks [Reference Depradine and Lovell10], and 0 months [Reference Tong and Hu30] to 2 months [Reference Tong, Hu and McMichael31]. It is plausible that geographical variations could explain these differences, as well as differences in the analytical methods. However, the association between SOI index and dengue that we found in our study is consistent with other studies including sea surface temperature with an 18-week lag [Reference Brunkard, Cifuentes and Rothenberg9], and 2- to 3-year periodic modes of the El Niño effect [Reference Cazelles21].
It is possible to use other statistical models to study time trends in dengue. However, these models have their deficiencies. The use of conventional statistical methods, such as the ordinary least squares linear regression model to study relationships between meteorological factors and health fail to account for the discontinuity or even non-stationarity (i.e. non-constant association) in the relationship between outcome and risk factors [Reference Cazelles and Hales33]. Linear regression models ignore temporal autocorrelation. Autoregressive integrated moving average (ARIMA) models are a useful tool for analysing non-stationary time-series data containing autocorrelation and seasonal trends [Reference Hu13, Reference Hu34]. However, the use of integrated variables in an ARIMA model may bias predicted values. Last, a Poisson regression model with cubic splines on the predictor variables has also been used to model weekly dengue cases from Singapore [Reference Hii32]. The limitations of this model include the inability to incorporate seasonality and the SOI. We used the Poisson regression model, which incorporated seasonality and autocorrelation in the data, as well as including both weather and SOI data in response to deficiencies highlighted in the other studies above.
However, our study also has some limitations. Unmeasured confounders could have affected the results; such confounders include change in serotype, variation in population density of Aedes mosquitoes, and importation of new serotypes. Our relatively short data series did not allow us to undertake any form of adjustment for multiple analysis that we performed in the univariate analysis. Therefore, we focused on the results from the multivariate model. In general, the predicted values from our model agreed well with the actual cases of dengue. However, the model tended to over-predict the number of cases whenever a dengue outbreak occurred, indicating that caution is required when interpreting results whenever there is an outbreak. Comparisons with other time-series models [Reference Jury12, Reference Hu13, Reference Hii32, Reference Hu34, Reference Johansson, Dominici and Glass35] can be made.
Our Poisson time-series model did not account for geographical variation in exposure (weather) as well as outcome (dengue). We did not have access to geographical data (e.g. residential or place of exposure address) to undertake such analysis. The extension of time-series models to incorporate geographical variation will be an important advancement. Linking climate, health, and ecological data by employing new, integrated approaches such as geographical information systems, has been identified as an important research agenda for climate change and infectious disease [Reference Gubler36]. Changes in population density, travel and importation of new dengue virus strains are other factors that contribute to the occurrence of new dengue epidemics and need to be taken into account in future models [Reference Wilder-Smith and Gubler3].
Our model also needs to be prospectively validated to assess out-of-sample predictive ability. We retrospectively looked at the epidemic years of 2005–2006 when the largest dengue outbreak in Singapore occurred. However, there was no special variation in the meteorological variables during or preceding the period of outbreak. A change in the predominant type of dengue infection from DEN-2 to DEN-1 was the most likely cause for this outbreak [Reference Koh37].
The epidemiology of dengue is complex and influenced by many factors in addition to weather and climate variables. However, the temporal association that we found in our study underlines the fact that weather and climate variables can strengthen forecasting models. At this stage, it remains unclear how they can be used operationally for initiation and prioritization of control strategies. Future research will need to evaluate the predictive capability of integrated surveillance systems.
In summary, we found relative humidity and temperature with a 2-week lag and SOI index with a 5-week lag, to be significantly associated with dengue notifications in Singapore. We also found that the effects did not differ markedly according to periods where El Niño was prevalent, but the effect of the weather variables was more pronounced during periods where there was a dengue outbreak. These findings can be incorporated to improve our understanding of temporal variation of dengue in Singapore.
ACKNOWLEDGEMENTS
We thank the Meteorological Services Division of the National Environment Agency of Singapore for providing us with the meteorological data. Funding for this study was received from the Duke-NUS SRP block grant, and the NUS Merit Award.
DECLARATION OF INTEREST
None.


