


Introduction
Influenza is a major cause of morbidity, mortality, and health service utilization around the world [Reference Federici, Cavazza, Costa and Jommi1–Reference Nazareno, Muscatello, Turner, Wood, Moore and Newall3]. Outbreaks and seasonal epidemics result in peaks that place significant strain on acute care services [Reference Nazareno, Muscatello, Turner, Wood, Moore and Newall3, Reference Boyle, Crilly, Keijzers, Wallis, Lind and Sparks4] and economic expenditure [Reference Federici, Cavazza, Costa and Jommi1, Reference Newall and Scuffham5], especially in severe seasons. In Australia, seasonal influenza has been estimated to account for an annual average of 20702 hospitalizations [Reference Nazareno, Muscatello, Turner, Wood, Moore and Newall3]. From 2010 to 2014, Australia’s most populous state, New South Wales (NSW), recorded an average of 22619 influenza-related ED attendances [Reference Muscatello, Bein and Dinh6].
Vaccination is an effective strategy to reduce the population burden of influenza [Reference Machado, Mazagatos, Dijkstra, Kislaya, Gherasim, McDonald, Kissling, Valenciano, Meijer, Hooiveld, Nunes and Larrauri2, Reference Jamotte, Chong, Manton, Macabeo and Toumi7, Reference Kostova, Reed, Finelli, Cheng, Gargiullo and Shay8]. The Australian Government provides free influenza vaccination to individuals aged ≥6 months who are at increased risk of severe influenza-related illness, under the National Immunization Program. In 2017, this included adults aged ≥65 years, pregnant women, individuals with specified medical conditions, and Aboriginal and Torres Strait Islander individuals aged <5 years and ≥15 years [9]. This scheme was subsequently expanded to provide adjuvanted and high-dose influenza vaccines for adults aged ≥65 years from 2018, and to include Aboriginal and Torres Strait Islander individuals of any age from 2019. In 2018, the Victorian Government commenced subsidizing vaccination for all children aged 6 months to 5 years [9]. Vaccination is provided free to hospital and aged care workers, and some health and community services and employers also provide free vaccinations for individuals ineligible for subsidized vaccination under these programmes. Anyone can purchase influenza vaccination privately at their own expense [10].
Vaccine effectiveness (VE) compares the rate of outcomes among vaccinated and unvaccinated populations [Reference Cheng, Holmes, Dwyer, Senanayake, Cooley and Irving11]. The effectiveness of influenza vaccination varies each year depending on the antigenic similarity between the vaccine and circulating viruses, as well as the level of influenza transmission and virulence, vaccination coverage, timing of vaccination in relation to the commencement of seasonal transmission, and population susceptibility, age distribution and health status [Reference Machado, Mazagatos, Dijkstra, Kislaya, Gherasim, McDonald, Kissling, Valenciano, Meijer, Hooiveld, Nunes and Larrauri2, Reference Jamotte, Chong, Manton, Macabeo and Toumi7, Reference Tokars, Rolfes, Foppa and Reed12]. The dynamic nature of seasonal influenza and the many factors influencing VE mean that it can be challenging to interpret the overall impact of influenza vaccination based on VE alone. For example, influenza vaccination with modest VE may still result in substantial population benefits, especially during severe seasons and seasons with high population coverage [Reference Kostova, Reed, Finelli, Cheng, Gargiullo and Shay8, Reference Chung, Rolfes, Flannery, Prasad, O’Halloran and Garg13].
To overcome this issue, the US CDC has developed the influenza burden averted method to more effectively communicate the impact of influenza vaccination on population health [Reference Kostova, Reed, Finelli, Cheng, Gargiullo and Shay8]. This method uses surveillance data for coverage, VE, and influenza-related outcomes to model the additional burden of disease that would have been expected to occur in the absence of influenza vaccination [Reference Kostova, Reed, Finelli, Cheng, Gargiullo and Shay8, Reference Tokars, Rolfes, Foppa and Reed12, Reference Chung, Rolfes, Flannery, Prasad, O’Halloran and Garg13]. This methodology has been applied in various countries around the world [Reference Machado, Mazagatos, Dijkstra, Kislaya, Gherasim, McDonald, Kissling, Valenciano, Meijer, Hooiveld, Nunes and Larrauri2, Reference Kostova, Reed, Finelli, Cheng, Gargiullo and Shay8, Reference Tokars, Rolfes, Foppa and Reed12, Reference Schanzer and Schwartz14], but not yet in Australia. In 2018, Tokars et al. undertook an update and revalidation of this model and developed a revised method with improved accuracy [Reference Tokars, Rolfes, Foppa and Reed12].
In this study, we applied this updated model to calculate the burden of hospitalizations and ED attendances averted by influenza vaccination in Victoria, Australia. We estimated the economic costs associated with influenza-related hospitalizations and ED attendances and the savings associated with the burden averted. We focused on the pre-pandemic period, as COVID-19-related restrictions resulted in major disruptions to influenza transmission from 2020 [Reference Sullivan15].
Methods
We utilized the methods described by Tokars et al. [Reference Tokars, Rolfes, Foppa and Reed12] to estimate the hospitalizations averted by influenza vaccination in Victoria, the second most populous state of Australia, from 1 January 2017 to 31 December 2019 [16], and additionally applied this approach to estimate the number of ED attendances averted. In this model, monthly counts of vaccinations administered in each age group, seasonal VE, and age-group-specific monthly hospitalization and ED attendance counts were used to derive the number of events that would be expected to occur in the absence of vaccination (Supplementary Figure S1). The difference between the number of events expected in the absence of vaccination and the actual number observed was calculated to derive the burden averted by influenza vaccination [Reference Tokars, Rolfes, Foppa and Reed12]. All statistical analyses were conducted in R version 4.1.2. Model inputs are summarized in Table 1.
Table 1. Model inputs: population, vaccine coverage and vaccine effectiveness, Victoria, 2017–2019

a 2017 VE lower 95% CI estimate was -6%, (Reference Cheng, Holmes, Dwyer, Senanayake, Cooley and Irving11) and was therefore assumed to be 0%. (Reference Kelly, Kotsimbos, Reynolds, Wood-Baker, Hancox and Brown23)
b Smoothed vaccine coverage, start and end of season population estimates (all ages).
Data sources: Australian Bureau of Statistics (16), Influenza Complications Alert Network (Reference Cheng, Holmes, Dwyer, Senanayake, Cooley and Irving11, Reference Cheng, Holmes, Dwyer, Senanayake, Cooley and Irving21, Reference Cheng, Dwyer, Holmes, Irving, Simpson and Senenayake22), Victorian Sentinel Practices Influenza Network (Supplementary Figure S1).
Data sources
Hospitalization data were obtained from the Victorian Admitted Episodes Dataset (VAED) between 1 January 2017 and 31 December 2019 [17]. VAED includes demographic, administrative, and clinical data for all admitted patients to public and private hospitals in Victoria. One principal and up to 39 additional diagnostic codes are recorded using the ICD-10-AM coding system [17]. Following the methods of Nazareno et al. [Reference Nazareno, Muscatello, Turner, Wood, Moore and Newall3], we excluded hospitalizations where the care type was classified as elective (planned and routine) or post-mortem for organ donation. Statistical hospitalizations were included as these represent the commencement of a distinct new episode of care [17].
ED attendance data were obtained from the Victorian Emergency Minimum Dataset (VEMD) between 1 January 2017 and 31 December 2019 [18]. VEMD provides demographic, administrative, and clinical data for individuals attending public and private EDs within Victoria. One principal and up to two additional diagnoses are recorded using ICD-10-AM codes. Reporting diagnoses is optional for private hospitals [18]; however, in Australia, 96% of emergency department (ED) care is provided in public hospitals [19].
For both VAED (hospitalizations) and VEMD (ED attendance), influenza-related events were defined as hospitalizations or ED attendances where an influenza-related diagnostic code was recorded in any diagnostic field. Two well-established case definitions for influenza-related events were evaluated. The first was defined by events with an influenza-specific ICD-10-AM code (J09-J11), and the second by events with a pneumonia and/or influenza (P&I) (J09-J18) diagnostic code [Reference Nazareno, Muscatello, Turner, Wood, Moore and Newall3, Reference Wabe, Li, Lindeman, Post, Dahm and Li20].
Population data for Victoria were accessed using publicly available data from the Australian Bureau of Statistics [16]. Mid-year quarterly estimates were used as estimates of the annual population for each age group. As age is recorded as whole numbers within this dataset, half of those with age recorded as 0 years were removed to account for those aged <6 months who are ineligible for influenza vaccination.
VE estimates were obtained from the Influenza Complications Alert Network, a hospital-based sentinel surveillance network. These VE estimates were calculated using test-negative studies for individuals admitted to sentinel hospitals within Australia during each influenza season within the study period. To calculate VE, vaccination rates were compared between cases, hospitalized individuals who tested positive for influenza via nucleic acid detection, and controls, frequency-matched hospitalized individuals with acute respiratory infections who tested negative for influenza [Reference Cheng, Holmes, Dwyer, Senanayake, Cooley and Irving11, Reference Cheng, Holmes, Dwyer, Senanayake, Cooley and Irving21, Reference Cheng, Dwyer, Holmes, Irving, Simpson and Senenayake22]. In contrast to case identification in this study, which relied on ICD-10-AM codes, this process relied on active case finding [Reference Kelly, Kotsimbos, Reynolds, Wood-Baker, Hancox and Brown23]. All-age estimates of VE were used, as age group-specific estimates were of low precision in most instances. Low and high VE estimates were obtained from 95% confidence limits. Confidence intervals (CI) with a lower bound <0% were truncated to 0% [Reference Bodner, Irvine, Kwong and Mishra24].
Monthly estimates of the proportion of the population vaccinated against influenza within each influenza season were obtained from the Victorian Sentinel Practices Influenza Network (VicSPIN), a collection of primary care clinics participating in sentinel influenza surveillance [Reference Price, Carville and Sullivan25]. The number of attendees presenting with influenza-like illness who tested negative for influenza was used to calculate monthly estimates of the proportion of the population that was vaccinated, with 95% CI. The number of attendees was insufficient to calculate age-group-specific coverage estimates. Estimates were smoothed to account for fluctuations in monthly estimates generated by variations in sampling by performing ordinary least squares linear regression of the monthly proportion of vaccinated individuals within the sample against the log of the month within each year of the study (Supplementary Figure S2). Proportions were multiplied by population to estimate monthly counts of vaccinated individuals in each age group.
Compartmental model of averted hospitalizations and ED attendance
The compartmental model of seasonal influenza transmission used to derive the number of events that would be expected to occur in the absence of vaccination is detailed in Supplementary Figure S1 [Reference Tokars, Rolfes, Foppa and Reed12]. In this model, the infection rate is estimated as the number of cases occurring per month in the entire susceptible population. The difference between the number of events expected in the absence of vaccination and the actual number observed was calculated to derive the burden averted by influenza vaccination [Reference Tokars, Rolfes, Foppa and Reed12].
We utilized the best-performing compartmental model (Primary Model) validated by Tokars et al. [Reference Tokars, Rolfes, Foppa and Reed12]. In this model, all population members start each season as susceptible (non-vaccinated and non-cases) and move through six compartments on a monthly timescale based on whether they are: ill or well; vaccinated or unvaccinated; and immune or susceptible. Proportions infected and vaccinated are calculated by applying current-month case and vaccination counts to prior-month compartment values, with no immune lag or indirect protection assumed. Infected persons are assumed to become immune to further infection, whereas vaccinated persons may develop complete immunity or remain fully susceptible. Vaccinations are assumed to be given with equal frequency to previously infected and uninfected individuals; however, this does not affect the immunity of previously infected cases, who are assumed to have already attained complete immunity [Reference Tokars, Rolfes, Foppa and Reed12].
Modelled scenarios
In our base case scenario, central estimates of VE and coverage were used. The high scenario was generated using the upper 95% confidence limits for VE and coverage, and the low scenario was generated using the lower 95% confidence limits. Additionally, a hybrid scenario was run with varying VE and coverage across age groups to approximate variations observed in national and more recent datasets [Reference Cheng, Holmes, Dwyer, Senanayake, Cooley and Irving11, Reference Cheng, Holmes, Dwyer, Senanayake, Cooley and Irving21, Reference Cheng, Dwyer, Holmes, Irving, Simpson and Senenayake22, 26]. The hybrid scenario assumed vaccination coverage was at the central estimate for the 0.5 – 4 year and 50 – 64 year age groups, the low estimate for the 5 – 14 year and 15 – 49 year age groups, and the high estimate for the ≥65 year age group. It also assumed the low VE estimate for the ≥65 year age group and the central estimate for all other age groups, as lower VE is often observed in those aged ≥65 years [Reference Cheng, Holmes, Dwyer, Senanayake, Cooley and Irving11, Reference Cheng, Holmes, Dwyer, Senanayake, Cooley and Irving21]. Results were reported as absolute numbers, rates per 100000 population, and the prevented fraction of observed events [Reference Machado, Mazagatos, Dijkstra, Kislaya, Gherasim, McDonald, Kissling, Valenciano, Meijer, Hooiveld, Nunes and Larrauri2].
Sensitivity analyses
A sensitivity analysis was performed, limiting influenza-related cases to those where selected diagnostic codes only appeared as the principal diagnosis. Additional analysis was also performed for influenza-specific hospitalizations (J09-J11) using the version of the compartmental model (Alternative Model) that was utilized prior to the update performed by Tokars et al. (Supplementary Table S1) [Reference Tokars, Rolfes, Foppa and Reed12]. This method incorporates a 14-day immune lag by averaging vaccination coverage across the current and prior month and applies coverage and VE to all susceptible persons (not infected or effectively vaccinated).
Economic analysis
We estimated the costs associated with observed influenza-related hospitalizations and ED attendances in Victoria, as well as the savings associated with the burden averted by vaccination. To do this, we conducted an economic analysis using a simplified model of the Australian national efficient cost determination, as set by the Independent Hospital and Aged Care Pricing Authority (IHACPA) [27].This was conducted for the scenarios yielding the most credible results, based on comparison to previous studies – influenza-specific (J09-J11) hospitalizations and P&I (J09-J18) ED attendances.
Australian Refined Diagnosis Related Group (AR-DRG) version 8.0 codes were available in the VAED for all study years and were used to identify price weights for each hospitalization [27–29]. For hospitalizations, these were adjusted to account for length of stay, hours spent in an intensive care unit (ICU) for AR-DRG codes where ICU admission was not bundled, paediatric admissions, patient residential remoteness status, and Indigenous status [27]. Adjusted price weights for each event were used to generate an average price weight per hospitalization across the study period, which was then applied to the national efficient price of an acute care episode per calendar year to determine the average cost per influenza-related hospitalization for each year of the study [27–29]. This was then multiplied by the number of observed hospitalizations to estimate the costs of hospitalizations and by estimates of averted hospitalizations to calculate savings. All hospitalizations were analyzed according to public hospital costings. All results were adjusted to 2022 Australian Dollars, accounting for inflation [30].
The same method was used for ED attendance with more limited price weight adjustments, in line with the national efficient cost determination. Adjustments for ED attendance were for patient residential status, Indigenous status, and advanced age [27].
The estimated total costs of observed events and savings of averted events were reported for each year of the study period. Information regarding total costs of delivering influenza vaccination programmes in Victoria was not available for comparison because costs are spread across the state and federal governments as well as multiple private entities.
Ethical statement
Ethical approval for data access, analysis, and result distribution was provided by the Victorian Government Department of Health and Department of Families, Fairness and Housing Human Research Ethics Committee, reference 80628, and the Australian National University Human Research Ethics Committee, reference 2022/213.
Results
Observed hospitalizations and ED attendances
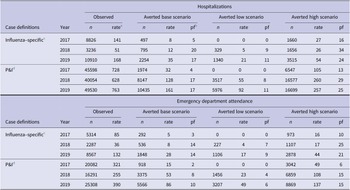
From 2017to 2019, there were 22972 hospitalizations and 16168 ED attendances with influenza-specific diagnoses and 135182 hospitalizations and 61681 ED attendances with P&I diagnoses (Table 2). The number of events was highest in 2019, followed by 2017, with 2018 having substantially lower numbers. In total, 95% of hospitalizations in the P&I scenario and 96% of hospitalizations in the influenza-specific scenario were classified as emergency admissions. The care type of remaining hospitalizations is summarized in Supplementary Table S2.
Table 2. Total influenza-related hospitalizations and ED attendances averted by influenza vaccination reported by year, selected scenarios, Victoria, 2017 – 2019

a Rate per 100000 population.
b Pf – prevented fraction = (events averted / [events averted + events])*100.
c Influenza-specific denotes events with an ICD-10-AM J09-J11 code in any diagnostic field.
d P&I denotes pneumonia and influenza events with an ICD-10-AM J09-J18 code in any diagnostic field.
For hospitalizations in the influenza-specific scenario, 72.6% had a J09-J11 diagnosis recorded in the principal diagnostic field, with an additional 16.1% in the second, 4.2% in the third, and <2% in subsequent fields. For hospitalizations in the P&I scenario, 59.9% had a J09-J18 diagnosis recorded in the principal field, with an additional 15.8% in the second, 5.9% in the third, 3.0% in the fourth, 2.9% in the fifth, 2.4% in the sixth, and <2% in all subsequent fields (Supplementary Table S3).
For ED attendances in the influenza-specific scenario, 96.1% had a J09-J11 diagnosis recorded in the principal diagnostic field, with an additional 3.7% in the second and 0.2% in the third. For ED attendances in the P&I scenario, 96.4% had a J09-J18 diagnosis recorded in the principal diagnostic field, with an additional 3.3% in the second and 0.3% in the third (Supplementary Table S3).
The highest rates of hospitalizations in each year studied occurred in the ≥65 year age group across all scenarios. This was followed by the 50 – 64 year and 0.5 – 4 year age groups for influenza-specific and P&I hospitalizations and P&I ED attendances (Table 3). For ED attendances in the influenza-specific scenario, observed rates were more evenly distributed among those aged <65 years.
Table 3. Annual average influenza-related hospitalizations and ED attendances averted by influenza vaccination by age group, Victoria, 2017 – 2019

a Hybrid scenario assumptions: vaccination coverage – central estimate used for 0.5 – 4 year and 50 – 64 year age groups, low estimate for 5 – 14 year and 15 – 49 year age groups, and high estimate for 65+ year age group; vaccination effectiveness – low estimate for 65+ year age group and central estimate for all others.
b Rate per 100000 population.
c Influenza-specific denotes events with an ICD-10-AM J09-J11 code in any diagnostic field.
d P&I denotes pneumonia and influenza events with an ICD-10-AM J09-J18 code in any diagnostic field.
Hospitalizations and ED attendances averted by influenza vaccination
Influenza vaccination averted hospitalizations and ED attendances across all estimates in all years, except for the low scenario estimates in 2017, where VE was 0%, compared to 15% in the base scenario. Influenza vaccination reduced influenza-related events at the peak of the influenza season (Figure 1). The rate of averted events was influenced by the baseline number and timing of observed events relative to vaccination, level of coverage and VE for each year. Although there was a high number of hospitalizations in 2017, VE was significantly lower than other years at 15% (95% CI, 0% – 32%), and early season coverage was also relatively low. Of the three study years, 2019 had the highest rate of baseline events, highest vaccination coverage, and moderate VE at 43% (95% CI, 36% – 49%). Comparatively, 2018 was the year with the lowest number of baseline events but the highest VE at 56% (95% CI, 44% – 65%) and mid-ranking coverage (Table 1).

Figure 1. Observed influenza-related hospitalizations and ED attendances vs modelled events in the absence of influenza vaccination, Victoria, 1 January 2017 to 31 December 2019. Influenza-specific hospitalizations defined as events with a J09-J11 ICD-10-AM code in any diagnostic field. P&I ED attendances defined as events with a J09-J18 ICD-10-AM code in any diagnostic field. Points indicate the central estimate, linked by lines to show the epidemic curve of influenza-related events. Shaded regions indicate the level of uncertainty around each central estimate (range). Data sources: VAED (hospitalizations) and VEMD (ED attendances).
Accordingly, for the influenza-specific scenario, 2019 had the highest rate of hospitalizations and ED attendances averted, at 35 [range: 21 – 54] and 28 [17 – 44] per 100000 population, respectively (Table 2). Base and low scenario estimates of averted hospitalizations were higher in 2018 compared to 2017, at 12 [5 – 26] and 8 [0 – 27], respectively, with similar estimates in the high scenarios across both years. This was also true for rates of averted ED attendances, which were 8 [4 – 17] in 2018 and 5 [0 – 16] in 2017, respectively.
In the P&I scenario, the highest rate of averted events occurred in 2019 and the lowest in 2017, for hospitalizations, 161 [range: 92 – 257] and 32 [0 – 105], and ED attendance, 86 [range: 49 – 137] and 15 [0 – 49], respectively. The prevented fraction of events was approximately equal in 2018 and 2019 for hospitalizations at 17% [range: 8% – 29%] in 2018 and 17% [11% – 25%] in 2019, and also for ED attendance at 8% [4% – 15%] in 2018 and 10% [6% – 15%] in 2019.
In all scenarios, the highest rate of hospitalizations and ED attendances averted occurred in the ≥65 year age group (Table 3). This was followed by the 6 month to 4 year and 50 – 64 year age groups for hospitalizations (influenza-specific and P&I) and P&I ED attendance. The rate of influenza-specific ED attendance averted was comparatively similar among age groups <65 years.
In the hybrid influenza-specific and P&I scenarios (Table 3, Supplementary Table S4), the number of events averted in the ≥65 year age group was predictably lower in 2017 (which had 0% VE) compared to the baseline scenario, but higher in 2018 and 2019, where lower VE was offset by higher coverage. The overall rates of hospitalizations and ED attendance averted in the hybrid scenario were marginally lower across the three-year study period compared to the primary analysis.
The burden and burden averted by age group for each year are presented in Supplementary Tables S5 and S6. Rates of hospitalizations were lower in sensitivity analysis scenarios with cases defined by principal diagnosis only (Supplementary Table S7). Results for the Alternative Model were minimally different to the Primary Model (Supplementary Table S8).
Economic analysis
The modelled costs of influenza-specific hospitalizations equated to an annual average of A$62748000 or A$18824400 over the study period. The modelled costs of P&I ED attendances equated to an annual average of A$22329000 or A$66986000 over the study period (Table 4).
Table 4. Estimated costs of observed influenza-related hospitalizations and ED attendances and savings related to hospitalizations and ED attendances averted by influenza vaccination, Victoria, 2017 – 2019

Notes: Average price weighting calculated as 1.45051 for hospitalizations and 0.1923187 for ED attendances. Average savings per event is given by the National Efficient Price multiplied by the average price weighting. All figures reported in 2022 Australian Dollars [29], rounded to the nearest dollar.
The modelled savings of influenza-specific averted hospitalizations were A$29107000 over the study period [range: A$13722000 – A$56007000] (Table 4). The modelled savings for averted P&I ED attendance were estimated to be A$10724000 [range: A$5078000 – A$20400000] over the study period.
Discussion
Observed hospitalizations and emergency department attendances
This study produced estimates of the baseline burden of influenza-related hospitalizations and ED attendances in Victoria, Australia, and calculated the burden averted by influenza vaccination. The scenario based on an influenza-specific diagnosis in any field most closely aligned with the estimated burden of influenza-related hospitalizations in key studies from Australia [Reference Nazareno, Muscatello, Turner, Wood, Moore and Newall3, Reference Moa, Menzies, Yin and MacIntyre32]. Influenza-related morbidity fluctuates yearly, such that comparisons within the same year are most relevant [Reference Machado, Mazagatos, Dijkstra, Kislaya, Gherasim, McDonald, Kissling, Valenciano, Meijer, Hooiveld, Nunes and Larrauri2, Reference Boyle, Crilly, Keijzers, Wallis, Lind and Sparks4, Reference Muscatello, Bein and Dinh6]. Nazareno et al. estimated 171 (95% CI, 147 – 190) influenza-related respiratory hospitalizations per 100000 population in 2017 in Australia using a multiple linear time series regression model [Reference Nazareno, Muscatello, Turner, Wood, Moore and Newall3]. Moa et al. determined through a semi-parametric generalized-additive model that the rate of respiratory hospitalizations attributable to influenza was 139 (95% CI, 130 – 149) per 100000 in the 50 – 64 year age group and 638 (95% CI, 609 – 667) per 100000 in the ≥65 year age group in Australia in 2017 [Reference Moa, Menzies, Yin and MacIntyre32]. In 2017, we calculated the baseline rate of influenza-specific hospitalizations to be 141 per 100000 for all age groups, 123 per 100000 in the 50 – 64 year age group, and 551 per 100000 in the ≥65 year age group (Supplementary Table S5). These results are comparable but suggest our results underestimate influenza-related hospitalizations, compared to studies using modelling techniques that facilitate the use of a broader range of ICD-10-AM codes to identify baseline rates of influenza-related events. This finding is consistent with data linkage studies that have concluded influenza-specific diagnostic codes do not identify all hospitalizations of individuals with a laboratory confirmed influenza diagnosis [Reference Wabe, Li, Lindeman, Post, Dahm and Li20, Reference Lim, Blyth, Fathima, de Klerk and Moore33].
For ED attendance, the P&I scenario yielded results that were the most comparable to previous studies, although direct comparisons within influenza seasons were not available. Muscatello et al. estimated that from 2010 to 2014, the rate of all-cause influenza-related presentations to NSW EDs was 309 (99.9% CI, 208 – 410), using a time series regression analysis [Reference Muscatello, Bein and Dinh6]. The observed baseline rate of P&I ED attendances in our study was 322 per 100000 population. The marginally higher estimate in our study is not unexpected, as we evaluated two seasons (2017 and 2019) with high influenza burden [Reference Cheng, Holmes, Dwyer, Senanayake, Cooley and Irving11, Reference Cheng, Dwyer, Holmes, Irving, Simpson and Senenayake22]. There has also been an observed trend in Australia towards increased influenza-related presentations to EDs, accompanied by decreased hospitalization rates [Reference Boyle, Crilly, Keijzers, Wallis, Lind and Sparks4, Reference Dinh, Berendsen Russell, Bein, Chalkley, Muscatello and Paoloni34]. Compared with international studies, our estimates remained lower than ED attendance rates for influenza-related illness in the United States (486 per 100000 from 2016 to 2018) [Reference Reid and Fingar35] and Canada (500 per 100000 from 2003 to 2009, excluding the 2009 influenza A (H1N1) pandemic) [Reference Schanzer and Schwartz14].
Observed ED attendance rates in our study were substantially lower in the influenza-specific scenario, at only 85 per 100000 population. These results likely reflect a tendency to use more general diagnostic codes in the ED setting, where patients typically spend a brief period of time before being admitted or discharged, with influenza testing often pending at the time of departure or not performed [Reference Boyle, Crilly, Keijzers, Wallis, Lind and Sparks4, Reference Dinh, Berendsen Russell, Bein, Chalkley, Muscatello and Paoloni34]. The P&I scenario appears to be a better approximation of influenza-related ED attendance. However, further research is needed to validate the use of ICD-10-AM codes in this setting.
Hospitalizations and ED attendance averted by influenza vaccination
Under the selected scenarios (J09-J11 for hospitalizations and J09-J18 for ED attendances), we estimated that influenza vaccination averted an annual average of 1182 [range: 556 – 2277] hospitalizations and 3286 [1554 – 6257] ED attendances in Victoria. Vaccination also resulted in reduced hospitalizations and ED attendances at the peak of each influenza season, which is especially important for mitigating health service demand [Reference Sivey, McAllister, Vally, Burgess and Kelly36]. Benefits were generally greatest in the ≥65 year age group, where individuals face the greatest risk of severe illness following influenza infection [Reference Nazareno, Muscatello, Turner, Wood, Moore and Newall3].
Only in 2017, in the low scenario with 0% VE, were there no apparent benefits to vaccination. This highlights the challenge of optimizing antigenic matching between vaccine viruses and viruses circulating in the community in the setting of continual antigenic drift and shifting subtype predominance. It also highlights the potential benefits of developing technologies to boost VE [Reference Jamotte, Chong, Manton, Macabeo and Toumi7]. Although difficult to compare seasons, the decision to fund free high-dose and adjuvanted vaccines for adults aged ≥65 years after the 2017 season [9], may have contributed to the higher VE seen in 2018 and 2019 [Reference Nguyen, Pugliese, Ruiz-Aragón, Urueña and Mould-Quevedo37]. Ongoing efforts to improve VE and coverage have the potential to increase the benefits of influenza vaccination [Reference Hughes, Reed, Flannery, Garg, Singleton and Fry38].
Economic analysis
Our estimate of A$13 [range: A$6 – A$25] million per year includes savings to the hospital system in Victoria and does not account for savings associated with prevented general practice consultations, lost days of work, or premature deaths. As with our calculations of hospitalizations and ED attendance averted, this is likely to be an underestimate of hospital savings due to low estimates of averted events. We calculated the total costs of influenza-related hospitalizations to be A$63 million per year in Victoria from 2017 to 2019. In comparison, Newall et al. calculated annual average influenza-related hospitalization costs in Australia to be A$160 million over the period from 1998 to 2005 [Reference Newall and Scuffham5] (adjusted from 2005 to 2022 A$ accounting for inflation) [29], with Victoria making up one quarter of Australia’s population between 1998 and 2019 [39]. The proportionately higher cost estimate in our study reflects a greater number and rate of hospitalizations (120 vs 106 per 100000 population), as Newall et al. utilized marginally higher cost estimates per hospitalization, which were also based on standardized national pricing [Reference Newall and Scuffham5]. Population growth, seasonal variability, an increasing proportion of the population aged ≥75 years, and a trend towards higher hospitalization rates with shorter lengths of stay may all account for the higher rates of hospitalizations observed in our study, in addition to methodological differences [Reference Reid, Gamage, Duckett and Gray40]. Newall et al. also estimated the annual average costs of general practice consults for influenza-related illness to be A$16 million [Reference Newall and Scuffham5], accounting for inflation [30]. Extrapolating their finding of 10% of hospital costs to our study would imply A$6.3 million in costs associated with influenza-related general practice visits per year in Victoria from 2017 to 2019. Improving VE and coverage would result in further cost reductions, as well as population health benefits [Reference Jamotte, Chong, Manton, Macabeo and Toumi7].
Limitations
There is inherent uncertainty in the approach used in this study, which aims to quantify influenza burden in the hypothetical scenario of no vaccination [Reference Tokars, Rolfes, Foppa and Reed12]. Specific limitations include uncertainty around the accuracy of ICD-10-AM codes, as well as estimates of VE and coverage. Inaccuracies in any of these parameters could result in over- or underestimation of the burden of hospitalizations and ED attendances averted. There is considerable uncertainty around the accuracy of ICD-10-AM codes to estimate the number of influenza-related ED attendances. Although the P&I scenario produces more realistic estimates than the influenza-specific scenario, these should be considered a proxy measure, as there are both underestimation of the number of influenza cases and inclusion of some pneumonia cases related to alternative pathogens.
To mitigate uncertainty in VE and coverage estimates, we have incorporated scenarios utilizing 95% confidence limits for these parameters. We utilized VE estimates from the FluCAN network, which estimates VE against hospitalization with laboratory confirmed influenza, as the most comparable VE estimate available. Similar to our study, this estimate is concerned with VE in patients attending hospitals. However, unlike our study, these VE estimates utilize a case definition based on patients admitted to the hospital with a respiratory illness that has been laboratory-confirmed to be influenza rather than specified ICD-10-AM codes. VE estimates may also be less accurate for ED attendances in our study, as these cases did not necessarily proceed to admission. Differences in the outcomes used for VE calculation may lead to over- or underestimation of the estimated burden averted. VE can vary within an influenza season. However, as VE estimates used are averages generated across the duration of each year’s influenza season, they approximate the average protection conferred by vaccination [Reference Cheng, Holmes, Dwyer, Senanayake, Cooley, Irving, Simpson, Korman, Macartney, Friedman, Wark, Howell, Blyth, Crawford, Buttery, Bowler, Upham, Waterer, Kotsimbos and Kelly41–Reference Cheng, Holmes, Dwyer, Senanayake, Cooley and Irving43].
Sample sizes were insufficient to estimate vaccination coverage by month within each age group. We have accounted for potential variation in VE and coverage across age groups by incorporating a hybrid scenario, which used national and more recent estimates, to approximate and assess the impact of such variations. Following changes to legislation, influenza vaccinations administered in Australia have been required to be mandatorily reported to the Australian Immunisation Register since March 2021. Estimates for population coverage since this date are available from national data and no longer need to rely on sentinel surveillance platforms [44].
We have not accounted for the indirect benefits of vaccination or assessed the burden of non-respiratory influenza-related events in instances where an influenza diagnostic code was not also recorded. This is likely to result in underestimation of the burden averted by influenza vaccination. We have also not assessed the effects of prior immunity from vaccination or infection, as Tokars et al. did not find this significantly affected results [Reference Tokars, Rolfes, Foppa and Reed12].
Conclusions
Our study has demonstrated that calculating the number of influenza-related hospitalizations and ED attendances averted by vaccination is feasible in Victoria and, by extension, Australia. The selection of ICD-10-AM codes and the definition of influenza-related events influence the calculated burden and may introduce greater uncertainty for ED attendances, where there are fewer established estimates for comparison. Influenza vaccination results in important reductions in hospital utilization and expenditure, including at the peak of the influenza season.
Supplementary material
The supplementary material for this article can be found at http://doi.org/10.1017/S0950268824001122.
Data availability statement
Data related to this study are available in the Supplementary Material or via publicly available resources, as listed. The R package used to run the compartmental model is available from Github [Reference Kvorov31]. Further information can be requested from the corresponding author.
Acknowledgements
The authors would like to acknowledge the Victorian Department of Health as the source of VAED and VEMD for this study.
Author contribution
Conceptualization: S.G.S.; Methodology: S.G.S., S.N., A.K., C.G.A.P.; Supervision: S.G.S., J.S., M.R.R.; Writing – review & editing: S.G.S., J.S., S.N., A.K., M.R.R., C.G.A.P.; Data curation: J.S., C.G.A.P.; Validation: S.N., A.K.; Visualization: A.K., C.G.A.P.; Formal analysis: C.G.A.P.; Investigation: C.G.A.P.; Writing – original draft: C.G.A.P.
Funding statement
The WHO Collaborating Centre for Reference and Research on Influenza is supported by the Australian Government Department of Health and Aged Care. No specific funding was received for this work.
Competing interest
C.G.A.P., A.K., S.N., M.R.R., and J.S. – nothing to declare. S.G.S. has received honoraria from CSL Seqirus, Moderna, Pfizer, and Evo Health. The WHO Collaborating Centre for Reference and Research on Influenza has a collaborative research and development agreement (CRADA) with CSL Seqirus for isolation of candidate vaccine viruses in cells and an agreement with IFPMA for isolation of candidate vaccine viruses in eggs.


 Open access