INTRODUCTION
In The Netherlands, in several newly built residential areas, a newly developed dual water distribution system was implemented. Based on an ecological principle of reduced drinking water usage, partially treated surface water (known as grey water), instead of drinking water subjected to advanced water treatment processes, was used for low-key household purposes, such as toilet flushing, washing machines and, in some areas, garden taps. At one location, production of grey water included subsequent coagulation, flocculation, sedimentation followed by rapid sand filtration of surface water. The partially treated grey water was either transported to the households as grey water or subjected to advanced water treatment plants, including dune filtration, to produce drinking water for the same households (Fig. 1).
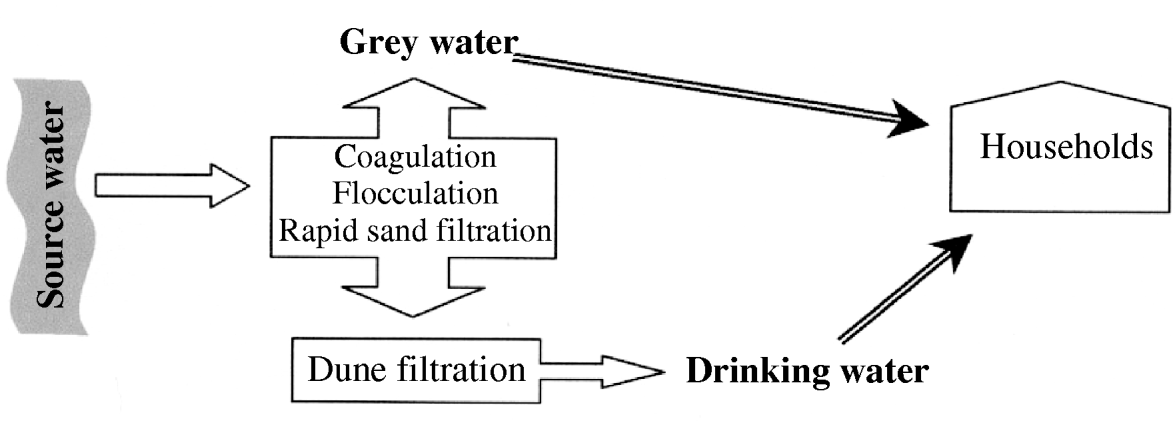
Fig. 1. Schematic representation of the processes behind the dual water system in The Netherlands.
Before this system was implemented, studies were conducted to estimate the normal daily exposure of an individual to grey water and to drinking water. In these studies it was estimated that an individual in The Netherlands will ingest a daily amount of <10 ml of grey water (mostly through aerosols), and 200 ml of unboiled tap water [Reference Versteegh, Evers and Havelaar1, Reference Medema, Brouwer and de Graaf2].
Until now, the public health impact of the use of dual water systems such as this one has not been studied. Because a large number of people are exposed daily to grey water through this system, extensive environmental and risk assessment studies are being carried out in The Netherlands. Although the health consequences of drinking unboiled grey water are unknown, the source water for the production of grey water and drinking water at the study location is used for recreational purposes without any form of treatment. In a new housing estate in the central part of The Netherlands, the dual water system serves 30 000 households. On 3 December 2001, two individuals living in one neighbourhood of this new housing estate complained about an unusual odour and taste of the tap water. The water company took samples of the tap water on 4 December, which showed an abnormal count of total coliform bacteria. On 29 November 2001, after maintenance work, the drinking water system had been connected to the grey water system in order to flush and clean it. Due to an oversight, the cross-connection was not removed when the grey water system was again put into operation, and accidental higher pressure in the grey water system caused grey water to circulate into the drinking water pipes.
On 6 December, triggered by the announcement of a boiling water advice given by the water company on 5 and 6 December, one general practitioner (GP) from the affected area informed the local public health service of an excessive number of patients with nausea, vomiting and diarrhoea attending his practice over the previous days.
On 6 December, the connection between the two systems was removed and on 17 December, after 5 days of total Escherichia coli counts below the mandatory level, the boiling advice was withdrawn.
Two studies were performed to assess if drinking grey water was associated with an increased occurrence of gastroenteritis (GE) in this new housing estate.
METHODS
On 20 December 2001, a retrospective cohort study was started. The affected area (area A) was compared to a reference area (area B) in terms of incidence of households reporting gastrointestinal complaints. A dose–response relation between water consumption and occurrence of GE was tested, and the distribution of pathogens in stool samples from both areas was studied. In addition, environmental investigations were performed in order to compare pathogens in stools and water.
In parallel, the incidence of general practice consultations for GE in the affected area (A) was compared with the incidence of consultations in two control areas (B and C) of the same housing estate.
Cohort study
Study population
A list with the 938 possibly exposed household addresses was obtained from the water company (area A). The municipality provided a list of 1613 non-exposed household addresses from the area adjacent to the exposed area (area B) in the same housing estate. Anticipating a higher non-response among the non-exposed, it was decided to invite all households in area B to participate.
Area B also had the dual water system and was likely to be similar to the exposed population with regard to socioeconomic status, age distribution and time of residence in the area.
Case definition
A case of GE was defined as a household from area A or B, in which at least one person reported having diarrhoea (⩾3 loose stools in 24 h) with onset from 29 November to 9 December 2001.
Exposure definition
An exposed household was one belonging to the list of possibly exposed households provided by the water company (area A).
The regular daily tap-water consumption was taken as best proxy of exposure instead of the specific water consumption during 29 November to 9 December. Regular daily tap-water consumption was categorized: 0, 1, 2, 3–5 or >5 glasses per individual in the household and these were transformed, for the analyses by household, in the scores 0, 1, 2, 3, 4, respectively. Water consumption in the household was measured through the average water score per individual per household=sum of scores in the household/number of residents in the household.
Data collection
For both areas, information collected through standardized questionnaires included, among others: number of household members; clinical symptoms reported in the household [diarrhoea (⩾3 loose stools in 24 h), vomiting, nausea, abdominal pains, abdominal cramps, blood in stool, fever, headache, muscle pain, cold chills, itching and coughing and/or sneezing]; for each symptom, date of onset in the first ill individual of the household; having one or more of the above symptoms after 9 December; consultation with GP and absence from work or school. Furthermore, the questionnaire included regular daily water consumption for each individual in the household. In the exposed area, an additional question addressed compliance with the water boiling advice.
On 22 and 23 December 2001 the questionnaires were delivered to the households.
Data handling and analyses
All questionnaires that were returned before 15 February 2002 were included in the analyses except for commercial houses, schools and households from area B in which someone worked or went to school in area A. Data were entered in an Access database.
A random sample of 109 questionnaires was entered twice. Major discrepancies were rare and therefore a single entry was used.
Proportions of households reporting each of the referred symptoms, consulting a GP or missing work/school were calculated and compared between affected and reference groups. Risk ratios (RR) and corresponding 95% confidence intervals (CI) were computed.
Clinical investigations
Two hundred random households from area A and B were requested to send in a stool sample, preferably from one person in the household that had symptoms of GE recently. In total, 400 stool collection kits were delivered to the households together with the questionnaires.
All samples were tested for norovirus (NoV), Giardia lamblia and Cryptosporidium parvum at the RIVM (Diagnostic Laboratory for Infectious Diseases and Perinatal Screening) using previously described methods [Reference De Wit3, Reference Vinje and Koopmans4]. Because of the late sampling, no tests for bacteria were performed.
Environmental investigations
The water company performed routine analyses of samples of drinking water leaving the treatment plant, in compliance with the Dutch drinking water guidelines. These included daily testing for E. coli and frequent testing for coliform bacteria, faecal streptococci and spores of Clostridium perfringens. E. coli strains detected on 4 December 2001 were typed at the RIVM. On 20 December a 1000 l sample of grey water was taken for testing for NoV by RT–PCR and Southern blot hybridization of the PCR products [Reference Lodder5].
General practice study
Two local health centres were selected: one situated in area B, that receives mainly patients from areas A and B and the other situated in area C (a more distant area, ∼3 km, in the same new housing estate, also with the dual water system but not exposed to the contamination), that mainly receives patients from area C.
A case was a person living in the areas A, B or C, who consulted one of the two health centres during 26 November to 12 December, with one of the following diagnosis codes: D1 0.00 (vomiting), D1 1.00 (diarrhoea), D70.00 (infectious diarrhoea/dysentery), D70.04 (confirmed viral intestinal infection), D70.06 (other/not specified infectious diarrhoea), D73-00 (suspected gastrointestinal infection), D73.01 (suspected viral gastroenteritis), D73.02 (other suspected gastrointestinal infection).
The data were provided from the automated consultations register system. Information included date of consultation, living area (A, B or C) and diagnosis code (all codes from the case definition and ‘others’).
The incidence of consultations for GE by day and by area of residence was calculated and compared between the areas (A, B and C).
RESULTS
Cohort study
Respondent population
Of the initial 2551 households, 101 were found to be ineligible (Table 1). The eligible population under study was composed of 921 exposed and 1529 non-exposed households. Of these, valid questionnaires were returned by 412 exposed and 486 non-exposed households (44·7% and 31·8% response, respectively). Only 13·6% of the stool kits were returned (Table 1).
Table 1. Number of households initially selected, eligible and responding in areas A and B, The Netherlands, 2001

Occurrence of disease
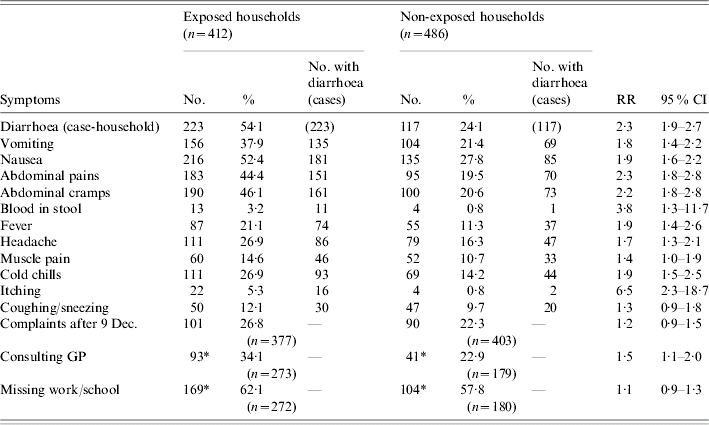
In area A, 223 (54·1%) case-households occurred, compared with 117 (24·1%) in area B (RR 2·3, 95% CI 1·9–2·7) (Table 2). Daily incidence of case-households increased during 29 November to 9 December, in both areaa A and B (Fig. 2). In area B, the rise of incidence started 2 days later than in area A, and the peak was less pronounced. The outbreak lasted for at least 10 days in area A and 5 days (first wave) in area B (Fig. 2).
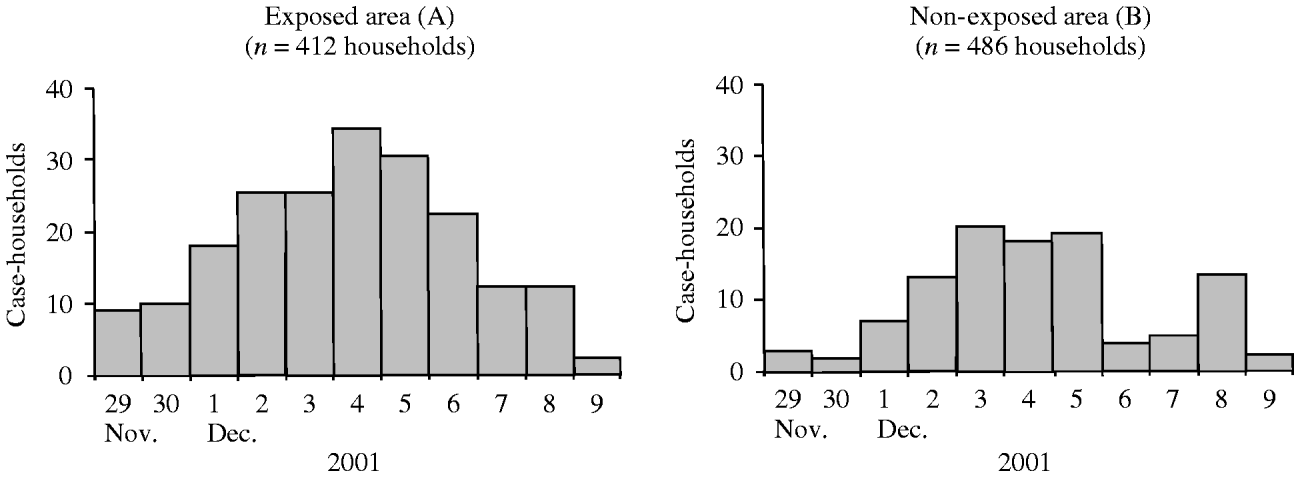
Fig. 2. Case-households by date of onset of the first household member developing diarrhoea, in areas exposed (A) and non-exposed (B) to consumption of grey water, The Netherlands, 2001.
Table 2. Households reporting at least one symptom, by exposure to consumption of grey water, 29 November to 9 December 2001, The Netherlands
RR, Risk ratio; CI, confidence interval; GP, general practitioner.
* Households that reported having at least one of vomiting, nausea, abdominal pains, abdominal cramps, blood in stool or fever.
n, Total number of respondents (denominator).
Of the complaints that indicate GE, the most commonly reported complaint in area A was diarrhoea, followed by nausea, abdominal cramps, abdominal pain, vomiting, fever and blood in stool (Table 2). A slightly different pattern is observed in area B. Blood in stool was rare, but 3·8 times higher in area A than in area B. All these complaints and also the less specific complaints of headache and cold chills were reported at least twice as often in area A than in area B (Table 2).
Finally, itching was rare as well, but six times more frequent in area A than in area B. Coughing and/or sneezing were reported equally in both areas, as was the reporting of complaints after 9 December (Table 2).
Water consumption
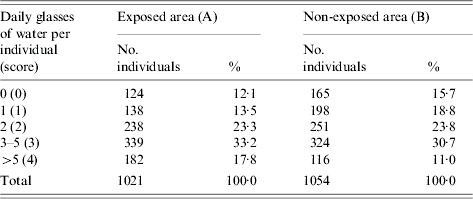
The normal water consumption by individual in the population was fairly similar in the two studied cohorts (largest proportions drinking 3–5 glasses of water per day) (Table 3). A tendency for higher water consumption in area A was observed compared with area B (Table 3). The exposed cohort scored on average 2·3 per individual (median 2·3) while the non-exposed scored 2·0 (median 2·0). Eighty-two percent of the exposed households started boiling the tap water on 5 and 6 December 2001 (dates of the distribution of the water boiling advices).
Table 3. Daily glasses of water normally drunk by individual in areas exposed and non-exposed to the consumption of grey water, The Netherlands, 2001
In area A, the proportion of case-households increased with the average daily amount of water consumed per individual in the household, showing a clear dose–response relationship. However, a similar trend was observed in area B (Table 4). In area A 16·7% of the households that usually do not drink any tap water had GE compared with 6·5% in area B (Table 4).
Table 4. Case-households, by category of average daily individual water score in the household, The Netherlands, 2001
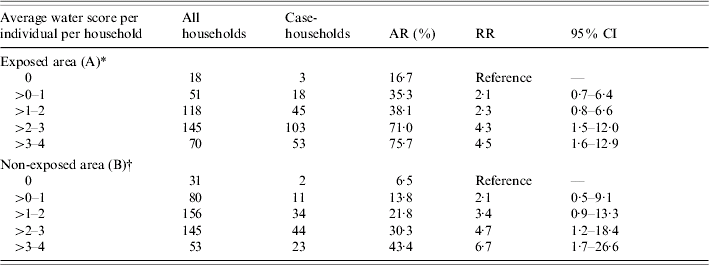
AR, Attack rate; RR, risk ratio; CI, confidence interval.
* χ2 for linear trend=51·26, P<0·01.
† χ2 for linear trend=23·47, P<0·01.
Clinical investigations
Of the 53 households who returned stool samples and completed questionnaires, 31 were from area A and 22 from area B (Table 1). In area A one sample was positive for NoV, genogroup 1, genotype Birmingham, and one other was positive for G. lamblia. In area B one sample was positive for NoV, genogroup 11, close to genotype Lordsdale. Both the NoV- and the Giardia-positive samples from area A were collected from case-households. The NoV-positive sample from area B was collected from a household that reported GE symptoms after 9 December 2001.
Environmental investigations
The drinking water samples, taken in area A on 4 December 2001, yielded isolates of coliform bacteria and faecal streptococci. The E. coli strains isolated from these samples were type 0:105 (non-pathogenic).
The grey water samples taken on 20 December (21 days after the cross-connection between the two systems was established), was positive for NoV RNA at a concentration of 1600 RNA-containing particles per litre. Southern blot hybridization of the PCR products showed that the NoV RNA belonged to genogroup 1, but could not be genotyped further by sequence analysis.
General practice study
The study included 1866 inhabitants of area A, 2875 inhabitants of area B and 5788 inhabitants of area C.
During 29 November to 9 December, 37 individuals were diagnosed with GE in area A (19·8 cases/1000 inhabitants) compared with 20 (7·0 cases/1000 inhabitants) in area B (RRAB 2·8, 95% CI 1·7–4·9) and 19 (3·3 cases/1000 inhabitants) in area C (RRAC 6·0, 95% CI 3·5–10·5). When comparing the non-exposed areas, in area B consultations for GE were 2·1 times more common than in area C (95% CI 1·1–4·0) (Table 5).
Table 5. Number of cases and incidence of gastroenteritis per 1000 inhabitants, diagnosed in general practice, from 29 November to 12 December 2001, areas A, B and C, The Netherlands, 2001
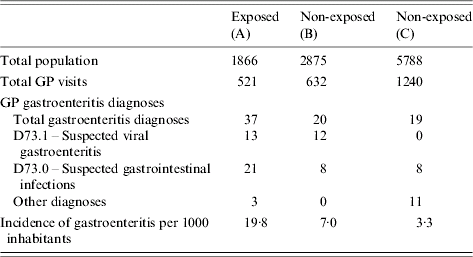
GP, General practitioner.
The daily incidence of consulting cases from 26 November to 12 December, showed an important increase in area A (starting at 3 December) and a less pronounced increase in area B (starting at 3–4 December). Area C showed no increase during the considered period (Fig. 3).
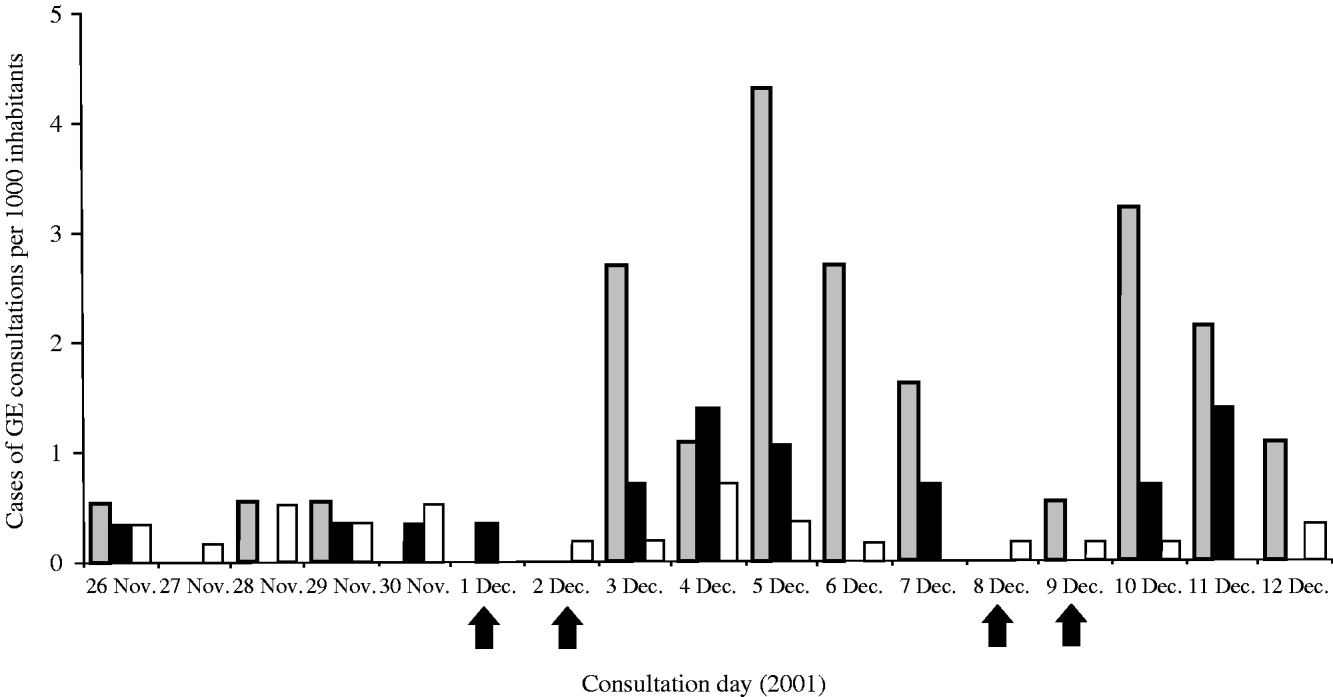
Fig. 3. Number of diagnosed cases of gastroenteritis per 1000 inhabitants, from 26 November to 12 December 2001, by day and area, exposed (A) and non-exposed (B, C) to consumption of grey water, The Netherlands, 2001. Arrows indicate weekend days.
DISCUSSION
Both the cohort study and the general practice study indicated an outbreak of GE complaints and GP consultations for GE, in the area exposed to the contaminated drinking water. A clear dose–response relationship with drinking tap water was observed. These results suggest that consumption of drinking water contaminated with grey water increased the risk of acquiring GE. Moreover, an outbreak of GE as well as a clear dose–response relationship with water also occurred in one (the adjacent) of two reference areas. No conclusions can be drawn about the causative pathogens), although circumstantial evidence suggests a viral cause.
Despite our conclusions, some potential biases in the studies need to be addressed. The cohort study was performed 3 weeks after the exposure period. In the meantime, the water company and public media extensively informed the affected population and the general public about the accident and its technical background, starting on 5 and 6 December. Information (recall) bias might therefore have played a role in the retrospective cohort study. Especially, overreporting of clinical complaints, mostly in the exposed group, might have generated an overestimate of the risk ratio. We believe, however, that, unlike a previous study in England 1994 [Reference Fowle6], recall bias had limited effect on the results, in fact coughing/sneezing (supposedly unrelated to the outbreak) were equally reported in areas A and B. Moreover, an increase of GE consultations clearly started (3 December) before the public was informed (5 December) which confirms the effect detected in both studies. Exaggeration of water consumption by individuals that experienced GE symptoms, due to the general awareness about the possible source (water), was suggested when area A scored slightly higher than area B in terms of tap-water consumption. Although it has previously been observed [Reference Hunter and Syed7], we do not believe that this kind of recall bias has, by itself, generated the dose–response relationship observed in area B.
In general, the late start of the study might also have reduced the accuracy of information, such as dates of onset of complaints. However, we expect this effect to be similar in both areas.
The time gap also complicated determination of the microbiological aetiology of illness, whereas bacteria and some viruses are excreted in stool only up to 1 week after the onset of illness [Reference De Wit8, Reference Blaser9]. Furthermore, the Christmas holidays probably resulted in a lower participation, especially for the stool sample collection.
Another limitation of the cohort study was the choice of the control group B, because of the chance of secondary spread (especially in case of viral agents) or even the chance of direct exposure, due to the small distance to the exposed area. According with the 2001 data from the Regional Bureau of Statistics [10] household size and age distribution were fairly similar between these areas, the main difference being in a greater proportion of immigrants living in area A than in area B (39% and 25%, respectively).
Areas A and B share several facilities – two schools, a health centre, a supermarket, etc. – all situated in area B, which might facilitate secondary transmission. This was the most probable explanation for the increase of GE, also detected in area B, at about the same time as in area A while the same was not noticed in the more distant area C. This, however, did not prevent detection of a significantly higher incidence of GE in the exposed area A. Remarkably, a dose–response relationship between drinking water and reporting diarrhoea was found in the non-exposed area B. The non-exposure status was therefore verified for each household of area B. About 17 (3·5%) households were in fact misclassified as non-exposed within the 486 non-exposed households of the cohort study. This, however, cannot explain the outbreak and the dose–response in area B. Further, individuals of area B could have consumed grey water during visits to households in area A. The water company never detected any contamination of the drinking water of area B after several samplings triggered by the complaints of some residents. However epidemiological results suggest that contamination of the drinking water of area B with grey water cannot be excluded.
Surface waters are often faecally contaminated, leading to waterborne infections and disease in the population. Although no definite conclusions could be drawn about the causative pathogen, the incubation period, symptoms and the environmental investigation suggest a viral cause. Data on virological testing of grey water from this housing estate in the spring of 2001 showed relatively high concentrations of up to 14 000 NoV RNA particles per litre of source water used for grey water production (data not shown). Also NoV was detected in the sample of grey water taken on 20 December 2001, belonging to the same genogroup as the NoV-positive case tested, but different from the positive control. We therefore think that NoV genogroup 1 was one of the main pathogens transmitted by the grey water in this outbreak. This hypothesis is also supported by the high proportion (>50%) of case-households reporting vomiting, a symptom strongly associated with gastrointestinal viral infections [Reference De Wit3]. NoV usually leads to massive secondary spread. In the cohort study, households who did not drink any tap water were still at increased risk of being a case in the exposed area compared to the non-exposed area, which is probably explained by secondary spread in shared facilities such as schools and shops. Finally, the general practice study also showed that high proportions of GE diagnoses, 35% in area A and 60% in area B, were classified as suspected viral GE.
Although the presented observations suggest that NoV was responsible for the outbreak, we believe that other pathogens could have been involved as well, but with less importance. Particularly, the few households that reported blood in stool could be associated with infections by Campylobacter spp. [Reference De Wit3, Reference Blaser9] or pathogenic E. coli [Reference Blaser9, Reference McCarthy11]. These bacteria were previously incriminated in several drinking-waterborne outbreaks [Reference Jones and Roworth12–Reference Olsen14]. Unexpectedly, a high RR was obtained for itching. This complaint was probably associated with exposure to the contaminated water during showers or baths in a few individuals that might be predisposed to greater skin sensitivity.
The presented studies suggest that accidental consumption of grey water can cause outbreaks of gastrointestinal illness. Accidents like this can have great public health impact because of the wide use of grey water by the general public. Individuals should be informed about the constraints of using grey water. In areas where grey water systems are implemented, there is a need for monitoring of drinking water quality, also at the user level, in order to detect and control this type of problem earlier.
In February 2003, the results of the 2001–2002 virological and bacteriological monitoring of the source water that served the studied area became available, showing especially high concentrations of NoV. The quantititavie risk assessment based on the source water quality and the treatment efficiency with respect to noroviruses indicated the requirement of a source water of higher quality or additional or more efficient treatment steps. The associated increased production cost would render the project uneconomic pressuring the water company to cease the supply of grey water to the houses. Moreover, the Dutch environmental authorities in 2003 banned the usage of grey water, based on extensive environmental studies and risk assessments on six study locations with the exception of rainwater use for flushing toilets. Initial analyses of collected rainwater for this specific application has shown poor rainwater quality in some situations [Reference Schets15]. Further studies are required to assess the possible health risk associated with rainwater usage.
ACKNOWLEDGEMENTS
The authors thank Alain Moren for epidemiological technical advice; Wim Wannet, Denise Hoek, Erwin de Bruin, Bartelt de Jongh and Desiree Ballegoyen for part of the laboratory investigations; Winette van den Brandhof, Carolien de Jager, and other colleagues from the Centre for Infectious Diseases Epidemiology (RIVM), and Jeannette Wouters from the Microbiological Laboratory for Health Protection (RIVM) for their help in the logistics, data analyses and data entry of this investigation. The outbreak investigation was financially supported by the Ministry of Public Health, Welfare and Sports, the Environmental Inspectorate and the Public Health Service Utrecht.
DECLARATION OF INTEREST
None.


