Introduction
European bats are host to two lyssaviruses: European bat lyssavirus type 1 (EBLV-1), which is identified in most of the >800 European cases [Reference Vos1] and European bat lyssavirus type 2 (EBLV-2), which has only been recorded about 20 times [Reference McElhinney2]. Both cause fatal rabies in humans, although cases are extremely rare. However, contact with bats results in an unspecified number of post-exposure prophylaxis (PEPs) in humans within Europe, e.g. Britain (H. Kirkbride, personal communication) and France [Reference Rotivel3] both record over 100 per year. EBLV-1, is most closely related to Duvenhage virus [Reference Amengual4], and is generally found in serotine bats (Eptesicus serotinus), which account for more than 95% of cases where the bat species is identified [Reference Harris5]. E. serotinus is found across most of Europe, but is restricted to southern parts of Sweden and England [Reference Mitchell-Jones6]. The E. serotinus population size in Britain has been estimated by extrapolation at 15 000 [Reference Harris7]. In The Netherlands alone, one-third of recovered bats that had bitten humans tested positive for EBLV-1, and 12% of bats recorded in contact with cats were EBLV-1 positive [Reference Takumi8]. EBLV-2 is most closely related to Australian bat lyssavirus, and classical rabies virus [Reference Amengual4], and has been recorded in Daubenton's bat (Myotis daubentonii) and the Pond bat (M. dasycneme). M. daubentonii occurs commonly across Europe, including southern Sweden, Norway, Finland and most of Britain and Ireland. In Britain the population size is estimated by extrapolation at 150 000 [Reference Harris7]. M. dasycneme is one of the rarer European bats occurring in northern continental Europe, but generally restricted in the west, and absent from Britain.
Although most of EBLV-1 cases have occurred in E. serotinus, there are no cases in Britain. However, of the ~20 confirmed cases of EBLV-2, eight cases have occurred in M. daubentonii in England [Reference Banyard9] and one M. daubentonii [Reference Horton10] and one human case [Reference Fooks11] in Scotland. Active sampling of M. daubentonii in England has revealed a seroprevalence of 1–4% [Reference Harris12]. It seems unlikely that sampling artefacts alone have resulted in the common European lyssavirus (EBLV-1) appearing to be absent from English E. serotinus, while also confirming the ongoing maintenance of an extremely rare lyssavirus (EBLV-2) in M. daubentonii. The occurrence of bat rabies in Britain depends on two factors: (i) introduction – it must be carried across the English Channel by infected bats and (ii) persistence – it must be maintained in the recipient population. These factors depend on the movement or migration of individual bats, and this can be inferred by analysis of genetic variation of colonies and local populations. Here, we contrast the genetic variations of E. serotinus and M. daubentonii within Britain and use this to produce a hypothesis for the current EBLV occurrence in Britain. We propose that further work is undertaken to examine this hypothesis, as greater understanding of genetic variation may provide new information on movement patterns related to mating and thus help our understanding of lyssavirus transmission.
METHODS
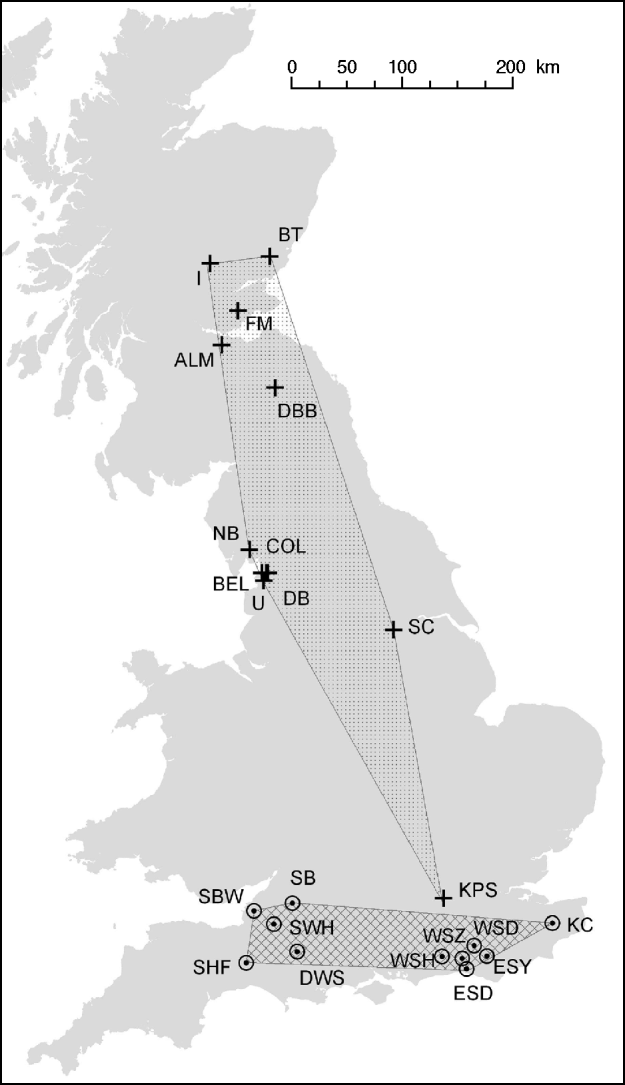
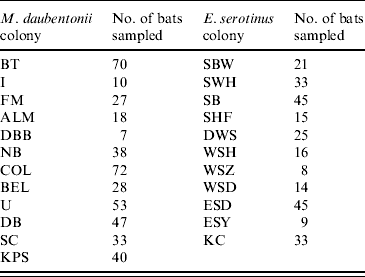
E. serotinus wing puncture samples were collected from maternity roosts in Sussex, Dorset and Somerset in England, from 2004 to 2006 (Fig. 1). These wing punctures had no short- or long-term deleterious effect on the bats' ability to fly. Analysis of these samples were compared with those collected from M. daubentonii caught at summer roosts in central and southern Scotland, and Cumbria, Lancashire, Yorkshire and Middlesex in England, between 2003 and 2006 (Fig. 1, Table 1) [Reference Atterby13]. The geographic area covered by the M. daubentonii colonies studied was about 150 km west to east and 600 km north to south, whereas the region covering E. serotinus colonies sampled was about 280 km west to east and 70 km north to south. All procedures were in adherence to UK Home Office guidelines [Animals (Scientific Procedures) Act 1986] and under licence from the appropriate nature conservation bodies. Upon collection all biopsy samples were stored in 70% ethanol at 4°C, until analysis.

Fig. 1. Distribution of M. daubentonii and E. serotinus colonies sampled in the UK. The number of samples taken at each colony are given in Table 1.
![]() , Location of M. daubentonii colonies sampled; ⊙, location of E. serotinus colonies sampled. The shaded areas show the extent of the sampled range within each species.
, Location of M. daubentonii colonies sampled; ⊙, location of E. serotinus colonies sampled. The shaded areas show the extent of the sampled range within each species.
Table 1. The number of bats sampled at each colony. The geographical locations of the colonies are given in Figure 1

Simple sequence repeat (SSR) markers from other closely related species were optimized for E. serotinus as detailed in Table 2. A more detailed, within-population, analysis of the serotine data will be published in a later paper. Here we concentrate on population summary level statistics to compare between these species. Different SSR markers were used for M. daubentonii, so the full dataset from both species cannot be analysed together. DNA extraction and genotyping methods for both species have been described earlier along with statistical analysis [Reference Atterby13]. Common population genetic statistics were calculated: F ST, the proportion of variation in populations [Reference Nei14, Reference Michalakis and Excoffier15] was calculated using the AMOVA procedure of Arlequin [Reference Excoffier, Laval and Schneider16], and used to produce dendrograms, drawn by Phylip [Reference Felsenstein17], to illustrate the structure and degree of genetic variation in the two species in the UK. H E, gene diversity, is calculated within populations only; F IS, the proportion of alleles expected to be identical in an individual; and H T, total heterozygosity, were calculated with Genetix [Reference Belkhir18]. F ISP values were calculated using a 1000 replicate bootstrap. Arlequin [Reference Excoffier, Laval and Schneider16] was used to estimate linkage disequilibrium (LD) and Hardy–Weinberg equilibrium (HWE). Mantel tests were performed between pair-wise geographic distance and F ST with 1000 replicates using the Microsoft Excel add-in, PopTools (http://www.cse.csiro.au/poptools/).
Table 2. Details of microsatellite loci optimized for E. serotinus

* ABI dyes HEX, NED, 6-FAM are indicated where present on the forward primer.
† Touchdown programme consisting of 20 cycles of 66–56°C falling by 0·5°C per cycle followed by 30 cycles at 56°C.
RESULTS
A total of 264 E. serotinus and 443 M. daubentonii bats were included in the analysis. For this analysis, each roost was treated as a separate population. Within all M. daubentonii colonies, the average proportion of pair-wise loci in significant LD was 11·6% (P⩽0·05) and 9·4% of loci were not in HWE (all heterozygote deficiency). Within all E. serotinus colonies, the average proportion of pair-wise loci in significant LD was 6·5% (P=0·05) and 13·6% of loci were not in HWE (all heterozygote deficiency). In colonies F ST estimates (Table 3) were low for both species, but greater for E. serotinus than M. daubentonii between the UK colonies sampled. There was little or no inbreeding (F IS) observed within colonies of either species [only 1 colony (KC) had a significant result; F IS=0·1, P(FIS>0)<0·05]. Within-population genetic diversity (H E) was high in both species, but slightly higher in M. daubentonii (Table 3).
Table 3. A comparison of F statistics and genetic diversity for E. serotinus and M. daubentonii populations

See Methods section for a definition of each statistic.
* P<0·05.
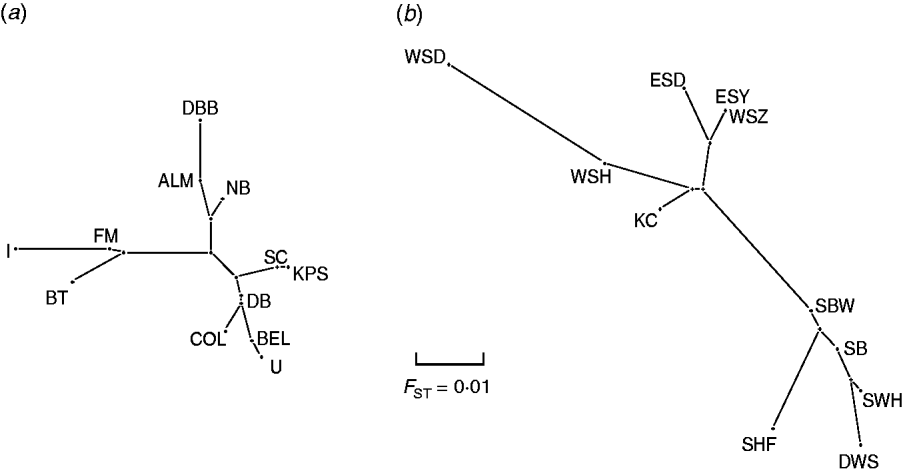
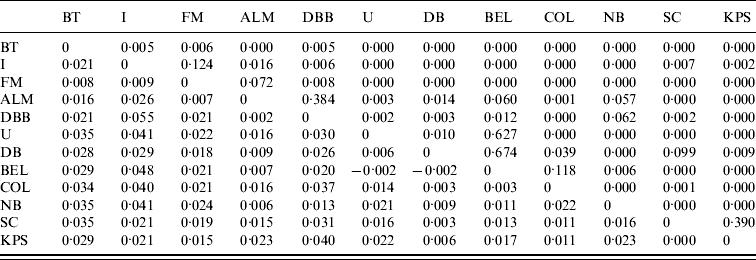
Pair-wise F ST values between all E. serotinus and M. daubentonii colonies sampled are shown in Tables 4 and 5, respectively. Comparative pair-wise F ST dendrograms of M. daubentonii and E. serotinus colonies show clearly the different scale of genetic structure between the two species (Fig. 2). There is a significant east–west substructure within E. serotinus populations studied (F ST=2·85%, P=0·002), with the eastern populations in Sussex (WSH, WSZ, WSD, ESD, ESY) and Kent (KC) clustering separately from those in Somerset (SHF, SBW, SB, SWH) and Dorset (DWS). The M. daubentonii colonies studied show a degree of genetic separation by distance with two northerly clusters [Reference Atterby13]; however, there is much less genetic differentiation between colonies compared to the differentiation evident between E. serotinus colonies.

Fig. 2. Pair-wise F ST dendrogram of (a) M. daubentonii and (b) E. serotinus colonies sampled in the UK. The letters represent the colony locations as shown in Figure 1.
Table 4. Pair-wise FST values (below the diagonal) and their significance (as P values) for E. serotinus colonies sampled. The geographical locations of the colonies are given in Figure 1

Significant F ST values are represented by P value (above the diagonal) of <0·05.
Table 5. Pair-wise FST values (below the diagonal) and their significance (as P values) for M. daubentonii colonies sampled. The geographical locations of the colonies are given in Figure 1

Significant F ST values are represented by P value (above the diagonal) of <0·05.
When the distribution map of E. serotinus and M. daubentonii colonies sampled in this study (Fig. 1) is compared with the scaled dendrograms for each species (Fig. 2), it is apparent that in the UK the population genetic structure of E. serotinus colonies is on a smaller geographic scale than the structure of M. daubentonii colonies. The geographic scale of the M. daubentonii colonies studied covers about three times the area of the E. serotinus colonies sampled; however, roughly twice the amount of genetic differentiation is found within the smaller area from which E. serotinus colonies were sampled.
A Mantel test between geographic distance and pair-wise F ST showed a significant correlation in E. serotinus (ρ=0·602, P=0·004) but was not significant in M. daubentonii (ρ=0·369, P=0·058).
DISCUSSION
There was no extreme divergence from HWE in either species' colonies, as shown by the observed low F IS values and no major differences in genetic diversity in colonies within species (H E). The greater genetic differences observed between populations of E. serotinus compared to M. daubentonii within the UK are likely to be the result of lower migration/mixing for mating between E. serotinus colonies in the UK compared to M. daubentonii colonies. The lack of inbreeding in colonies indicates that none of the colonies sampled in either species are genetically isolated; however, the lower genetic diversity (H E) in E. serotinus compared to M. daubentonii is concordant with the greater genetic differentiation found between E. serotinus colonies compared to M. daubentonii colonies. More extensive sampling of M. daubentonii in Scotland [Reference Ngamprasertwong19] demonstrates very low microsatellite F ST values, in line with the differences reported here.
M. daubentonii is among the species that performs ‘autumnal swarming’ (mating) behaviour, where individuals from many local colonies gather in large numbers to mate [Reference Glover and Altringham20] and individuals are known to move >30 km between maternity roost and swarming sites [Reference Parsons and Jones21]. There is currently no published evidence to suggest that E. serotinus exhibit this same behaviour; female E. serotinus are noted to disappear from their maternity colonies in the autumn [Reference Schober and Grimmberger22] but there are no records of autumn gatherings for mating in the UK, and their mating system appears yet to be described. However, as a large bat, it is a strong flyer, with mean daily movement distances to foraging sites of 8 km, and maximum nightly distances flown exceeding 40 km [Reference Robinson and Stebbings23]. It is possible that they may still swarm within a small geographic area, but the mating strategies would have to be significantly more confined than in M. daubentonii to explain the results of this current study.
M. daubentonii genetic structure in Western Europe is relatively homogeneous [Reference Atterby13], suggestive of recent expansion, or a relatively well mixed population, with some similarity to English populations. Whereas preliminary analysis of a few E. serotinus roosts in northern Europe suggests a more marked differentiation with English roosts (H. Atterby, unpublished data). The genetic data are suggestive that there is more movement between mainland Europe and the UK for M. daubentonii than for E. serotinus. If this is correct, then the introduction of a disease into the UK is more likely if carried by M. daubentonii. In Europe, EBLV-1 in E. serotinus is much more common and widespread than EBLV-2 in M. daubentonii. However, the risk of introduction to the UK would not be solely proportional to the prevalence of disease, so the risk of EBLV-2 introduction may be higher than expected by the rate of occurrence of this disease in continental Europe.
Assuming that EBLVs arrive in the UK, then M. daubentonii, with higher gene flow, will be more likely to establish and spread EBLV-2. The more isolated E. serotinus colonies indicate that the geographic spread of EBLV-1 is less likely. Thus, the genetic data suggests that, following arrival, EBLV-2 would spread across Britain, whereas EBLV-1 may remain more geographically constrained, and if it did not spread successfully, may actually go extinct due to stochastic chance in a small population. Based on the available genetic data, we therefore hypothesize that, over time, EBLV-1 may exist for short periods in a few E. serotinus colonies in the UK but does not transfer to sufficient individuals to remain within the population on a long-term basis, and as a result remains undetected. However, it is still possible that given sufficient time, EBLV-1 could both arrive and spread successfully in the UK. In order to test this hypothesis it is suggested that more precise comparisons of the population genetic structure of continental and UK serotine (and other species) colonies and the genetic relationship between them are made. Alternatively, it is also possible that the geographical restriction of EBLV-2 could be due to factors other than the gene flow of the host; such as climatic restrictions limiting the maintenance to roosts in particular climatic regions, or different local behavioural adaptations of the host.
A general understanding of the movement patterns of European bats, inferred through genetic data, may be useful in understanding the potential for exotic lyssavirus spread into new areas. Such analysis is not limited to EBLVs, but may also help our predictions for the spread of the new species of Lyssavirus recorded in insectivorous bats in Asia and Africa.
ACKNOWLEDGEMENTS
The authors acknowledge Defra for funding this study. In addition, the assistance of many enthusiastic amateur bat workers proved invaluable in collecting the wing biopsy samples. The authors also thank the owners of premises from which sampling was carried out for their tolerance and hospitality during the collection periods. Finally, the assistance of Sarah Harris (Veterinary Laboratories Agency) in the provision of wing biopsy samples was also gratefully received.
DECLARATION OF INTEREST
None.


