


Introduction
Aromatic hydrocarbons, especially benzene, toluene, and xylene (BTX), play a significant role in the petrochemical industries. These compounds are primary feedstock in producing materials such as synthetic rubber, detergent, dyes, and intermediates (Franck and Stadelhofer Reference Franck and Stadelhofer1988). The BTX compounds are produced using reformate, pyrolysis, or cracking (Genuino et al. Reference Genuino, Muizebelt, Heeres, Schenk, Winkelman and Heeres2019). These processes lead to the formation of trace amounts of undesired compounds in the form of olefins, which, even in concentrations as low as a few parts per million, can have an adverse effect on the quality and application of the aromatics (Tian et al. Reference Tian, Meng, Duan and Shi2012). Removing these small amounts of olefins from aromatic compounds is essential. Modified clay can be used for this purpose because of its specific physical and chemical features, namely large specific surface area, thermal stability, and the existence of acid centers (Sulikowski Reference Sulikowski2006; Centi and Perathoner Reference Centi and Perathoner2008; Roth et al. Reference Roth, Gil, Makowski, Marszalek and Eliášová2016).
Bentonite consists essentially of montmorillonite, which is generally classified into sodium (Na) or calcium (Ca) types depending on the dominant exchangeable ion (Eisenhour and Brown Reference Eisenhour and Brown2009). Bentonite is valued for its sorption properties, which originate from its large specific surface area, swelling capacity, and cation exchange capacity (CEC) (Sulikowski Reference Sulikowski2006; Centi and Perathoner Reference Centi and Perathoner2008; Roth et al. Reference Roth, Gil, Makowski, Marszalek and Eliášová2016). Currently, in order to prepare clays as efficient catalysts for catalytic reactions, they are modified by various methods, including thermal, acid, and pillaring processes (Kloprogge Reference Kloprogge1998; Lagaly Reference Lagaly2006; Noyan et al. Reference Noyan, Önal and Sarikaya2007). Acid treatment is one of the conventional approaches for modification of clay with the aid of some mineral acids, such as sulfuric acid, hydrochloric acid, and nitric acid (Madejová et al. Reference Madejová, Pentrák, Pálková and Komadel2009). The acid treatment produces some acidic sites, which make the clay suitable for particular catalytic reactions (Noyan et al. Reference Noyan, Önal and Sarikaya2007; Salem and Karimi Reference Salem and Karimi2009). The effect of thermal and acid pretreatment on the surface acidity and catalytic activity of Jordanian bentonite in the detert-butylation of 2-tert-butylphenol was studied by Mahmoud et al. (Reference Mahmoud, Hammoudeh and Al-Noaimi2003). Acid-treated bentonite samples possess more acidic sites than untreated samples. The Hammett acidity function, H o, was used by Mahmoud et al. (Reference Mahmoud, Hammoudeh and Al-Noaimi2003) as a measure of the acid strength; the smaller the H o value, the stronger the acid. The maximum number of acid sites (H o < 4.8) was obtained when Jordanian bentonite was treated with 0.1 M H2SO4, H3PO4, or HCl. Treating the clay samples with 1.0 M H2SO4, 1.0 M H3PO4, or 0.1 M HCl generated a maximum concentration of strong acidic sites (H o < 3.6). Compared to weak acid sites, strong acid sites (H o < 2.9) produced appreciable enhancement of the debutylation rate. The catalytic performance of allophane, palygorskite, and sepiolite in the dehydration and conversion of alcohols to ethers was measured by Marosz et al. (Reference Marosz, Kowalczyk, Gil and Chmielarz2020). For this purpose, clay mineral samples were acid-treated (0.8 M HNO3; 95°C; 2, 8, or 24 h) and, after calcination (500°C; 6 h), tested as catalysts for the conversion of methanol to dimethyl ether and for the conversion of ethanol to diethyl ether and ethane. During acid treatment, the BET surface area, pore-volume, and surface acidity for the sepiolite and palygorskite series of samples increased significantly. In contrast, the BET surface area, pore-volume, and surface acidy for the allophane series showed a decrease in the process of acid treatment. In a typical experiment of acid treatment for 24 h, the surface area (S BET), pore volume (V total), and surface acidity (SA) of raw allophane vary from 183 m2 g–1, 0.150 cm3 g–1, and 267 μmol g–1 to 171 m2 g–1, 0.144 cm3 g–1 and 143 μmol g–1, respectively. Among the samples studied, allophane was the most catalytically active in the dehydration of methanol to dimethyl ether (at a temperature of 350°C, methanol conversion was >80%). Unlike other samples, acid treatment increased the catalytic activity of allophane.
An attempt was made by Pu et al. (Reference Pu, Liu, Jiang and Shi2012) to improve the catalytic activity of a commercial clay by adding zeolite (MCM 22) and lanthanum. This modified catalyst showed a significant superiority over the commercial clay, and the laboratory and industrial tests revealed that the modified catalyst demonstrated noticeably better durability than the commercial clay. Based on the TPD profile results, the modified commercial clay had many weak Lewis acid centers compared to the commercial clay due to the presence of zeolite. The weak Lewis acid centers are thought to play a significant role in the alkylation of olefins and purification of aromatics. Also, the synthesized catalyst did not change the quantity or distribution of the aromatic hydrocarbons.
In another investigation, palygorskite (Plg), a naturally fibrous hydrated aluminum-magnesium silicate mineral, was used as an efficient catalyst in the olefin-removal reaction. The Plg-supported catalyst surface area and pore structures were improved by acid activation. In addition, various metal halides were applied to improve further the surface acidity of the catalyst obtained. The experimental results in a batch autoclave indicated the sample modified by 21 wt.% of sulfuric acid and CoCl2 with a loading content of 7 wt.% showed the greatest olefin conversion of 92.1% (Guo et al. Reference Guo, Zhang, Li, Peng, Xiong, Wang, Hu, Yao and Chen2020).
The present study aimed to modify the bentonite surface by optimizing the acid concentrations and calcination temperatures to prepare an enhanced catalyst for alkylation reactions, to determine the optimum parameters for removing olefins from aromatic compounds efficiently, and to develop a suitable method for measuring the Bromine Index (BI) by potentiometric analysis.
EXPERIMENTAL
Materials and Methods
Raw bentonite as the primary material, with a CEC of 0.9 meq g–1 and a specific surface area of 33.28 m2 g–1, was purchased from Abtin Shimi Co. (Semnan, Iran). It had the following major-element chemistry: 66% SiO2, 0.24% Na2O, 2% MgO, 9.5% Al2O3, 1.8% K2O, 1.1% Fe2O3, 3% CaO, 0.36% other, and 16% LOI. In order to study the catalytic activity, bentonite was powdered by laboratory dry milling equipment to middle-size (−100 to +200 mesh). The powders obtained were dried in a laboratory oven at 105°C.
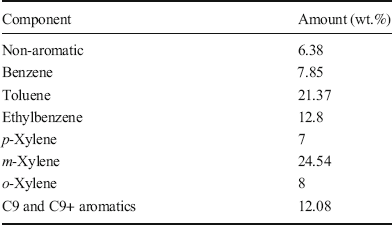
Other chemicals were purchased from Merck Chemical Co. (Darmstadt, Germany). All the reagents were of analytical grade. The aromatic compounds (Table 1) and details of their characteristics were obtained from Nouri Petrochemical Co. (Bushehr, Iran). The Bromine Index (BI) of the aromatic hydrocarbons was ~140 mg of Br2/100 g, a level which poses significant difficulty to industry.
Table 1. Components of the aromatic hydrocarbon
BI Measurement of Feedstock and Products by a Potentiometric Method
Bromine Index (BI) is considered to be an indicator of olefin content in aromatic compounds, and is defined as milligrams of bromine consumed by 100 g of a hydrocarbon sample. A small BI indicates the presence of a small amount of olefins in aromatic compounds. In contrast, a large value for BI demonstrates that the aromatic compounds contain a significant amount of olefins (Chen et al. Reference Chen, Wu, Zeng, Jiang and Shi2009).
The BI of the samples was determined by potentiometric titration, which is based on reaction 1:
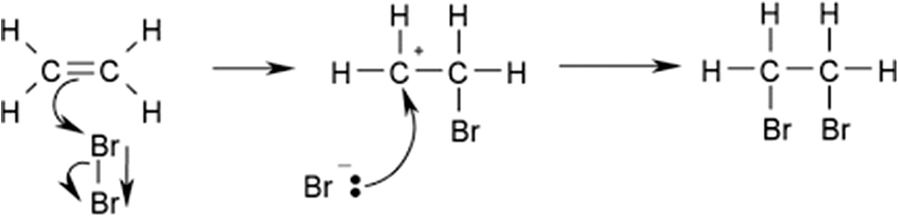
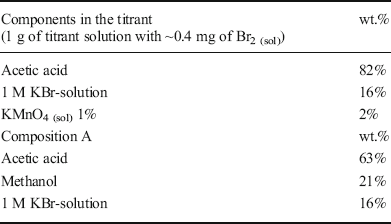
Reaction 1 was carried out by adding Br2 (sol) as a titrant (Table 2) to the mixture of composition A (Table 2) and 4 g of autoclave outlet (with the components mentioned in Table 1) with constant stirring of the solution at room temperature. The olefin double bonds were detected and broken by Br2 molecules (Reaction 1) to consume all the double bonds. The bromine concentration increased gradually in the solution while the olefins decreased, leading to a gradual increase in the potential. Note that the Br2 required for the titration mentioned above is produced according to reaction 2:

Table 2. Components in the titrant and Composition A
The BI was calculated according to Eqn. 1, using the curve of potential vs. titrant mass, and the endpoint of this curve was obtained.
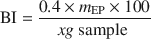
where m EP is the mass of titrant in the endpoint of the titration curve, and x is the mass of autoclave outlet or continuous system (Fig 3).
The efficiency and accuracy of the method were appraised by a standard solution with a BI of ~100 mg Br2/100 g (0.088 g of 1-decene was weighed and poured into a sample container; then the total mass was increased to 100 g by addition of pure toluene). The final solution was titrated through the potentiometric method. The measured BI was ~100 mg Br2/100 g which proved the accuracy of the method.
Preparing Titrant and Analyte for Potentiometric Analysis
Titrant and analyte solutions were prepared for BI measurement of the feedstock and products via potentiometric analysis. For this purpose, 50 g of titrant was prepared by adding 1.064 g of 1 wt.% potassium permanganate solution to the mixture of acetic acid and potassium bromide solution (Table 2).
Acid Activation of Clay
Raw bentonite was treated with nitric acid solutions at various concentrations, namely 0.15, 0.3, 0.5, 0.7, 1, and 2 M. The suspensions were stirred for 2 h at 70°C (which are the optimum contact time and temperature, respectively (Fig. 1)), and then washed several times with distilled water. The mixture was filtered and dried at 100°C overnight. Then, to investigate the thermal treatment, the mixture was heated at 100, 150, 200, 270, and 340°C for 3 h to obtain the final solid acid-treated catalysts.
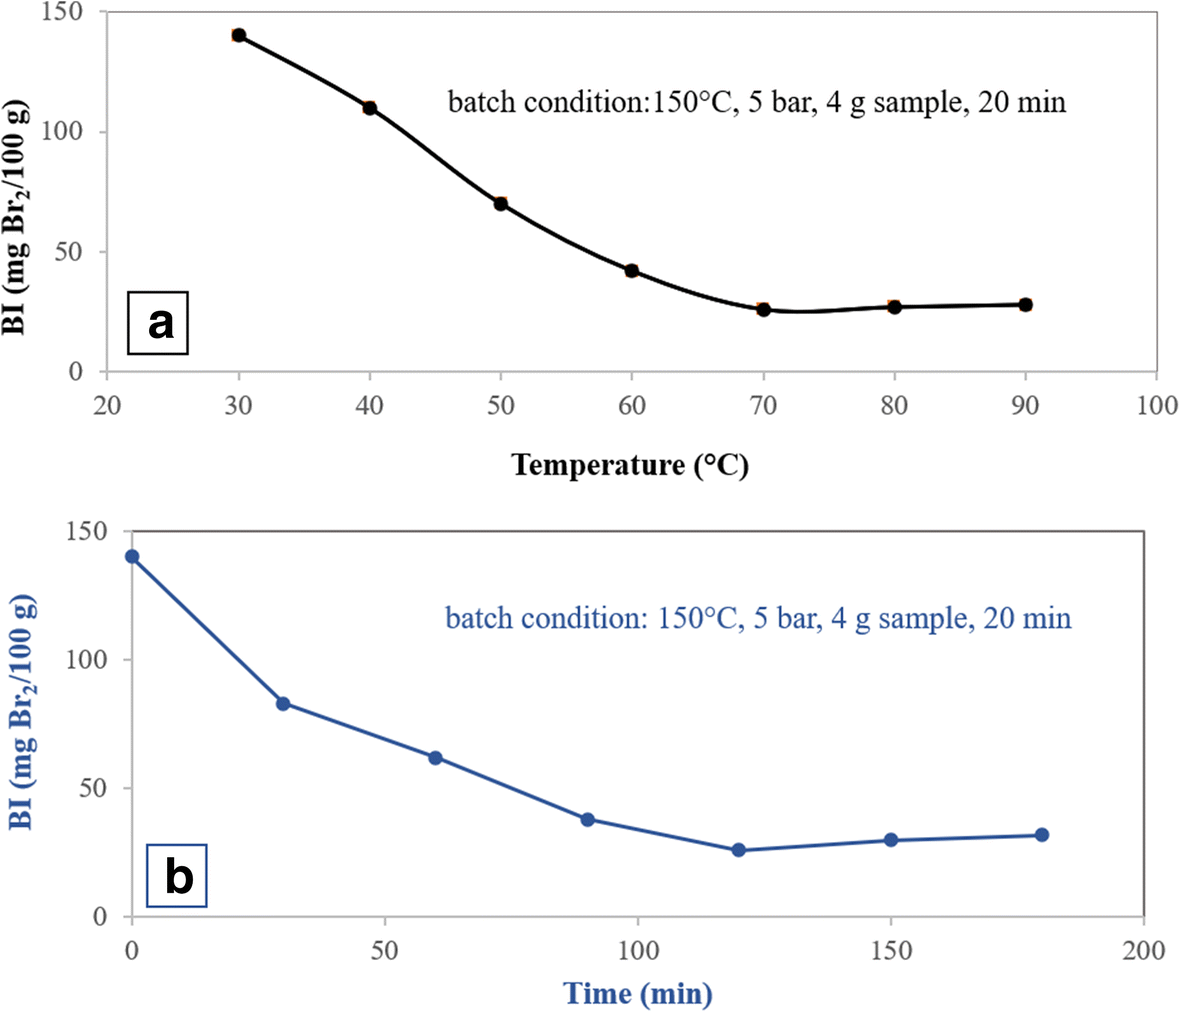
Fig. 1 Optimization conditions for acid treatment of bentonite for olefin removal from aromatic hydrocarbons using the sample treated with 0.3 M acid in the batch system. a Reaction temperature. b Reaction time
Optimization of Treatment Conditions for a Sample Modified with 0.3 M HNO3
The effects of the activation temperature and the activation time in the acid treatment step on the olefin conversion were investigated by the single-factor experiment method (Fig. 1). The process was performed in a batch system with reaction conditions as listed in Table 3 and in the presence of the sample modified with 0.3 M HNO3. In the acid treatment of clay, by increasing the activation temperature and time, the BI decreased, reaching a minimum for temperature = 70°C and time = 120 min, and then rose slightly to a constant value (Fig. 1a,b). The specific surface area was increased with an increase in activation temperature and activation time in the acid treatment. The specific surface area reached a maximum value at 70°C and 120 min (Fig. 2a,b).
Table 3. Parameters for the batch system. (t RT is the time period during which the catalyst was in contact with the feedstock.)
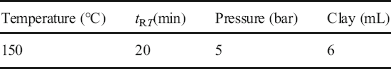
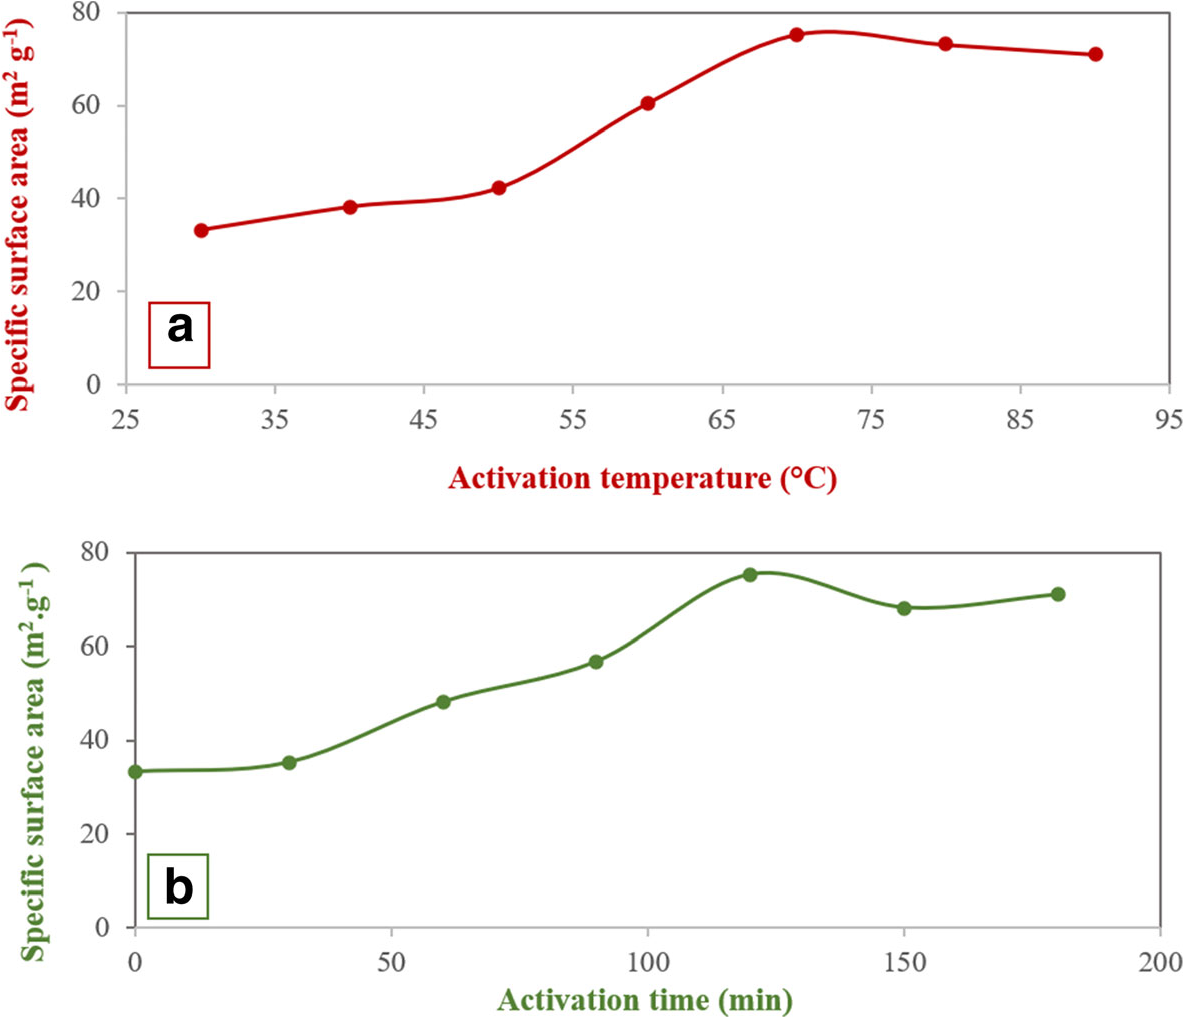
Fig. 2. The effect of a activation temperature and b activation time on the specific surface area of bentonite in the presence of 0.3 M HNO3
Catalytic Tests in the Batch System
The catalytic activity tests in the batch system (Fig. 3a) were carried out in an autoclave, equipped with a stirrer, nitrogen cylinder, and a controlled heating system to maintain the required temperature. The parameters are the same as the parameters of the continuous systems (Table 3). 4 g of activated clay sample along with 100 g of feedstock was poured into the autoclave. The autoclave was connected to the N2 cylinder to keep the pressure of the system at 5 bar and to reduce the boiling point of aromatic compounds. The temperature of the autoclave was fixed at 150°C for 20 min under stirring conditions. Afterward, the N2 (gas) was purged. The outlet fluid was filtered to separate the acid-activated sample from the feedstock, and then it was titrated to find the BI.
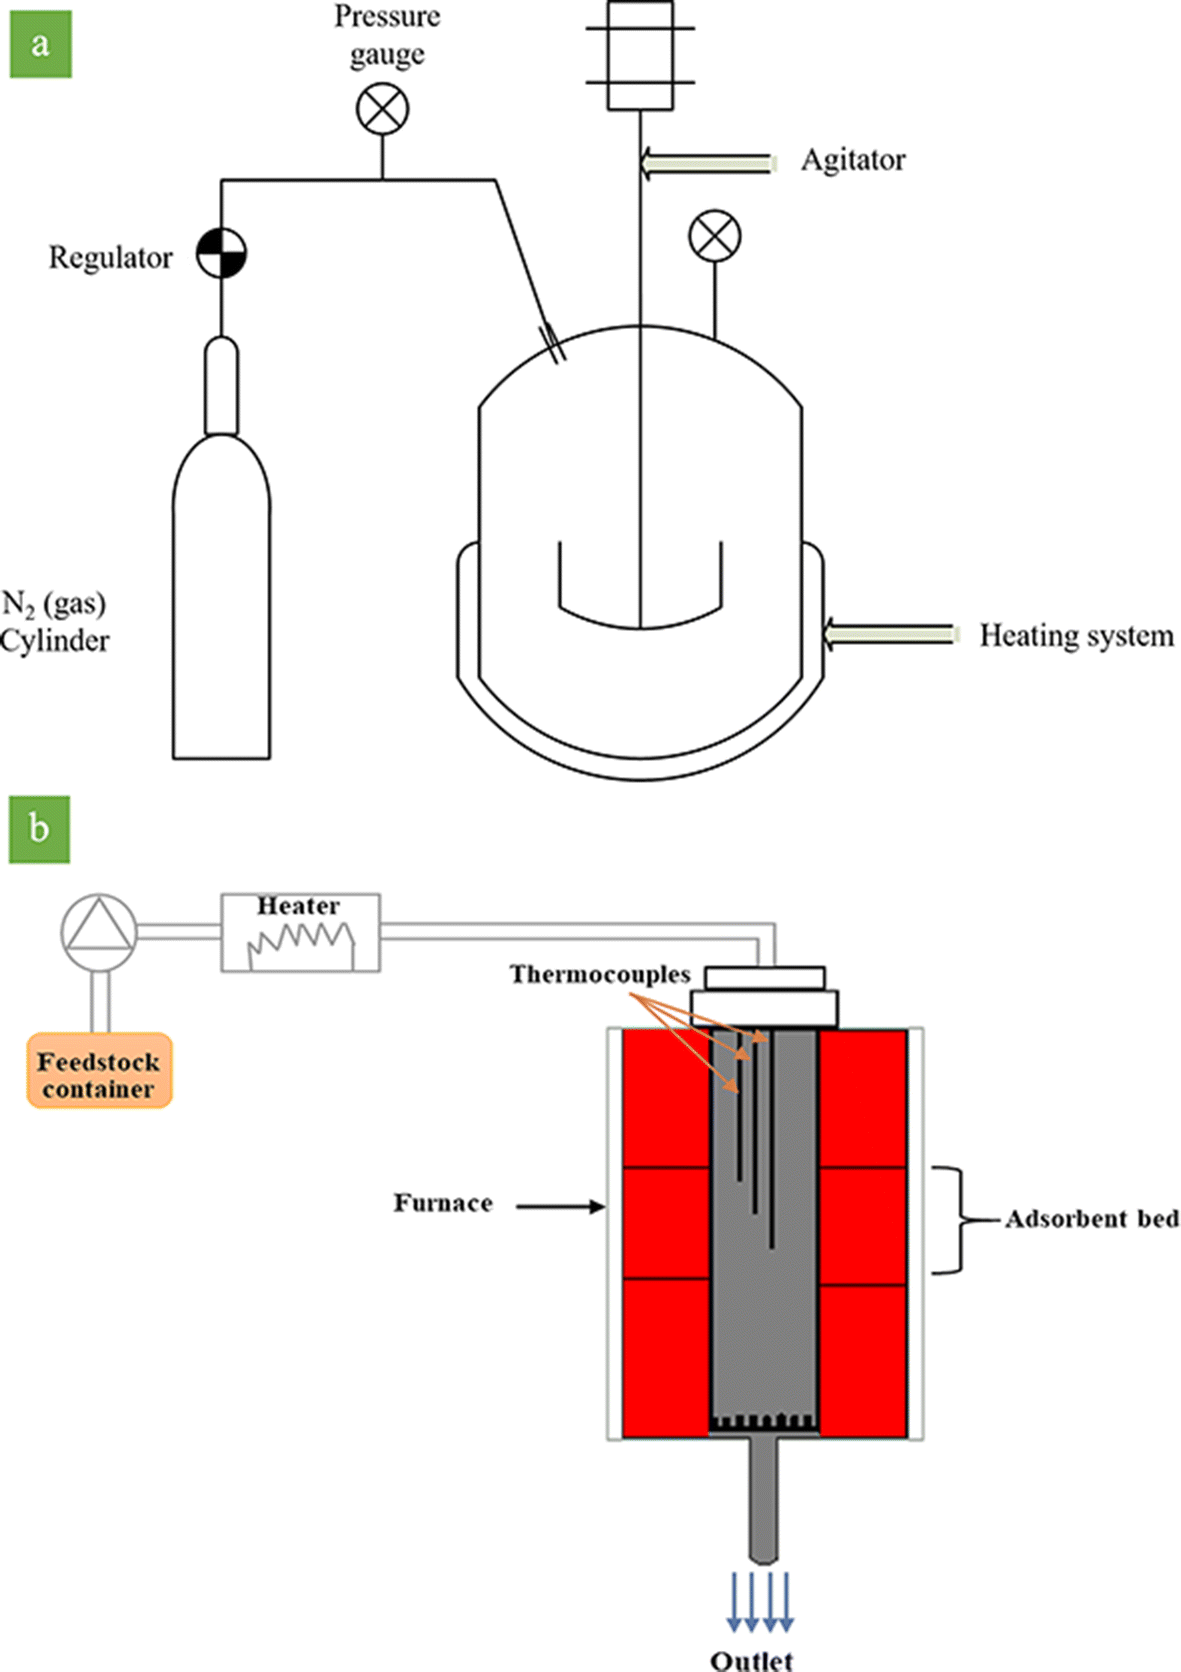
Fig. 3. Schematic representation of the reactor in a batch and b continuous systems
Catalytic Tests in the Continuous System
A continuous system was employed to evaluate the efficiency and lifetime of the activated clay. To this end, 4 g of activated clay was packed between two alumina grains of sand (40–60 mesh), and then placed in the reactor. The reaction temperature was ~150°C, the reaction pressure was 5 bar, and the liquid hourly space velocity (LHSV) was 20 h−1. Accurate temperature uniformity was achieved through three zones of the thermal furnace, which controlled the temperature inside the reactor. Three sets of thermocouples recorded the temperature of the middle zone. The temperature of the reaction zone was kept at 150°C by a temperature-control system connected to computer JUMO software. An Eldex Laboratories Inc (Napa, California, USA) pump (Optos Model 1SMP) was used to pump inlet feedstock into the reactor.
The schematic representation of the reactor is divided into three thermal regions (Fig. 3b). The catalyst was loaded in the middle part of the reactor. In order to determine the BI content, 4 g of the sample was withdrawn from the reactor output at 1 h time intervals. The olefin conversion was calculated according to Eqn. 2:
where BI0 and BI correspond to the Bromine Index of raw materials and effluent liquids of the reactor, respectively.
Characterization
The XRD patterns of the samples were recorded using a Philips-PW-1800 diffractometer (Watertown, Connecticut, USA). The measurements were performed at 40 kV and 40 mA over the range 10–80°2θ with a step size of 0.02°2θ, using CuKα radiation (λ = 1.54056 Å). The elemental composition of the samples (dried at 100°C for 6 h before testing) was measured by X-ray fluorescence (XRF) (SPECTRO XEPOS, Kleve, Germany) using an excitation current of 50 mA, an excitation voltage of 50 kV, and with a sensitivity of 0.001%.
The surface acidity of the catalyst was determined by temperature-programmed desorption (NH3–TPD) using a CHEMBET-3000 apparatus (Quantachrome Company, Graz, Austria). In this method, 0.1 g of the sample was placed in a tubular reactor. The sample was cleaned by He flow (30 mL min–1) from room temperature to 800°C for 10 min. Then, it was cooled to 100°C and saturated with NH3 gas for 30 min. The physisorbed ammonia was removed by passing He over it at 100°C. Finally, the samples were heated from 100 to 800°C, and the ammonia evolved was analyzed using an online TCD (Trombetta et al. Reference Trombetta, Busca, Lenarda, Storaro, Ganzerla, Piovesan, Lopez, Alcantara-Rodrìguez and Rodríguez-Castellón2000; Chen et al. Reference Chen, Wu, Zeng, Jiang and Shi2009; Alsawalha et al. Reference Alsawalha, Roessner, Novikova and Bel2011).
The textural parameters of the samples were determined by N2 adsorption-desorption measurements at 77 K using an ASAP 2010 instrument (Micromeritics, Norcross, Georgia, USA). Prior to the analysis, the samples were outgassed under vacuum at 200°C for 6 h. The specific surface area of the sample was measured using N2 adsorption-desorption isotherms. BET analysis provides precise specific surface area evaluation of materials by nitrogen adsorption measured as a function of relative pressure. The surface area is determined by calculating the amount of adsorbate gas corresponding to a monomolecular layer on the surface of the material. The technique encompasses external area and pore area evaluations to determine the total specific surface area. BET is used to determine a range of disperse, solid microporous to mesoporous materials. Barrett-Joyner-Halenda (BJH) analysis can also be utilized to define pore area and specific pore volumes through adsorption and desorption techniques (Barrett et al. Reference Barrett, Joyner and Halenda1951).
RESULTS AND DISCUSSION
Effect of Acid Concentration
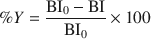
The activities of clays which were acid-activated in various ways were investigated in both batch and continuous systems. Experimental measurement of the batch system (Fig. 4a) revealed that the sample treated with 0.3 M HNO3 demonstrated better activity than other samples because the output fluid of the autoclave consumed a small amount of Br2 in the potentiometric analysis. It contained a small amount of the olefins as a result. Next, the activity of the acid-activated samples was evaluated in the continuous system (Fig. 4b). At the initial time, before the addition of any catalyst (BI = 0), the conversion percentage was maximum, according to Eqn. 2. During the reaction, various acid-activated samples showed different activities at removing olefins and consequently had different BI values. According to Eqn. 2, various conversion percentages were achieved, among which the sample modified with 0.3 M HNO3 had >50% catalytic activity for 20 h, whereas other samples showed less activity in olefin conversion. During acid treatment, some exchangeable cations (K+, Na+, and Ca2+) were replaced by hydrogen ions, and some cations such as Al3+ and Fe3+ were leached from the octahedral and tetrahedral sheets, with some located in the interlayer of the clay mineral and producing acid sites. At high concentrations of nitric acid (2 M and 1 M), cations such as Al3+ and Fe3+ were leached dramatically from the octahedral sheets. These cations, therefore, could not provide the clay with acid sites. In a low acid concentration (0.15 M), cations could not be extracted effectively from the octahedral sheets and, as a result, the sample demonstrated low activity in terms of olefin removal (Pu et al. Reference Pu, Liu, Jiang and Shi2012).
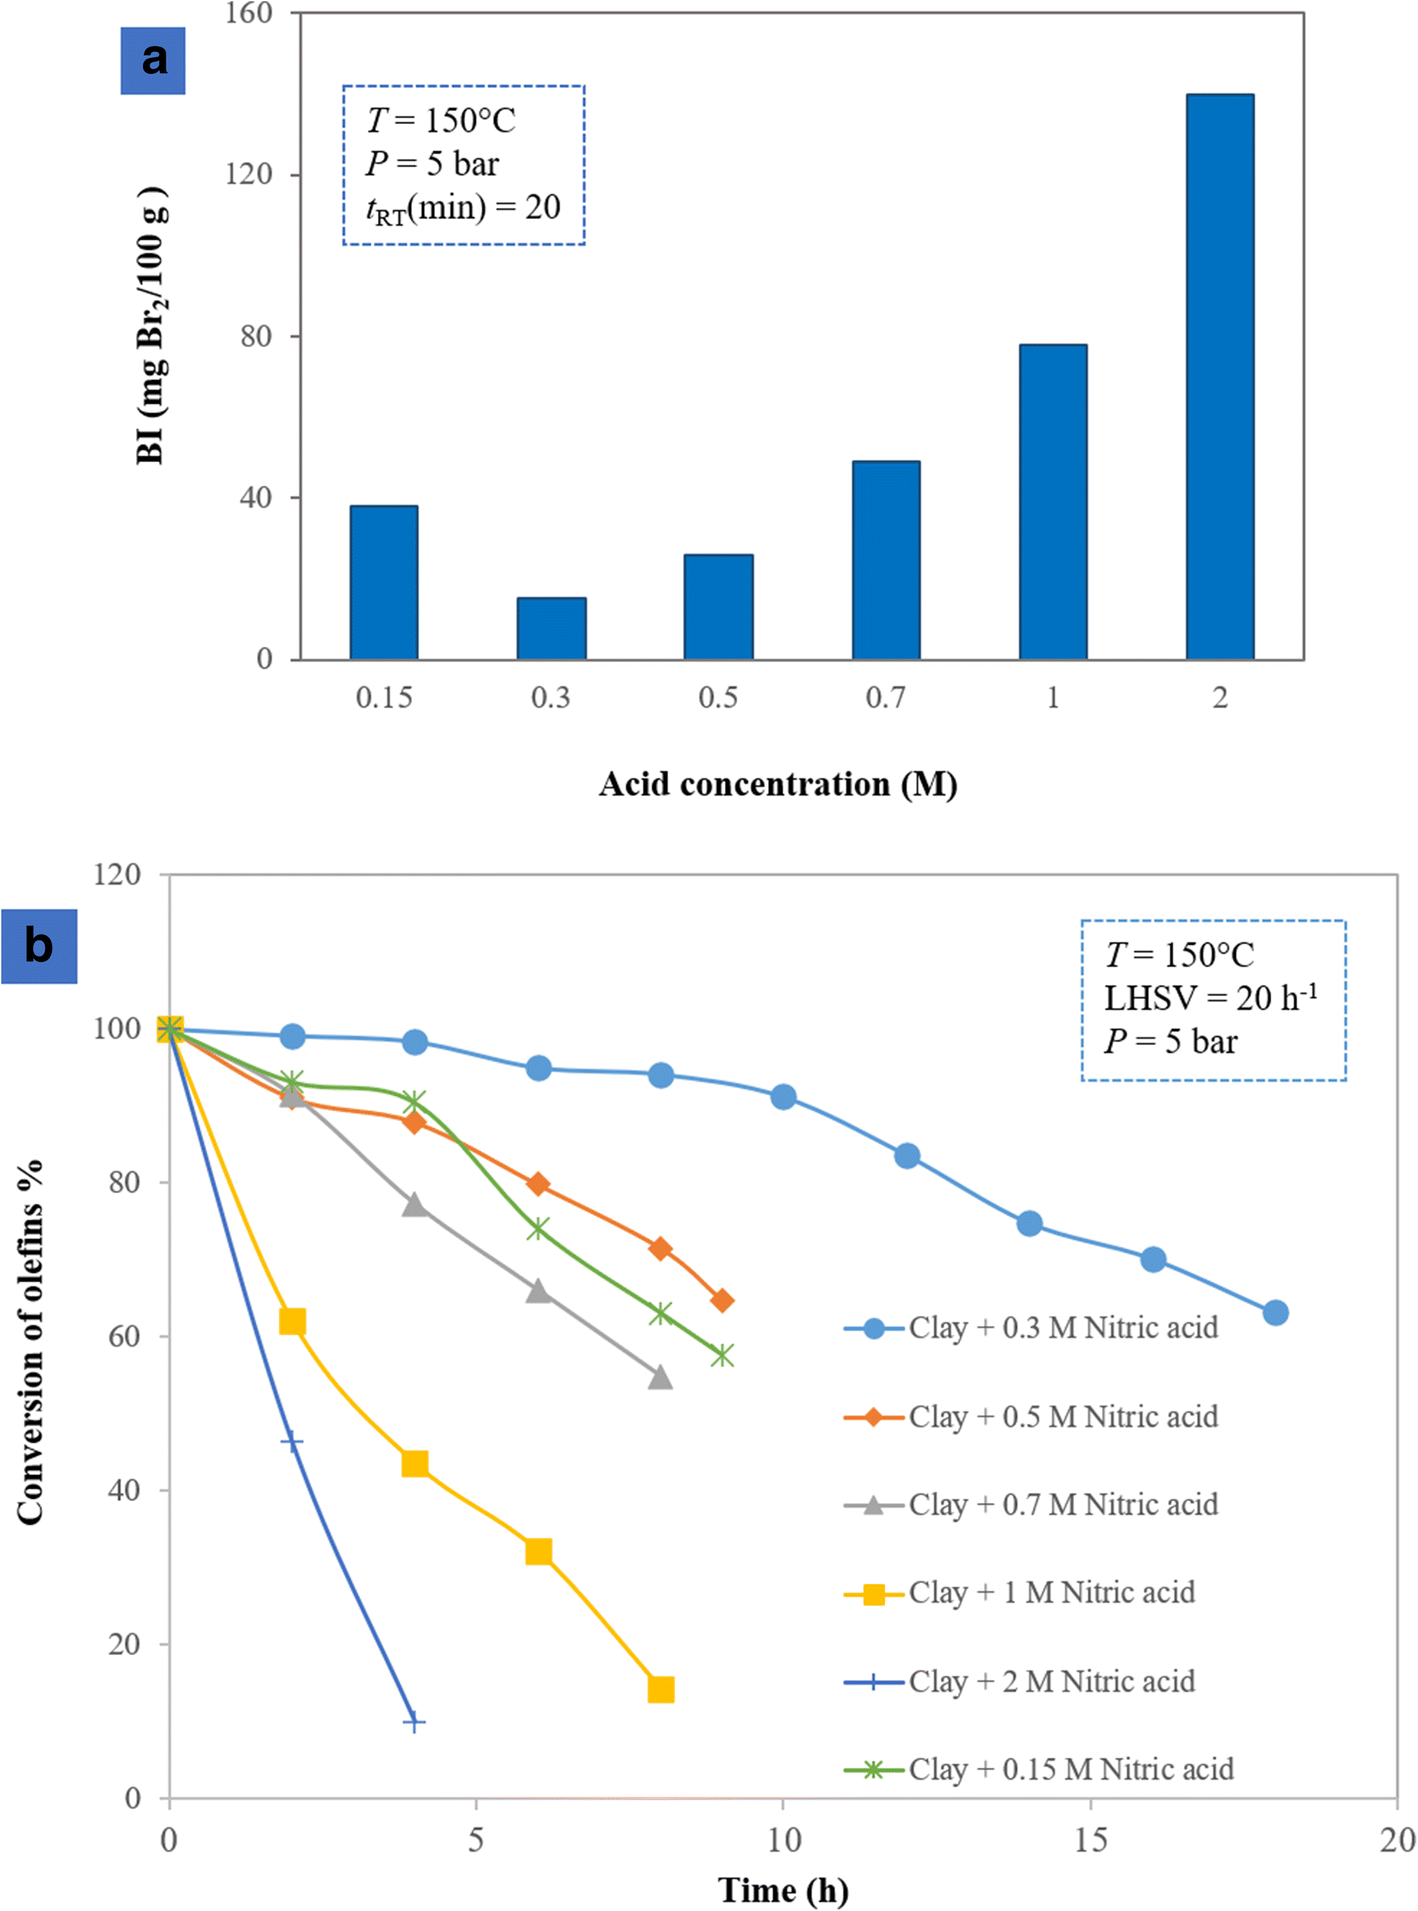
Fig. 4. Olefin conversion over the acid-treated catalysts with various concentrations in a batch and b continuous systems
Effect of Temperature on Reducing the BI
In the next step and to enhance the clays further, the optimum acid-activated clay, modified with 0.3 M HNO3, was treated at various temperatures. The results of batch (Fig. 5a) and continuous (Fig. 5b) tests demonstrated that the optimum acid-activated clay at a temperature of 150°C was best at reducing the amount of olefins in aromatic compounds. Acid-activated clay had both Lewis and Brønsted sites, where the Brønsted acidity derived from the dissociation of water molecules in the hydration sphere of the interlayer exchangeable cations (Eqn. 3), and Lewis acidity was usually associated with exposed Al3+ and Fe3+ at the broken crystallite edges of clay minerals, and such acidities can be increased by heating the clay. The hydrogen state of the clay mineral determines the total acidity and ratio of Brønsted to Lewis sites. In the activated clay, Si–OH–Al groups as Brønsted sites were stronger than Al–OH–Al and Si–OH–Si. The acidity of Si–OH–Al groups was influenced enormously by drying (Lagaly Reference Lagaly2006; Chen et al. Reference Chen, Wu, Zeng, Jiang and Shi2009). Heating the clay led to the elimination of the interlamellar water and exposed more acidic sites to the reactant. Based on the results of the batch and continuous systems, most of the interlayer water evidently was driven out at 150°C. Consequently, the modified sample provided more accessible acid sites for olefin reactions. Although higher temperatures (>300°C) removed the interlayer water and dehydrated the metal cations in the interlayer, it led to the irreversible collapse of the clay layers (Bradley and Grim Reference Bradley and Grim1951). Because catalyst activity depends significantly on the amount of water available between the layers, thermal treatment was considered to be a crucial factor

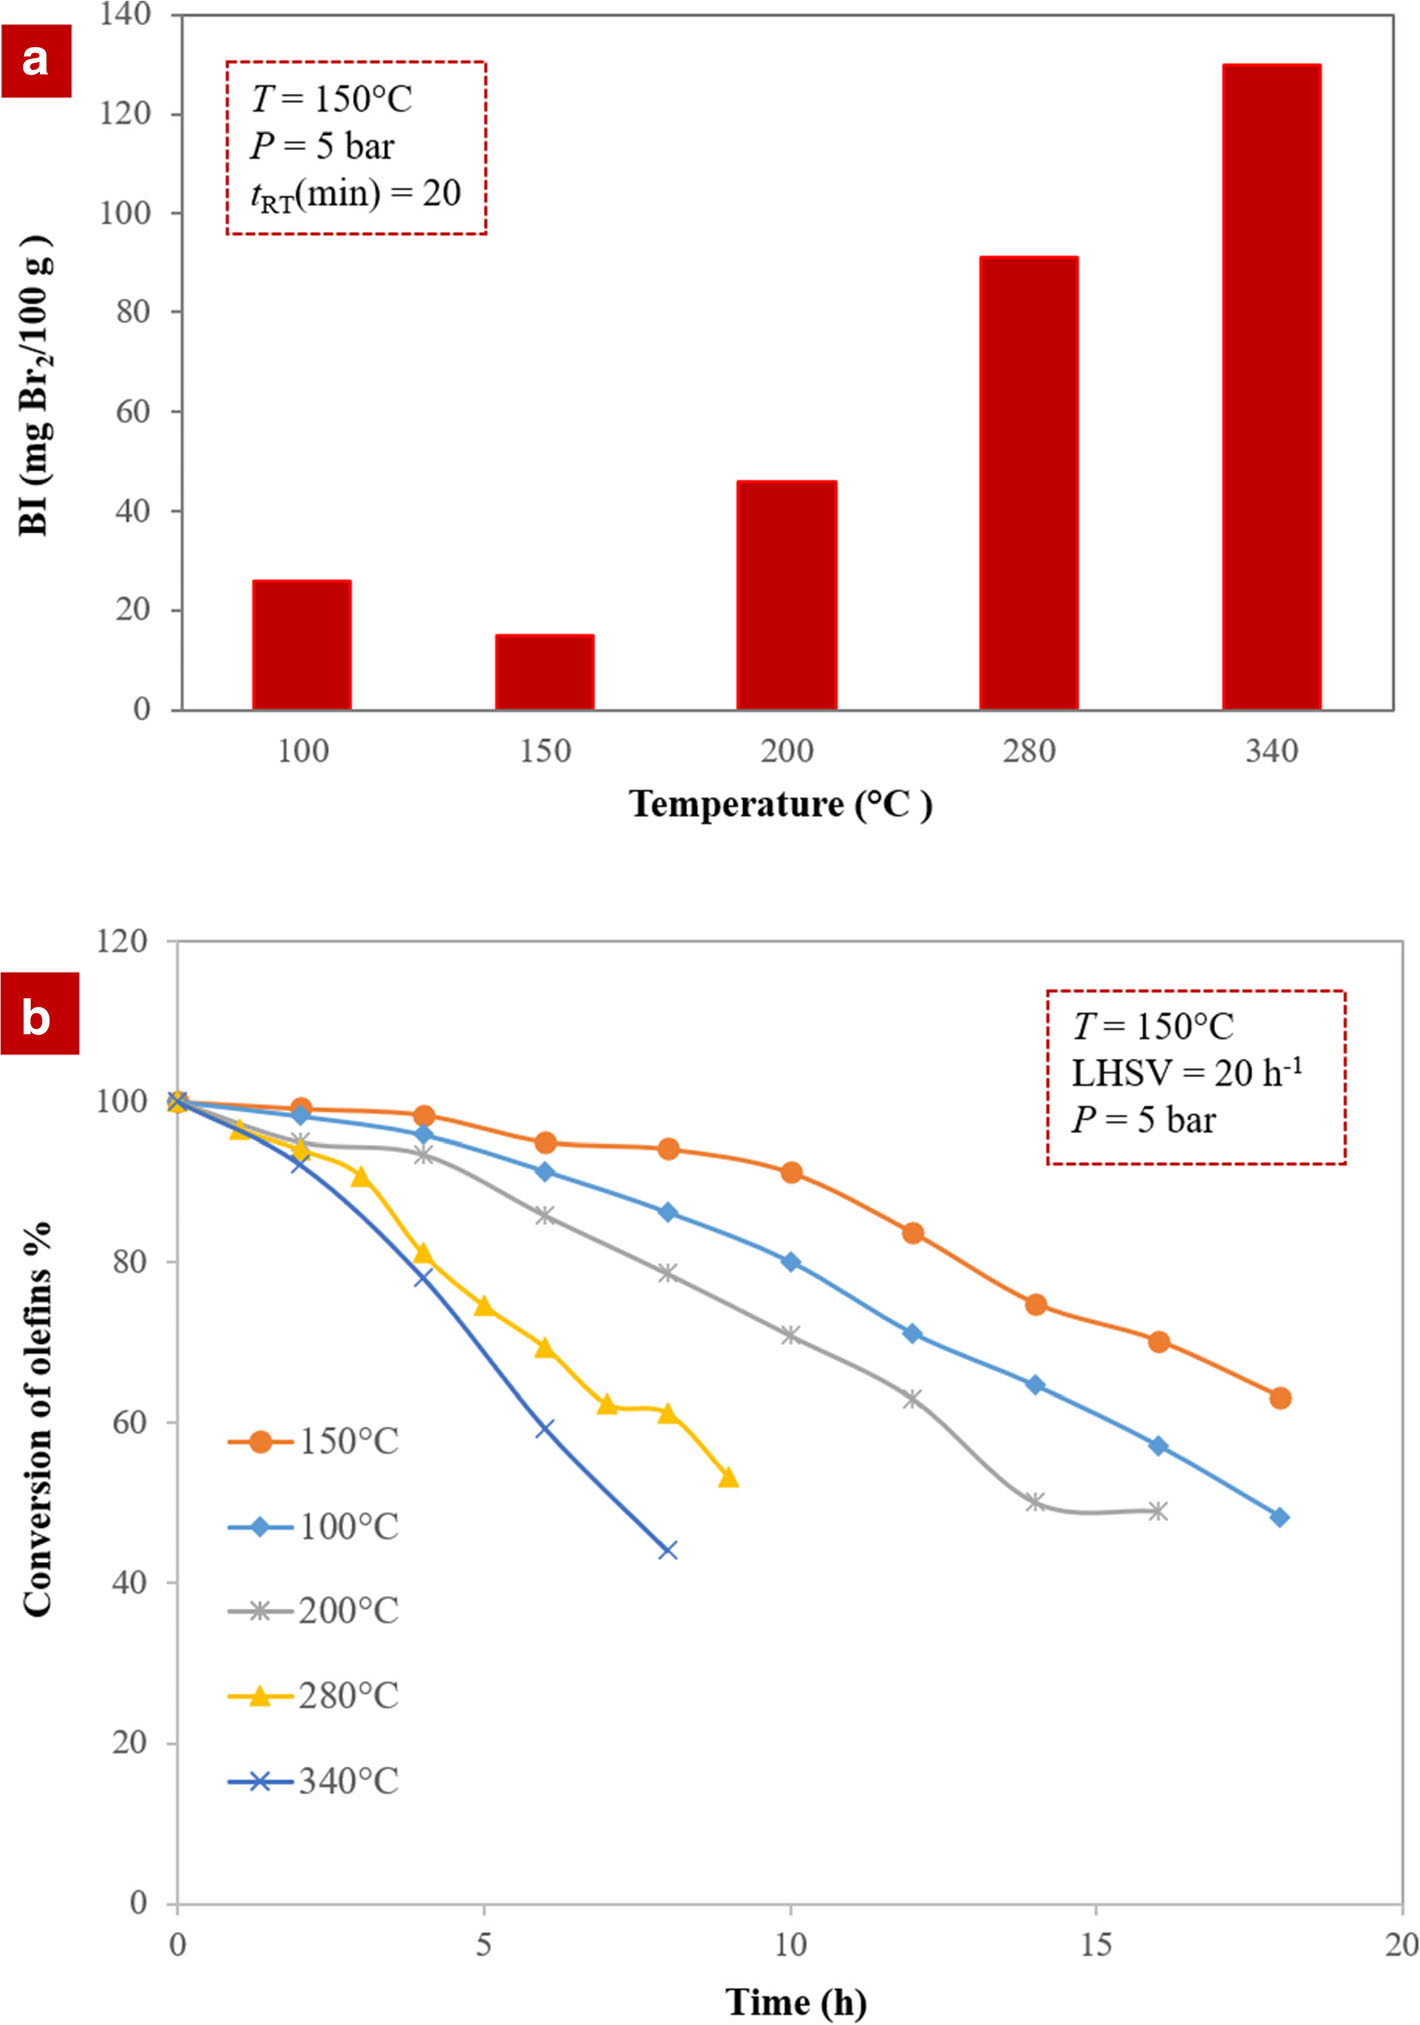
Fig. 5. Olefin conversion over the thermally treated catalysts with various temperatures in a batch and b continuous systems
The Friedel-Crafts alkylation of benzene with olefins over solid acid catalysts is widely known to occur through the generally accepted carbenium-ion mechanism (Fig. 6). The olefin molecules are converted into a carbenium ion intermediate through the action of a Lewis (L) acid site and a Brønsted (B) acid site. Lewis acid sites accept hydride ions (H–) from an alkane, and Brønsted (B) acid sites attack π electrons of the olefin molecule. The unstable carbenium ion reacts with aromatics by an alkylation reaction. The desorption process and the loss of the hydron provide the alkylated aromatic and restores the acid sites (Guo et al. Reference Guo, Zhang, Li, Peng, Xiong, Wang, Hu, Yao and Chen2020) (Fig. 6).
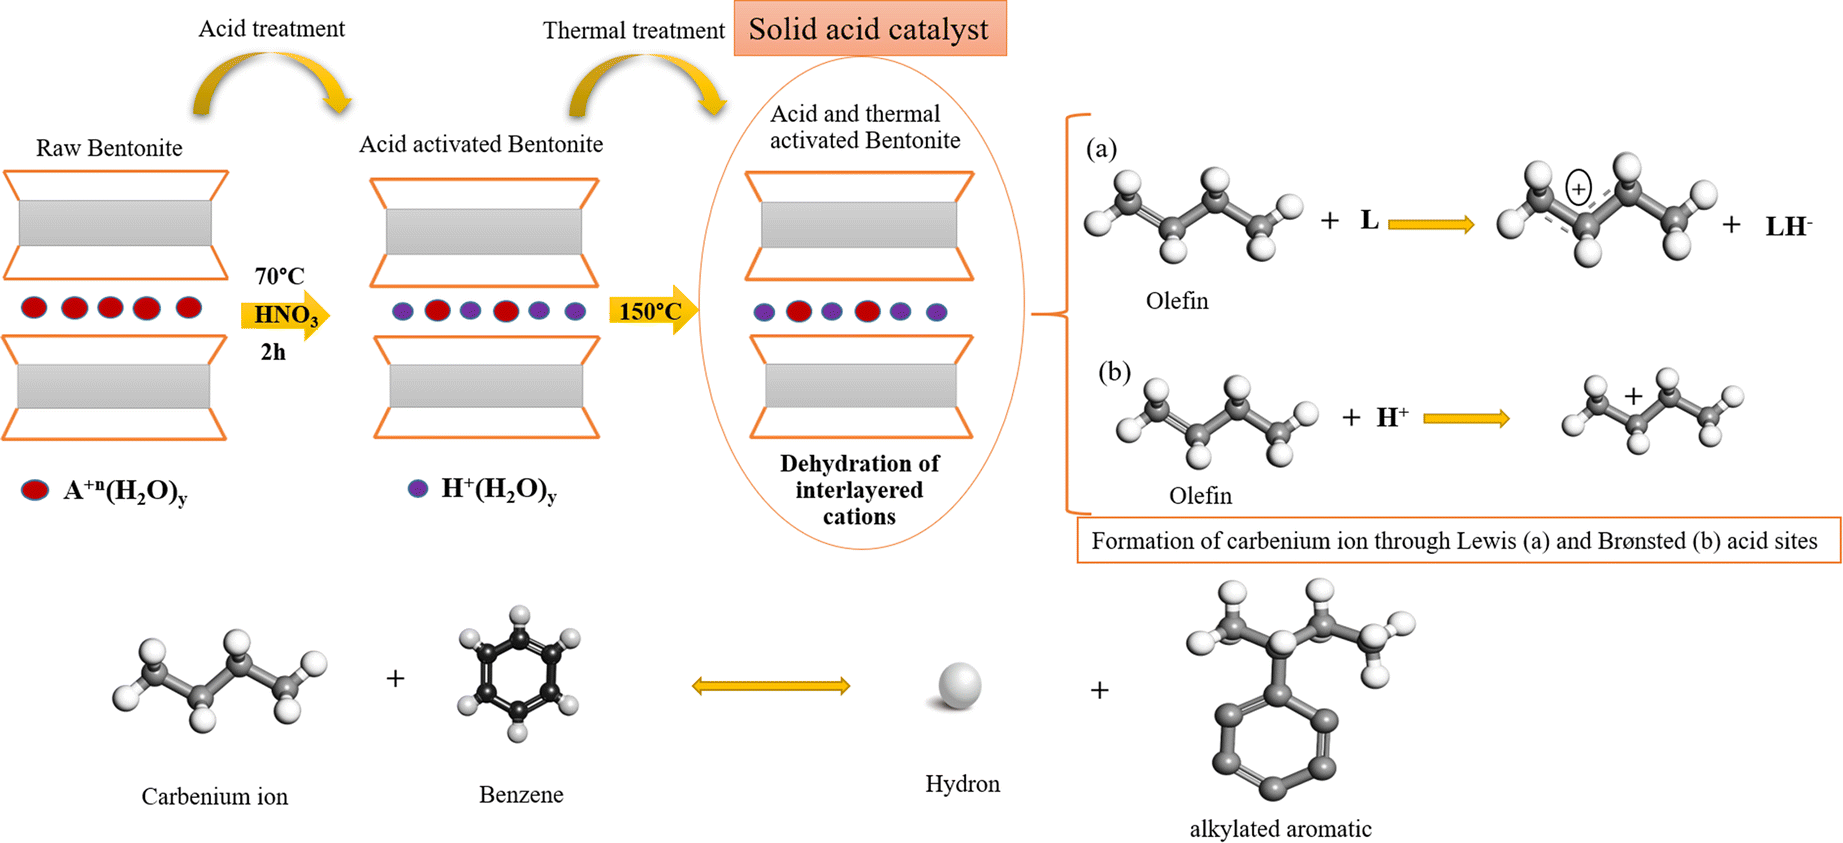
Fig. 6. The reaction between olefins and aromatics
XRD Analysis of the Samples
The mineralogical changes in bentonite before and after olefin removal reactions were determined by XRD of raw bentonite and the optimum acid-activated sample. The XRD patterns demonstrated that bentonite has Ca-rich montmorillonite (d 001 at ~6°2θ) as the main clay mineral. The peaks that appeared at ~20 and 36°2θ belonged to montmorillonite and illite. The XRD patterns revealed that the intensity of the peaks belonging to the main montmorillonite was decreased by HNO3 activation, which indicated that the crystallinity of Ca-montmorillonite is affected considerably by acid activation (Fig. 7). More changes were observed by increasing the acid concentration due to the decomposition of the structure. X-ray diffraction patterns of the optimum sample after olefin removal (Fig. 7d) showed structural changes mainly in the quartz intensity at 27°2θ. The intensity of the peaks belonging to the montmorillonite at ~6 and 23°2θ were also noted to decrease. The results indicate that the olefin-removal reaction did not have a severe effect on the catalyst structure, however.
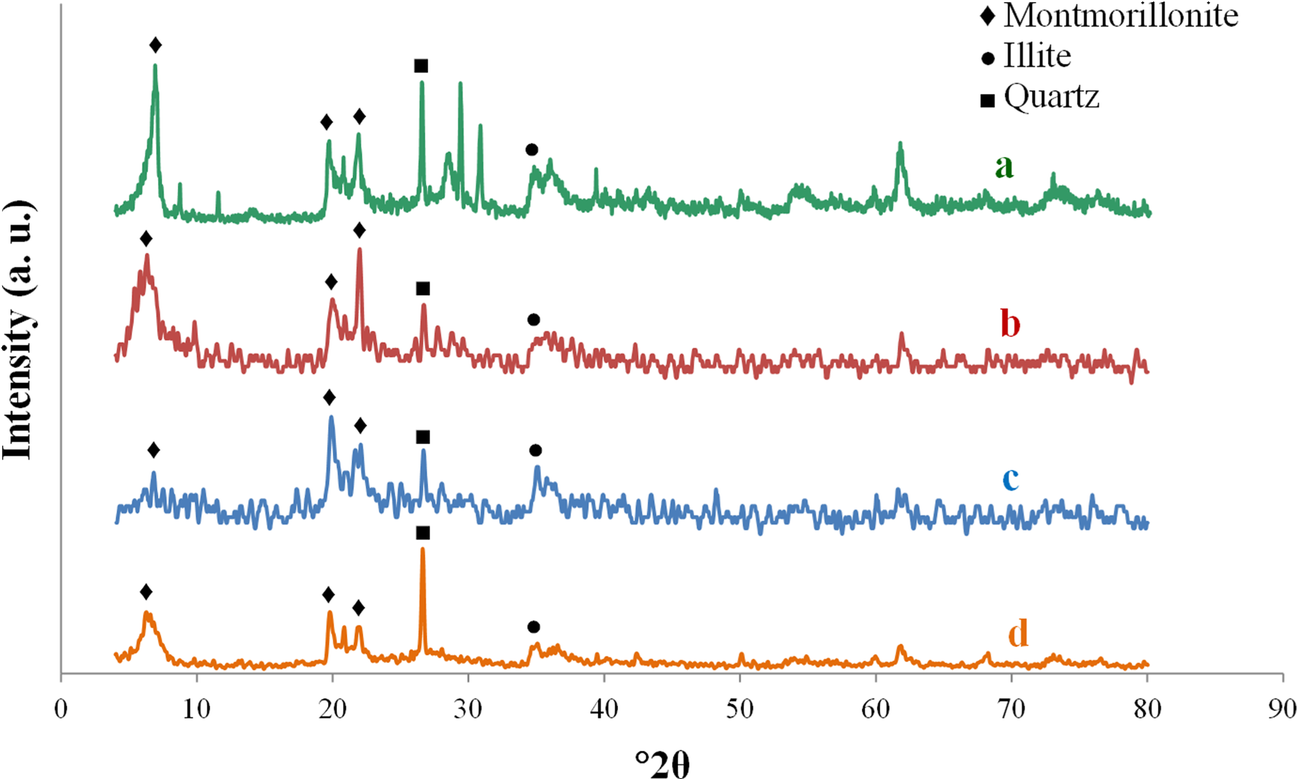
Fig. 7. XRD patterns of a raw bentonite, b optimum acid-activated sample before olefin removal reaction, c clay activated by 1 M HNO3, and d optimum acid-activated sample after the olefin-removal reaction
TPD Analyses
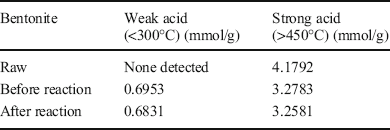
The surface acidity of the catalyst plays an essential role in regulating the activity of the alkylation reaction. The total acidity of the raw bentonite as well as that of the acid-activated clay were measured before and after olefin removal by ammonia temperature-programmed desorption (NH3-TPD) (Trombetta et al. Reference Trombetta, Busca, Lenarda, Storaro, Ganzerla, Piovesan, Lopez, Alcantara-Rodrìguez and Rodríguez-Castellón2000). Weak and strong acid sites existed in the raw and optimum acid-activated clay at desorption temperatures of <300°C and >450°C, respectively (Fig. 8). The raw bentonite showed a sharp peak at ~670°C. In comparison, the optimum acid-activated clay exhibited two peaks at desorption temperatures of 230°C and 750°C, which can be related to two different types of active sites. Below 300°C, the weak coordination bands of ammonia with Lewis acid sites were broken, which led to the desorption of ammonia and the appearance of the first peak. Compared to the optimal sample, this peak was smaller for the raw bentonite, implying a very small number of weak Lewis acid centers. The peaks at >450°C were due to the strong Brønsted acid sites (Table 4). Acid activation causes a decrease in the intensity of the peak at >450°C for the optimal sample, whereas peaks at <300°C became stronger (Fig. 8). Weak Lewis acid sites were suggested by Pu et al. (Reference Pu, Liu, Jiang and Shi2012) to play a crucial role in removing olefin. Acid treatment of clay at a controlled value can, however, increase enormously the number of weak Lewis acid centers available for olefin alkylation. The surface acid sites of the sample showed no obvious differences after the reaction (Table 4). These observations lead to the conclusion that surface acid sites of the catalyst are secure during the process of olefin removal.
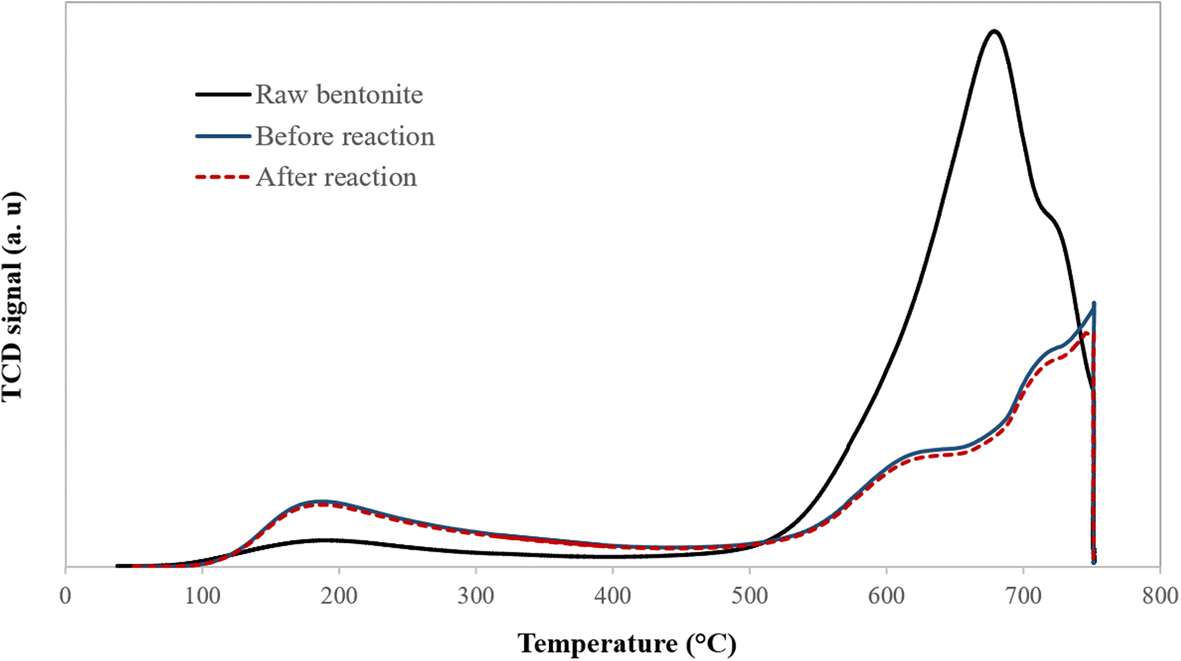
Fig. 8. Profiles of temperature-programmed desorption of ammonia for raw and optimum acid-activated bentonite before and after the olefin-removal reaction
Table 4. Acid-content distribution for the raw bentonite and for the optimal catalyst before and after reaction
Surface Texture Analysis
The N2 adsorption-desorption isotherms of the raw bentonite and the optimum acid-activated clay were measured using the ASAP 2010 instrument (Fig. 9). The isotherm for these samples was characterized as type IV based on the IUPAC classification, corresponding to mesoporous adsorbents, which have suitable porosity for the accommodation of aromatic molecules (Kooli et al. Reference Kooli, Hian, Weirong, Alshahateet and Chen2006). The hysteresis loops of the samples resemble the H3 type, which indicated the existence of uniform aggregates of plate-like particles consisting of slit-shaped pores in the samples (Kumar et al. Reference Kumar, Jasra and Bhat1995; Kooli et al. Reference Kooli, Hian, Weirong, Alshahateet and Chen2006).
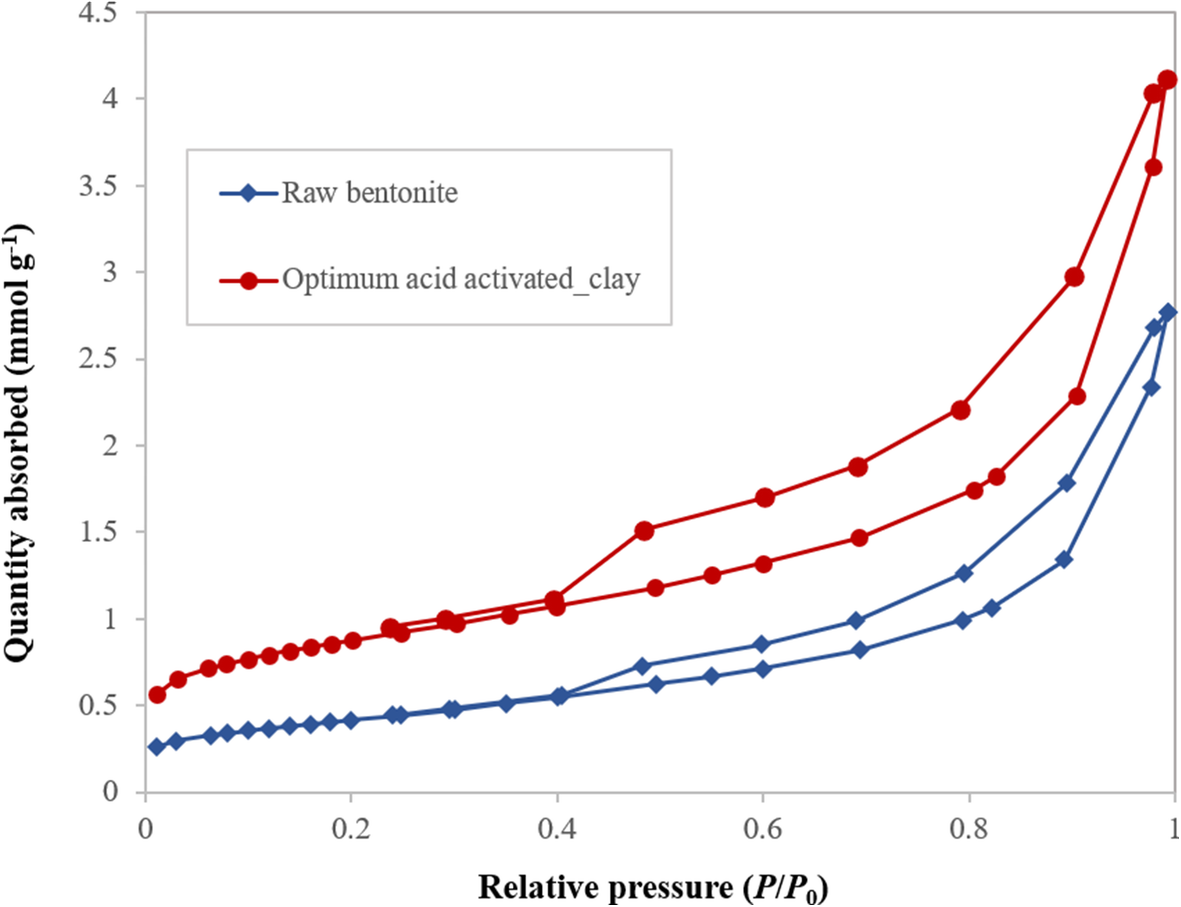
Fig. 9. N2 adsorption/desorption isotherm for raw and acid-activated bentonite
The results of TPD and N2 adsorption-desorption analysis revealed that the surface acidity and textural properties of the clay were altered greatly by acid treatment (Murilo et al. Reference Murilo, Luna, Cecilia, Maria and Saboya2018; Hao et al. Reference Hao, Pudasainee, Gupta, Kashiwabara, Alessi and Konhauser2019). A net negative electric charge on the surface of the clay formed by the substitution of trivalent and divalent ions of the octahedral and tetrahedral sheets is balanced either by Ca2+ or Na+. During acid treatment, a considerable amount of these ions can be removed and replaced by hydrogen ions. Bentonite also contains Fe2+, Mg2+, and Al3+ as the second group of cations that belong to the octahedral sheets (Güven Reference Güven2009; Ross and Shannon Reference Ross and Shannon1926). Some of these ions in the octahedral sheets are dissolved out, leaving floppy silica sheets on acid modification. Folding of the sheet can make a mesopore, which has the ability to accommodate larger molecules for sorption and catalysis (Table 5) (Emam et al. Reference Emam, Centi, Perathoner and Vaccari2008; Alothman, Reference Alothman2012). The results of N2 adsorption-desorption analysis (Table 5) indicated that the acid treatment improved the textural properties of raw bentonite and provided suitable sites to accommodate aromatic molecules. Moreover, during the reactions and formation of reaction mixture-components the total pore volume and specific surface area of the catalyst decreased (Table 5).
Table 5. Structural and textural parameters for the raw bentonite and for the optimum modified bentonite before and after the olefin-removal reaction
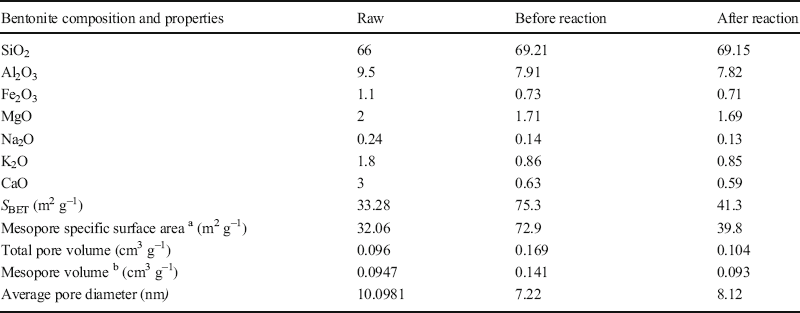
aand b: the mesopore surface area and the mesopore volume were calculated using the BJH method.
Surface Morphology of Samples
The surface morphology of the modified bentonite was analyzed by scanning electron microscopy (SEM) to evaluate the effects of acid and thermal treatment on the raw bentonite (Fig. 10). The results showed that the surface morphology of raw bentonite changed significantly during acid and thermal activation. The physicochemical reactions altered the morphology of the clay as the pores opened, and the clay surface appeared to be more porous and homogeneous. Acid activation followed by thermal activation provided more porous clay due to the removal of any water that was already present in the clay or which was adsorbed during the washing of acid-activated clay. From Fig. 10, it was observed that the bentonite particles were sub-angular, and that acid activation enhanced the specific surface area of the clay and led to significant mesoporosity (Amari et al. Reference Amari, Gannouni, Khan, Almesfer, Elkhaleefa and Gannouni2018). The irregular shape of the particles of the optimum sample before and after olefin removal showed no significant differences (Fig. 10b,c).
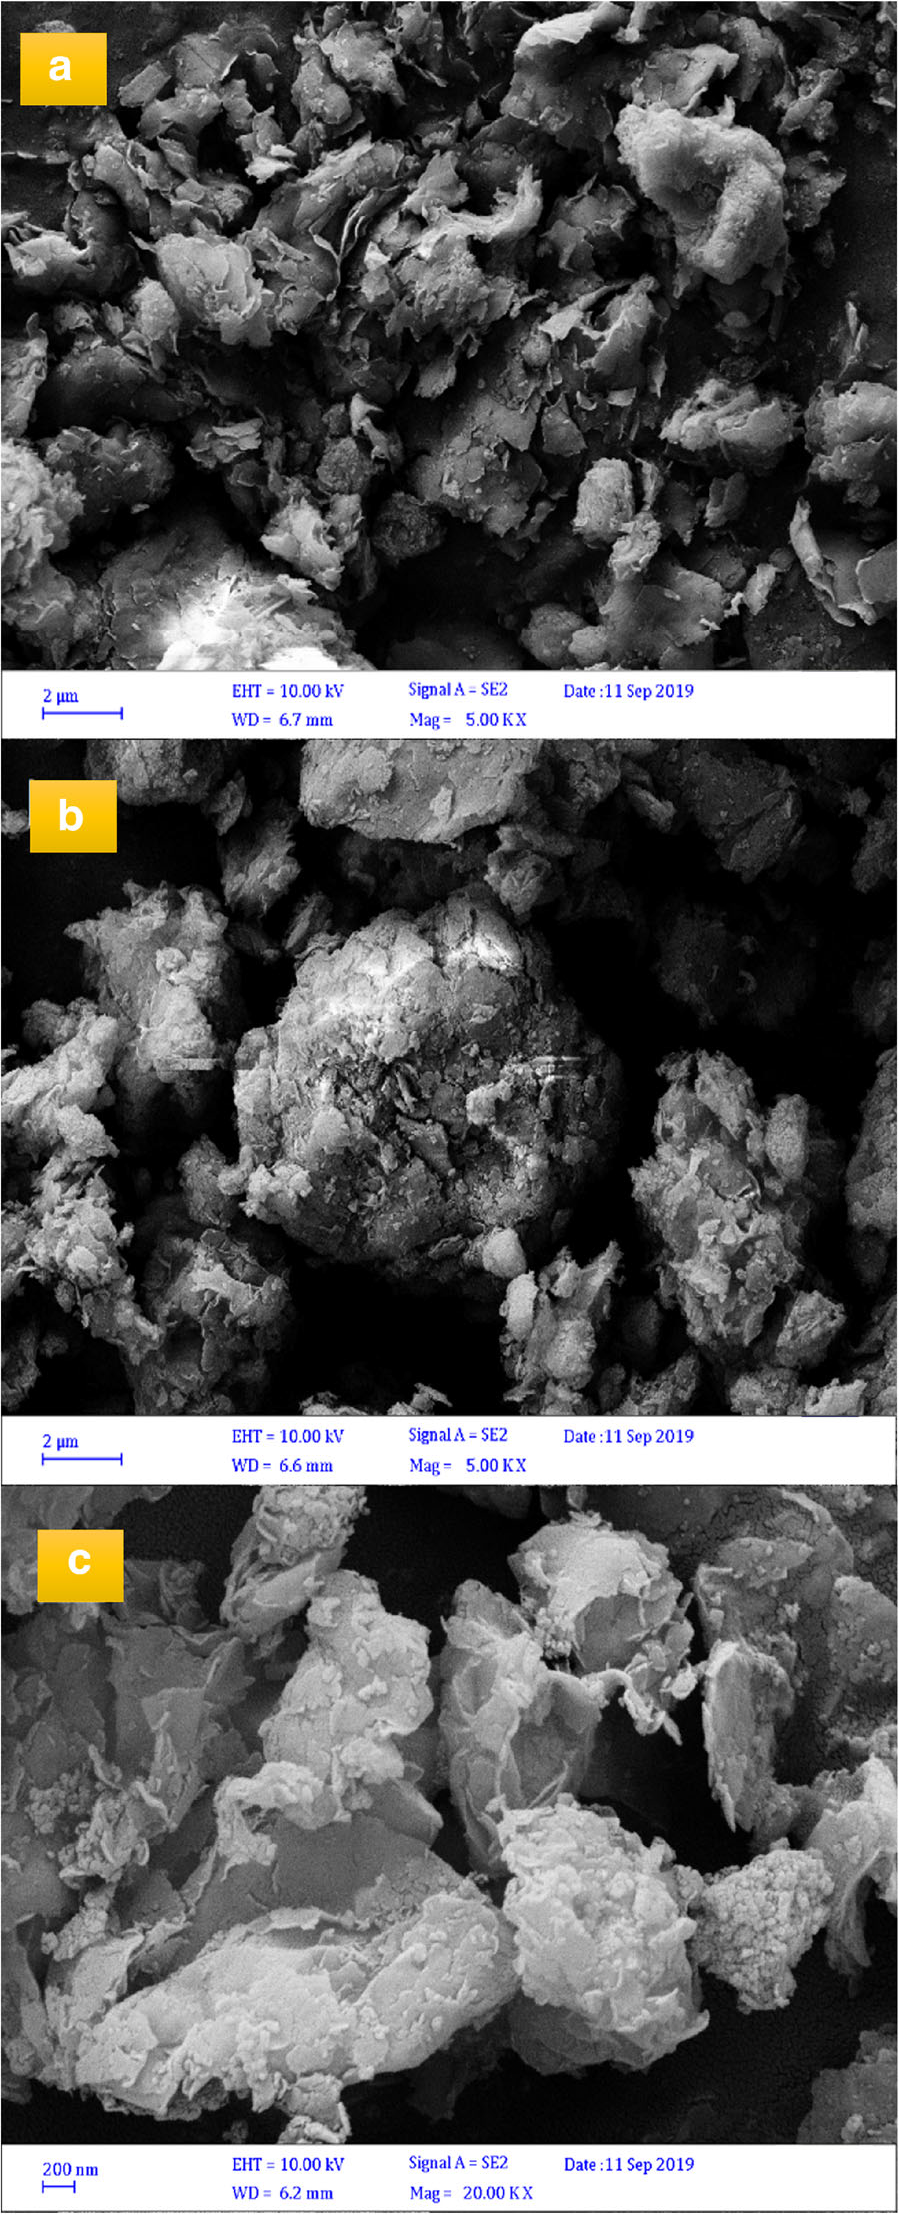
Fig. 10. SEM images of: a raw bentonite; b and c optimum acid-activated bentonite before and after olefin removal reaction, respectively
Conclusions
In the present study, clay was treated at various acid concentrations and temperatures to prepare a novel and efficient catalyst for the removal of unsaturated hydrocarbons from aromatic compounds. The results of batch and continuous tests revealed that clay modified with 0.3 M HNO3 at a temperature of 150°C led to superior activity in comparison with the other samples. The XRD results suggested that the clay modified with 0.3 M HNO3 affected considerably the crystallinity of Ca-montmorillonite. The XRD patterns showed that the Ca-montmorillonite peak intensity was decreased by HNO3 activation. The result of TPD analysis indicated that the weak Lewis acid sites played a central role in the catalytic activity, and the sample with many weak Lewis acid sites resulted in better removal of olefins from aromatic compounds. The surface morphology of the modified bentonite indicated that the thermal and acid treatment changed considerably the morphology of the raw bentonite, developing a large number of mesopores. The results of SEM and TPD characterization indicated that the morphology and surface acid sites of the catalyst were stable during the alkylation reaction. The XRD results showed slight changes in the structure of the optimum sample after olefin removal. Finally, potentiometric analysis was employed as an appropriate method to measure the BI of the outlet fluid of both batch and continuous systems.
Compliance with Ethical Statements
Conflict of Interest
The authors declare that they have no conflict of interest.


