


Adopting green concepts is crucial for long-term sustainable development, and a radical change in value systems is necessary (Kokeza, Reference Kokeza2023). The production of ceramics involves heavy use of energy, natural resources, flue gas and waste. The manufacture of 1 m2 of ceramic tiles requires 21–23 kg of raw materials and 30–40 kWh of energy (Wang et al., Reference Wang, Liu, Cui, Sun, Gong, Gao and Wang2020). The cost of raw materials accounts for 40% of production costs (Ye et al., Reference Ye, Hong, Ma, Qi and Yang2018), while another 30–40% (United Nations Industrial Development Organization, 2020) is related to the energy needed for the total cost of production. To reduce costs, ceramic production units should adopt technologies such as those related to efficient firing, energy management and process optimization in light of the circular economy and sustainable development (Mezquita et al., Reference Mezquita, Monfort, Ferrer and Gabaldón-Estevan2017; Soldati et al., Reference Soldati, Zanelli, Cavani, Battaglioli, Guarini and Dondi2022; Molinari et al., Reference Molinari, Alaya, Pasti, Guarini, Dondi and Zanelli2023; Radojević & Vasić, Reference Radojević and Vasić2023). Dry milling is gaining momentum again due to its potential to reduce water demand by up to 74% and, consequently, the thermal and electrical energy spent on drying the so-obtained slurry (78% and 36%, respectively), thereby reducing the CO2 footprint (Mezquita et al., Reference Mezquita, Monfort, Ferrer and Gabaldón-Estevan2017; Alves et al., Reference Alves, Skorych, De Noni, Hotza, Gómez González and Heinrich2024).
The residential construction market has been expanding gradually worldwide as of 2021 (https://cerampakhsh.com/en/blog/global-ceramic-tile-market), and so there has been a continuous increase in the demand for ceramic tiles, which increases the need for raw materials to make affordable houses (Zaccaron et al., Reference Zaccaron, de Souza Nandi, Dal Bó, Peterson, Angioletto and Bernardin2020). Access to mineral resources is a major factor in the competitiveness of tile manufacturers. Yet, extensive mining of naturally existing quartz, feldspar and kaolinite deposits is endangering the availability of these raw materials globally (Dondi, Reference Dondi2018; Dondi et al., Reference Dondi, García-Ten, Rambaldi, Zanelli and Vincent-Cabedo2021). Additionally, several beneficial deposits that are relevant to this industry are unavailable due to the ongoing war in Ukraine (Korshunov & Boguslavskiy, Reference Korshunov and Boguslavskiy2022). Natural clay deposits have been investigated as the only low-cost component suited for both local and export applications to facilitate the manufacture of industrial ceramics (Vasić et al., Reference Vasić, Pezo, Vasić, Mijatović, Mitrić and Radojević2022; Vasić & Radojević, Reference Vasić and Radojević2023).
Ceramic batches require significant amounts of clay minerals, quartz and feldspars, with their composition varying according to the final product applications, which is mostly defined by the water absorption (WA), modulus of rupture (MR), colour and refractoriness of the materials (Alves et al., Reference Alves, Skorych, De Noni, Hotza, Gómez González and Heinrich2024). The optimal porcelain stoneware tile composition ranges from 15% to 38% kaolinite, 0% to 20% illite, 20% to 40% quartz and 20% to 45% feldspar (Dondi et al., Reference Dondi, Raimondo and Zanelli2014; Alves et al., Reference Alves, Skorych, De Noni, Hotza, Gómez González and Heinrich2024). Optimizing raw material compositions and granulometries is essential to improving resource efficiency and sustainability. Additionally, it is advantageous to employ a one-component system of a raw material that already contains quartz, feldspar and clay minerals; therefore, additional testing is required to determine any such potential applications. The Al2O3/Fe2O3 ratio is a rapid way to assess the suitability of such materials for use in various ceramic products based on their chemical makeup. Clays with an Al2O3/Fe2O3 ratio of more than 5.5 are thought to be beneficial for creating white or refractory ceramics, while iron-rich clays with an Al2O3/Fe2O3 ratio of less than 5.5 can be utilized to produce bricks and tiles (Garcia-Valles et al., Reference Garcia-Valles, Alfonso, Martínez and Roca2020). However, notwithstanding the issues with the final tile colour, the high concentration of iron-bearing minerals greatly accelerates glass formation and sintering, which results in low strength and WA (Il'ina & Lebedeva, Reference Il'ina and Lebedeva2010). The amount of free Fe2O3 and TiO2 in a ceramic object after firing mostly determines its colour. Fe3+ and Ti4+ decrease the purity of kaolinitic raw materials and cause a dark firing colour due to the formation of ilmenite upon the replacement of Al3+ in the clay minerals (Garcia-Valles et al., Reference Garcia-Valles, Alfonso, Martínez and Roca2020; Martínez et al., Reference Martínez, Garcia-Valles and Alfonso2023; Nandi et al., Reference Nandi, Zaccaron, Raupp-Pereira, Arcaro, Bernardin and Montedo2023). Additionally, the colour of ceramics is also dependent on firing temperature (FT), porosity, pore structure and the quantity of the clay minerals. Industrial production requires ceramic porcelain stoneware batches to contain up to 1.3–1.5% Fe2O3 and 1.0% TiO2, with the literature recommending less than 1% Fe2O3 (Wang et al., Reference Wang, Wang, Li, Liu, Zhang, Chang and Wang2021). However, there is no specific such recommendation for majolica wall tiles, unless white bodies (calcareous earthenware) are requested (Dondi et al., Reference Dondi, Raimondo and Zanelli2014).
Clays considered appropriate for producing refractory ceramics must have minimal amounts of Fe2O3, TiO2 and K2O (SRPS EN ISO 10081-1-3:2010, 2010). Since all of these constituents affect the melting point and the quantity of the liquid phase, the content of TiO2 should be between 1% and 4%, with Fe2O3 not exceeding 2.5% and Na2O + K2O + CaO + MgO being less than 6% (Grine et al., Reference Grine, Moussi, Hajjaji, Pilate, Yans and Jamoussi2021). Materials that include more than 15% of Al2O3 + TiO2, up to 76% of SiO2, 3.7% of Fe2O3, 3.7% of Na2O + K2O and 1.0% of CaO, as computed for the fired state, are classified as standard-defined refractory clays (SRPS B.F1.010:1984, 1984). Refractoriness is improved by there being a greater abundance of kaolinite (Zanatta et al., Reference Zanatta, Boca Santa, Padoin, Soares and Gracher Riella2021).
Several investigations have been carried out before on Serbian ceramic and refractory clays (Radosavljević et al., Reference Radosavljević, Stojanović, Radosavljević-Mihajlović, Vuković, Matijašević, Stojanović and Kašić2014; Filipović-Petrović et al., Reference Filipović-Petrović, Stanojević, Antonijević-Nikolić and Lj2018; Vasić et al., Reference Vasić, Pezo, Vasić, Mijatović, Mitrić and Radojević2022). Through using ternary diagrams as a rapid way to assess the grade of deposits, this work illustrates the value of natural clays to be used as one-component systems in the production of ceramics. This results in a rapid screening process that makes it possible to assess whether a raw clay can be used in industrial manufacturing while preserving already-scarce natural resources. Diagrams connecting the chemical and mineralogical content, particle-size distribution and various clay types are also shown. This work also compares these results with graphs identified in studies conducted throughout the past century. Synergistic results are obtained by combining the characteristics of raw clays with those of fired ceramic tiles and by employing statistical analysis.
Interest and importance of ternary diagrams in studying clays
Ternary diagrams are commonly employed in geology, ceramics and physical chemistry. Since the introduction of ternary diagrams by Riley (Reference Riley1951), Shepard (Reference Shepard1954) and Winkler (Reference Winkler1954), clays have been studied for various ceramic applications. These diagrams facilitate the application of proper approaches during shaping and drying operations and the obtaining of high-quality fired products (Dondi et al., Reference Dondi, Fabbri and Guarini1998). For instance, ternary diagrams can be used to separate samples based on chemical composition to determine the type of ceramics that can be produced and their colour after firing (Piltz, Reference Piltz1964; Strazzera et al., Reference Strazzera, Dondi and Marsigli1997). Furthermore, one can also use the mineralogical composition to determine the applications of clays. Moreover, the mineralogical composition of clays plays a crucial role in assessing their suitability for ceramic production (Strazzera et al., Reference Strazzera, Dondi and Marsigli1997).
Ternary diagrams offer a practical means of visualizing three variables that maintain a constant sum. These diagrams depict the relative proportions of parameters within an equilateral triangle, standardizing the data even when their total does not sum to 100%. Different combinations were tested in this study to include parameters not in percentages. However, attempts to correlate the properties of final products and FT did not yield useful results, making it challenging to classify clay materials effectively.
This study aimed to evaluate various ternary diagrams for analysing clays, highlighting their utility and providing additional data on specific deposits and underscoring the importance of employing rapid screening methods before industrial production.
Materials and methods
Preparation and selection of the samples
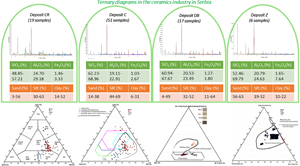
Within the Institute for Testing of Materials’ Ceramics Laboratory database, a total of 93 samples of Serbian raw clays were chosen for examination in this study, which originated from four localities: Crne Rovine (CR) – 19 samples; Crniljevo (C) – 51 samples; Damnjanovića Brdo (DB) – 17 samples; and Zaječar (Z) – 6 samples. The selection was based on their various qualities that were determined in the laboratory: the CR samples are refractory clays (Vasić et al., Reference Vasić, Radovanović, Pezo and Radojević2023), the C (Vasić et al., Reference Vasić, Pezo, Vasić, Mijatović, Mitrić and Radojević2022) and DB samples are suitable for whitish floor tile production, while the Z deposit is rich in clay minerals but with a very high content of Fe2O3 (see the ‘Results and discussion’ section).
Serbia exports raw clay and also uses clay in the production of good-quality ceramic tiles. There are two producers of ceramic tiles in Serbia: Zorka keramika in Šabac (in the western region of the country) and Keramika Kanjiža in Kanjiža (in the northern region of the country). Two of the studied deposits (C and DB) are ~70 km from Zorka keramika. Other localities are studied to determine the possibility of exporting their clays or using them as a part of the raw materials mixture in the country.
All samples underwent identical treatment and testing procedures. Upon arrival at the laboratory, they were dried at 100 ± 5°C until reaching a constant mass. Then, they were uniformly dry milled using a planetary mill until they passed through a 0.5 mm sieve. Subsequently, 4% tap water was added to achieve a semi-dry 400 kg cm–2 pressure, and specimens of 120 × 25 × 8 mm were formed. Tiles were fired in a laboratory electric furnace under oxidizing conditions at 1100°C, 1200°C, 1250°C and 1300°C for 1 h dwell time, following a predefined slow-firing regime (Vasić et al., Reference Vasić, Radovanović, Pezo and Radojević2023). Detailed processing parameters, results and discussions on the localities CR and C have been published previously (Vasić et al., Reference Vasić, Pezo, Vasić, Mijatović, Mitrić and Radojević2022, Reference Vasić and Radojević2023).
Testing and analysis
Laboratory tests
The chemical and mineralogical compositions of the clays were analysed with energy-dispersive X-ray fluorescence (XRF) spectrometry using a Spectro Xepos XRF spectrometer, and with X-ray diffraction (XRD) analysis using a Philips 1050 XRD device, respectively. The instrumental techniques, sample preparation, reference materials and component detection have been described in previous studies (Vasić et al., Reference Vasić, Pezo, Vasić, Mijatović, Mitrić and Radojević2022; Mijatović et al., Reference Mijatović, Vasić, Lj, Radomirović and Radojević2023).
Particle-size distribution was determined on crushed samples using a combination of wet and dry methods, including sieving and hydrometer techniques (c.f. Radomirović et al., Reference Radomirović, Mijatović, Vasić, Tanaskovski, Mandić, Pezo and Onjia2021). Dry sieving through a set of standard sieves was used to determine silt- and sand-sized fractions. The size distribution of the fine fractions (<0.063 mm) was determined using the hydrometer method with a sodium hexametaphosphate solution as the dispersant. The particle-size ranges for the indicated particle-size classes were clay (<0.002 mm), silt (0.002–0.06 mm) and sand (0.06–2 mm).
WA was measured under vacuum using a Isovacum A 2012 device (Gabtech, Italy) following the specifications for ceramic tiles (SRPS EN ISO 10545-3:2018, 2018; Vasić et al., Reference Vasić, Pezo, Vasić, Mijatović, Mitrić and Radojević2022). The three-point MR was obtained at room temperature using a Crometro CR4/E1 instrument (Gabrielli, Italy; Vasić et al., Reference Vasić, Pezo, Vasić, Mijatović, Mitrić and Radojević2022).
Statistical analysis
Principal component analysis (PCA) was applied to determine correlations between (Radomirović et al., Reference Radomirović, Mijatović, Vasić, Tanaskovski, Mandić, Pezo and Onjia2021) and influences of the parameters that describe the raw materials and the quality of the fired products. PCA is a transformation technique that converts a database into a set of linearly uncorrelated variables: the principal components. The maximum variance is found in the first component, and the highest variance is found in each subsequent component that is orthogonal (i.e. uncorrelated) to the preceding components. The principal components are orthogonal because they are the eigenvectors of the symmetric covariance matrix. Practically, this means that PCA is a useful tool for reducing the dimensionality of a dataset and identifying the most important variables (Hogben, Reference Hogben1968; Bastianoni et al., Reference Bastianoni, Pulselli, Focardi, Tiezzi and Gramatica2008). Eigenvalues are employed to ascertain the adequate number of factors to describe the observed set of parameters. In factor space, the vector orientation representing a variable indicates its directional trend, with the length of the vector proportional to the squared correlation values between the fitted value and the variable. The angles between the corresponding variables indicate the degree of their mutual relationships, with small angles representing high correlations. In addition, Pearson's correlation coefficients were determined between the observed variables, and p-values representing correlation significance were calculated.
Design of experiments (DOE) is a powerful tool mainly used to design experiments in which three variables may vary with time. It is commonly employed in the study of material mixtures to minimize the required experiments in various applications, such as ceramics (Maroto et al., 2023; Atidi et al., Reference Atidi, Kasedde, Menya and Olupot2024). Additionally, this technique is useful for predicting responses based on a selected set of three inputs (Moreira et al., Reference Moreira, Luz, Christoforo, Parr and Pandolfelli2016), in which sense it is applied in this study.
The statistical analysis during this investigation was performed using Statistica software (Data Analysis Software System, v.10.0, StatSoft, Inc., Tulsa, OK, USA).
Results and discussion
The chemical and mineralogical compositions and particle-size distributions of the raw materials from all tested deposits are shown in Fig. 1. On average, the samples predominantly consist of silt-sized particles, with comparable amounts of phyllosilicates, quartz and feldspars and low carbonate content. The raw materials did not meet previously set limits in the literature for ceramic tiles, containing up to 60% SiO2 (Moussi et al., Reference Moussi, Hajjaji, Hachani, Hatira, Labrincha, Yans and Jamoussi2020) in deposits C and DB, nor did the raw materials in deposit Z. However, these materials have proven beneficial for ceramic and refractory tile production (Vasić et al., Reference Vasić, Pezo, Vasić, Mijatović, Mitrić and Radojević2022, Reference Vasić and Radojević2023). Regarding the mineralogical composition, all samples contained over 15% clay minerals, with some exceeding the maximum acceptable limits of kaolinite and illite, set at 58% for ceramic porcelain tile batches (Alves et al., Reference Alves, Skorych, De Noni, Hotza, Gómez González and Heinrich2024). Consequently, certain samples fell below the minimum 40% threshold of quartz and feldspars that is considered prerequisite for porcelain tiles (Alves et al., Reference Alves, Skorych, De Noni, Hotza, Gómez González and Heinrich2024).

Figure 1. Average, maximum and minimum chemical, mineralogical and granulometry compositions of the clays. LOI = loss on ignition.
On average, the CR samples had the highest Al2O3 and clay minerals contents, with a notable organic matter content (Table 1), evident from the raw sample's dark colour and confirmed by differential scanning calorimetry/thermogravimetric analysis (Vasić et al., Reference Vasić, Radovanović, Pezo and Radojević2023). Predominant clay minerals in the CR samples are kaolinite and illite. The average Fe2O3 content was also among the highest across the samples. Conversely, the CR samples showed the lowest quartz + feldspars and SiO2 contents (Table 1).
Table 1. Variation of the main oxide contents and the particle-size distributions in the studied deposits.

The C deposit featured the highest average values of SiO2 and the maximum average quartz + feldspars content (Table 1). However, it had lower average levels of Al2O3 and clay minerals. The dominant clay minerals in deposit C were illite and kaolinite (Vasić et al., Reference Vasić, Pezo, Vasić, Mijatović, Mitrić and Radojević2022). The samples did not contain carbonates.
The DB samples exhibited the lowest average values of sand- and silt-sized fractions and Fe2O3 contents (Table 1). This deposit showed significant variability in particle-size distributions and the presence of hematite. The dominant clay minerals in the DB samples were illite and kaolinite. This deposit did not contain carbonates.
The Z samples had the lowest average silt and clay fractions, along with the highest Fe2O3 content (Table 1). Organic matter presence was minimal, as indicated by a low loss on ignition. Dominant clay minerals in the Z samples included illite, kaolinite and some montmorillonite.
Granulometry
Different size fractions play a crucial role in achieving optimal density in ceramic compositions in their dry state. Manipulating the particle-size distribution of the initial batch to achieve a multimodal distribution can effectively regulate the properties of the final product (Dondi et al., Reference Dondi, Fabbri and Guarini1998). Untreated soils or prepared samples are often classified based on particle-size distribution, as shown in Fig. 2 (Shepard, Reference Shepard1954; McManus, Reference McManus and Tucker1988). Texturally, sandy silty clays and sandy silts were predominant among the clays studied (Fig. 2a). However, silty clays and clayey silts are considered the most desirable raw materials (Dondi et al., Reference Dondi, Fabbri and Guarini1998). Z clays exhibited the most consistent particle sizes and the highest proportion of clay-sized fractions. These samples had mostly low porosity and permeability (moderately well sorted), thus being suitable for construction applications (Ndjigui et al., Reference Ndjigui, Mbey, Fadil-Djenabou, Laurent Onana, Constantin Bayiga, Enock Embom and Ekosse2021), using the criteria of McManus (Reference McManus and Tucker1988) (Fig. 2b).

Figure 2. The relationships between sand-, silt- and clay-sized components after (a) Shepard (Reference Shepard1954) and (b) McManus (Reference McManus and Tucker1988).
According to the diagram for natural clays (Winkler, Reference Winkler1954), most of the tested raw samples did not plot within the range suitable for rough ceramics production, such as bricks, blocks and roofing tiles (Fig. 3). However, while maintaining the proportion of the clay fraction, an increased proportion of the sand fraction would present suitability for clay brick and block production. A significant number of samples plot within the roof tile field, which requires higher clay mineral content compared to standard bricks and blocks. As discussed later in this work, most clays, except those from the Z deposit, were found to be suitable for ceramic and refractory tile production. Therefore, Winkler's diagram has been extended from its original form to include the potential area for ceramic and refractory tile production before additional milling processes.

Figure 3. Projection of the tested samples in the extended Winkler's diagram.
Chemical composition
Based on prior results in the Italian ceramic tile industry (Strazzera et al., Reference Strazzera, Dondi and Marsigli1997), the majority of the samples were expected to plot within the white firing field (Fig. 4). However, the samples exhibited varying shades, including cream, grey-brown, red and brown, with their colours intensifying with higher FTs (Vasić et al., Reference Vasić, Pezo, Vasić, Mijatović, Mitrić and Radojević2022, Reference Vasić and Radojević2023). The Z deposit samples showed a brick-red colour due to abundant hematite when fired up to 1100°C. At temperatures exceeding 950°C, low levels of CaO promoted hematite formation, yielding a more pronounced crimson hue. Additionally, larger iron oxide particles deepened the ceramics’ colour at 1100°C (De Bonis et al., Reference De Bonis, Cultrone, Grifa, Langella, Leone, Mercurio and Morra2017). Figure 4 illustrates the representative colours of the samples after firing at 1200°C. The CR and Z samples exhibited the darkest hues post-firing, attributed to higher concentrations of colouring oxides such as Fe2O3, TiO2 and CaO. Moreover, Fig. 4 presents a range of paler fired bodies, ending in greyish and brownish clays.

Figure 4. An update and combination of the graphs of Riley (Reference Riley1951) and Strazzera et al. (Reference Strazzera, Dondi and Marsigli1997). Images of the samples fired at 1200°C are shown.
Following Riley (Reference Riley1951), only a small number of fired pieces were expected to show bloating. Bloating was mildly observed in some of the Z deposit samples, with four simples plotting within the bloating category, resulting in overfiring even at temperatures as high as 1200°C. These samples exhibited an expansion of up to 0.70% at 1000°C. However, these findings contrast with a previous study on CR clays (Vasić et al., Reference Vasić, Radovanović, Pezo and Radojević2023), where bloating occurred in some samples even under a slow firing regime, attributed to their high organic matter content – a factor not present in Riley's study. This study updates the combined triaxial graphs by Strazzera et al. (Reference Strazzera, Dondi and Marsigli1997) and Riley (Reference Riley1951), illustrating the red-firing area when fired up to 1100°C.
Mineralogical composition
In comparing the bulk mineralogy results of the clays with previous studies (Strazzera et al., Reference Strazzera, Dondi and Marsigli1997), it can be determined that most of the samples are suitable for various types of structural ceramics production (Fig. 5). However, some CR samples – specifically two from the Z deposit and one from the C deposit – plot outside the previously defined area. Notably, CR17, CR7, CR6, CR1, CR3 and CR12 contain the highest clay mineral contents among the studied deposits (Vasić et al., Reference Vasić, Radovanović, Pezo and Radojević2023), making them suitable for refractory ceramics (Zanatta et al., Reference Zanatta, Boca Santa, Padoin, Soares and Gracher Riella2021). Therefore, an extended area for structural ceramics application has been proposed and added to the original graph (Strazzera et al., Reference Strazzera, Dondi and Marsigli1997). Among these samples, C24 had the highest proportion of quartz and feldspars (Vasić et al., Reference Vasić, Pezo, Vasić, Mijatović, Mitrić and Radojević2022), making it suitable for ceramic tile production but not of high quality due to the high WA (>5%) and MR of 21.49 MPa after firing at 1200°C. Samples from the Z deposit are identified as useful components for chimney pipes and brick products due to their relatively high Al2O3 content, which acts as a carrier of clay minerals (kaolinite and illite) in the finer fraction. Therefore, further adjustments to the graph may be necessary pending additional examination. In addition, other ternary diagrams available in the literature that analyse the mineralogical composition (quartz, phyllosilicates and feldspar) indicate that none of the samples in this database fit into the groups mentioned by Alves et al. (Reference Alves, Skorych, De Noni, Hotza, Gómez González and Heinrich2024), including those confirmed to be suitable for wall and floor ceramic tiles.

Figure 5. Update of the diagram of Strazzera et al. (Reference Strazzera, Dondi and Marsigli1997). Flds = feldspars; Qz = quartz.
Behaviour after firing
Figure 6a displays the ranges of key ceramic properties post-firing – MR and WA under vacuum – across the CR, C and DB deposits. With increasing FT, WA under vacuum decreases, while the MR increases. The quality of the CR, C, and DB samples varied between Annex L and G classifications (SRPS EN 14411:2017, 2017), indicating suitability for both wall and floor tile production (Fig. 6b). The higher WA observed in the CR samples was attributed to their significant organic matter content (Castellano et al., Reference Castellano, Sanz, Cañas and Sánchez2022). Despite their relatively high porosity and permeability, the DB deposit samples exhibited the lowest WA and highest MR after firing. Milling these clays with a planetary mill significantly improved the fired product quality. The Z deposit is unsuitable for ceramic tile production due to its relatively high Fe2O3 content. Further exploration could involve the use of testing methods such as magnetic separation of hematite or alternative applications for various fractions.

Figure 6. (a) WA and MR of the tiles, and (b) standard-defined values for thicknesses below 7.5 mm (SRPS EN 14411:2017, 2017).
Linking the raw clay characteristics and the quality of the tiles after firing
To explore how various parameters of raw materials influence the quality of fired tiles, several statistical and multi-exploratory techniques were employed. Analysis of particle-size distribution and FT revealed that the eigenvalues of the first two coordinates explained 76.84% of the system variation, indicating a satisfactory representation (Fig. 7a). FT emerged as the most significant factor affecting ceramic tile quality (Fig. 7b), as it exhibited a stronger negative correlation with WA and a weaker positive correlation with MR (Table 2). MR was also more sensitive to particle-size distribution than was WA. Notably, clay and sand particle sizes were the most influential, affecting particle packing and the compactness of the shaped product (Castellano et al., Reference Castellano, Sanz, Cañas and Sánchez2022). Increasing the proportion of sand-sized particles increased WA while decreasing MR, with the opposite effect observed for clay-sized particles. These findings from PCA align with the results of the Pearson's correlation analysis (Table 2).

Figure 7. PCA of particle-size distributions: (a) scree plot (eigenvalues of the correlation matrix) and (b) projection of the variables on the factor plane. Asterisks denote properties of fired ceramic samples.
Table 2. Pearson's correlations among the studied parameters.

*Statistical significance at a p < 0.05 level; **statistical significance at a p < 0.01 level.
The chemical composition of the clays was divided into three components (Fig. 4), which were used in the PCA. The eigenvalues of the first two coordinates explained 80.58% of the system. Again, all of these components were less influential on the MR and WA than FT (Fig. 8). The MR was more sensitive to the chemical composition than WA. The most influential of this group of parameters was the abundance of Al2O3. With increasing Al2O3 content, WA decreased and the MR increased (Zanelli et al., Reference Zanelli, Conte, Molinari, Soldati and Dondi2021). The results of the PCA are consistent with Pearson's correlation analysis (Table 2).

Figure 8. PCA of the chemical compositions: (a) scree plot (eigenvalues of the correlation matrix) and (b) projection of the variables on the factor plane. Asterisks denote properties of fired ceramic samples.
The mineralogical compositions of the clays were classified into three components based on the ternary diagram of Fig. 5. The eigenvalues of the first two coordinates explained ~82% of the system variation satisfactorily. Once again, these components exerted less influence on the MR and WA than FT (Fig. 9b). The MR was more sensitive to mineralogical composition than WA. Particularly influential on the MR were the proportions of phyllosilicates and quartz + feldspars, although the low presence of carbonates in the samples affected these results. Increasing clay mineral contents and reducing quartz + feldspar contents increased the MR. The WA correlates only with FT. However, the rate of sintering is significantly affected by the viscosity and surface tension of the liquid phase, underscoring the critical role of fluxes’ chemical composition and quantity in predicting final product quality (Dondi, Reference Dondi2018). Quartz contributes to the high-temperature stability of the ceramics, which is particularly crucial when combined with a mullite skeleton in porcelain and refractory tiles (Conte et al., Reference Conte, Buonamico, Magni, Arletti, Dondi, Guarini and Zanelli2022). Consistent correlations between carbonate content and clay minerals (strong and positive) and between carbonates and quartz + feldspars (negative) were also observed in previous studies (e.g. Gillot et al., Reference Gillot, Cojan, Haurine, Poirier and Bruneaux2021).

Figure 9. PCA of the mineralogical compositions: (a) scree plot (eigenvalues of the correlation matrix) and (b) projection of the variables on the factor plane. Asterisks denote properties of fired ceramic samples.
Pearson's correlation analysis illustrates the strength of relationships among the parameters studied (Table 2). These findings align with those observed in the PCA analysis but provide additional insights. FT emerges as the most influential factor in the dataset, particularly affecting WA, as is indicated by the correlation coefficient and its statistical significance (p-value). Following closely are the proportions of sand- and clay-sized particles, which impact the MR. Generally, the MR shows greater sensitivity to particle-size distribution, as well as to chemical and mineralogical composition, compared to WA.
Furthermore, DOE modelling was attempted, yielding the best-fitted surface among all combinations tested on the triaxial graphs and specifically focusing on particle-size distribution after firing at 1200°C (Fig. 10). To improve the accuracy of this graph, additional data on clayey raw materials for ceramic applications could be incorporated or more advanced modelling techniques could be employed. Nonetheless, these results provide a rapid method to predict product outcomes and quality based on particle-size distribution.

Figure 10. DOE modelling: a linear model to predict the MR based on the particle-size distribution.
The optimal fit was achieved using a linear model, demonstrating a coefficient of determination of 0.51. It seems that DOE modelling is better suited for mixture designs than analysing experimentally derived parameters (Zanatta et al., Reference Zanatta, Boca Santa, Padoin, Soares and Gracher Riella2021). While these predictions are reasonably reliable, more robust models are necessary that incorporate additional characteristics of the materials under study. Future plans include developing models using artificial neural networks and random forest regression for ongoing research.
Conclusions
This study investigates ceramic and refractory clays from four deposits in Serbia using various types of ternary diagrams to analyse granulometry, chemical composition and bulk mineralogical composition. The aim was to comprehensively explore existing ternary charts to provide detailed insights into the presented deposits and others from around the world. The results were compared with established areas in these diagrams, assessing clay suitability for ceramics production, fired product colouration and bloating. A rapid screening method was developed to assess new clay deposits for ceramic production potential, optimizing resource utilization.
Initial ternary diagrams based on clay chemical composition suggested potential for producing non-bloating, white-bodied ceramics from tested deposits, which was partially accurate. Fired products exhibited various colours, including brownish hues, and the organic matter in some samples caused bloating even under slow firing conditions. Statistical analysis highlighted FT and particle-size distribution as the most factors most significantly impacting MR after firing.
This study expands traditional ternary diagrams in the ceramics industry, advocating for environmentally friendly use of natural resources through dry-milling processes. It extends traditional ternary diagrams to propose a swift method for the preliminary assessment of raw material suitability, thereby saving time and resources. Future research will incorporate modelling techniques such as artificial neural networks and random forest regression to predict raw material influences on final ceramic tile quality and prioritize materials accordingly.
CRediT authorship contribution statement
Milica V. Vasić: Formal analysis, Conceptualization, Methodology, Visualization, Writing – original draft, Writing – review & editing, Mentoring. Pedro Muñoz Velasco: Writing – review & editing. Nevenka Mijatović: XRF analysis, Writing – original draft, Writing – review & editing. Milena Radomirović: Writing – original draft, Writing – review & editing. Zagorka Radojević: Resources, Formal analysis, Methodology, Project administration, Writing – original draft.
Financial support
This work is supported by the Ministry of Science, Technological Development and Innovation of the Republic of Serbia, Contract No. 451-03-66/2024-03/200012.
Conflicts of interest
The authors declare that they have no known competing financial interests or personal relationships that could have appeared to influence the work reported in this paper.


