


Phyllosilicates comprise several tetrahedral (T) and octahedral (O) sheets that stack on top of each other to make various types of phyllosilicate. One of the most common swelling phyllosilicates is smectite, which includes T–O–T sheets (2:1 clay) and many interlayer cations such as Na+, Ca2+, and Mg2+ (Forbes & Chryss, Reference Forbes, Chryss, Gräfe, Klaubter, McFarlane and Robinson2017). Clays are layered materials whose T and O sheet arrangement and interlayer charge determine their type and structure. Clays are mainly separated into three groups termed 1:1 (kaolinite), 2:1 (smectite) and 2:1:1 (chlorite; Uddin, Reference Uddin2008). Smectites are classified into several species based on their chemical composition and the types of exchangeable interlayer cations they contain, such as montmorillonite, beidellite, nontronite and saponite (Ross & Hendricks, Reference Ross and Hendricks1943). Montmorillonite is a well-known and highly promising material for scientists and industrial technologists (Pacuła et al., Reference Pacuła, Bielańska, Gaweł, Bahranowski and Serwicka2006) due to its beneficial and important properties (Golubeva et al., Reference Golubeva, Ul'yanova, Kostyreva, Drozdova and Mokeev2013).
Bentonite soils, containing montmorillonite as the dominant mineral, find applications in various industries, from casting and drilling muds to nanomaterials and medicine. They are also used in the food processing and cosmetics industries due to their chemical stability, decontamination and moisturizing properties (Gong et al., Reference Gong, Liao, Lv and Wang2016). Because of their low cost, layered structure and surface charges, they can be added to various polymers to improve the organoclay qualities. To prepare the organoclays, the clays should be exfoliated; however, bentonite, in addition to montmorillonite, contains several minerals that are considered impurities. Typical impurities found in bentonite include cristobalite (or opal-C), quartz, calcite, feldspar, mica and illite. The presence of these impurities alongside smectite diminishes the quality of bentonite for industrial applications (Boylu et al., Reference Boylu, Çinku, Esenli and Çelik2010). These impurities hinder the exfoliation process, thereby limiting the expected enhancement from bentonite incorporation, and may even degrade the properties of the organoclay. Furthermore, although the purification process can remove undesirable phases, it increases costs. It also reduces the overall yield of bentonite (Bahranowski et al., Reference Bahranowski, Gaweł, Klimek, Michalik-Zym, Napruszewska and Nattich-Rak2017). Thus, selecting the most appropriate raw material from the various bentonites with the fewest unwanted impurities, which must be removed to achieve the lowest cost and highest yield, is commercially favourable.
Bentonite mines mainly originate from the weathering of volcanic ash and some pre-existing minerals (Galán, Reference Galán2006) – for example, the weathering of silicates such as feldspar and mica (Zhou & Keeling, Reference Zhou and Keeling2013). Bentonite deposits are centres where smectites can be found, and they are located in many countries such as the USA, Germany, Greece, Spain, Turkey and Iran. Iran is amongst the eight leading countries in this field, with over 70 bentonite deposits and 420 000 tons of annual bentonite production (Modabberi et al., Reference Modabberi, Namayandeh, Setti and López-Galindo2019). In each region of Iran there are several deposits producing bentonites with various qualities suitable for a range applications (Modabberi et al., Reference Modabberi, Namayandeh, López-Galindo, Viseras, Setti and Ranjbaran2015).
Bentonites are divided into two main groups depending on the dominant interlayer cation: sodium and calcium bentonite. Impurities in bentonite limit its industrial applications, so purification is essential for developing bentonite applications and adding value to the raw material (Boylu et al., Reference Boylu, Çinku, Esenli and Çelik2010).
There are several methods for bentonite purification (Thuc et al., Reference Thuc, Grillet, Reinert, Ohashi, Thuc and Duclaux2010). A finer grain size is needed to achieve better results from purification processes (Gong et al., Reference Gong, Liao, Lv and Wang2016). However, some impurities, such as quartz, can be removed using granulometric methods (Thuc et al., Reference Thuc, Grillet, Reinert, Ohashi, Thuc and Duclaux2010). The decomposition of carbonates, dissolution of (hydr)oxides and oxidation of organic materials are also employed to purify clay minerals (Bergaya et al., Reference Bergaya, Lagaly and Lagaly2006a). Ultrasound treatment also stabilizes aqueous smectite dispersions (Lapides & Yariv, Reference Lapides and Yariv2004), and this can be followed by the separation of impurities using various methods (Thuc et al., Reference Thuc, Grillet, Reinert, Ohashi, Thuc and Duclaux2010). Another way to stabilize clay dispersions is by using dispersants such as sodium hexametaphosphate (NaHPM) to reduce edge-to-face interactions and to deflocculate the clay particles (Levy et al., Reference Levy, Srianberg, Alperovitch and van der Merwe1991).
Various methods such as hydrocyclones (Boylu et al., Reference Boylu, Çinku, Esenli and Çelik2010), centrifugation (Chipera & Bish, Reference Chipera and Bish2001) and sedimentation are used to separate clays from other materials in bentonite dispersions. Purification can increase the cation-exchange capacity (CEC) of bentonite (Özgen et al., Reference Özgen, Yildiz, Çalişkan and Sabah2009), making it more appropriate for further industrial use (Gong et al., Reference Gong, Liao, Lv and Wang2016).
The surface treatment of clay minerals and clay modifications have attracted significant interest, and organoclays have been used in critical applications in many industries (Sohrabi-Kashani et al., Reference Sohrabi-Kashani, Zolriasatein and Eftekhari Yekta2023). Replacing the inorganic interlayer cations of clays with organic cations can significantly improve clay properties. This results in organoclays that exhibit remarkable properties, especially in clay–polymer composites and for water purification. An organic cation's intercalation transforms hydrophilic clays into hydrophobic materials, increases the basal spacing of clay layers and can produce exfoliating clay layers (He et al., Reference He, Ma, Zhu, Frost, Theng and Bergaya2014). The most commonly used organic cations for preparing organoclays are cationic surfactants (Rafiei & Ghomi, Reference Rafiei and Ghomi2013), such as specific amines and quaternary ammonium salts (Motawie et al., Reference Motawie, Madany, El-Dakrory, Osman, Ismail and Badr2014), which can be adsorbed on clay surfaces. Their long carbon chain lead to an increased interlayer space and improves specific properties (Kooli et al., Reference Kooli, Liu, Alshahateet, Messali and Bergaya2009).
Combining acid activation and organic molecule intercalation significantly improves clay mineral properties (Bergaya et al., Reference Bergaya, Theng and Lagaly2006b; Lagaly et al., Reference Lagaly, Ogawa and Dékány2006; Kooli et al., Reference Kooli, Liu, Alshahateet, Messali and Bergaya2009).
Organoclays are now used in a wide range of applications, such as polymer nanocomposites (in the automotive, packaging and aerospace industries, amongst others; Guo et al., Reference Guo, Aryana, Han and Jiao2018), rheological modifiers in paints, inks, greases and cosmetics (Patel et al., Reference Patel, Somani, Bajaj and Jasra2006), adsorbents for wastewater pollutants (Amin et al., Reference Amin, Heijman and Rietveld2014), heavy metal ion removal (Yadav et al., Reference Yadav, Gadi and Kalra2019), as catalysts (Adams & McCabe, Reference Adams and McCabe2006) and as drug delivery carriers (Mattausch, Reference Mattausch and Laske2015). One of the most significant uses of organoclays is in polymer nanocomposites. Adding a low percentage of organoclays to polymers can improve their properties (Chan et al., Reference Chan, Lau, Wong, Ho and Hui2011), such as strength and thermal resistance, and reduce gas permeability and flammability. However, these improvements greatly depend on the structure and properties of the organoclay and the polymer used in the composites (Xi et al., Reference Xi, Frost and He2007).
Low-density polyethylene (LDPE) is a low-cost, tough and flexible polymer that is widely used in many applications (Jordan et al., Reference Jordan, Casem, Bradley, Dwivedi, Brown and Jordan2016). LDPE–clay composites can be superior to untreated LDPE or conventional composites. These composites can exhibit improved thermal and mechanical properties (Olewnik et al., Reference Olewnik, Garman and Czerwiński2010; Awad, Reference Awad2021).
In this work, several bentonites from Iranian deposits were collected and analysed. After selecting the most suitable source of bentonite, the commercial purification process was applied. Subsequently, specific surfactants were used to obtain organoclays. X-ray diffraction (XRD), scanning electron microscopy (SEM) and X-ray fluorescence (XRF) were carried out to analyse the synthesized organoclays. Finally, the modified organoclay was used to prepare LDPE–organoclay composites, and polymer properties were evaluated using thermogravimetric analysis (TGA) and tensile strength tests.
Experimental
Materials
In this study, eight different bentonites were collected from Iranian bentonite mines situated in various geographical locations (Table 1). NaHMP from Sina Chemistry Company was used as a dispersant. Deionized water and cetyltrimethylammonium bromide (CTAB; CAS 57-09-0), octadecylamine (CAS 124-30-1) and hydrochloric acid (HCl, 35%) were purchased from Merck Company, and LDPE was purchased from Sinashimi Hekmataneh Company. Additionally, Cloisite® 15a (CL15) is an organoclay provided by Southern Clay Products and was used as a reference sample in this research.
Table 1. Naming codes of raw bentonites and their geographical locations, purified samples with their purification method and duration, organoclay samples with their surfactants and composite samples with their amounts of additives.

Methods
Purification
Ahmadi et al. (Reference Ahmadi, Ghanbari, Moghaddam and Naghizadeh2022) found that the dispersion method is a more efficient way to purify raw bentonite, and the procedure in the current study was carried out according to the dispersion method (Ahmadi et al., Reference Ahmadi, Ghanbari, Moghaddam and Naghizadeh2022). Two raw bentonites were chosen: Sample IB, selected for its high purity and lower cristobalite value compared to the other samples, and sample NBZ, selected to demonstrate the efficiency of the purification process of separating a variety of impurities from bentonite. A total of 5 g of raw crushed bentonite powder and 0.25 g of NaHMP were dispersed in 200 mL of deionized water, and the mixture was stirred using an MR Hei-standard stirrer from Heidolph Company for 3 h. Two methods were used to separate the supernatant from the sediment. In the first method, the dispersion was allowed to stand for 7 min, and the supernatant was centrifuged twice using the centrifuge from Aryanpaya Company. In the second method, the dispersion was allowed to stand for 12, 24, 36 or 48 h, after which the supernatant was separated. The final dispersions were dried at 100°C for 24 h in a Memmert dryer. The purification procedure is shown in Fig. 1a. The purified powder of NBZ was named NBZP and the purified powder of IB was named IBP (after the centrifugation method) or IBSEDI (after the sedimentation method). The purified sample codes are shown in Table 1.

Figure 1. The procedure of (a) bentonite purification and (b) organoclay preparation.
Organoclay preparation
Method 1
At total of 2.5 g of as-purified bentonite and 0.87 g of CTAB were sequentially added to 125 mL of deionized water to prepare the dispersion. The dispersion was milled using a planetary mill with zirconia balls for ~2 h at 300 rpm and then dried at 100°C for 24 h (Ahmadi et al., Reference Ahmadi, Ghanbari, Moghaddam and Naghizadeh2022). The final powder obtained from Method 1 was named IBS.
Method 2
A total of 4 g of optimized purified bentonite (IBSEDI) was added to 100 mL of deionized water and stirred for 1 h at 60°C. Separately, another dispersion was prepared by mixing various amounts of octadecylamine (0.5 CEC, 1.0 CEC, 2.0 CEC and 3.0 CEC of optimized purified bentonite) with 0.92 mL of HCl (35%) and 20 mL of deionized water. Two dispersions were stirred for 24 h at 60°C. The final dispersion was dried at 100°C for 24 h. The procedure of the second method is shown in Fig. 1b. The final powder obtained from Method 2 was named IBO. Organoclay sample codes are shown in Table 1.
Composite preparation
Composite samples weighing 45 g, consisting of LDPE and an organoclay additive at concentrations of 0, 1, 2, 3, 4 and 5 wt.%, were prepared using a W50-EHT internal mixer operating at 180°C for 10 min at 75rpm. Subsequently, the samples were hot-pressed at 200°C for 8 min to produce rectangular sheets (for SEM and TGA) and dog-bone-shaped samples (for the tensile strength test). Tensile strength tests were conducted three times, and average values were used for the analysis. Composite sample codes are shown in Table 1.
Characterization techniques
The chemical compositions of the samples were analysed by an XRF instrument (PW1480, Philips, The Netherlands). The particle-size distribution was determined using a particle-size analyser, and specific surface area was evaluated using a Mastersizer 2000 instrument (Malvern, UK). Phase analysis of the milled and sieved powders (200 mesh) was performed using XRD (Advanced D8, Bruker, USA). The instrument was equipped with a Cu target (λ = 0.154 nm) and operated in the 0.8–8.0°2θ range (low angle) and 5–80°2θ range (normal mode), with a scan rate of 0.04°2θ s–1. Morphological analysis was conducted using SEM (Vega Tescan LMU, Tescan Analytics, France), energy-dispersive spectroscopy (EDS; XFlash 6-10, Bruker) and field emission SEM (FESEM; MIRA3 LMU, Tescan Analytics) for selected samples. The surfaces of the samples were coated with a thin layer of gold via a vacuum evaporation method. Composite samples were cooled in liquid nitrogen and broken, and then the microstructures of their cross-sections were examined using FESEM (MIRA3 TESCAN-XMU).
TGA was conducted under a nitrogen atmosphere at a temperature range of 25–600°C and a heating rate of 10°C min–1 using a TG 209F3 NETZSCH machine. Tensile strength tests were conducted using a Santam STM-50 tensile strength machine at room temperature. The crosshead speed was 50 mm min–1, and samples were dog-bone-shaped with 16.8 cm length and 3 cm width.
The CECs of raw and purified bentonite (IB and IBSEDI samples) were measured based on the following procedure (Ahmadi et al., Reference Ahmadi, Ghanbari, Moghaddam and Naghizadeh2022): 5 g of raw and purified bentonite powder was added to 33 mL of sodium acetate of 1 N separately, and the dispersion was shaken for ~5 min. Then, the mixture was centrifuged at 2500 rpm for 5 min (three times) using an sr1 centrifuge from Arminad Company (Iran) to separate the sedimented particles. Subsequently, 33 mL of ethanol was added to settle the particles, and this was shaken for 5 min and centrifuged at 2500 rpm for 5 min (three times). The electrical resistivity of alcohol was measured using a conductometer (HI98312, HANNA Instruments, Romania). If the value was <40 μmho cm–1, the washing was considered complete, and in the case of a higher value being obtained, the washing was continued. All of the sodium acetate and soluble salts were removed as alcoholates. After the washing stage, 33 mL of ammonium acetate was added to the washed clay. The dispersion was shaken and centrifuged at 2500 rpm, each for 5 min, and the supernatant was separated and poured into a balloon of 100 cm3 (repeated twice). Finally, 1 N ammonium acetate was added to the filled balloon to exchange ammonium ions with all adsorbed Na+ ions. The amount of released sodium was determined using a flame photometer (PFP-7, Jenway Company, UK). The CEC was calculated according to Equation 1, where V, A, C and W are the final volume (mL), sodium condensation (mg L–1), coefficient of dilution and mass of the sample powder (g), respectively.

Results and discussion
Cation-exchange capacity
Calculating the CEC is crucial for determining the amount of surface modifier and ensuring the quality of the organoclay preparation in subsequent steps. The CEC values for IB and IBSEDI are 6.944 and 12.128 eq g–1, respectively. The increase in CEC value after purification indicates successful purification. This increase suggests an elevated proportion of montmorillonite in the sample, resulting in a greater CEC (Pereira et al., Reference Pereira, Silva, Duarte Neto, Neves, Ferreira and Menezes2018). The CEC value serves as a guide for determining the appropriate amount of surfactant required for synthesizing the organoclay. Based on the behaviour, type and CEC of the clay, a specific amount of surfactant is required to ensure that the organoclay reaches its saturation value and the interlayer cation sites of the clay are adequately filled with the surfactant. Surfactants can penetrate between particles and may compromise certain properties, such as the thermal properties, if used excessively (He et al., Reference He, Ma, Zhu, Frost, Theng and Bergaya2014). As the CEC value increases, more surfactant enters between the layers and the distance between the layers increases (Rihayat et al., Reference Rihayat, Salim, Arlina, Fona, Jalal and Alam2018).
Phase characterization
Raw bentonite
The phases present in raw bentonites are depicted in Fig. 2. As anticipated, many phases exist in raw bentonites besides the montmorillonite phase (Boylu et al., Reference Boylu, Çinku, Esenli and Çelik2010; Modabberi et al., Reference Modabberi, Namayandeh, Setti and López-Galindo2019). Various impurities in mineral bentonites can cause problems during organoclay preparation and application (Modabberi et al., Reference Modabberi, Namayandeh, López-Galindo, Viseras, Setti and Ranjbaran2015; Gong et al., Reference Gong, Liao, Lv and Wang2016).

Figure 2. XRD traces of the raw bentonites.
The various clay phase peaks in the IB sample show that two different smectites –montmorillonite (reference code: 000120204) and beidellite (reference code: 000470197) – exist in the sample. Other impurities are also shown in Fig. 2. For further study, samples IB and NBZ were selected. IB was chosen due to its high purity and lower cristobalite value compared to the other samples, and NBZ was selected to prove the efficiency of the purification process for separating a variety of impurities from bentonite.
Purified bentonite
Th existing phases in NBZ bentonite, before and after the purification process, are shown in Fig. 3a. A comparison between NBZ and NBZP reveals that quartz, calcium carbonate and feldspar are predominantly separated from the bentonite, whilst the cristobalite content is reduced relative to the purified sample. Due to its dispersing properties, NaHMP prevents sedimentation by loading the clay plates and making the purification process progress more rapidly (Gong et al., Reference Gong, Liao, Lv and Wang2016).

Figure 3. XRD traces of (a) raw (NBZ) and purified (NBZP) and (b) raw (IB) and purified (IBP, IBSEDI) bentonites, and (c) XRD traces for various durations of impurity settling in IBSEDI samples.
Figure 3b shows a comparison between two different methods used. IBP represents the centrifuged sample, whereas IBSEDI represents the sedimented sample prepared after 24 h of sedimentation. As shown in Fig. 3b, the existing phases in these two samples are largely similar. Due to the simplicity of the sedimentation method, it was selected for further discussion and analysis. The intensity of the peak at 28° increased in IBP and IBSEDI compared to IB due to the relative increase in clay phase content compared to the impurity characteristic peaks. This peak corresponds to the characteristic peak of the clay (004) planes, and it is expected to disappear after clay exfoliation in organoclay samples.
The peak at 7.13° in IB is shifted to higher angles in IBSEDI. This peak shift is attributed to the substitution of Ca2+ and Mg2+ by Na+ and the smaller size of Na+ cations compared to Ca2+ and Mg2+ cations, which could decreased the distance between the layers (Oueslati et al., Reference Oueslati, Karmous, Ben Rhaiem, Lanson and Ben Haj Amara2007).
To determine the optimal duration for impurity sedimentation, the bentonite dispersions that was stable for 48, 36, 24 and 12 h were studied. XRD traces (Fig. 3c) indicated that 24 h of sedimentation is the optimal duration for separating impurities because, in IBSEDI12, the relative values of the impurity peaks are greater, whereas no significant change was observed after increasing this duration to 48 hours when comparing the IBSEDI24, IBSEDI36 and IBSEDI48 samples. Consequently, IBSEDI24 was selected as IBSEDI (the optimized purified bentonite) for further investigation.
Organoclays
Two methods were evaluated based on the XRD traces to determine the optimal method for preparing the organoclay. In Fig. 4a,b (normal- and low-angle XRD traces, respectively), IBS and IBO represent the organoclays prepared by ball-milling of the CTAB–clay dispersion (Method 1, described earlier) and stirring of the octadecylamine–clay dispersion (Method 2, described earlier), respectively. Additionally, CL15 is an organoclay provided by Southern Clay Products that served as a reference sample in this research. A comparison of low-angle XRD traces indicates that IBO has a broader interlayer space. The exfoliation processes was improved by facilitating the entrance of octadecylamine molecules into the interlayer space of montmorillonite sheets, enabling more effective interaction with the internal surfaces of the sheets. Thus, a relative increase in the size of the clay sheet interlayer compared to that of the CTAB-modified sample was caused by the relatively greater in situ leaching across clay edges and surfaces of the mild acid accompanying the octadecylamine. Therefore, due to the better exfoliation of IBO, it was selected for further study.

Figure 4. (a) XRD traces of IBS, IBO and CL15. (b) Low-angle XRD traces of IBS, IBO and CL15. (c) Interlayer space and d 001 of the montmorillonite layers of the raw bentonite.
Various samples were prepared using surfactant concentrations of 0.5 CEC, 1.0 CEC, 2.0 CEC and 3.0 CEC to optimize the amount of surfactant in the organoclay, and these were named IBO0.5, IBO1, IBO2 and IBO3, respectively. In Fig. 5a,b, the XRD traces of these samples are shown. The difference in peak intensity in the samples is due to the different particle sizes and degrees of exfoliation in the samples (Zhu et al., Reference Zhu, Zhou, Kabwe, Wu, Li and Zhang2019). The IBO2 sample is saturated with surfactant, and a further amount of surfactant would decrease exfoliation quality, as observed in the IBO3 sample.
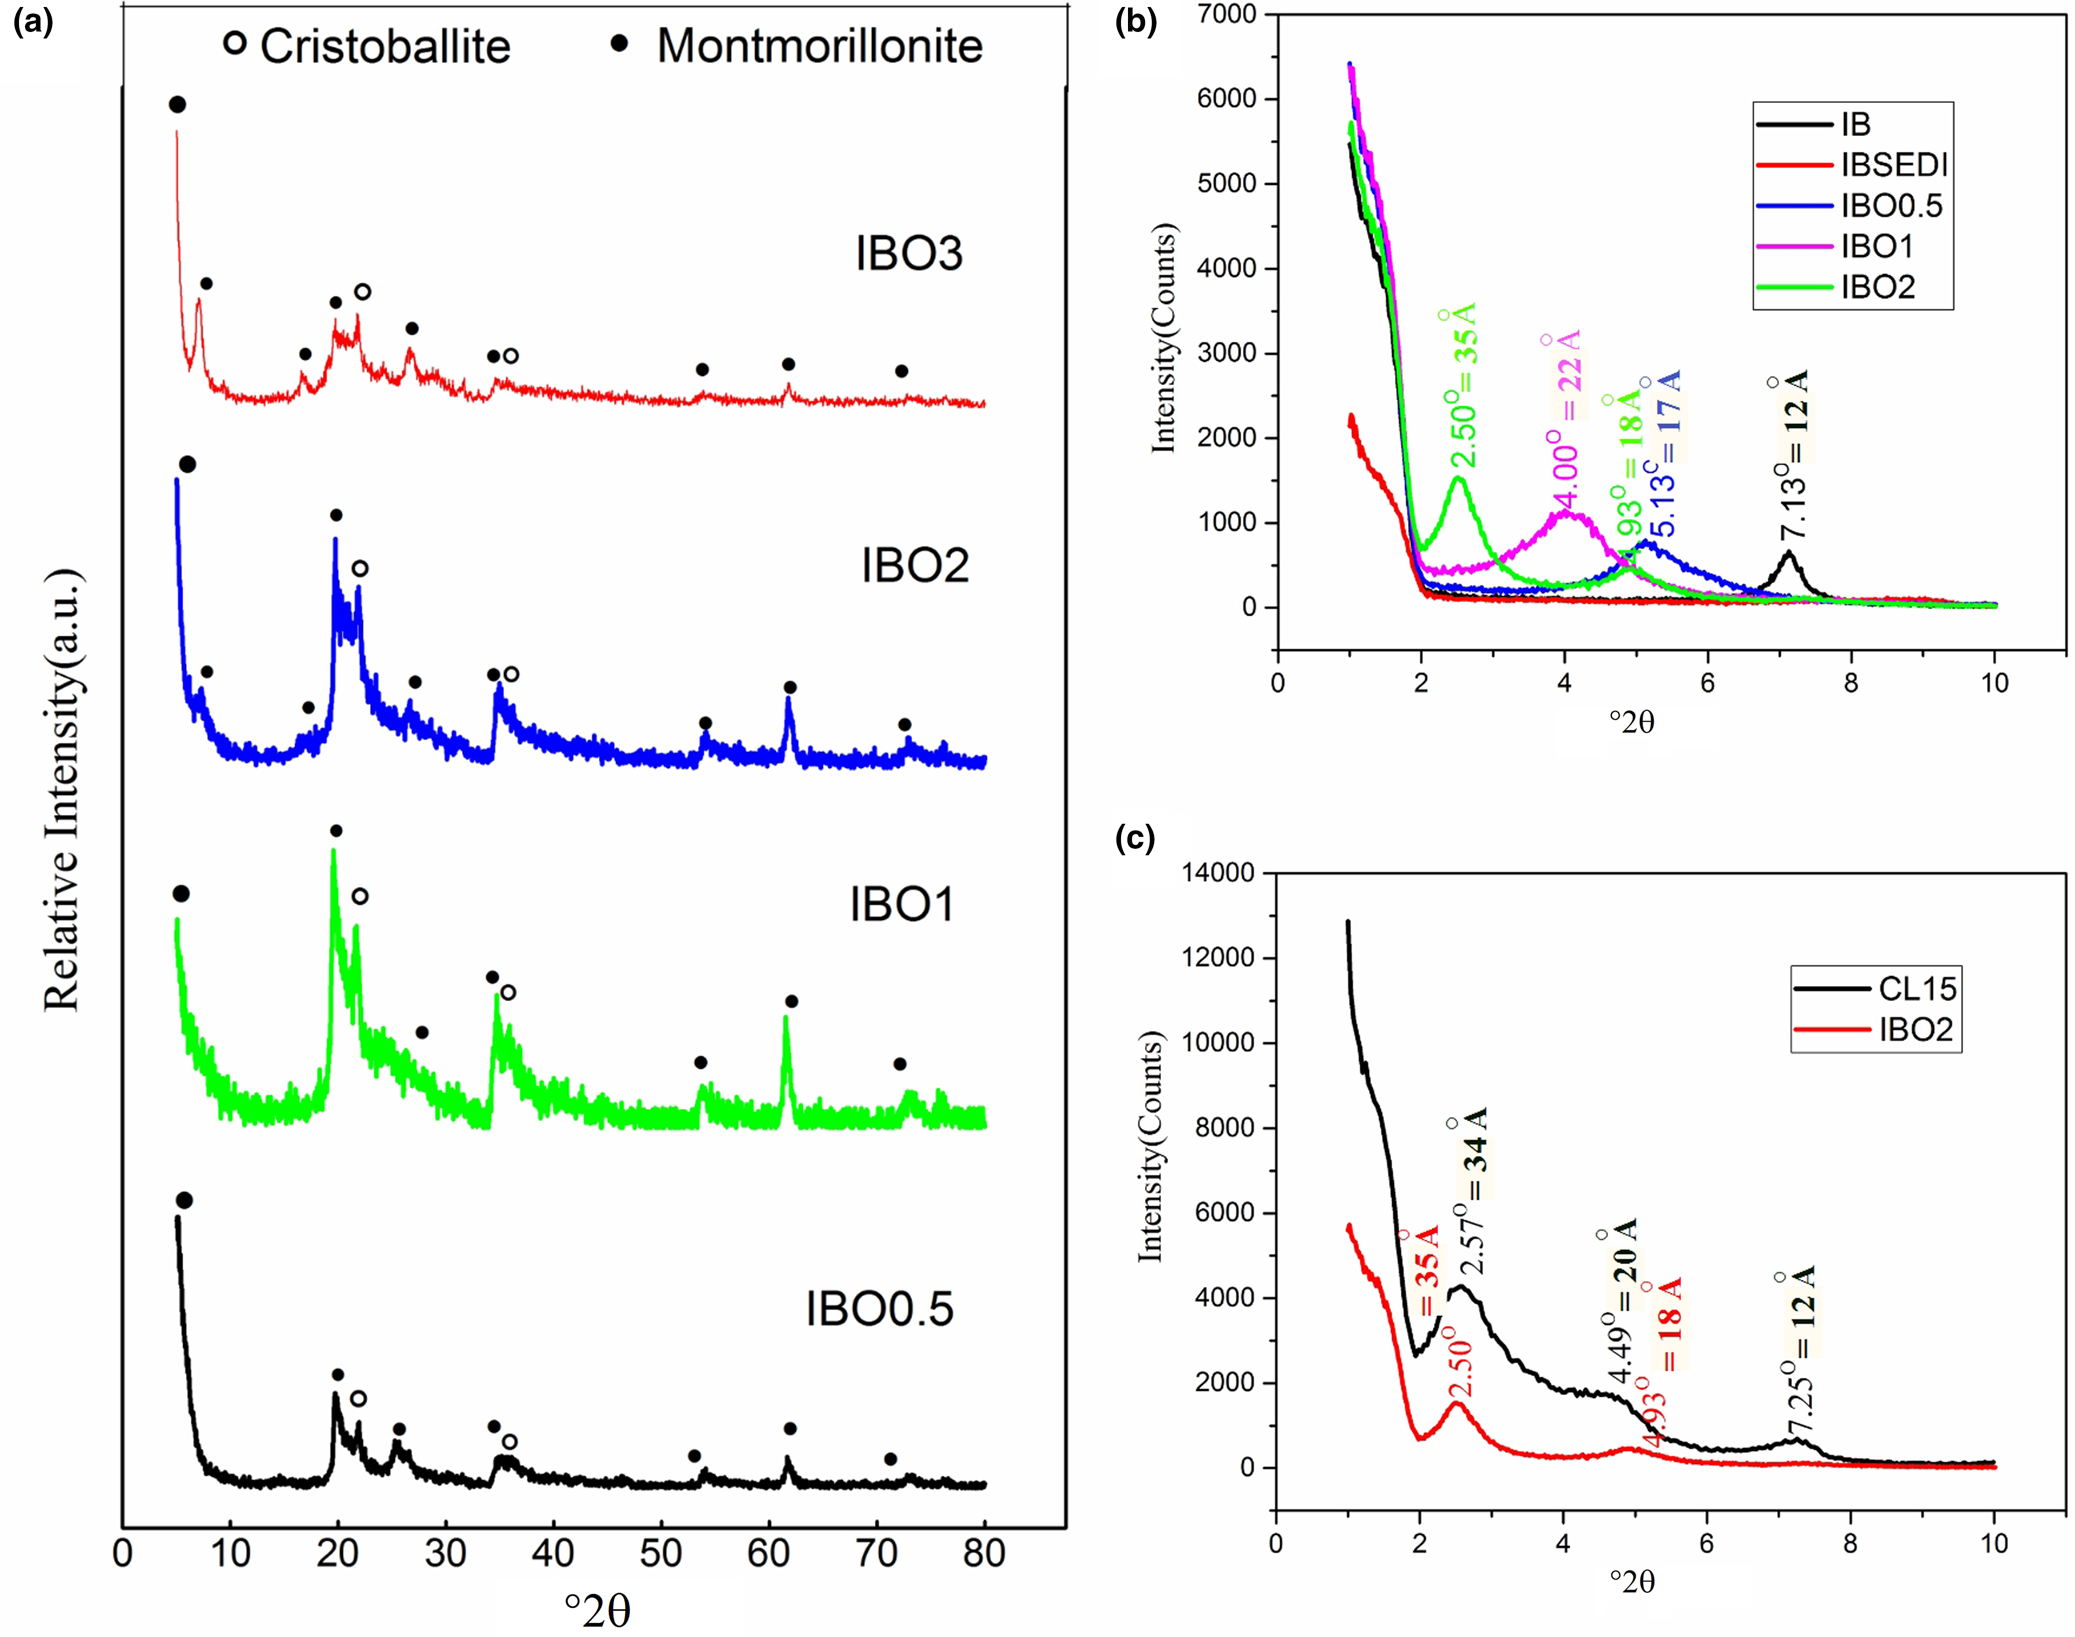
Figure 5. (a) XRD traces of IBO0.5, IBO1, IBO2 and IBO3. (b) Low-angle XRD traces of IB, IBSEDI, IBO0.5, IBO1, IBO2 and CL15. (c) Low-angle XRD traces of CL15 and IBO2.
The peak at 7.13° in IB, which shifted to higher angles in IBSEDI, exhibited an inverse shift to 5.13°, 4.00° and (2.50° and 4.93°) in IBO0.5, IBO1 and IBO2, respectively. In fact, in sample IBO2, none of the sheets showed similar levels of exfoliation, and most of the peaks shifted and can be detected at ~2.50° and 4.93°. Using the Bragg equation (2d 001sinθ = λ, where d 001 is the interplanar distance of the (001) reflection plane, θ is the diffraction angle and λ is the wavelength), d 001 of IB is 12 Å and d 001 of IBO0.5, IBO1 and IBO2 are 17 Å, 22 Å and (35 Å and 18 Å), respectively (Choi et al., Reference Choi, Xu and Chung2005; Epp, Reference Epp, Hübschen, Altpeter, Tschuncky and Herrmann2016).
Based on the analysis of XRD traces, it can be concluded that IBO2 is the optimized sample due to its high efficiency of exfoliation and the shifting of its peaks to lower angles. Figure 5c compares the low-angle XRD traces of IBO2 and CL15. The similarity between these two samples confirms the successful preparation of the organoclay.
Morphological analysis
To study the morphology of the samples, SEM was employed. Figure 6a,b shows SEM images of NBZ and NBZP, and Fig. 6c,d represents their EDS analysis. EDS analysis reveals that, during the purification process, the Al/Si ratio increases from 0.03 in NBZ to 0.15 in NBZP, which indicates an increase in the relative amount of clay in the samples compared to the raw materials containing impurities such as quartz. This increase confirms the relative success of the purification process (Zhang et al., Reference Zhang, Miao, Bai, Yuan, Jia and Han2014).

Figure 6. SEM images of (a) NBZ and (b) NBZP, and EDS analysis of (c) NBZ and (d) NBZP. The reduction in Si/Al aspect ratio is the result of silica impurity removal during the purification step.
SEM images of IB and IBP are shown in Fig. 7a,b. A relative increase in plate-like morphology is evident after the purification process. The observed relative increase in plate-like morphology after the purification process suggests that the purification has effectively removed impurities and non-clay minerals from the sample, leaving behind a greater proportion of clay minerals with a plate-like structure. This change is significant because clay minerals, such as montmorillonite, typically exhibit a plate-like morphology, which is desirable for various applications due to its unique properties, such as a high surface area and CEC.
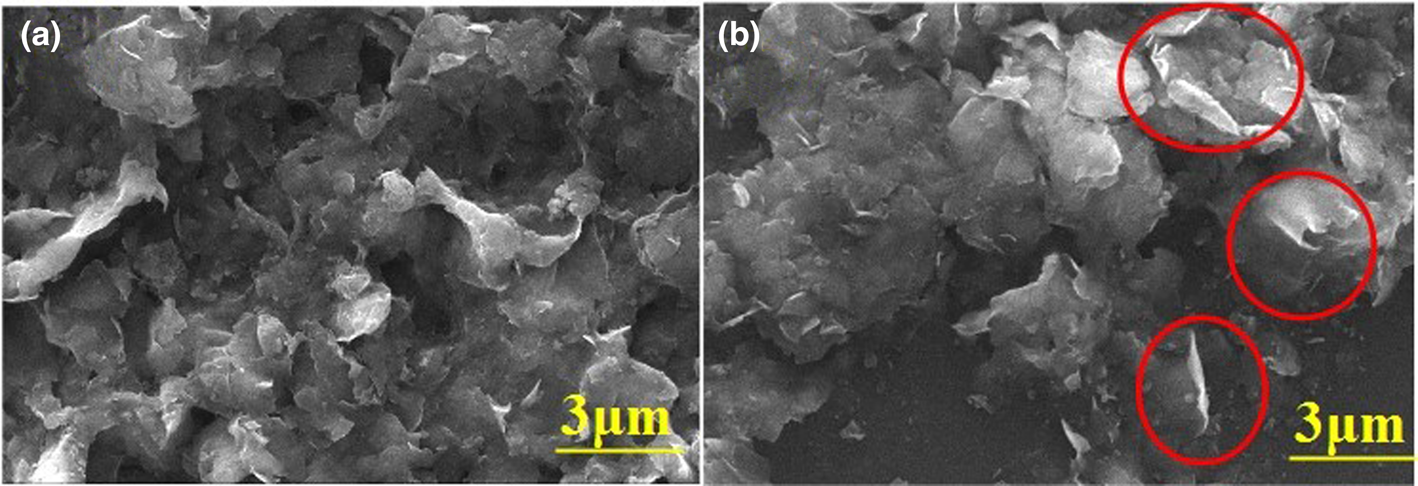
Figure 7. SEM images of (a) IB and (c) IBP. The red circles indicate the plate-like morphology in the structure.
SEM images of IBO0.5, IBO1 and IBO2 are shown in Fig. 8a–f. The morphological changes indicate successful organoclay preparation in the organoclay samples. To confirm this, SEM images of CL15 are shown in Fig. 8g,h. The structural similarity between the IBO samples and CL15 and the presence of plate-like clay structures in the samples indicate the high quality of the prepared organoclays.

Figure 8. SEM images of (a,b) IBO0.5, (c,d) IBO1, (e,f) IBO2 and (g,h) CL15.
FESEM images of PE and the P1–P5 composites are shown in Fig. 9a–f. Complete dispersion of exfoliated clay platelets in the polymer matrix occurred. To achieve improved properties in the composites, dispersion of additives within the matrix is necessary (Eckel et al., Reference Eckel, Balogh, Fasulo and Rodgers2004; Jang et al., Reference Jang, Wang and Wilkie2005; Hadi et al., Reference Hadi, Abdulkadir, Hadi, Bin Yusoh and Hasany2018). From P5 to P1, the organoclay content was reduced, so the SEM images show fewer clay platelets. Figure 9g,h shows FESEM images of P5.

Figure 9. FESEM images of (a) PE, (b) P5, (c) P4, (d) P3, (e) P2, (f) P1 and (g,h) P5.
Chemical analysis
Table 2 presents the chemical analysis of four samples: IB, IBSEDI, IBO1 and IBO2. Comparison between IB and IBSEDI reveals that the addition of sodium hexametaphosphate to the bentonite dispersion for purification results in the replacement of interlayer cations such as calcium by sodium cations, which dissolve from the sodium hexametaphosphate in water. Furthermore, by performing the purification process, the ratio of SiO2/Al2O3 decreased, indicating the relative increase in clay content in the bentonite (Thuc et al., Reference Thuc, Grillet, Reinert, Ohashi, Thuc and Duclaux2010). Replacing the interlayer sodium with octadecylamine organic molecules and removing sodium cations through washing dramatically reduced the sodium content in the samples (Xi et al., Reference Xi, Frost and He2007; He et al., Reference He, Ma, Zhu, Frost, Theng and Bergaya2014).
Table 2. Chemical compositions of IB, IBSEDI, IBO1 and IBO2.

Thermal analysis of the composites
Incorporating clay into a polymer matrix can improve its thermal stability. Clay layers act as thermal insulators by impeding the transfer of heat through the composite material. The arrangement of clay platelets within the polymer matrix creates a barrier that reduces the movement of heat energy, thereby increasing the material's resistance to thermal conductivity. In addition, clays help with char formation, meaning that polymer decomposition can occur at higher temperatures (Mattausch, Reference Mattausch and Laske2015). The thermal resistance of the composite can be influenced by the thermal stability of the surfactant used in the modified organoclay. Xiong et al. (Reference Xiong, Liu, Yang and Wang2004) tested two different modified montmorillonites and found that montmorillonite modified with an aromatic modifier had greater thermal resistance compared to montmorillonite modified with a quaternary alkyl ammonium salt (Xiong et al., Reference Xiong, Liu, Yang and Wang2004; Pavlidou & Papaspyrides, Reference Pavlidou and Papaspyrides2008).
Figure 10a shows the TGA of PE (pure LDPE) and P5 (the sample containing 5 wt.% of organoclay) in a nitrogen atmosphere from 25°C to 600°C at a heating rate of 10°C min–1. The detailed temperature results shown in Fig. 10a are given in Table 3. Ti represents the temperature at which 10% of the sample is decomposed, whereas T 50% represents the midpoint of degradation. Another important parameter in TGA is the fraction of non-volatile materials at 600°C in the samples, known as char (Olewnik et al., Reference Olewnik, Garman and Czerwiński2010). Compared to PE, the Ti and T 50% values in P5 (sample with 5 wt.% of organoclay) were 17°C and 13°C greater, respectively. The residue of P5 at 600°C is 43%, indicating the greater thermal stability of the composite and successful char formation.

Figure 10. (a) TGA for polyethylene and the P5 composite. (b) Tensile strength test results for PE and the composite samples tested to their breakpoints. (c) Tensile strength test results for PE and the composite samples tested to their deformation points.
Table 3. TGA results for the PE and P5 samples.

Mechanical analysis of the composites
Degree of dispersion is one of the most critical factors affecting the mechanical properties of composites. If a clay and matrix polymer is properly bonded, the clay can bear greater applied loads due to its greater Young's modulus and stiffness than those of the polymer matrix. Organo-modified clays usually have greater tensile strength and Young's modulus values than the polymer matrix (Chan et al., Reference Chan, Lau, Wong, Ho and Hui2011; Mattausch, Reference Mattausch and Laske2015).
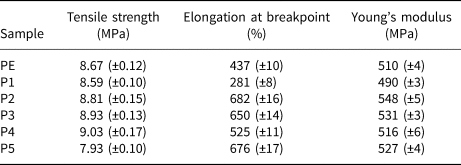
Figure 10b,c show the tensile strength test results, indicating that the tensile strength improves up to the saturation point when adding organoclay to LDPE. The addition of organoclay to LDPE results in an improvement in tensile strength until reaching saturation. The tests were repeated three times for each sample, and the average values for tensile strength, elongation at the breakpoint, Young's modulus and their corresponding errors are provided in Table 4. The tensile strength of PE increased from 8.67 to 9.03 MPa in sample P4, and with the addition of more organoclay sample P5 failed, with its tensile strength decreasing to 7.93 MPa. It can be concluded that there is a saturation point for these mechanical properties beyond which further additives can destroy polymer properties due to increased stress concentration points (Jordan et al., Reference Jordan, Casem, Bradley, Dwivedi, Brown and Jordan2016; Awad, Reference Awad2021; Sohrabi-Kashani et al., Reference Sohrabi-Kashani, Yekta, Rezaie and Zolriasatein2022). Additionally, by adding organoclay to the LDPE matrix, the Young's modulus of the sample increased from 510 MPa in PE to 548 MPa in P2, and the elongation at the breakpoint rose from 437% in PE to 682% in P2.
Table 4. Tensile strength test results of PE and the composite samples.
Conclusion
In this study, Iranian bentonite was purified and modified to prepare polymer–organoclay composites. During the purification process, impurities such as quartz, calcium carbonate and feldspar were removed (<4 wt.%) and the cristobalite content was reduced using the sedimentation method. The organoclay was prepared using the purified bentonite and an octadecylamine surfactant, and the test results indicated that by using the optimal ratio of surfactant to bentonite the interlayer space widened from 12 Å in raw bentonite to 35 Å in samples containing 2.0 CEC of octadecylamine. The polymer–organoclay composites were prepared using the hot-mixing method, and the results showed that the additive was fully dispersed in the matrix, and both the thermal and mechanical properties of the composites were improved compared to those of the pure LDPE. In the sample containing 5 wt.% of organoclay, Ti and T 50% values were 17°C and 13°C higher than those of polyethylene, respectively. The tensile strength of LDPE increased from 8.67 to 9.03 MPa in the sample with 4 wt.% of organoclay. Therefore, the various polymer-based and especially LDPE-based composites can be modified and improved to a greater extent by using less purified and optimized Iranian bentonites compared to raw bentonite.
Conflicts of interest
The authors declare none.


