A functional pituitary adenoma secreting adrenocorticotropic hormone (ACTH) results in a condition known as Cushing’s disease (CD), which falls under the larger spectrum of disorders caused by excessive cortisol, collectively known as Cushing’s syndrome (CS).Reference Cuevas-Ramos and Fleseriu 1 , Reference Guaraldi and Salvatori 2 CD is the most common cause of spontaneous CS, accounting for 60% to 70% of spontaneous cases.Reference Abdel Mannan, Selman and Arafah 3 Long-term manifestations of hypercortisolemia include in varying frequencies: obesity, diabetes mellitus, cardiovascular disease, osteoporosis, and nephrolithiasis, among others.Reference Cuevas-Ramos and Fleseriu 1 The ACTH excess in CD ultimately results in adrenal gland hyperproduction of cortisol. Selective pituitary adenomectomy via transsphenoidal surgery is currently the first line of treatment. Upon successful tumour resection, the cortisol levels drop and the patient presents with symptoms of adrenal insufficiency because the body has become so accustomed to hypercortisolemia, normal cortisol levels are relatively too low. It takes many months for the normal pituitary gland—left behind at surgery—to bounce back to produce normal levels of ACTH, having been heavily suppressed by the prolonged elevation in ACTH levels. In addition, the remission rate for initial transsphenoidal surgery is reported as 69% to 94%, whereas the recurrence rate following initially successful surgery is 2% to 27%.Reference Liubinas, Del Porto and Kaye 4
Thus, there is a complex evolution of patient outcome in the course of treatment with transsphenoidal surgery. Although quality of life (QoL) has been examined in patients with pituitary adenomasReference Johnson, Woodburn and Vance 5 and there is a large literature base on QoL in CS,Reference Webb, Badia and Barahona 6 - Reference Santos, Crespo, Aulinas, Resmini, Valassi and Webb 8 a thorough perioperative examination specifically of CD patients are sparseReference Lindsay, Nansel, Baid, Gumowski and Nieman 9 examined perioperative QoL in CD patients, and we hoped to build off their study by investigating clinical factors as being predictive of QoL outcome.
We performed a retrospective chart review of prospectively collected 36-item Short-Form Health Survey (SF-36) to compare the CD patient’s life quality with that of the normal Canadian population,Reference Hopman, Towheed, Anastassiades, Tenenhouse, Poliquin and Berger 10 and with that of patients with nonfunctioning pituitary tumours at various time points in the treatment of CD. This project was approved by University of British Columbia Research Ethics Board #H15-01572.
Methods
This was a retrospective study that examined patient information relating to their medical outcome and their SF-36 questionnaire scores. The SF-36 is one of the most used and validated measures of general QoL.Reference Ware and Sherbourne 11 It is a general health questionnaire, not targeted at any specific disease, and gives an oversight of general health across multiple conditions and treatments. Results of the SF-36 form are reported for eight health categories, with scores ranging from 0 to 100, with a higher score indicating better perceived health. Patient QoL was evaluated using the SF-36 prospectively as per surgeon’s regular care, preoperatively before surgical admission, at the first postoperative follow up (mean follow-up time: 2.35 months) and at a second postoperative appointment (mean follow-up time: 7.4 months). Although all patients were asked to fill out the questionnaires, this was done voluntarily by patients and not all patients completed questionnaires at all time points. All CD patients operated on by the senior author between June 1, 2005, and June 1, 2015, were examined for eligibility (n =51). All but one patient had endoscopic transsphenoidal surgery (one patient had a craniotomy for a large recurrent invasive tumour, and was excluded from the study). Patients were included in the study if at least one health questionnaire was completed and available in the patient chart. A total of 43 patients met the inclusion criteria, with 42 preoperative questionnaires scored, 34 first postoperative questionnaires scored, and 11 second postoperative questionnaires scored.
SF-36 health questionnaires were scored, and the results of the eight categories were compared between the three time points, against the normal Canadian population,Reference Hopman, Towheed, Anastassiades, Tenenhouse, Poliquin and Berger 10 and with SF-36 scores from random patients with nonfunctioning pituitary adenomas (n=20 convenience sample) operated on by the same neurosurgeon. Statistical significance between patient scores and normal population scores was analyzed using one-sample Student’s t-tests in Microsoft Excel. The paucity of patients who were not cured of CD (n=7) precluded use of statistics within this group of patients. The eight health categories described by the SF-36 are: vitality, physical functioning, bodily pain, general health perceptions, physical role functioning, emotional role functioning, social role functioning, and mental health.
Other pertinent information was collected from patient charts to try to find correlates with reported QoL. These variables included: treatment efficacy, pathological diagnosis, size of tumour, timing of cure, age at surgery, and hospital stay length. The number of patients included in each measurement varied depending on whether that information was available in the patient file.
Treatment efficacy was measured as cure rate and defined as clinical remission from CD (documentation by endocrinologist). Durability is an extended measure of cure rate and is a binary variable that looks at whether a patient was still in remission at the time of their latest follow-up.
The examination of cure rate was then extended to involve timing of cure. If a patient developed adrenal insufficiency during his or her hospital stay and was started on steroid replacement therapy before discharge, this was considered an immediate cure. If postoperative cortisol remained elevated enough not to warrant steroid replacement therapy upon discharge and the patient went on to become clinically cured (again documented by endocrinologist), this was considered a delayed cure. Immediate and delayed cure were assessed for timing of cure. A total of 37 patients had the relevant information on cure timing.
Tumour characteristics, such as pathology and size, were examined for correlation with treatment outcomes. The pathological diagnoses in patient files with a known treatment outcome were included (n =49). Pathological diagnoses were recorded as being positive for pituitary adenoma, not diagnostic, and one patient was diagnosed with Crooke’s hyaline changes. Tumour size was evaluated using radiology reports. Tumours were classified as either microadenomas (<1 cm) or macroadenomas (≥1 cm). Forty-nine patients had radiology files indicating tumour size included in their patient file along with a known treatment outcome.
Complication rates were correlated with cure rates. Forty-four patients were included. Complications were categorised into: cerebrospinal fluid leak, diabetes insipidus, hypopituitarism, hyponatremia, and complex (e.g. the patient developed more than one of the aforementioned complications, developed other serious complications such as sepsis, pneumonia, pulmonary embolism).
Results
Perioperative Quality of Life in CD
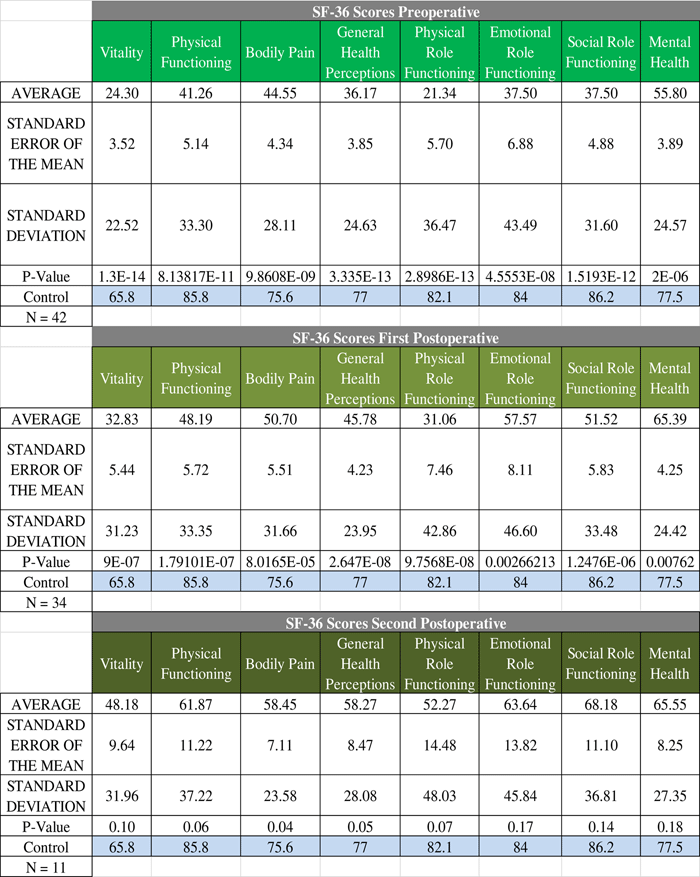
The trend in CD patients is that the QoL is very poor preoperatively, which slowly increases towards the values of the normal Canadian population as the treatment course progresses. There is a statistically significant difference between the scores of CD patients and the scores of the normal Canadian population in all eight subcategories of the SF-36 at both the preoperative sampling and the first postoperative encounter. However, at the second postoperative encounter, there is only a statistically significant difference found in the bodily pain category. The raw data show that the QoL scores in CD patients is still below the normal population even at the second postoperative time point (Figure 1 and Table 1).
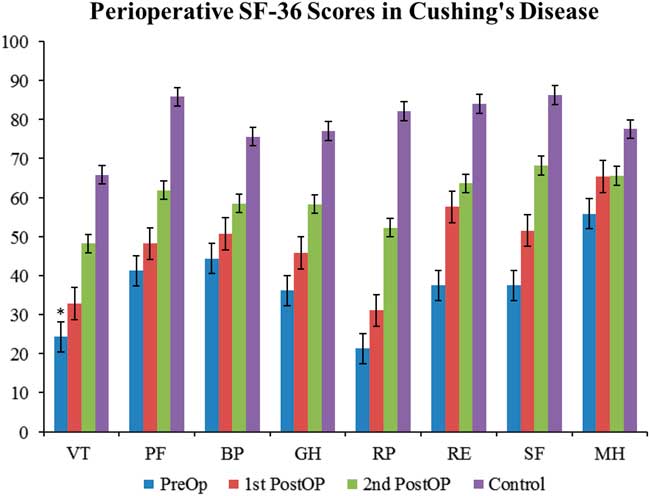
Figure 1 Perioperative SF-36 scores in Cushing’s disease. SF-36 scores from CD patients evaluated at three perioperative time points: preoperatively (preop), first postoperative encounter (first postop); mean follow-up time: 2.35 months), and second postoperative encouonter (second postop); mean follow-up time: 7.4 months). Scores in each of the categories were compared with normal Canadian population values and examined for statistical significance. All eight categories show statistically significant differences at the preoperative and first postoperative time points. Only the bodily pain (BP) category shows statistical significance at the second postoperative time point. However, the raw data show that the QoL scores in CD patients is still below the normal population even at the second postoperative time point. Statistical significance to normal populations is denoted by an asterisk. GH=general health perceptions; MH=mental health; PF=physical functioning; RE=emotional role functioning; RP=physical role functioning; SF=social role functioning; VT=vitality.
Table 1 Perioperative SF-36 scores in CD patients
For patients who were cured, their QoL correlates nicely with the broader trend of QoL progression—QoL is very poor in the preoperative stage and subsequently increases as the treatment course progresses (Figure 2). Statistically significant difference was found in SF-36 between CD cured patients and the normal Canadian population at both the preoperative and first postoperative encounters. There was no statistically significant difference in any of the SF-36 categories at the second postoperative encounter. For patients not cured of CD, the trend is quite different; in fact, there is no clear trend in either direction (Figure 3). Some categories show slight improvements, whereas others show fluctuations, but the raw scores in each category across the perioperative timeline remain below the level of the normal population.
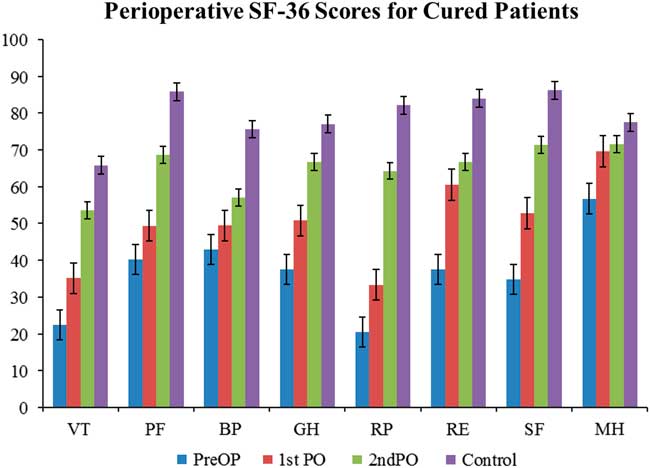
Figure 2 Perioperative SF-36 scores for cured patients. The progression of quality of life in the cured patients exemplifies the overall trend seen in Cushing’s disease. The quality of life starts of very low preoperatively and gradually increases towards baseline levels without reaching them. See Figure 1 for definitions.
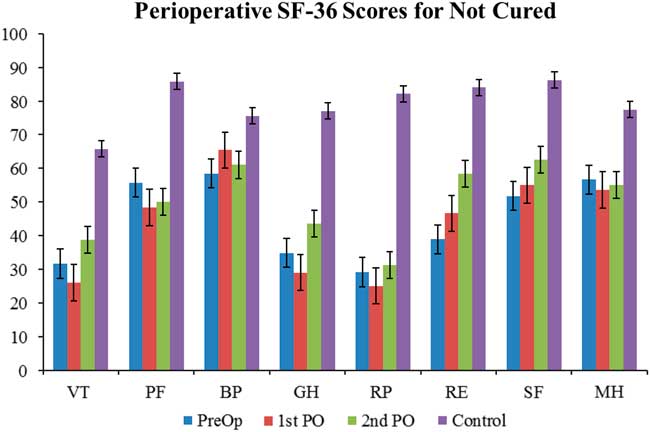
Figure 3 Perioperative SF-36 scores in not-cured patients. The quality of life in the not cured patients differs from the trend seen in both the general and cured patient populations. The quality of life starts of very low and shows no clear trend of improvement towards baseline levels. See Figure 1 for definitions.
QoL in CD patients were compared with the QoL in patients with nonfunctioning pituitary adenomas (NFPT). In the NFPT population the preoperative QoL was low and improved to be close to the normal population level soon after the operation. There was much less fluctuation in the NFPT population perioperatively (Figure 4 and Table 2). There was a statistically significant difference in the preoperative scores compared with the normal population in six of the eight SF-36 categories. This significant difference disappeared by the time of the first postoperative encounter, with seven of eight scores at this encounter showing no statistical difference from normal population levels. At the second postoperative encounter, seven of eight categories also showed no statistical difference from normal population levels.
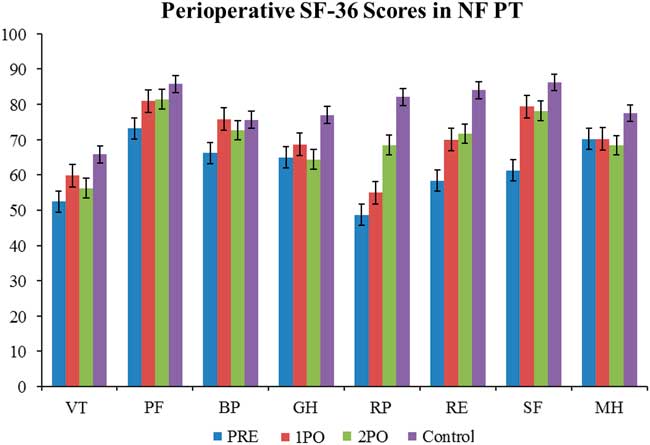
Figure 4 Perioperative SF-36 scores in nonfunctioning pituitary tumours. The quality of life in nonfunctioning pituitary tumours has some similarities to the trend seen in Cushing’s disease in that it is low preoperatively and trends up towards baseline population levels. However, the preoperative deficit in nonfunctioning pituitary tumours is not as large as it is in Cushing’s disease, and the quality of life gets better at a faster rate. Statistical significance to normal population values is denoted with an asterisk. See Figure 1 for definitions.
Table 2 Perioperative SF-36 scores in nonfunctioning pituitary tumours
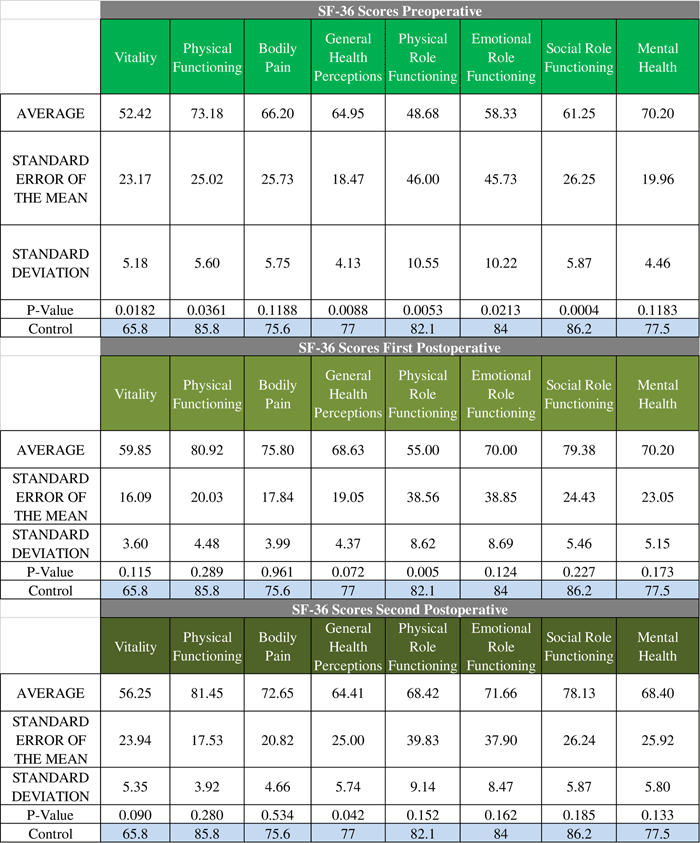
A convenience sampling of nonfunctioning pituitary tumour patients was done to compare the quality of life with Cushing’s disease (N =20).
Preoperative SF-36 scores in all eight categories are lower than the normal population in both CD (cured and not cured) and NFPT. However, the CD scores are much lower than those of the NFPT (seven of eight categories showed a statistically significant difference). Although scores increased across the board in both populations, there remained a statistically significant difference in five of eight categories at the first postoperative encounter. At the second postoperative encounter, there was no longer any statistically significant difference in any of the eight categories between the NFPT population and the CD population that was cured. The scores for the not-cured CD population failed to improve as much, and the raw scores are lower than both the NFPT population and the normal population.
Treatment Outcomes
Of the 51 total operations (including four reoperations) done on CD patients, 40 resulted in a cure (78.4% cure rate). The average follow-up time was 54.9 months (range: 6 months-110 months). Of the 40 operations that resulted in a cure, 36 patients had a durable cure (that is, they were in remission at the time of the last follow-up) over an average follow-up of 59.1 months. Four patients recurred at average of 17.5 months. Of the 11 patients who were not cured at the first operation, four elected to have a second TSS. The cure rate for repeat TSS was 25% (1/4).
The average age of all patients (n=52) was 42.4 years. The average age of cured patients (n=41) was 46.2 years, and the average age of patients not cured (n=11) was 38.6 years; this was found to be statistically significant. The average hospital stay length for all patients (n=54) was 4.76 days. The average hospital stay for cured patients (n=39) was 4.85 days; the average hospital stay for patients not cured (n=11) was 4.65 days; this was not statistically significant.
Outcomes were correlated to pathology of resected specimens, and tumour size as assessed through radiology. Out of 49 patients, 34 had pathological specimens positive for ACTH-secreting pituitary adenoma, 14 were negative for pituitary adenoma, and one had a pathological diagnosis consistent with Crooke’s hyaline changes. Thirty-one of the 34 patients who had positive pathology went on to be cured (91.2% cure rate), whereas eight of 14 patients with negative pathology were cured (57% cure rate). The patient with Crooke’s hyaline changes was not cured. The durability of the cures also correlated with pathological diagnosis (Table 3B). For patients with positive pathology the cure rate was 93.5% (29/31) over an average follow-up of 58.5 months. Patients with negative pathology had a cure rate of 75% (6/8), with average follow-up of 45.6 months.
Table 3 Correlation between pathological diagnosis/tumour size and cure rate, and cure durability, and correlation between the timing and durability of cure
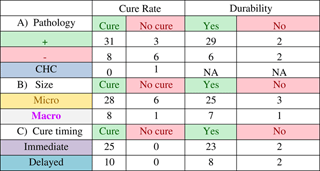
A) Average follow-up time for patients with positive pathology was 51.4 months. Average follow-up time for patients without pathology was 46.4 months. CHC = Crooke’s hyaline changes. B) Average follow-up time for microadenomas was 47.7 months. Average follow-up time for macroadenomas was 56.9 months. C) Average follow-up time for patients with immediate cure was 58.8 months. Average follow-up time for patients with delayed cure was 24.5 months.
Of 49 patients had radiology files indicating tumour size and known treatment outcome, 39 were microadenomas and ten were macroadenomas. The cure rate (Table 4A) for microadenomas was 82.4% (28/34) and the cure rate for macroadenomas was 88.9% (8/9). Of the successful operations, 25/28 (89.3%) cures were durable for microadenomas. Over an average follow-up of 56.9 months, 25/28 (89.3% of the microadenomas remained cured, whereas seven of eight (87.5%) of macroadenomas remained cured over an average follow-up of 47.7 months (Table 4B).
Table 4 Correlation between complication rates and cure rate

Compl.+ indicates complications were present; Compl.- indicates no complications. Specific complications examined included cerebrospinal fluid (CSF) leak, diabetes insipidus (DI), hypopituitarism, complex (presence of more than one of the other specific complications or another complication such as sepsis, pulmonary embolism, etc.), and hyponatremia. Six of the CSF leaks occurred intraoperatively, whereas one required postoperative repair.
Timing of cure was categorized as being immediate or delayed (Table 5). An immediate cure occurred when a patient developed adrenal insufficiency within the first postoperative days, and was started on and discharged with a steroid replacement therapy. A delayed cure did not show an immediate development of adrenal insufficiency, but the cortisol levels changed to be in the normal range during the postoperative course. Thirty-five cured patients had the relevant information for cure timing, and were reviewed. Of these 35 patients, 25 were classified as being immediately cured, whereas ten were classified as having a delayed cure. The durability of the cures were higher for the immediate cures at 92% (23/25, over an average follow-up of 58.8 months) versus 80% (8/10, over an average follow-up of 24.5 months) for the delayed cures.
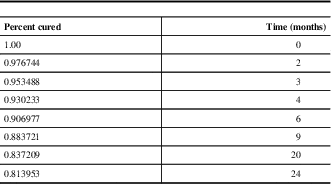
Table 5 Survival curve data
Survival Curve
All of the eight relapses occurred within two years of surgery, and 62.5% (5/8) of the relapses occurred within the first year postoperatively (Figure 5 and Table 5).

Figure 5 Estimated survival curve for Cushing’s disease. Data plotted from Table 5. Average follow-up time for patients included was 50.2 months.
Discussion
Not unexpectedly, preoperative QoL in CD patients is poor, which increases towards the levels of the normal population postoperatively. This trend is not evident in CD patients who are not cured. When compared with nonfunctioning pituitary adenomas, there is a much bigger flux in the perioperative QoL for CD. This is not unexpected, as the longstanding excess hormone levels in CD are cured by surgery, whereas such a physiologic change does not occur for nonfunctioning adenomas. We had initially hypothesized that the first postoperative QoL in CD would actually decrease due to the influence steroid withdrawal would have on QoL. However, this was not the case. The increase in the first postoperative QoL could be the result of excessively prolonged hypercortisolemia having such an impact on QoL that the postoperative situation would represent an improvement to the patients. Alternatively, it could be that postoperative steroid withdrawal did not have an impact on the QoL by the time of the first postoperative encounter, particularly because patients had been placed on relatively stable does of replacement steroids by the first postoperative office visit at 6 weeks; earlier postoperative assessments may have been useful to detect changes in QoL related to steroid withdraw.
One previous study examined perioperative QoL in CD which also used the SF-36.Reference Lindsay, Nansel, Baid, Gumowski and Nieman 9 The results from this study indicate that preoperatively, patients with active CD had low individual SF-36 domain z-scores compared with age- and sex-matched controls. Postoperatively, scores in six of the eight individual SF-36 domains improved, similar to the improvement shown in our study at the second postoperative QoL sampling.
One interesting aspect of CS is patient illness perceptions. It has been shown that illness perceptions relate closely to QoL, and that in CS patients, even after long-term remission, report more negative perceptions of their illness when compared with patients with other acute or chronic conditions.Reference Tiemensma, Kaptein, Pereira, Smit and Romijin 12 These illness perceptions may play an important role in the natural trajectory of patient QoL in CS.
A disease-specific QoL survey has been previously described in the literature: the CushingQoL.Reference Webb, Badia and Barahona 6 , Reference Roset, Badia and Forsythe 13 , Reference Nelson, Forsythe, McLeod, Pulgar, Maldonado and Coles 14 This is a unidimensional questionnaire that aims to identify the specific areas of a patient’s QoL that is affected by Cushing’s. It shows a high correlation with the traditional nonspecific methods of evaluating QoL (e.g. the SF-36). One advantage of using the SF-36 in our study was that the prevalent usage of the questionnaire allowed us to compare patient scores with those of the normal Canadian population, which may not be possible with a more selective questionnaire. Disease-specific questionnaires are more specific and sensitive to a particular disease and may pick up differences that general QOL questionnaires do not; but if general QOL is not affected, it (disease-specific QOL) may be too specific and not matter much with respect to patient function.
Because treatment outcome appeared to play a role in shaping patient QoL, factors that could impact treatment outcome were examined.
In this study, patients who were cured of CD were statistically significantly older. This could be attributed to more aggressive disease in younger patients, resulting in poorer cure rates. Many studies have looked for predictors of patient outcomes in CD. Factors that have been examined include tumour size, pathological and radiological diagnosis, sellar invasion, and complication rates, among others. The difficulties in comparing these studies include variable factors examined in each study and the lack of strict definitions, or definitions that vary between centres on disease remission and relapse. A meta-analysis in 2012 concluded that age, gender, and tumour size were not prognostic factors of recurrence,Reference Roelfsema and Biermasz 15 and one Canadian study found that the only significant predictor of poor long-term outcome in CD was repeat transsphenoidal surgery.Reference Alahmadi, Cusimano, Woo, Mohammed, Goguen and Smyth 16
The cure rate in patients with positive pathological diagnosis was significantly higher than the cure rate in patients without pathological confirmation (91.1% vs 57.1%). Pathological confirmation correlating with better cure rates has been shown in a previous study where histological evidence of an adenoma correlated with a cure rate of 75.6%, compared with a cure rate of 52.4% in patients without histological evidence of adenoma.Reference Chee, Mathias, James and Kendall-Taylor 17 Furthermore, the durability of the cure (to last follow-up) was also higher when pathology was positive (93.5%) than when pathology was not diagnostic (75%).
The majority of cases were microadenomas (79%, 34/43). The cure rate was higher in macroadenomas (88.9%, 8/9) versus microadenomas (82.4%%, 28/34). This is not surprising because a macroadenoma that can be visually identified during the operation has a higher chance of being resected—and subsequently being cured—than a microadenoma that has difficulty being visualized. Similarly, other studies have reported better cure rates for macroadenomas than microadenomas. One Canadian study determined that remission was achieved in 59% of microadenomas and 67% of macroadenomas,Reference Alahmadi, Cusimano, Woo, Mohammed, Goguen and Smyth 16 whereas another study reported cure rates for macroadenomas of 92% versus 84% for microadenomas.Reference Fomekong, Maiter, Grandin and Raftopoulos 18 Our results indicate that tumour size may not be prognostic of recurrence because cure durability was similar for microadenomas (89.3%) and macroadenomas (87.5%).
We also examined the correlation between the timing and durability of cure. The original hypothesis was that the durability rates of the delayed cure would be less than that of the immediate cures, because a higher postoperative cortisol level could be an indicator of residual adenoma. The durability of immediate cures was in fact higher (92%, 23/25) when compared with delayed cures (80%, 8/10).
Complication rates were examined with the hypothesis that the presence of certain complications such as diabetes insipidus or hypopituitarism would indicate a more aggressive surgical procedure, increasing the likelihood of tumour resection and cure. Our results indicate that the complication rate was higher (71.4%, 5/7) in patients not cured from CD than in cured patients (46%, 17/37). Diabetes insipidus accounted for half of the complications, and 81.8% (9/11) of patients who had diabetes insipidus went on to be cured. One study, which looked at complications such as diabetes insipidus, cerebrospinal fluid leak, and meningitis, found no difference in the complication rates between the patients who relapsed and those who achieved remission.Reference Atkinson, Kennedy, Wiggam, McCance and Sheridan 19 Another study found that 59% of patients in remission developed partial or complete hypopituitarism compared with 33% of patients not in remission.Reference Rees, Hanna, Davies, Mills, Vafidis and Scanlon 20
Limitations
Although data was collected prospectively, they were reviewed in a retrospective manner. Although requested, patients did not always fill questionnaires, likely resulting in a sampling error as patients who filled out forms may be different than those who did not. There are multiple comparisons and statistical tests done on a relative small number of patients/responses; it may be more appropriate to look at the raw numbers.
Conclusion
This review of the perioperative QoL findings in CD builds on the literature of QoL in CS and helps to illustrate how QoL changes throughout the treatment process, how QoL compares with normal Canadian population levels, and how QoL compares with patients with nonfunctioning pituitary adenomas. In general, CD patients have relatively poor QoL that does improve as expected when cured. Factors associated with cure included macroadenomas and confirmatory pathology. Postoperative timing of cure appears to affect the durability of cure, with an immediate cure having a higher durability rate than delayed cure. Most recurrences occurred within 10 months postoperatively. Because treatment outcome has such a high impact on QoL, the variables identified in this study will help to better inform patients about the treatment course.
Acknowledgements and Funding
This project was supported by a grant from the University of British Columbia Faculty of Medicine Summer Student Research Program. No other financial support was involved.
Disclosures
The authors have nothing to disclose.


