Interventions that combine agriculture and nutrition are thought to have the potential to improve outcomes in less developed countries, but there only a few interventions that have successfully demonstrated, in a rigorous manner, that nutrition outcomes can be improved through agricultural interventions. Recent reviews of the effectiveness of nutrition-sensitive agricultural programmes suggest that while there have been a wide variety of programmes implemented, only a few randomised evaluations have been conducted that show positive impacts on nutrition outcomes(Reference Ruel, Quisumbing and Balagamwala1–Reference Ruel and Alderman3). One such set of evaluations is derived from the Reaching End Users (REU) project in Mozambique and Uganda(Reference Hotz, Loechl and de Brauw4–Reference Hotz, Loechl and Lubowa5), which demonstrated the introduction of orange sweet potatoes (OSP) increased vitamin A intake among both targeted children and their mothers and reduced the prevalence of inadequate vitamin A intake in both countries. Further, the evaluation in Uganda showed that children who had been at least mildly vitamin A deficient at baseline were less likely to be vitamin A deficient at end line(Reference Hotz, Loechl and Lubowa5).
Although the REU project was successful in the short-term at increasing vitamin A intake among children, it is not known whether the introduction of OSP led to continued positive outcomes among children after the REU project ended. More generally, little is known about how long impacts last from development interventions, as it is rare that data are collected some period of time after an intervention has been completed; exceptions include a nutrition intervention conducted in the 1970s by the Instituto de Nutriciwn de Centro América y Panamá that followed participants into adulthood(Reference Hoddinott, Maluccio and Behrman6) and medium-run impact estimates of a cash transfer programme developed to keep girls in school(Reference Baird, McIntosh and Ozler7). This paper reports on data collection that took place in 2012 to measure vitamin A intake among beneficiary communities 3 years after the REU project ended. The primary outcomes studied are vitamin A intake among children aged 6–35 months and their mothers; notably, these children were not yet born at the time the REU intervention ended.
Materials and methods
Project description
The REU project in Mozambique was built on a previous intervention (Towards Sustainable Nutrition Improvement or TSNI; Low et al. (Reference Low, Arimond and Osman8)) with the goal of reducing vitamin A deficiency through the introduction of OSP. The REU project integrated three components, including a seed systems component to disseminate OSP vines and information about producing OSP, a demand creation component to disseminate information on the importance of consuming OSP and a market component to facilitate exchange of OSP. In Mozambique, the project took place between 2006 and 2009 and involved 144 farmer groups, reaching around 14 000 direct beneficiaries. All farmer groups were located in separate villages to minimise implementation challenges around randomisation for the impact evaluation. The three components were implemented using two models of differing intensity; farmer groups were randomised into the intensive and moderate treatment groups. As the associated impact evaluation found no difference in impact between the two treatment groups(Reference Hotz, Loechl and de Brauw4,Reference De Brauw, Eozenou and Gilligan9) , the present study combined the two groups. Further, the impact evaluation report found a minimal contribution of the marketing component to average impacts, so it is not discussed in detail below(Reference De Brauw, Eozenou and Gilligan10).
The seed systems component had three primary tasks. The project grew large quantities of OSP vines for dissemination, distributed multiple varieties of vines to project farmers and taught farmers growing techniques. A hierarchical management structure was designed in which extensionists hired by the REU project trained selected volunteer extension promoters from among farmer group or community group members. These promoters then assisted in vine distribution and trained group members on how to grow OSP and maintain vines between seasons. Farmers therefore had the opportunity to try different varieties and determine which ones they preferred to grow and consume.
The demand creation component used multiple strategies to train and inform people about the nutritional benefits of consuming OSP and other vitamin A sources. Information was conveyed through a variety of sources including group trainings with farmer group members, community theatre sessions related to the health benefits of OSP, radio spots, billboards and other advertising. With regard to extension, the demand creation component had a similar structure to the seed systems component. Nutrition promoters were selected from among farmer or community group members and were trained to deliver nutrition-related messages to their farmer group members. Communication tools were developed to assist nutrition promoters in training farmer group members.
Study design
The impact evaluation associated with the REU project collected data in thirty-six of the 144 farmer groups. For the purposes of this paper, the treatment group includes twenty-four farmer groups that were randomised into the two treatment intensities, and the remaining twelve farmer groups serve as a control group. The control group did receive a distribution of OSP vines in January 2010, with no associated agricultural or nutrition extension.
In 2012, a field team initially returned to all thirty-six treatment and control villages to do a socio-economic survey similar to those completed at baseline (2006) and end line (2009). The socio-economic survey also took place in additional households in each community who had been on farmer group lists, to attempt to learn about diffusion. The socio-economic survey was followed by a dietary intake survey that took place in July and August. The plan had been to field it earlier, in June, but various factors led to delay in commencing the fieldwork. As such, the intakes of OSP are likely to be slightly lower than they would have been in peak harvest months (May and June).
In 2006, households were specifically selected from farmer group lists to have a ‘reference’ child between the age of 6 and 35 months living with them, and socio-economic and dietary intake studies both took place in November and December before vine distribution took place and extension began. Dietary intake was completed with twelve households per farmer group, while the socio-economic survey took place in twenty households per farmer group.
In 2012, the sample was structured as follows. For the socioeconomic survey, households were added to attempt to learn about diffusion within the communities. For the dietary intake study, the sample was restricted to only attempt to collect data in households with children aged 6–59 months; households were required to have appeared in the sample either in 2006 or in 2009. Mothers and children were both enumerated in the dietary intake. The fieldwork goal was to reach 400 total households with the dietary intake questionnaire; the final total was 395 children and 346 mothers (Table 1).
Table 1. Proportion of households growing orange sweet potatoes (OSP) and children consuming OSP in 2012, Zambezia, Mozambique
(Mean proportions, standard errors; numbers of households)
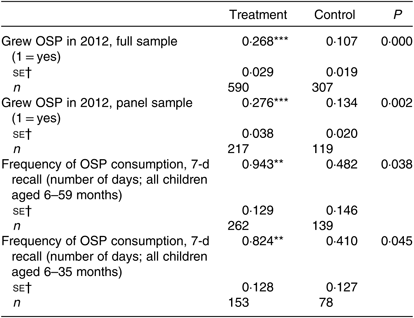
** P<0·05, *** P<0·01.
† Averages presented with their standard errors clustered at the village level and adjusted for stratification.
In this paper, the primary outcome of interest is vitamin A intake as computed from the dietary intake study, among mothers and children aged 6–35 months. A potential concern among the latter group is that children aged 6–11 months still obtain a substantial amount of vitamin A through breast-feeding. To deal with this concern, we tested whether the proportion of children between the age of 6 and 11 months was statistically different between the treatment and control groups. As the proportions differ neither in 2006 nor in 2012, the results would not be affected by either excluding these children or including an adjustment among these children for breast milk intakes. Nonetheless, they are excluded from estimates of inadequate intake discussed below.
In the present study, the primary nutrition outcome is total vitamin A intake in 2012, after the intervention occurred. The primary outcome is total vitamin A intake, primarily measured among 6- to 35-month-olds and mothers of child-bearing age; the prevalence of inadequate vitamin A intake is a secondary outcome of interest. Additional study components included anthropometric status and frequency of consumption of selected foods. The impact evaluation study was approved by the Institutional Review Board of the International Food Policy Research Institute (Washington, DC) and by the National Bioethics Committee of the Ministry of Health, Mozambique.
Measurement
The baseline and 2012 rounds of survey data are used in this paper to study the medium-term impacts of the REU intervention on dietary intake of vitamin A as well as the prevalence of inadequate vitamin A intake. The dietary data collection methods used were adapted from an interactive, multiple-pass 24-h recall method(Reference Gibson and Ferguson11). All enumerators were intensively trained in interview techniques, probing techniques and specific methods required to conduct the recall. Women were provided with a pictorial chart of common food items to assist in tracking foods consumed on the day of recall, which was then used as a cross-check during the interview process. In-home interviews were conducted the day after the 24-h recall period. The first pass of the interview probed for a list of all foods and dishes consumed, in chronological order, and in the second pass, descriptive details were probed such as state (e.g. raw, boiled, roasted), processing method (e.g. chopped, whole) and specific ingredients in recipes. In the third pass, women were asked to demonstrate the amounts of food consumed, the amounts of ingredients added to mixed dishes and the amounts of final mixed dish. In the final pass, information collected was reviewed with the respondents and checked for completeness and correctness.
Portion size recall of all foods, including sweet potato, was aided using photographs of different sizes of food items printed to scale and by real cooked and raw foods whose amounts could be weighed on a digital dietary scale. Volumes were shown by putting equivalent amounts of dry rice in household receptacles, or by modelling clay to actual shape and size, after which it was weighed or measured volumetrically. Previously compiled standard recipes were also used for common mixed dishes to minimise respondent burden in recalling details of recipe preparation.
A table of conversion factors was compiled to convert food volumes or sizes to weights representative of the food state as consumed. These factors were collected systematically in the field, derived from previously collected data in this region or derived from the US Department of Agriculture Nutrient Database(12). Gram weights of all foods were converted to energy and nutrient intake using a food composition table compiled for this project. Where nutrient content of raw foods was converted to cooked forms, appropriate water content changes and nutrient retention factors were applied(13).
Statistical analyses
Primary analyses were carried out using the complex survey module in Stata 13 (StataCorp).
To construct estimates of the best linear unbiased predictors (BLUP) of usual vitamin A intake at the individual level, and the prevalence of inadequate vitamin A intake, the Iowa State University method was used(Reference Nusser, Carriquiry and Dodd14) with PC-SIDE software (version 1.0; Iowa State University). Parameters for adjusting daily intake for within-person variability in intake were generated for 2012 from the 2006 and 2009 second-day dietary intake; the resulting intake distributions reflect only the between-person variance in intake. The proportion of individuals in each group with usual vitamin A intake below the appropriate estimated average requirement (EAR) was approximated using the EAR cut point method(15). The EAR used corresponded to 210 µg retinol activity equivalents (RAE) for children aged 1–3 years, 275 µg RAE for children 4–8 years, 500 µg RAE for non-pregnant/non-lactating women and 900 µg RAE for pregnant/lactating women(16). For the young child age group, children <12 months of age and those still breast-fed were dropped from this analysis because there is no EAR for children <12 months of age, and breast milk intake was not measured. There were very few pregnant/lactating women in the sample, so these were combined with non-pregnant/non-lactating women. For estimation of the prevalence of inadequate intake, usual intake for lactating women were re-scaled to the daily intake of the non-lactating women by a factor equal to 500/900; this procedure allowed the use of the EAR cut point method and one set of prevalence estimates for the full sample of women to be presented. A similar method was used for the reference child age group as they straddled two EAR age classification groups.
Results
First, descriptive statistics for the 2012 sample for selected variables are presented (Table 1). Irrespective of whether the cross-section included in the survey in 2012 or the strict panel of households also included in the baseline survey is considered, there is a significant decline in households growing OSP by 2012 in the treatment group, and fewer households in the control group were growing OSP in 2012. Anecdotally, the fieldwork found that in 2011 conditions maintaining vines were difficult and many households lost their vines; however, households who had received agricultural extension (the treatment group) were more likely to have been able to keep vines through the particularly dry year and continued to grow OSP in 2012. For consumption to be higher among the treatment group, this point is necessary, since there is little diffusion of vines between farmer groups. Only three households in the sample reported receiving vines from households in other communities in 2012 (out of 901 households).
The socio-economic questionnaire also asked about the frequency of OSP consumption over the past 7 d among children under 5 years of age. On average, the frequency of consumption is higher among the treatment group compared with the control group, whether the sample is limited to under 3-year-olds (Table 1, rows 3 and 4). The differences are significant at the 5 % level. These questions were asked at a different point in the season than the dietary intake survey, as part of the socio-economic survey; they were asked towards the beginning of the availability period. However, these averages do not control for portion size.
In Table 2, simple differences in average vitamin A intake among children aged 12–35 months and among mothers are presented, both unadjusted and after making the adjustment to the best linear unbiased predictors. Among children under 3 years old, unadjusted intake among the treatment group exceed those among the control group by over 100 µg RAE, and the difference in statistically significant at the 5 % level. Even after vitamin A intake is adjusted to account for within-person variability, intake is higher among the treatment group compared with the control group among both children and mothers, though the unadjusted differences are larger. The same is true among mothers, though the unadjusted difference is much larger.
Table 2. Difference in average vitamin A intake, treatment and control groups, 2012, Zambezia, Mozambique†
(Mean values with their standard errors)
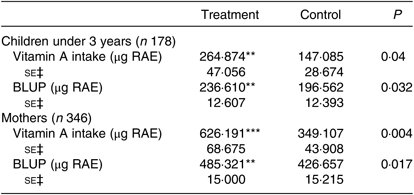
RAE, retinol activity equivalents; BLUP, best linear unbiased predictors.
** P<0·05, *** P<0·01.
† Source: Mozambique 2012 survey, Reaching End Users project.
‡ Standard errors clustered at the village level and adjusted for stratification. Tests of equality are measured using adjusted Wald tests.
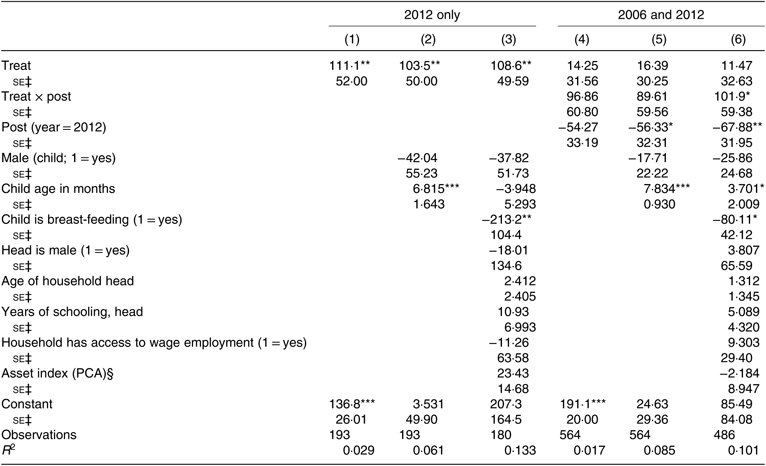
In Table 3, average differences in unadjusted vitamin A intake between the treatment and control groups are examined using a regression framework. In columns (1)–(3), child characteristics (sex, age) and then household characteristics are sequentially added to the basic regression specification; all results simply reflect average differences in the 2012 data between the treatment and control groups. In columns (4)–(6), a difference-in-difference framework is used, with the 2006 baseline serving as the first round. The interaction between the treatment and the second year gives the treatment effect in columns (4)–(6).
Table 3. Regression results for impacts of the Reaching End Users project on unadjusted vitamin A intakes (µg retinol activity equivalents), using single and double difference, children under 3 years of age, Zambezia, Mozambique†
(Regression coefficients with their standard errors)
PCA, principal component analysis.
* P<0·10, ** P<0·05, *** P<0·01.
† Source: Mozambique baseline and 2012 surveys.
‡ Standard errors clustered at primary sampling unit and adjusted for sample stratification.
§ The asset index is constructed via PCA and using dichotomous variables that account for the ownership of durable assets of (i) radio, (ii) bicycle, (iii) watch, (iv) bench, (v) chair, (vi) lamp, (vii) portable lantern, (viii) granary, (ix) axe, (x) catana, (xi) latrine, and housing conditions of (xii) whether wall is thatched, (xiii) whether house has window, (xiv) whether general house condition is poor. The variables are chosen in constructing the asset index if they are owned by between 25 and 75 % of households.
Using the cross-section, the average ‘intent-to-treat’ effect of the REU intervention is found to be between 103·5 and 111·1 µg RAE relative to the control group, and differences between the treatment and control groups are significant at the 5 % level. The US RDA for vitamin A is 210 µg RAE among children under 5 years old, so the average treatment effect represents about half of the US RDA. Moreover, they suggest that messages about feeding OSP to young children resonated. When the baseline measures are included in the regression, the average intent-to-treat effect drops slightly, to between 89 and 101 µg RAE, depending upon the specification. The point estimate is only significant when all household controls are included (at the 10 % level).
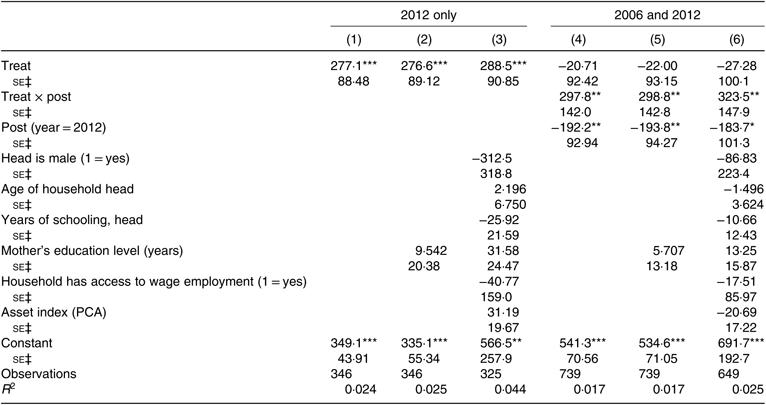
In Table 4, the same pattern is followed to test whether intake is higher in the treatment group compared with the control group among female caregivers of children, as shown in Table 3, using the same methodology as used for children. Using the cross-sectional data, an average treatment effect of around 280 µg RAE is found. The difference is statistically significant at the 1 % level for all specifications in the cross-section and at the 5 % level for all specifications in the difference-in-difference analysis, suggesting it is quite robust.
Table 4. Regression results for impacts of the Reaching End Users project on unadjusted vitamin A intakes (µg retinol activity equivalents), using single and double difference, mothers, Zambezia, Mozambique†
(Regression coefficients with their standard errors)
PCA, principal component analysis.
* P<0·10, ** P<0·05, *** P<0·01.
† Source: Mozambique baseline and 2012 surveys.
‡ Standard errors clustered at primary sampling unit and adjusted for sample stratification.
To contextualise these results, online Supplementary Table S2 (which is Table 4 in Hotz et al. (Reference Hotz, Loechl and de Brauw4)) presents differences in change in vitamin A intake among the more intensive intervention model (model 1), the less intensive intervention model (model 2) and the control group between the baseline and end line in 2009. The treatment effect was approximately to 210 µg RAE in 2009 among children aged 12–35 months, suggesting that the difference in 2012 represents a decline in the treatment effect of about 50 % from the project end line. Among female caregivers, the decline in the treatment effect was not quite as large. Average impacts were close to 500 µg RAE in 2009, so the results suggest that impacts on intake are about 60 % high 3 years later. As households received annual vine distributions during the REU intervention, these results are quite positive as they demonstrate an ability of some households to maintain vines.
Changes in vitamin A intake could have come from increased intake of OSP or other foods. Next the source of differences is examined in vitamin A intake among both children under 3 years old and female caregivers (Table 5). Vitamin A sources are disaggregated into three broad categories – orange or yellow sweet potato (or OSP), other plant sources and animal food sources. Among children under 3 years old, the difference in vitamin A intake from OSP is 105 µg RAE between the treatment and control groups, whereas the difference in intake from other plant and animal sources is 8·7 µg RAE and −2·4 µg RAE, respectively; neither difference is statistically significant. As the overall difference is 111 µg RAE, nearly the entire difference between treatment and control groups can be explained by the difference in OSP intake. Similarly, among mothers the difference in vitamin A intake from OSP are 288 µg RAE, which is slightly larger than the total difference of 277 µg RAE. Meanwhile, differences in intake from other plant sources and animal sources are −12·4 µg RAE and 1·9 µg RAE, respectively. So among both children under 3 years and their female caregivers, the difference in intake of vitamin A from OSP effectively explains the total difference in vitamin A intake. In other words, additional OSP intake almost completely explains the difference in vitamin A intake.
Table 5. Source of difference in vitamin A intake (µg retinol activity equivalents)†
(Decomposition of regression coefficients by source)

Y/OSP, yellow and orange sweet potatoes.
** P<0·05, *** P<0·01.
† Source: Mozambique baseline and 2012 surveys.
To understand a bit better how households sourced OSP in 2012, questions in the socio-economic survey both about production and purchase of OSP were examined. While the survey did not ask whether households received OSP from others without payment, it did ask whether households produced and gave away OSP roots. Nearly half of households that grew OSP reported giving some of their crop to neighbours. Therefore, it would appear that within-village exchange is probably an important source of OSP for consuming households.
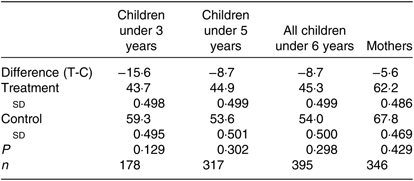
Finally, Table 6 shows the prevalence of inadequate vitamin A intake by treatment and control groups. Regardless of the sample of children included (only children under 3 years of age, children under 5 years of age or all children under 6 years of age), the probability of inadequacy is lower in the treatment group; however, it only approaches statistical significance among those under 3 years of age (P = 0·129).
Table 6. Prevalence of inadequate vitamin A intake (proportion below estimated average requirement), 2012*
(Proportions and standard deviations)
T-C, treatment – control.
* Prevalence is expressed as a proportion of children in that group.
It is likely that the sample lacks statistical power to demonstrate the differences in the probability of inadequacy. The point estimate of a 15·6 percentage point decline among children between the treatment and control groups appears substantial. Yet an ex post power calculation suggests the end line sample size would have had to be doubled, averaged over all clusters, to detect that difference at the 5 % significance level. The difference in the probability of inadequacy is much smaller among female caregivers (6 percentage points). In sum, the results are suggestive of the differences between the treatment and control groups in the probability of inadequacy, but the sample is not statistically powerful enough to detect them.
Discussion and conclusion
The results of the 2012 survey demonstrate that targeted household members in farmer groups who participated in the REU project continue to have higher vitamin A intake, caused by increased OSP consumption, compared with household members in the control group. The findings suggest that vitamin A intake was about 111 µg RAE among children in treatment communities aged 6–35 months 3 years after the REU intervention ended, and 277 µg RAE among female caregivers. These differences are about half as large and 60 % as large as the average intent-to-treat effects measured from data collected at the project end line(Reference Hotz, Loechl and de Brauw4). While the treatment effects are not as large as they had been, particularly among younger children, the increased vitamin A intake is at least suggestive of lower prevalence of vitamin A inadequacy, though the sample was not large enough to demonstrate this point statistically.
There are several important implications of these findings for future programme design, particularly when combined with further evidence from the project. While casual mediation analysis for the Mozambique data suggested that the adoption decision explained much of the overall project treatment effect on vitamin A intake among children(Reference De Brauw, Eozenou and Gilligan10), OSP vine receipt is clearly not sufficient to increaser vitamin A intake among children. The control group received OSP vines in 2010 without instruction on how to care for them, and vine retention among the control group was particularly low. Therefore, the extension components of the intervention clearly played an important role in helping at least some households maintain vines through the dry seasons between the intervention and the 2012 survey.
Moreover, given the average increase in vitamin A intake among children born after the intervention began, nuanced calculations of cost-effectiveness of the REU project or similar interventions must take into account the future beneficiaries not benefitting during the intervention. An estimate of the average cost per targeted beneficiary was $65, where beneficiaries were defined as either children under 5 years or their female caregivers who were members of households in the intervention communities(Reference De Brauw, Eozenou and Gilligan9). However, these results show that the next generation of children also benefit, though not as much as during the intervention. Nonetheless, that crude estimate overstates the cost per beneficiary as at least the next cohort of births also benefit.
Finally, improving programming that leads to better vine maintenance or availability could lead to even larger benefits over time after projects end; the gains in vitamin A intake demonstrated in this paper for the treatment group over the control group are averaged over households that were able to retain vines or obtain OSP from neighbours as well as those who could not. The household survey suggested some latent demand for OSP; households continue to report they prefer OSP to other types of OSP in 2012. If more households could continue to grow them, vitamin A intake among young children would likely further increase.
Acknowledgements
The authors thank Anna Marie Ball, Howarth Bouis, Erick Boy, Patrick Eozenou, Dan Gilligan, Christine Hotz, Neha Kumar, Ricardo Labarta, Cornelia Loechl, Jan Low, Abdelrahman Lubowa, Christine Hotz and Cheng Qiu for work on previous parts of the project, without which this paper would not be possible.
Socio-economic databases for the paper are available at IFPRI’s Dataverse and the dietary intake data are being processed for public availability through the FAO/WHO Global Individual Food Consumption project. The specific data compiled for use in this paper can be made publicly available ahead of publication.
The primary study was supported by HarvestPlus. HarvestPlus’s principal donors are the UK Government; the Bill & Melinda Gates Foundation; the US Government's Feed the Future initiative; the European Commission; and donors to the CGIAR Research Program on Agriculture for Nutrition and Health. The 2012 round of data collection and analysis time was partially supported by the European Commission.
A. d. B. was responsible for the impact study design, statistical analysis methods, coordination with the intervention implementation team, interpretation of results and writing the manuscript. M. M. assisted in analysing dietary intake data, performing statistical analyses and with interpreting results. A. B. M. provided overall supervision of the field data collection.
A. d. B. has no conflicts of interest; M. M. was employed by HarvestPlus when the research occurred and when the paper was initially drafted; A. B. M. has no conflicts of interest.
Supplementary material
For supplementary material/s referred to in this article, please visit https://doi.org/10.1017/S0007114519002162


