Cancer and CVD are two of the most common leading causes of mortality worldwide. According to the World Health Organization( 1 ), cancer and CVD accounted for 8·2 and 17·5 million deaths worldwide in 2012, representing 15 and 31 % of all global deaths, respectively. Over the past few decades, dietary factors were postulated to play an important role in the prevention of various degenerative diseases. Tea, the second most popular beverage around the world, was reported to be protective against cancer and CVD( Reference Chen, Milacic and Chen 2 , Reference Tangney and Rasmussen 3 ).
It is generally believed that the anti-cancer effects of tea are attributed to its abundant polyphenols. The main anti-cancer mechanisms of tea polyphenols include promotion of antioxidant activity, inhibition of NF-κB and AP-1, regulation of the cell cycle, inhibition of receptor tyrosine kinase pathways, control of epigenetic modifications and modulation of the immune system( Reference Shirakami, Shimizu and Moriwaki 4 ). It has been proved that an increased level of plasma cholesterol is a major risk factor for CVD. Tea and its polyphenols could lower plasma cholesterol levels by increasing the expression of LDL and reducing the oxidisation of LDL( Reference Brown and Goldstein 5 , Reference Kuhn, Burns and Kazi 6 ). It has also been suggested that tea can inhibit the process of atherosclerosis by removing reactive oxygen species, inducing hypolipaemia and decreasing antifibrinolysis( Reference Vinson, Teufel and Wu 7 ). In general, tea and its polyphenols could be effective dietary factors for the prevention of cancer and CVD.
However, results from observational studies have been inconsistent. To date, we identified eighteen cohort studies investigating the associations between tea consumption and mortality of all cancers, CVD and all causes( Reference Klatsky, Armstrong and Friedman 8 – Reference Saito, Inoue and Sawada 25 ). Among them, one study( Reference Gardener, Rundek and Wright 23 ) suggested an inverse association between tea consumption and mortality of all cancers, whereas another seven studies suggested a null association( Reference Hertog, Sweetnam and Fehily 9 , Reference Iwai, Ohshiro and Kurozawa 11 , Reference Khan, Goto and Kobayashi 13 , Reference Kuriyama, Shimazu and Ohmori 14 , Reference Suzuki, Yorifuji and Takao 18 , Reference Odegaard, Koh and Yuan 24 , Reference Saito, Inoue and Sawada 25 ). Similarly, conclusions from the studies that investigated the association between tea consumption and mortality from CVD and all causes were inconsistent.
Although a significant number of meta-analyses have been carried out to investigate the relationship between tea consumption and cancer and CVD in recent years, they mainly focused on individual cancers or specific types of CVD. The outcome of the studies, included in these meta-analyses, was primarily risk of incidence, but not mortality. Several questions are still unanswered – for example, whether the associations remain consistent when it comes to mortality of all cancers, all CVD and all causes, compared with morbidity of individual cancers or specific types of CVD. Therefore, it is necessary to conduct a meta-analysis with cohort studies using mortality as the outcome. The objective of the present study was to investigate the association between tea consumption and mortality of all cancers, CVD and all causes. In addition, a dose–response analysis was carried out to determine trend estimation, and sub-group analyses were carried out to examine sources of heterogeneity.
Methods
Selection of studies
Our report followed the Meta-analysis Of Observational Studies in Epidemiology Guidelines( Reference Stroup, Berlin and Morton 26 ). PubMed and Embase were searched for all relevant papers published in English from 1 January 1966 to 10 April 2015 and from 1 January 1974 to 10 April 2015, respectively. The search terms included ‘tea’ (or ‘coffee’ or ‘beverage’ or ‘beverages’ or ‘dietary habits’ or ‘flavonols’ or ‘flavonoids’ or ‘caffeine’ or ‘catechin’); ‘all cancers’ (or ‘cancer’ or ‘carcinoma’ or ‘carcinomas’ or ‘neoplasm’ or ‘neoplasms’ or ‘oral cancer’ or ‘breast cancer’ or ‘liver cancer’ or ‘pancreatic cancer’ or ‘stomach cancer’ or ‘gastric cancer’ or ‘colon cancer’ or ‘rectal cancer’ or ‘colorectal cancer’ or ‘prostate cancer’); ‘cardiovascular disease’ (or ‘CVD’ or ‘all cardiovascular diseases’ or ‘all CVDs’ or ‘vascular disease’ or ‘vascular event’ or ‘coronary heart disease’ or ‘CHD’ or ‘angina’ or ‘ischemic heart disease’ or ‘IHD’ or ‘myocardial ischemia’ or ‘myocardial infarction’ or ‘MI’ or ‘coronary artery disease’ or ‘atherosclerosis’); ‘all-cause’ (or ‘all causes’ or ‘overall’ or ‘total’); ‘prospective’ (or ‘cohort’ or ‘nest case control’ or ‘nest case-control studies’); and ‘mortality’ (or ‘risk’ or ‘incedence’ or ‘morbidity’). The complete details of the search strategy are shown in the online Supplementary Methods. The search was restricted to human studies. Furthermore, references from the retrieved articles were reviewed to identify potential bibliographies.
The search was conducted by two of the authors (J. T. and J. Z.) independently, and discrepancies were resolved through group discussion. Included studies were required to meet the following criteria: (a) studies used a prospective observational design (prospective cohort or nested case–control study); (b) risk estimates (hazard ratio (HR) or RR) with their corresponding 95 % CI of mortality rate for each category of tea consumption were available; and (c) the most recent and complete study was included if cohorts were duplicated. The exclusion criteria were as follows: (a) case–control or intervention studies; (b) the outcome was risk of incidence, not mortality; (c) the detailed risk estimates were not reported; (d) studies only investigated individual cancers, but did not report mortality of all cancers; and (e) studies only investigated specific types of CVD such as CHD and stroke, but did not report overall CVD mortality.
Data extraction
We collected the following data from the included studies: first author’s name, year of publication, study region, age of subjects, duration of follow-up, sex, sample size, type of tea consumed, number of events for each tea consumption category, adjusted covariates, methods of dietary assessment and HR or RR with their 95 % CI for mortality of all cancers, CVD and all causes.
Quality assessment was conducted according to the Newcastle–Ottawa criteria for non-randomised studies( Reference Wells, Wells and O’Connell 27 ). A maximum of 9 points was assigned to each study: 4 for selection, 2 for comparability and 3 for assessment of outcomes for cohort study. Comparability was assessed based on the adjustment of age and BMI; 10 years or above was considered to be the adequate length of follow-up, and 80 % response rate was considered to be adequate. We regarded scores of 0–3, 4–6 and 7–9 as low, moderate and high quality, respectively.
Statistical analysis
RR was considered as the common risk estimate for the associations between tea consumption and mortality. HR was treated as RR directly. RR from each study was transformed to its natural logarithm, and the 95 % CI was used to calculate the corresponding standard error. As different studies might report different exposure categories, we used the study-specific RR for the highest v. lowest category of tea consumption in this meta-analysis. Dersimonian and Laird random-effects model, which takes variation both within and between studies into consideration, was used to combine the RR and they were weighted by the inverse of their variance.
Dose–response analysis was carried out according to Greenland and Longnecker( Reference Greenland and Longnecker 28 ) and Orsini et al.( Reference Orsini, Bellocco and Greenland 29 ), which estimates study-specific slope and 95 % CI from the natural logs of the RR estimates and CI across categories of tea consumption. According to this method, amount of tea consumption, RR, 95 % CI and distribution of cases and person-years/non-cases in each included study should be extracted for the trend estimation using generalised least squares regression. For studies that did not provide the number of cases or person-years/non-cases, slopes were estimated using variance-weighted least squares regression. For studies conducted in Western countries that did not describe the type of tea, black tea was considered as the tea consumed, based on the fact that people living in these counties primarily consume black tea in daily life( Reference Mukhtar and Ahmad 30 ). Midpoint of the upper and lower boundaries was considered as the dose of each category when the study reported only the range of tea consumption. If the highest category was open-ended, we regarded it as of the same amplitude as the preceding one. The lowest boundary was set to 0 if the lowest category was open. We regarded 150 g tea beverages equivalent to one cup of tea. To estimate a potential non-linear association, we used a two-step random-effects model: tea consumption was modelled using restricted cubic splines with three knots at 10, 50 and 90 % of the distribution of tea consumption( Reference Harrell 31 ); a P value was then obtained by testing the null hypothesis that the regression coefficient of the second spline was equal to 0( Reference Orsini, Li and Wolk 32 ). Study-specific coefficient estimates were calculated using generalised least squares regression, and subsequently the regression coefficients of each study were pooled using the multivariate random-effects meta-regression model proposed by Jackson et al.( Reference Jackson, White and Thompson 33 ).
We assessed statistical heterogeneity with Q and I 2 statistics. I 2 values of 25, 50 and 75 % corresponded to cut-off points for low, moderate and high degrees of heterogeneity, respectively. Sub-group analysis was carried out to examine sources of study heterogeneity and the influence of potential confounding factors such as region, sex, duration of follow-up years, smoking status and study quality. Sensitivity analysis was carried out by excluding one study at a time and evaluating the effect of an individual study on the overall risk estimate. Begg’s funnel plot and Egger’s regression test (significant at P<0·05) were used to evaluate publication bias. All the analyses were carried out using STATA version 12.0 (StataCorp LP).
Results
Literature search and study characteristics
Fig. 1 represents the detailed selection process. Through full test examination of sixty-two potential publications, we identified eighteen eligible publications. Among them, six cohorts( Reference Klatsky, Armstrong and Friedman 8 , Reference Mukamal, Maclure and Muller 12 , Reference Andersen, Jacobs and Carlsen 16 , Reference Paganini-Hill, Kawas and Corrada 17 , Reference Zhang, Lopez-Garcia and Li 19 , Reference Gardener, Rundek and Wright 23 ) were from the USA, four cohorts( Reference Hertog, Sweetnam and Fehily 9 , Reference Bidel, Hu and Qiao 15 , Reference de Koning Gans, Uiterwaal and van der Schouw 20 , Reference Harris, Bergkvist and Wolk 22 ) were from Europe and eight cohorts( Reference Nakachi, Matsuyama and Miyake 10 , Reference Iwai, Ohshiro and Kurozawa 11 , Reference Khan, Goto and Kobayashi 13 , Reference Kuriyama, Shimazu and Ohmori 14 , Reference Suzuki, Yorifuji and Takao 18 , Reference Mineharu, Koizumi and Wada 21 , Reference Odegaard, Koh and Yuan 24 , Reference Saito, Inoue and Sawada 25 ) were from Asian countries. Eight cohorts( Reference Hertog, Sweetnam and Fehily 9 , Reference Iwai, Ohshiro and Kurozawa 11 , Reference Khan, Goto and Kobayashi 13 , Reference Kuriyama, Shimazu and Ohmori 14 , Reference Suzuki, Yorifuji and Takao 18 , Reference Gardener, Rundek and Wright 23 , Reference Odegaard, Koh and Yuan 24 , Reference Saito, Inoue and Sawada 25 ) involving 12 221 cases among 163 854 individuals described the association between tea consumption and all cancer mortality; ten cohorts( Reference Nakachi, Matsuyama and Miyake 10 , Reference Mukamal, Maclure and Muller 12 , Reference Kuriyama, Shimazu and Ohmori 14 – Reference Andersen, Jacobs and Carlsen 16 , Reference Suzuki, Yorifuji and Takao 18 , Reference Zhang, Lopez-Garcia and Li 19 , Reference Mineharu, Koizumi and Wada 21 , Reference Gardener, Rundek and Wright 23 , Reference Odegaard, Koh and Yuan 24 ) involving 11 306 cases among 240 637 individuals described the association between tea consumption and CVD mortality; fifteen cohorts( Reference Klatsky, Armstrong and Friedman 8 , Reference Hertog, Sweetnam and Fehily 9 , Reference Iwai, Ohshiro and Kurozawa 11 , Reference Mukamal, Maclure and Muller 12 , Reference Kuriyama, Shimazu and Ohmori 14 – Reference de Koning Gans, Uiterwaal and van der Schouw 20 , Reference Harris, Bergkvist and Wolk 22 , Reference Gardener, Rundek and Wright 23 – Reference Saito, Inoue and Sawada 25 ) involving 55 528 cases among 440 297 individuals reported the association between tea consumption and all-cause mortality.
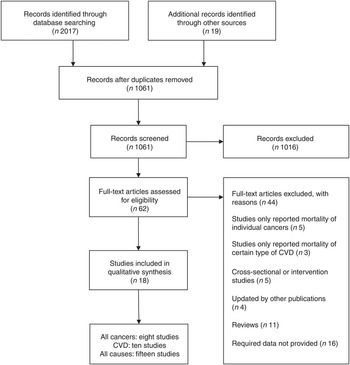
Fig. 1. Flow diagram for the selection of studies in the meta-analysis.
The main characteristics of the studies included in the meta-analysis are summarised in online Supplementary Table S1. The duration of follow-up ranged from 3 to 28 years. The average score for quality assessment of the included studies was 6·1, and all the studies scored 4 or above (online Supplementary Table S2).
Tea consumption and all cancer mortality
Among the eight studies investigating associations between tea consumption and all cancer mortality, two studies( Reference Khan, Goto and Kobayashi 13 , Reference Odegaard, Koh and Yuan 24 ) reported the RR for green tea and black tea consumption; thus, six sets of data for green tea consumption and four sets of data for black tea consumption were used. For the highest v. lowest categories of green tea and black tea consumption, the pooled RR of all cancer mortality were 1·06 (95 % CI 0·98, 1·15; I 2=0·0 %, P=0·827) and 0·79 (95 % CI 0·65, 0·97; I 2=14·3 %, P=0·321), respectively (Fig. 2).
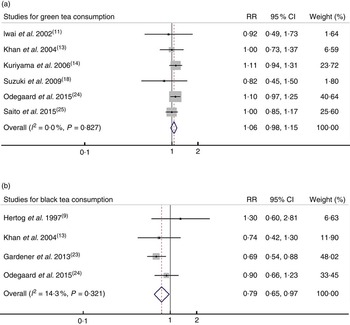
Fig. 2. Relative risk (RR) of all cancer mortality for highest v. lowest category of (a) green tea consumption and (b) black tea consumption. Random-effects model was used to obtain the overall RR. The grey square stands for study-specific RR with the square size reflecting the corresponding weight and horizontal bars reflecting 95 % CI.
In the dose–response analysis for the association between tea consumption and all cancer mortality, one article( Reference Khan, Goto and Kobayashi 13 ) was excluded because it did not report the detailed dose for each category of tea consumption. The pooled RR for one cup per d increment of green tea and black tea consumption were 1·01 (95 % CI 0·99, 1·02) and 0·98 (95 % 0·86, 1·10), respectively (online Supplementary Fig. S1). No significant dose–response association was observed for either green tea or black tea consumption with all cancer mortality.
Tea consumption and CVD mortality
Among the ten studies investigating associations between tea consumption and CVD mortality, two studies( Reference Mineharu, Koizumi and Wada 21 , Reference Odegaard, Koh and Yuan 24 ) reported the RR for green tea and black tea consumption; thus, five sets of data for green tea consumption and seven sets of data for black tea consumption were used. For the highest v. lowest categories of green tea and black tea consumption, the pooled RR of CVD mortality were 0·67 (95 % CI 0·46, 0·97; I 2=85·3 %, P<0·001) and 0·88 (95 % CI 0·77, 1·01; I 2=43·6, P=0·101), respectively (Fig. 3).
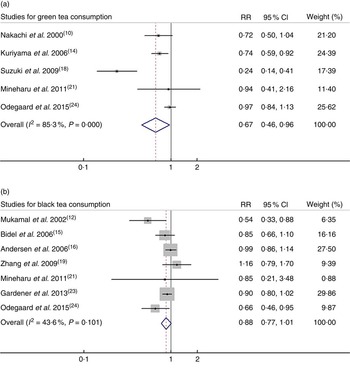
Fig. 3. Relative risk (RR) of CVD mortality for highest v. lowest category of (a) green tea consumption and (b) black tea consumption. Random-effects model was used to obtain the overall RR. The grey square stands for study-specific RR with the square size reflecting the corresponding weight and horizontal bars reflecting 95 % CI.
The dose–response analysis indicated that one cup per d increment of green tea consumption was associated with 5 % lower risk of CVD mortality (RR=0·95; 95 % CI 0·90, 0·99), and one cup per d increment of black tea consumption was associated with 8 % lower risk of CVD mortality (RR=0·92; 95 % CI 0·85, 0·99) (online Supplementary Fig. S2).
Tea consumption and all-cause mortality
Among the fifteen studies investigating associations between tea consumption and all-cause mortality, two studies( Reference Kuriyama, Shimazu and Ohmori 14 , Reference Odegaard, Koh and Yuan 24 ) reported the RR for green tea and black tea consumption; thus, five sets of data for green tea consumption and twelve sets of data for black tea consumption were used separately. For the highest v. lowest categories of green tea and black tea consumption, the pooled RR of all-cause mortality were 0·80 (95 % CI 0·68, 0·93; I 2=88·7 %, P<0·001) and 0·90 (95 % CI 0·83, 0·98; I 2=63·7 %, P=0·001), respectively (Fig. 4).
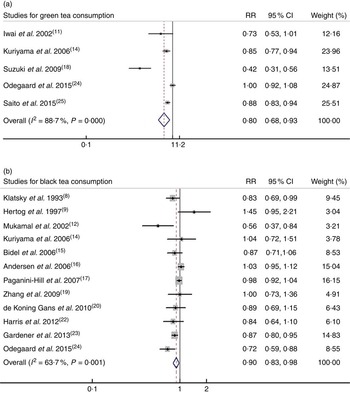
Fig. 4. Relative risk (RR) of all-cause mortality for highest v. lowest category of (a) green tea consumption and (b) black tea consumption. Random-effects model was used to obtain the overall relative risk. The grey square stands for study-specific relative risk with the square size reflecting the corresponding weight and horizontal bars reflecting 95 % CI.
The dose–response analysis indicated that one cup per d increment of green tea consumption was associated with 4 % lower risk of all-cause mortality (RR=0·96; 95 % CI 0·94, 0·98), and one cup per d increment of black tea consumption was associated with 3 % lower risk of all-cause mortality (RR=0·97; 95 % CI 0·94, 0·99) (online Supplementary Fig. S3).
Non-linear associations
No significant non-linear associations were observed for tea consumption with mortality of all cancers and CVD (online Supplementary Fig. S4). However, green tea and black tea consumption both demonstrated a significant non-linear association with all-cause mortality (P=0·009 and P<0·001, respectively) (Fig. 5). The slope of the relationship between black tea consumption and all-cause mortality was roughly U-shaped.
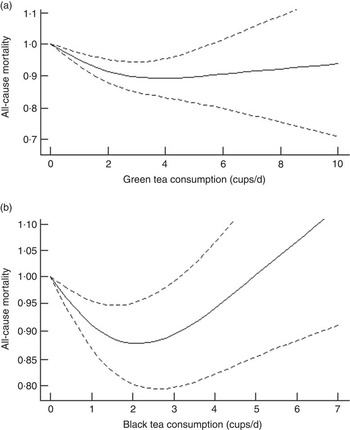
Fig. 5. Dose–response analysis for non-linear associations between tea consumption and all-cause mortality: (a) green tea consumption; (b) black tea consumption.
Assessment of publication bias
Begg’s funnel plot with 95 % CI limits was presented for visual inspection (online Supplementary Fig. S5). Publication bias was found only in the meta-analysis of associations between green tea consumption and all-cause mortality; however, after the trim and fill method was adopted, the pooled RR and corresponding 95 % CI remained stable.
Sub-group analysis
Table 1 represents the detailed results of the sub-group analyses.
Table 1 Sub-group analyses of green tea and black tea consumption with mortality of all cancers, CVD and all causes (highest v. lowest category)Footnote *(Number of cohorts, relative risk and 95 % confidence intervals)

* A random-effects model was used to obtain the overall relative risk of each sub-group.
For all cancer mortality, sub-group analyses did not show any substantial change in the summary RR for green tea consumption. Black tea consumption, however, was inversely associated with all cancer mortality only in studies with covariate adjustment for smoking. In addition, the inverse association between black tea consumption and all cancer mortality was only found in studies with a higher quality (≥7).
For CVD mortality, the sub-group analyses indicated that for green tea consumption the inverse association was observed only in studies with adjustment for smoking, and the inverse association was more evident in women compared with men. For the association between black tea consumption and CVD mortality, the sub-group analysis indicated that the inverse association was observed only in studies conducted in Asian countries.
The inverse association between green tea consumption and all-cause mortality was observed only in studies with adjustment for smoking. Black tea consumption was inversely associated with all-cause mortality only in studies conducted in Western countries.
Discussion
To the best of our knowledge, the present meta-analysis was the first quantitative systematic analysis that investigated the relationship between tea (black and green) consumption and mortality of all cancers, CVD and all causes. Green tea consumption was inversely associated with mortality of CVD and all causes, whereas black tea consumption was inversely associated with mortality of all cancers and all causes.
Tea consumption and all cancer mortality
Polyphenols are believed to be the main functional components in tea. Catechins including epigallocatechin-3-gallate (EGCG), epicatechin-3-gallate, epigallocatechin and epicatechin are the most abundant polyphenolic components of green tea( Reference Graham 34 ). Catechins in black tea are not as abundant as in green tea, but black tea contains more dimeric flavanols and polymeric polyphenols known as theaflavins (TF) and thearubigins (TR)( Reference Halder, Pramanick and Mukhopadhyay 35 ). According to previous studies, catechins, especially EGCG, can inhibit DNA damage and tumour promotion through their antioxidant activity in in vitro cell cultures( Reference Anderson, Fisher and Hara 36 ). Animal studies have also confirmed similar results( Reference Lu, Liao and Yang 37 , Reference Srivastava, Singh and Roy 38 ). Black tea and black tea constituents, although less well studied, have also been proven to have inhibitory effects against cancer( Reference Yang, Liu and Seril 39 – Reference Patel and Maru 41 ).
However, the present study suggested that black tea consumption was inversely associated with all cancer mortality, whereas green tea consumption was not. The different effects of green tea and black tea consumption on all cancer mortality may be attributed to other confounding factors such as area and dietary habits, rather than the different components in tea. In this meta-analysis, for green tea consumption with all cancer mortality, all the studies were conducted in Asia, especially in Japan, and studies for black tea consumption with all cancer mortality were conducted in both Western countries and Asian countries. The sub-group analysis indicated that in Asia green tea and black tea consumption both had no association with all cancer mortality. One possible explanation for this phenomenon could be attributed to the dietary habits in Asian countries. Several studies have confirmed that drinking hot tea may increase the risk or mortality of cancer( Reference Kinjo, Cui and Akiba 42 – Reference Tang, Xu and Zhang 44 ), and in Asian countries, especially in China, mortality due to oesophageal cancer were far higher compared with other countries, and drinking hot tea was believed to be one of the risk factors( Reference Yuwei 45 ). To some extent, drinking hot tea may balance out the benefits of the functional components in tea. Moreover, in these areas, people tend to drink high concentrations of green tea and they are often heavy smokers or alcohol drinkers. The smoking and drinking habit may offset the protective effect of drinking tea on cancer( Reference Mao, Jia and Zhou 43 ). The sub-group analysis also proved the discrepancy between studies with and without covariate adjustment for smoking.
The number of studies regarding the association between black tea consumption and all cancer mortality was limited; therefore, more prospective studies are warranted, especially studies of black tea consumption in Asian countries and of green tea consumption in Western countries.
Tea consumption and CVD mortality
As described above, the protective effects of tea against CVD could be attributed to antioxidant components such as catechins. Evidence has shown that the oxidisation of LDL can cause atherosclerosis, which could eventually increase the risk or mortality of CVD. Tea and its antioxidant compounds could effectively reduce the oxidisation of LDL( Reference Tardy, Benghuzzi and Tucci 46 ); therefore, it is reasonable to conclude that tea consumption, especially green tea consumption, could decrease the risk of CVD.
However, in this meta-analysis, we found that unlike green tea black tea consumption had no significant association with CVD mortality. One possible explanation was that, as described previously, black tea contains less catechins than green tea. The main components of black tea are TF and TR; thus, the antioxidant activity of black tea is not as significant as that of green tea( Reference Pękal, Dróżdż and Biesaga 47 ), which could explain the different protective effects of green tea and black tea consumption against CVD. In addition, studies on black tea consumption and CVD mortality were mainly conducted in Western countries, and studies on green tea consumption and CVD mortality were all conducted in Asian countries; therefore, race, genetic factors and lifestyle could be potential factors that contributed to the different results
The sub-group analysis indicated that the inverse association of tea consumption with CVD mortality was more evident in women than in men. One single study( Reference Nakamura, Nagata and Wada 48 ) also found the same phenomenon; they postulated that men tend to smoke more compared with women, and thus it might mask the beneficial association of green tea consumption. Cheng( Reference Cheng 49 ) summarised that the functional components of green tea that have cardioprotective actions were not only flavonoids but also oestrogens and phyto-oestrogens. Oestrogen-related mechanisms could be another explanation for the stronger inverse association between tea drinking and cardiovascular mortality in women compared with men.
Heterogeneity substantially reduced among studies with longer follow-up duration (≥10 years); thus, years of follow-up could be one factor that could cause heterogeneity between studies. Furthermore, the number of studies regarding the association between tea consumption and CVD mortality was limited; therefore, more studies are warranted for further analysis.
Tea consumption and all-cause mortality
For all-cause mortality, high degree and moderate degree of heterogeneity were observed between studies for green tea and black tea consumption, respectively. For green tea consumption, sensitivity analysis indicated that the heterogeneity vanished among studies with a high quality (≥7). For black tea consumption, heterogeneity substantially reduced in sub-groups for men or women, but still remained moderate in sub-groups for both sexes. Therefore, study quality and sex could be two confounding factors leading to heterogeneity between studies. However, sources of heterogeneity between these studies were still not clear and warrant further investigation.
The dose–response analysis for non-linear association suggested that the maximum reduction in all-cause mortality was observed at two to three cups of tea per d, whereas under a high degree of tea consumption (more than five cups per d), the reason why associations became null or positive is still not very clear. Based on the current evidence, we can still conclude that two cups of tea, whether green or black tea, have a beneficial effect on health.
Strengths and limitations
The present meta-analysis has several strengths. First, the large sample size makes it reliable to assess the association between tea consumption and mortality of all cancers, CVD and all causes, and the results of the present study appear to be more powerful than any individual study. Second, the prospective nature of the included studies avoided the influence of recall and selection bias. Third, we systematically reviewed and assessed the summarised association between mortality due to different causes and different types of tea, including green tea and black tea. These data provide the most comprehensive view of the association between tea consumption and mortality of all cancers, CVD and all causes, based on the current evidence.
This meta-analysis also has several limitations. First, available data from studies for black tea consumption in Asian countries and studies for green tea consumption conducted in Western countries are rather limited. Therefore, more prospective studies are needed for further detailed analysis. Second, we did not differentiate between the different types of CVD and cancer, because the number of included cohorts was limited. Third, the observational nature of the included studies makes it subject to the influence of residual confounders. In addition, all the studies included in this meta-analysis were in English, thus possible language bias could occur.
Conclusions
The present systematic review and meta-analysis indicated that green tea consumption was inversely associated with CVD and all-cause mortality, but not associated with all cancer mortality. On the other hand, black tea consumption was found to be inversely associated with all cancer and all-cause mortality, but not associated with CVD mortality. The inverse association between green tea consumption and CVD mortality was more evident in women than in men; however, the reason is unknown and requires further research. Finally, more studies on different types of tea consumption within Asian and Western countries are warranted.
Acknowledgements
We thank Dr Andrew J. Sinclair at the School of Medicine, Deakin University, Victoria, Australia for helping to revise this manuscript.
This study was funded by National Natural Science Foundation of China (NSFC No. 81273054); by the PhD Programs Foundation of Ministry of Education of China (20120101110107); and by the National Basic Research Program of China (973 Program: 2011CB504002). The funder had no role in the study design, data collection and analysis, decision to publish or preparation of the manuscript.
J. T. and J. Z. were responsible for the study concept and design; J. T. and J. Z. acquired the data; J. T., J. Z., L. F., Y. J. and W. C. analysed and interpreted the data; all the authors contributed to the manuscript drafting. J. T., J. Z. and D. L. were responsible for the critical revision of the manuscript for important intellectual content; J. T., J. Z. and W. C. carried out the statistical analysis; and D. L. obtained the funding and was responsible for the study supervision.
There are no conflicts of interest.
Supplementary Material
To view supplementary material for this article, please visit http://dx.doi.org/10.1017/S0007114515002329


