Nicotinamide, the amide of nicotinic acid, is required for the synthesis of NAD and NADP, the cofactors in many redox reactions in cellular metabolism(Reference Kirkland1). Nicotinamide and nicotinic acid (collectively called niacin) can be obtained from the diet or synthesised from tryptophan in the body(2); therefore, in an absolute sense, niacin is not a vitamin(Reference Renwick3), although it is classified as a member of the B group of vitamins. Excessive intake of nicotinamide is very common in the general population primarily due to widespread niacin fortification and the use of nicotinamide supplements in foods. For example, the per capita niacin consumption in the USA has been doubled since the implementation of mandatory niacin fortification in the early 1940s(Reference Zhou, Li and Zhou4). Recent evidence has shown a strong correlation between US per capita niacin consumption and the increased prevalence of obesity and type 2 diabetes(Reference Zhou, Li and Zhou4, Reference Li, Sun and Zhou5). Notably, the levels of nicotinamide as well as other vitamins in infant formulas are usually several times higher than those in breast milk or even higher in formulas for preterm and low-body-weight infants(Reference Zhou, Zhou and Li6). For example, the level of nicotinamide in some preterm formulas on the US market is 1195 μg/100 kJ (or 5000 μg/100 kcal) (e.g. see http://abbottnutrition.com/brands/products/similac-special-care-20-with-iron), which is twenty times higher than the lower limit set by US law (60 μg/100 kJ (or 250 μg/100 kcal)(7), which is about the level in breast milk). It is worth noting that there is evidence that links formula feeding to later obesity(Reference Arenz, Rückerl and Koletzko8, Reference Harder, Bergmann and Kallischnigg9). Given that nicotinamide can induce insulin resistance(Reference Li, Sun and Zhou5, Reference Greenbaum, Kahn and Palmer10), a hallmark of obesity and type 2 diabetes, it is possible that excess nicotinamide intake may contribute to the development of the diseases.
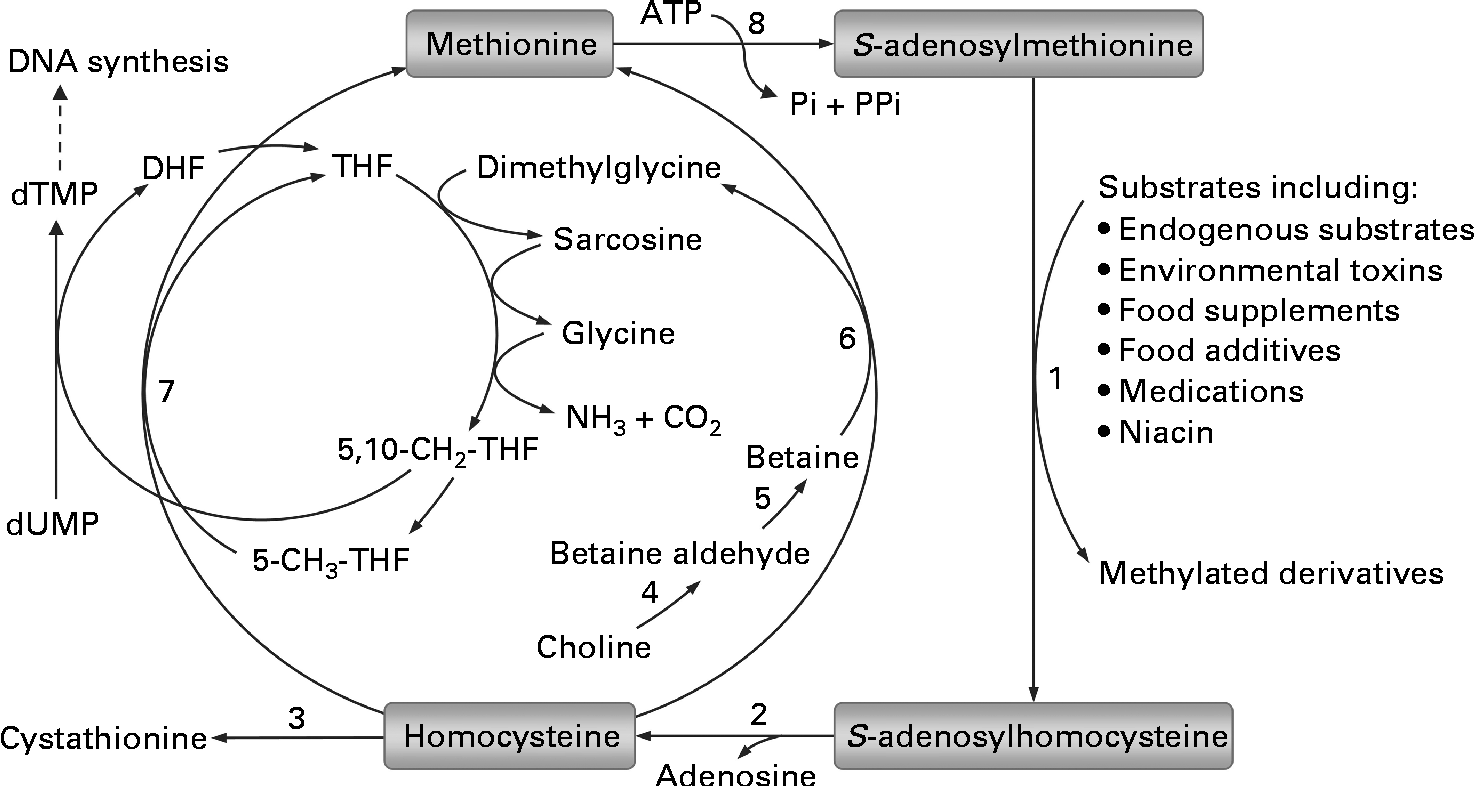
Epigenetic changes are biochemical modifications that can modify the activation of certain genes, but not the sequence of DNA. The only known epigenetic modification of DNA in mammals is the methylation of cytosine at position C5 in cytosine-phosphate-guanine (CpG) dinucleotides. Increasing evidence suggests that aberrant DNA methylation may play an important role in many human diseases, including obesity and type 2 diabetes(Reference Robertson11, Reference Drong, Lindgren and McCarthy12). Because adequate methyl groups are prerequisite for DNA methylation, one of the most common factors responsible for aberrant DNA methylation may be related to methyl-group status(Reference Zhou, Zhou and Li13). As shown in Fig. 1, all of the S-adenosylmethionine-dependent methylation of exogenous and endogenous substrates shares the same methyl-group pool. In humans, excess nicotinamide has long been known to be degraded mainly through S-adenosylmethionine-dependent methylation catalysed by nicotinamide N-methyltransferase(Reference Mrochek, Jolley and Young14). Obviously, excess nicotinamide intake will increase the consumption of limited labile methyl-group resources and may thus affect other S-adenosylmethionine-dependent methylation reactions, presumably including DNA methylation. To date, little is known about the effect of long-term excess nicotinamide intake on DNA methylation, although nicotinamide has been used to fortify foods for many decades. To provide further insight into the relationship between high nicotinamide intake and insulin resistance-related metabolic abnormalities, the objective of the present study was to address the effects of nicotinamide on the methyl-donor status, oxidative tissue damage and glucose tolerance and their relationship with DNA methylation-mediated epigenetic changes in developing rats.

Fig. 1 Methionine–homocysteine cycle and methylation of substrates. In the cycle, methionine is activated by condensation with ATP to give the ubiquitous methyl donor S-adenosylmethionine. S-adenosylmethionine is converted to S-adenosylhomocysteine after donating its methyl group to a substrate and then further hydrolysed to homocysteine and adenosine. Homocysteine is either remethylated to methionine via the betaine-dependent or folate-dependent pathway or converted to cystathionine. 1, S-adenosylmethionine-dependent methyltransferases; 2, adenosylhomocysteinase; 3, cystathionine β-synthase; 4, choline dehydrogenase; 5, betaine-aldehyde dehydrogenase; 6, betaine–homocysteine methyltransferase; 7, methionine synthase; 8, methionine adenosyltransferase. DHF, dihydrofolate; THF, tetrahydrofolate; dTMP, deoxythymidine monophosphate; dUMP, deoxyuridine monophosphate.
Materials and methods
Animal model, glucose tolerance test and sample collection
All experiments were conducted according to the NIH Guide for Care and Use of Laboratory Animals, and all experimental procedures involving animals were approved by the Animal Care and Use Committee of Dalian University. Male Sprague–Dawley rats (4 weeks old) were purchased from the Dalian Medical University Animal Centre. The rats were housed under standard laboratory conditions (22 ± 2°C and a 12 h light–12 h dark cycle with lights on from 06.00 to 18.00 hours) and given access to food and water ad libitum. After 1 week of acclimatisation, the rats were divided randomly into three groups (each, n 10) and fed ad libitum with a control diet or diets supplemented with 1 or 4 g/kg of nicotinamide (Sigma) for 8 weeks. Body weights were recorded weekly. A glucose tolerance test was performed by injection of glucose (2 g/kg body weight, intraperitoneally) after an overnight fast at the end of the 7th week. Tail blood glucose was measured using a glucometer (OneTouch Ultra; LifeScan, Inc.). Serum insulin levels (using tail blood samples) were determined with ELISA (Rat/Mouse Insulin Kit; Millipore). At the end of week 8, fasting blood was collected by eye bleed into EDTA tubes under anaesthesia (urethane, 1·5 g/kg body weight, intraperitoneally). Plasma was separated by centrifugation (1500 g, 10 min). Immediately after blood collection, the rats were killed by decapitation. The liver and kidney were removed. Samples of plasma and liver were plunged directly into liquid N2 and subsequently stored at − 80°C until assay. Histological samples of liver and kidney were kept in Bouin's solution until assay.
Measurement of N1-methylnicotinamide, homocysteine and betaine levels
HPLC was used to measure plasma nicotinamide, N 1-methylnicotinamide, homocysteine and betaine levels. The HPLC system consisted of an LC-9A pump (Shimadzu), a Rheodyne 7725i sample injector with a 20 μl sample loop (Rheodyne LLC) and a Hypersil ODS C18 column (Thermo) with a Waters 470 fluorescence detector (Waters) for the analysis of plasma nicotinamide N 1-methylnicotinamide and homocysteine levels and a Supelcosil™ LC-SCX column (Supelco) with a UV3000 detector (Thermo Separations Products) for the detection of betaine. The whole process of chromatography was performed at room temperature. Details of the analytical methods have been described previously(Reference Sun, Li and Lun15).
Measurement of choline levels
Plasma concentrations of choline were measured using a choline/acetylcholine quantification kit (Biovision) following instructions from the manufacturer. The absorbance of each plate was measured at 570 nm using a Bio-Rad model 550 microplate reader (Bio-Rad Company).
Immunohistochemistry for 8-hydroxy-2’-deoxyguanosine
Liver and kidney sections fixed in Bouin's solution were used for immunohistochemical assessment of 8-hydroxy-2′-deoxyguanosine (8-OHdG). After deparaffinisation, the sections were pre-treated with 0·3 % H2O2 in methanol for 30 min, 0·05 m-NaOH in 40 % ethanol for 15 min and 250 μg/ml of RNase A for 60 min at 37°C. The sections were sequentially incubated with 10 % goat blocking serum for 40 min to block the background staining before incubation with diluted anti-8-OHdG antibody overnight (10 μg/ml; Japan Institute for the Control of Aging). Immunoreactivity was detected by the Elivision™ plus Method (Maixin) with colour development using 3,3’-diaminobenzidine. The sections were counterstained with Mayer's haematoxylin for 40 s. The percentage of 8-OHdG-positive cells was determined in three randomly selected fields per slide (400 × ) using the NIS-Elements 3.0 Software (Nikon).
Genomic DNA methylation assay
Genomic DNA methylation was measured as described by Ramsahoye(Reference Ramsahoye16). Briefly, genomic DNA of the liver samples was extracted using a high-salt method. Contaminating RNA was removed by incubation with RNase A (100 μg/ml) and RNase T1 (2000 unit/ml) for 2 h at 37°C. Following the incubation, DNA was phenol–chloroform–isoamyl alcohol extracted and ethanol precipitated, resuspended in 100 μl of DNase I digestion buffer (10 mm-Tris–HCl, pH 7·2, 0·1 mm-EDTA and 4 mm-MgCl2) and digested using DNase I (50 μg/ml) for 14 h at 37°C. DNA was further digested using Nuclease P1 (50 μg/ml) for 7 h at 37°C in the presence of two volumes of 30 mm-sodium acetate (pH 5·2) and 1 mm-zinc sulphate. Solid debris was removed by centrifugation using a spin column with a 0·45 μm filter. Hydrolysed DNA was analysed for cytosine methylation content by HPLC using a Hypersil ODS C18 column (Thermo) with a mobile phase consisting of 50 mm-ammonium orthophosphate (pH 4·1) at a flow rate of 1 ml/min, and UV detection was performed at 278 nm. The amount of DNA cytosine methylation was calculated by the following formula: methylated cytosines/total cytosines in DNA × 100 (%). All reagents were purchased from Sigma.
Measurement of uracil levels in DNA
Uracil levels in DNA were determined as described by Blount & Ames(Reference Blount and Ames17). Briefly, genomic DNA of the liver samples was extracted using a high-salt method. After extraction, 50 μg of DNA were treated with two units of uracil DNA glycosylase in Tris-EDTA buffer at 37°C for 1 h. After incubation, 100 pg [15N2]uracil was added as an internal standard, and the samples were dried in a speed vac concentrator. Uracil and the internal standard were derivatised by adding 50 μl acetonitrile, 10 μl triethylamine and 1 μl 3,5-bis(trifluoromethyl)benzyl bromide at 30°C for 25 min, followed by the addition of 50 μl of water; the derivative was extracted into 100 μl isooctane. GC–MS was used to measure the levels of uracil in DNA. GC–MS was carried out with an Agilent 6890/5973 system (Agilent). The injection port was maintained at 280°C. Separation was achieved using a Hewlett-Packard HP-5MS capillary column (30 m × 0·25 mm internal diameter × 0·25 μm film thickness; Agilent Technologies) by maintaining the oven at 100°C for 1 min and then ramped to 280°C at 25°C/min and held for 2 min. The GC–MS interface temperature was 300°C, and the derivatised uracil and internal standard were analysed by negative chemical ionisation MS with selected ion monitoring at m/z 337 and 339, respectively. All reagents were purchased from Sigma.
Promoter methylation analysis
Genomic DNA of the liver samples was extracted using a high-salt method. Bisulphite treatment of DNA was done using the EZ DNA Methylation-Direct Kit (Zymo Research) according to the manufacturer's protocol. PCR amplification was performed using the special Hot-Start DNA polymerase (Zymo Taq premix; Zymo Research) under the following reaction conditions: 95°C for 10 min and forty cycles of 95°C for 30 s, 56°C for 30 s and 72°C for 45 s, followed by an extension reaction at 72°C for 10 min. Primers were specifically designed to amplify the bisulphite-modified DNA, which are described in Table S1 (available online). The PCR fragment was ligated directly into the pMD18-T vector (Takara Biotechnology (Dalian) Company Limited), and the recombinant plasmid was transformed into JM109 cells (Takara Biotechnology (Dalian) Company Limited). Subsequently, ten positive clones of each sample were selected and sequenced on an ABI 3730 automated sequencer (Applied Biosystems).
Real-time quantitative PCR
Total RNA of the liver samples was extracted with TRIzol (Invitrogen) according to the manufacturer's protocol. Extracted RNA was reverse-transcribed in a 20 μl reaction with both oligo (dT) and random primers using the PrimeScript RT Master Mix (Takara Biotechnology (Dalian) Company Limited). The complementary DNA fragments were amplified using SYBR Premix Ex TaqTM II (Takara Biotechnology (Dalian) Company Limited) on an ABI Prism 7500 sequence detector (Applied Biosystems). Thermal cycling conditions consisted of an initial denaturation step at 95°C for 10 min and then forty cycles of 95°C for 10 s and 60°C for 20 s. The primer sequences are listed in Table S2 (available online). The housekeeping gene GAPDH was used as an internal control for the normalisation of each sample, each of which was run in triplicate. Relative mRNA expression levels were determined using the 2− ΔΔC t method.
Statistical analysis
Data are presented as means with their standard errors. Unless otherwise stated, all statistical comparisons were made using one-way ANOVA followed by Student's t test using SPSS version 11.5 software (SPSS Inc.). Differences were considered significant at P< 0·05.
Results
Nicotinamide supplementation-induced oxidative DNA damage
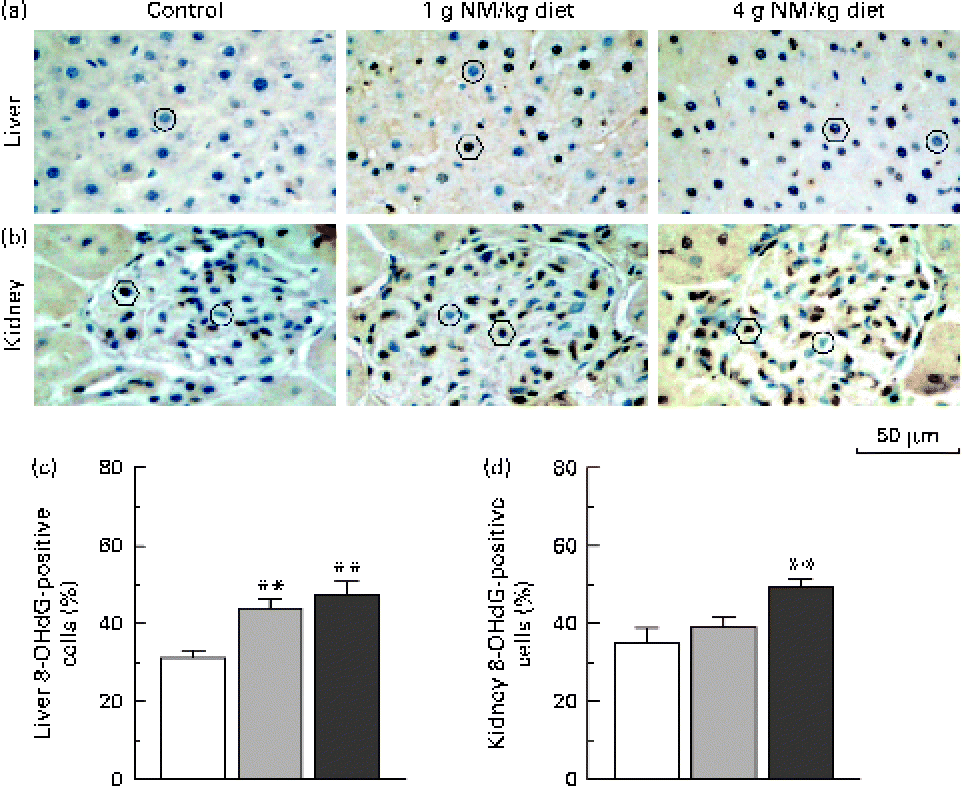
Fig. 2 shows the immunohistochemical detection of 8-OHdG, a representative marker of oxidative DNA damage(Reference Valavanidis, Vlachogianni and Fiotakis18), in hepatic and renal tissues. Nicotinamide supplementation induced a dose-dependent increase in the number of 8-OHdG-positive cells in the liver (Fig. 2(a) and (c)). Similar results were observed in the renal tissue (Fig. 2(b) and (d)).

Fig. 2 Immunostaining for 8-hydroxy-2′-deoxyguanosine (8-OHdG) in the liver and kidney. Representative sections of immunohistochemistry for 8-OHdG from the (a) liver and (b) kidney of rats fed with the control diet (left, □) or diets supplemented with nicotinamide (NM) at a dose of 1 g/kg diet (middle, ![]() ) or 4 g/kg diet (right,
) or 4 g/kg diet (right, ![]() ). ○, negative examples; ○, positive examples. Magnification is 400 × . Summary of the percentages of (c) 8-OHdG-positive hepatic cells and (d) kidney cells of control rats and two NM-treated groups (each group, n 10). Values are means, with their standard errors represented by vertical bars. ** Mean values were significantly different from that of the control diet (P< 0·001).
). ○, negative examples; ○, positive examples. Magnification is 400 × . Summary of the percentages of (c) 8-OHdG-positive hepatic cells and (d) kidney cells of control rats and two NM-treated groups (each group, n 10). Values are means, with their standard errors represented by vertical bars. ** Mean values were significantly different from that of the control diet (P< 0·001).
Nicotinamide-induced changes in methyl metabolism-related cofactors
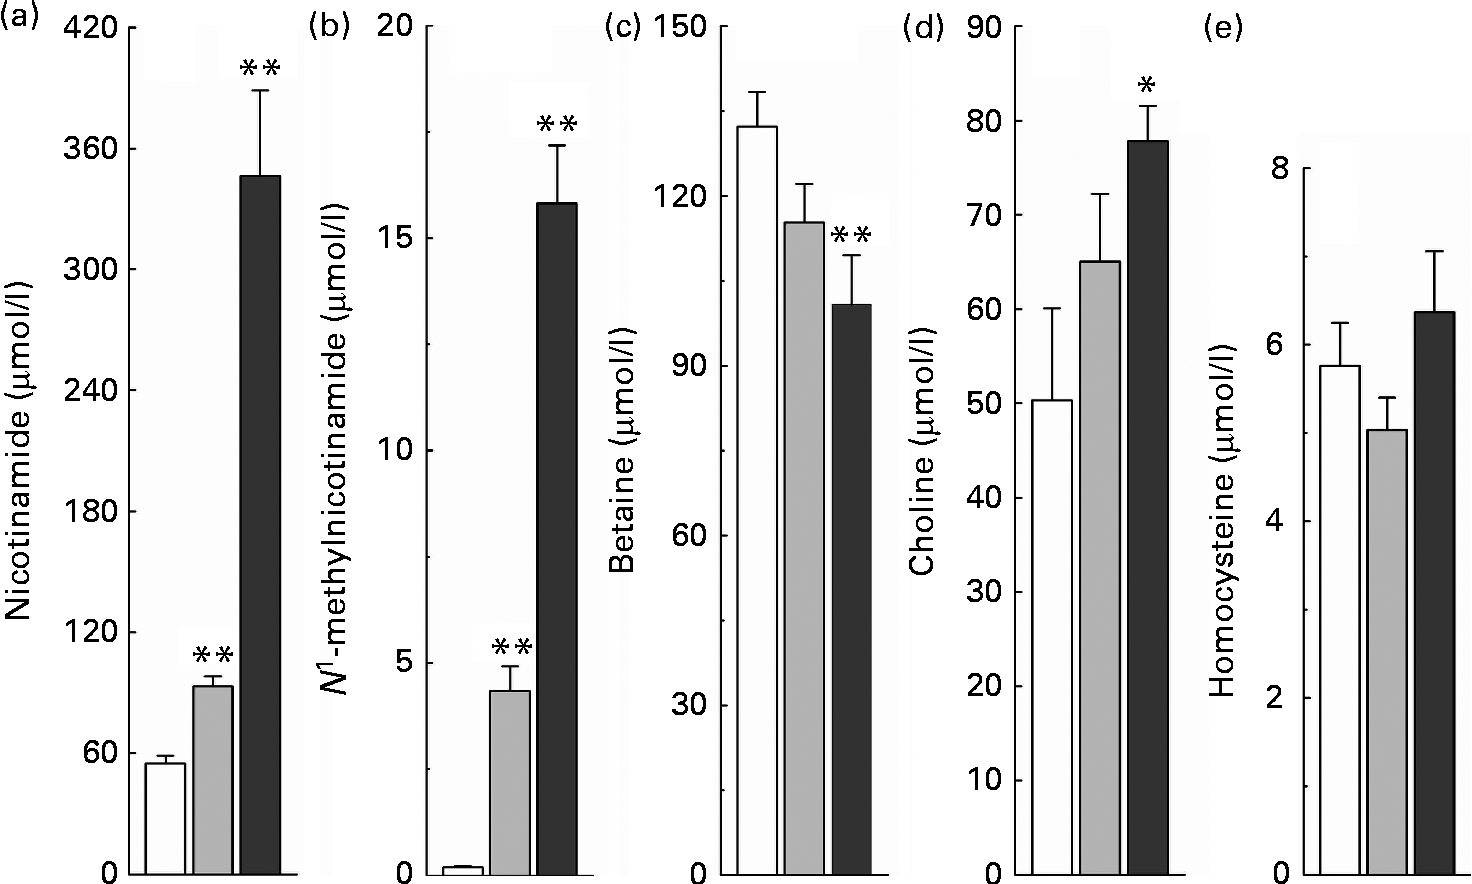
The relationship between high nicotinamide exposure and plasma levels of the major methyl donors (betaine and choline) and the methionine cycle intermediate, homocysteine, is shown in Fig. 3. Rats fed with the nicotinamide-supplemented diets exhibited a significant dose-dependent increase in the plasma levels of nicotinamide and N 1-methylnicotinamide, which was associated with lower plasma betaine levels but higher choline levels, compared with the control rats. Unexpectedly, when compared with the control group, there was a decrease rather than an increase in plasma homocysteine levels of the rats fed with the diet supplemented with 1 g/kg of nicotinamide, although there was no significant statistical difference between the two groups (P>0·05). Even when the content of nicotinamide in the diet was increased to 4 g/kg, which caused a dramatic increase in plasma N 1-methylnicotinamide levels, plasma homocysteine levels were only slightly increased compared with the control diet (P>0·05; Fig. 3(e)).

Fig. 3 Nicotinamide (NM) supplementation-induced changes in plasma levels of (a) NM, (b) N 1-methylnicotinamide, (c) betaine, (d) choline and (e) homocysteine. Values are means, with their standard errors represented by vertical bars. Mean values were significantly different from that of the control diet: * P< 0·05, ** P< 0·01. □, Control; ![]() , 1 g NM/kg diet;
, 1 g NM/kg diet; ![]() , 4 g NM/kg diet.
, 4 g NM/kg diet.
Impact of nicotinamide on hepatic global DNA methylation and DNA uracil content
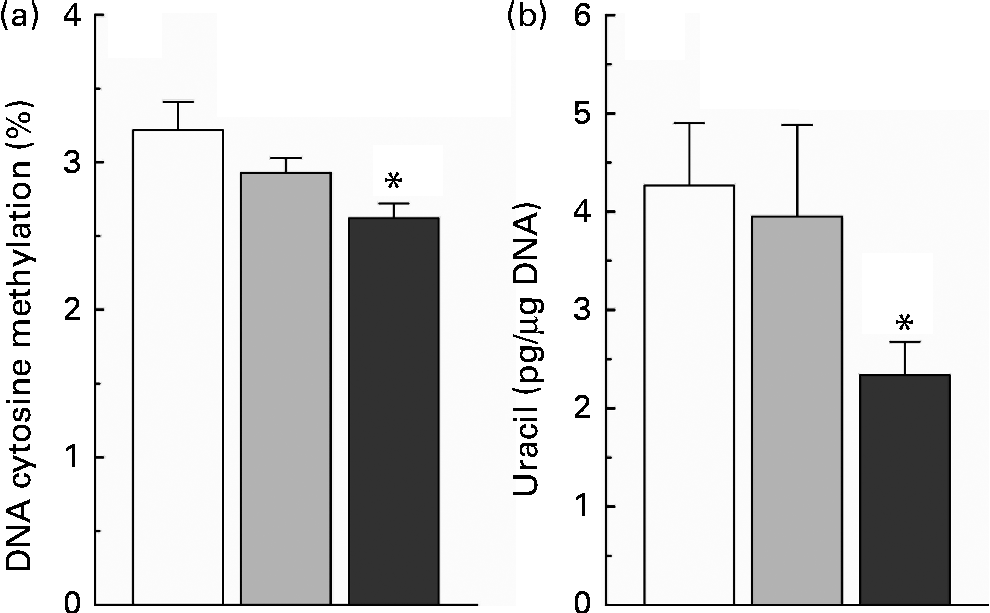
The present study found that nicotinamide induced a dose-dependent decrease in the level of global DNA methylation (Fig. 4(a)), and there was a significant statistical significance between the high-dose nicotinamide supplementation (4 g/kg diet) group and the control group (P< 0·05). Moreover, rats fed with the high-dose nicotinamide-supplemented diets exhibited a significant decrease in the content of uracil in genomic DNA in the liver compared with the control rats (Fig. 4(b)).

Fig. 4 (a) Hepatic global DNA methylation and (b) uracil content in hepatic nuclear DNA of rats fed with the control diet (□) or diets supplemented with 1 (![]() ) or 4 g/kg (
) or 4 g/kg (![]() ) of nicotinamide (each group, n 10). Values are means, with their standard errors represented by vertical bars. * Mean values were significantly different from that of the control diet (P< 0·05).
) of nicotinamide (each group, n 10). Values are means, with their standard errors represented by vertical bars. * Mean values were significantly different from that of the control diet (P< 0·05).
Gene-specific effects of nicotinamide
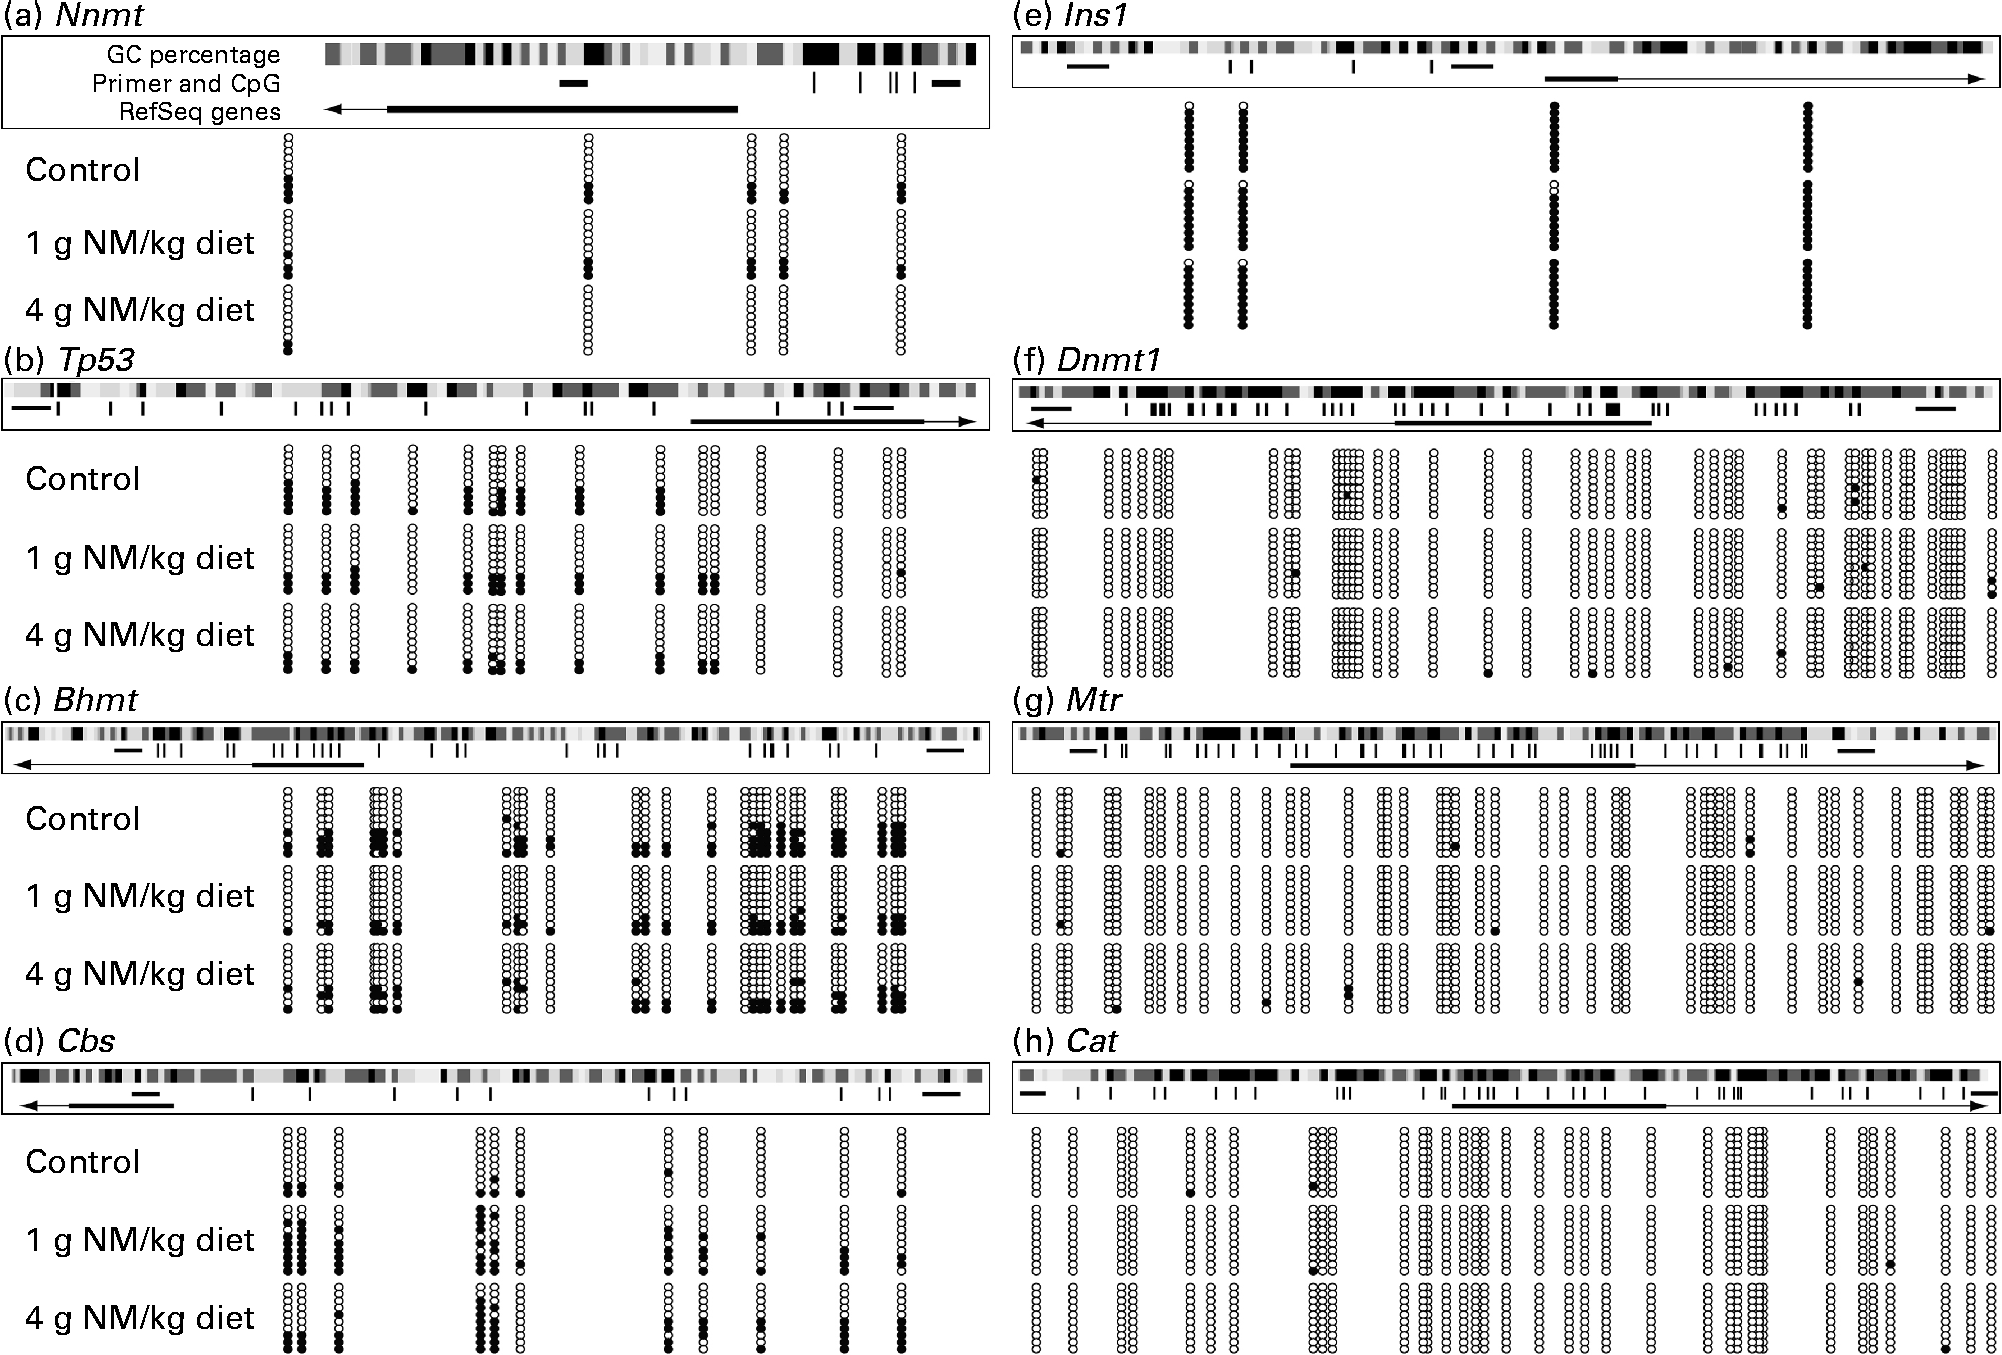
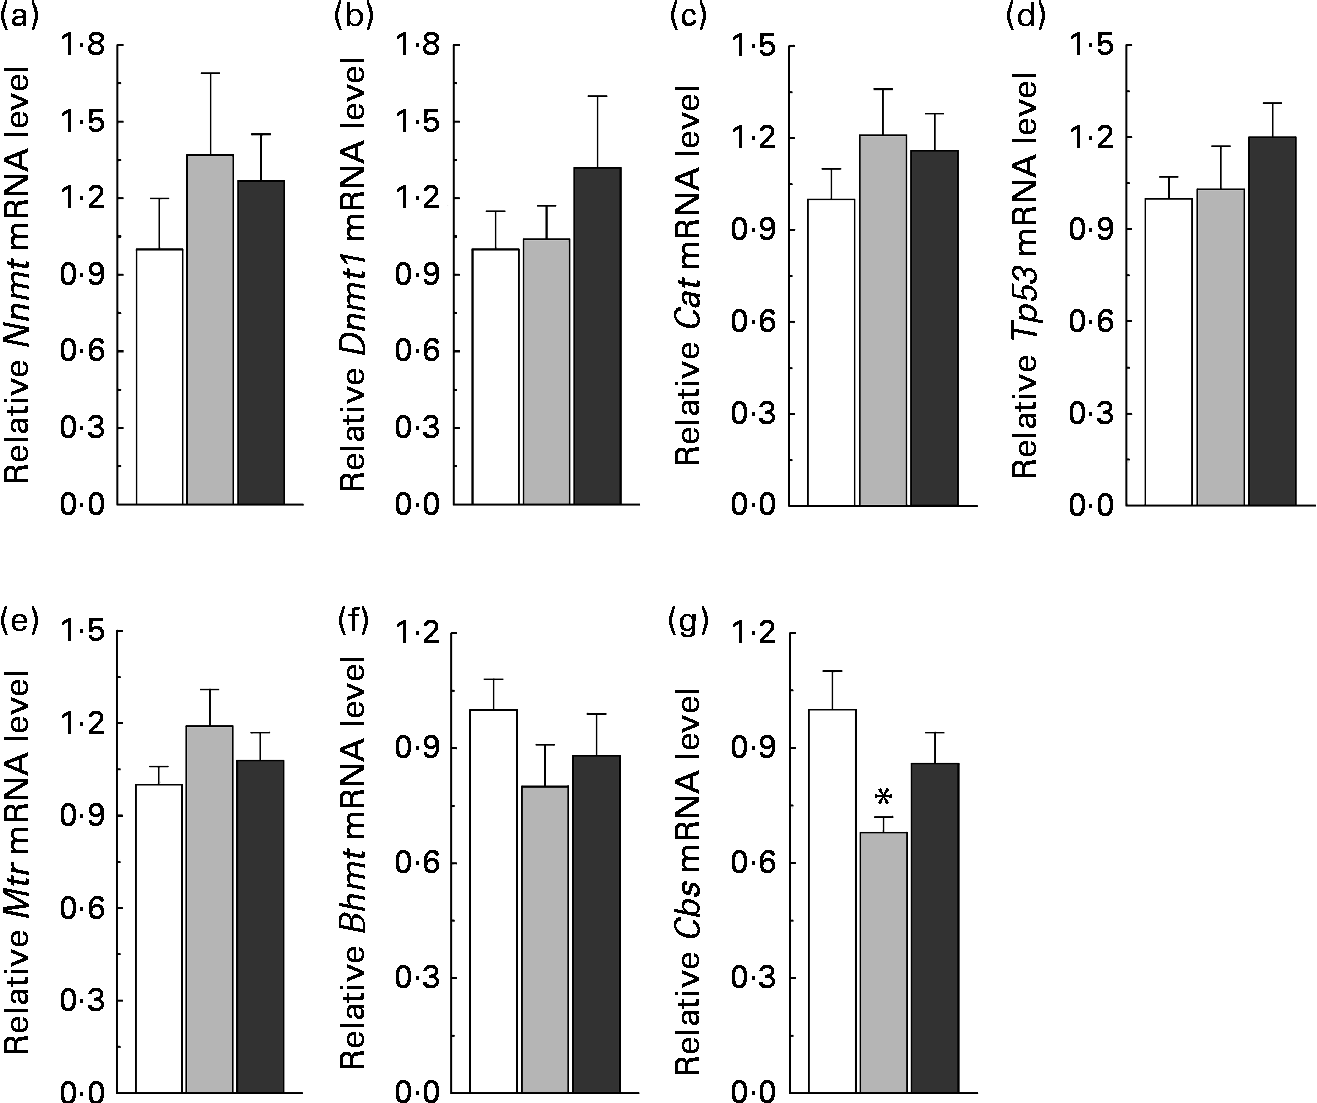
To understand the relationship between nicotinamide-induced metabolic disorders and epigenetic changes, we investigated the effects of nicotinamide on the methylation status of the promoter region of hepatic genes, including (1) homocysteine metabolism-related genes, betaine–homocysteine S-methyltransferase (Bhmt), methionine synthase (Mtr) and cystathionine β-synthase (Cbs), (2) methyltransferase genes, nicotinamide N-methyltransferase (Nnmt) and DNA methyltransferase 1 (Dnmt1) and (3) oxidative stress-related genes, catalase (Cat) and tumour protein p53 (Tp53, a gene involved in apoptosis(Reference Borrás, Gómez-Cabrera and Viña19)). Insulin-1 gene (Ins1), which is not expressed in the liver, was used as a control. The results showed that the methylation rate of CpG sites in the core promoter region was decreased in Nnmt, Tp53 and Bhmt (Fig. 5(a)–(c)), but increased in Cbs by nicotinamide supplementation (Fig. 5(d)). There were statistical differences in the methylation rate between the high-dose nicotinamide treatment (4 g/kg diet) group and the control group in Nnmt (P< 0·01, χ2 test; Fig. 5(a)) and between the nicotinamide treatment (1 and 4 g/kg diet) groups and the control group in Cbs (both P< 0·01, χ2 test; Fig. 5(d)). In contrast, the methylation rate of the CpG sites in the core promoter region of Ins1 (in hypermethylation status) and genes Dnmt1, Mtr and Cat (in hypomethylation status) was not affected by nicotinamide supplementation (Fig. 5(e)–(h)). Real-time PCR analysis showed a slightly increasing trend in the expression of Nnmt, Dnmt1, Cat, Tp53 and Mtr (all P>0·05 v. the control diet; Fig. 6(a)–(e)), but a slight decrease in the expression of Bhmt in the nicotinamide-treated groups (both P>0.05 v. control diet; Fig. 6(f)). There was a significant decrease in Cbs expression in the low-dose nicotinamide-treated group (P< 0·05 v. the control diet; Fig. 6(g)).

Fig. 5 Effects of nicotinamide (NM) on DNA methylation. (a)–(h) Methylation pattern in the core promoter region of hepatic genes in rats fed with the control diet or diets supplemented with 1 or 4 g/kg of NM. Location of the core promoter cytosine-phosphate-guanine (CpG) sites, along with primer-amplified fragments, guanine-cytosine (GC) percentage, individual CpG dinucleotides (dashes) and RefSeq gene (exon 1 shown as a box and intron shown as an arrowed line) according to the University of California, Santa Cruz, genome browser (Baylor 3.4/rn4 assembly). The arrows indicate transcriptional direction. The circles correspond to CpG sites denoted by black dashes: ●, methylated; ○, unmethylated. Nnmt, nicotinamide N-methyltransferase; Tp53, tumour protein p53; Bhmt, betaine–homocysteine S-methyltransferase; Cbs, cystathionine β-synthase; Ins1, insulin-1; Dnmt1, DNA methyltransferase 1; Mtr, methionine synthase; Cat, catalase.

Fig. 6 Nicotinamide (NM) supplementation-induced changes in hepatic gene expression. Relative mRNA levels were measured by real-time quantitative PCR (each group, n 10). Values are means, with their standard errors represented by vertical bars. (a) Nnmt, nicotinamide N-methyltransferase; (b) Dnmt1, DNA methyltransferase 1; (c) Cat, catalase; (d) Tp53, tumour protein p53; (e) Mtr, methionine synthase; (f) Bhmt, betaine–homocysteine S-methyltransferase; (g) Cbs, cystathionine β-synthase. □, Control; ![]() , 1 g NM/kg diet;
, 1 g NM/kg diet; ![]() , 4 g NM/kg diet.
, 4 g NM/kg diet.
Impact on weight gain and insulin sensitivity
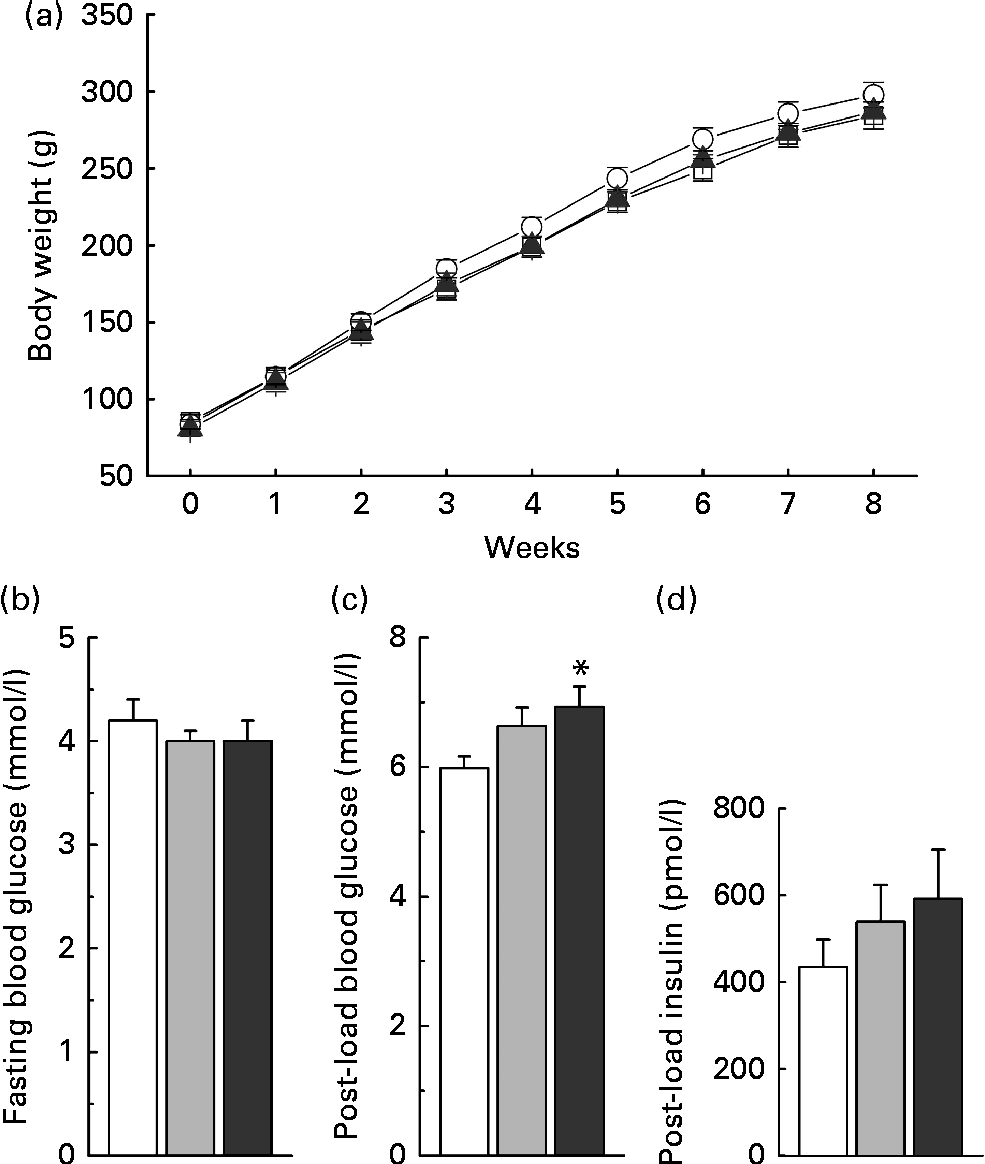
Low-dose nicotinamide supplementation (1 g/kg diet) slightly increased weight gain, while the high-dose one (4 g/kg diet) did not when compared with the control rats (Fig. 7(a)). The results of the glucose tolerance test showed an increase in blood glucose levels (Fig. 7(c)) associated with higher serum insulin levels in the nicotinamide-treated rats (Fig. 7(d)), while there was no significant difference in fasting blood glucose levels among the groups (Fig. 7(b)).

Fig. 7 Effects of nicotinamide (NM) on weight gain and glucose tolerance. (a) Changes in weight gain, (b) fasting blood glucose, (c) 1 h blood glucose after glucose load (2 g/kg body weight, intraperitoneally) and (d) 1 h post-load serum insulin. Each group, n 10. Values are means, with their standard errors represented by vertical bars. * Mean values were significantly different from that of the control diet (P< 0·05). (a) ![]() , Control;
, Control; ![]() , 1 g NM/kg diet;
, 1 g NM/kg diet; ![]() , 4 g NM/kg diet. (b)–(d) □, Control;
, 4 g NM/kg diet. (b)–(d) □, Control; ![]() , 1 g NM/kg diet;
, 1 g NM/kg diet; ![]() , 4 g NM/kg diet.
, 4 g NM/kg diet.
Discussion
The present study found that low doses of nicotinamide supplementation could promote weight gain but that high doses could not. These observations are similar to those of previous studies(Reference Shibata, Shimada and Taguchi20, Reference Shibata21). The effects of excess nicotinamide exposure on rat weight gain may involve insulin resistance and oxidative stress. Our previous study found that nicotinamide degradation-induced generation of reactive oxygen species and subsequent insulin resistance could enhance the effect of glucose on insulin secretion and cause reactive hypoglycaemia(Reference Li, Sun and Zhou5), a major appetite-stimulating factor(Reference Chaput and Tremblay22). This suggests that nicotinamide-induced weight gain may involve an increase in appetite. Indeed, low doses of nicotinamide supplementation have been demonstrated to increase food intake in rats(Reference Shibata, Shimada and Taguchi20, Reference Shibata21). Notably, high doses of nicotinamide are known to cause hepatotoxicity in humans(Reference Winter and Boyer23). The present study also showed that nicotinamide supplementation was associated with a dose-dependent increase in oxidative tissue injury. This may account for why high doses of nicotinamide do not promote weight gain (see Fig. 7(a) and Shibata et al. (Reference Shibata, Shimada and Taguchi20)) or even cause growth retardation(Reference Handler and Dann24).
It is generally accepted that decreased energy expenditure due to physical inactivity may play a significant role in weight gain and obesity. However, it is unlikely that this explains the link between formula feeding and obesity, because studies have not found a decrease in energy expenditure in formula-fed infants(Reference Butte, Wong and Ferlic25, Reference Wells and Davies26). Instead, evidence shows that, compared with breast-fed infants, formula-fed infants have higher heart rates(Reference Butte, Smith and Garza27), higher sleeping metabolic rates, higher minimal observable energy expenditure and higher total daily energy expenditure, most notably associated with higher rates of weight gain rather than with lower ones(Reference Wells and Davies26). All of these observations clearly suggest that formula-fed infants are in a hypermetabolic state. Given that (1) many vitamins are known to promote energy metabolism and appetite, (2) formula-fed infants have higher energy intakes(Reference Wells and Davies26) and (3) formulas contain much higher levels of vitamins than breast milk(Reference Zhou, Zhou and Li6), we, therefore, hypothesise that excess vitamin exposure may play a role in the association between formula feeding and obesity. The present study provides support for this hypothesis. Excess vitamin exposure could also help explain the link between the update of B-vitamin-fortified standards in 1974 (a significant event leading to a significant increase in the levels of niacin, thiamin and riboflavin in grains) and the sharp nationwide increase in the prevalence of obesity in the USA in the 1980s(Reference Zhou, Li and Zhou4, Reference Li, Sun and Zhou5).
Methylation is a key mechanism for the degradation of nicotinamide and xenobiotics(Reference Zhou, Zhou and Li13). The present finding that nicotinamide supplementation was associated with a dose-dependent decrease in plasma betaine levels but an increase in choline levels suggests that the methyl groups used for nicotinamide methylation are derived mainly from betaine rather than from choline. The decreased utilisation of choline may be due to the oxidative injury of the liver and kidneys, which are responsible for the conversion of choline to betaine(Reference Ueland28). Thus, it appears that under oxidative stress conditions, betaine is an effective methyl donor, but choline is not. This may help explain why the metabolic syndrome, which is characterised by oxidative stress(Reference Otani29, Reference James, Collins and Logan30), is associated with high plasma choline levels and low betaine levels(Reference Konstantinova, Tell and Vollset31).
Although nicotinamide supplementation induced a significant increase in S-adenosylmethionine-mediated methyl transfer reactions (which is indicated by a significant rise in plasma N 1-methylnicotinamdie levels and a decrease in plasma betaine levels), there was no significant increase in fasting plasma homocysteine levels or even a slight decrease in those of the low-dose-treated group (Fig. 3(e)). These findings suggest that there is an increase in homocysteine turnover rate in response to increased nicotinamide methylation and indicate that plasma homocysteine levels are a less sensitive indicator of disturbed methyl metabolism than plasma betaine levels. The finding that nicotinamide supplementation induced a decrease in the expression of Bhmt and Cbs but a slight increase in that of Mtr suggests that the increased homocysteine turnover may be mediated by Mtr-mediated conversion of homocysteine to methionine, in which increased catabolism of betaine may play a role because this pathway uses the metabolites of betaine as one-carbon donors (Fig. 1).
Epigenetic mechanisms provide an adaptive layer of control in the regulation of gene expression that enables an organism to adjust to a changing environment(32). It seems that such epigenetic mechanisms can also be applied to excess nicotinamide exposure. As has been found in the present study, excess nicotinamide exposure can induce the expression of certain genes. For example, rats fed with the nicotinamide-supplemented diets exhibited high plasma nicotinamide levels, which were associated with decreased methylation in the Nnmt promoter region and increased Nnmt expression, while the decreased plasma homocysteine levels in the low-dose nicotinamide (1 g/kg diet)-treated rats were associated with increased methylation in the Cbs promoter region and decreased Cbs expression. In contrast, the hypermethylated promoter of Ins1, which is not expressed in the liver, was also not affected by nicotinamide supplementation. Moreover, the promoters of Dnmt1, Mtr and Cat were rarely methylated under the control condition (which suggests that these genes may be housekeeping genes) and were also not affected by nicotinamide supplementation. It is worth noting that excess nicotinamide-induced methyl-group depletion can induce DNA hypomethylation. The present findings, together with our previous observations that excess nicotinamide exposure could induce oxidative stress and insulin resistance(Reference Li, Sun and Zhou5, Reference Zhou, Li and Sun33) and disturb the methylation-mediated degradation/inactivation of catecholamines(Reference Zhou, Zhou and Li13), suggest that high nicotinamide intake may play a role in the development of oxidative stress-, insulin resistance- and methylation-related disorders.
Another interesting finding of the present study is that nicotinamide supplementation significantly reduces uracil content in rat hepatic DNA. A possible explanation for this may involve deoxythymidine monophosphate synthesis. As shown in Fig. 1, dimethylglycine, sarcosine and glycine, which may be derived from betaine catabolism, are involved in the formation of 5,10-methylenetetrahydrofolate, an essential cofactor for the synthesis of deoxythymidine monophosphate from deoxyuridine monophosphate. Thus, the increased catabolism of betaine induced by nicotinamide supplementation could increase the levels of its metabolites, which may facilitate the synthesis of 5,10-methylenetetrahydrofolate-dependent deoxythymidine monophosphate and consequently reduce uracil incorporation into DNA during DNA replication. The role of a nicotinamide-induced decrease in uracil content in DNA is an open question.
It can be concluded that long-term excess nicotinamide exposure-induced insulin resistance and metabolic disorders are associated with epigenetic changes. Whether excess nicotinamide exposure promotes or inhibits weight gain may depend, to a large extent, on the degree of oxidative tissue damage. Given the adverse effects of excess nicotinamide exposure, it may be necessary to re-evaluate the long-term safety of nicotinamide fortification, which is a major cause of sustained excess nicotinamide intake.
Supplementary material
To view supplementary material for this article, please visit http://dx.doi.org/10.1017/S0007114513001815
Acknowledgements
The present study was supported by the National Natural Science Foundations of China (no. 31140036 and 81172949) and the Foundation of Key Laboratory of Education Department of Liaoning Province (L2012441). The authors’ contributions are as follows: S.-S. Z. designed the research; S.-S. Z. and D. L. drafted, edited and revised the manuscript; D. L., Y.-J. T., J. G., W.-P. S., Y.-Z. L., N. L., Y. C. and J.-M. C. contributed to the programme initiation, data acquisition and analysis/discussion; M. G. and X.-J. G. directed the HPLC separation and analysis. All authors read and approved the final manuscript. None of the authors has any conflict of interest.


