The WHO projected that as of 2005, there were twenty million overweight children and 400 million obese adults worldwide, a number that is predicted to reach 700 million by 2015(1). The rapid rise in obesity rates has been theorised to be at least partially linked to developmental programming or the ability of an insult occurring at a critical period in development to result in persistent effects on metabolism and health(Reference Lucas2). Compromised nutritional exposure of the fetus in utero has been implicated in programming of later CVD, hypertension and diabetes in offspring(Reference Lucas2). Detrimental metabolic programming has been shown to affect the birth size and body weight of future generations, even up to twelve generations in rodents(Reference Taylor and Poston3).
Glucose and lipid metabolism are responsible for energy use and storage by the body and its various systems. Many of the genes that regulate glucose and lipid metabolism are nutrient-responsive and can therefore be up- or down-regulated in response to changes in diet composition(Reference Maurer, Chen and McPherson4). Both fibre and protein are important dietary components that yield nutrient–gene interactions in the body(Reference Daimiel, Vargas and Ramirez de Molina5). The effects of consuming excess amounts of these macronutrients in the context of pregnancy and developmental programming are incompletely understood.
Depending on the type of dietary fibre examined, diets high in fibre can enhance satiety and reduce food intake, reduce hypercholesterolaemia, improve type 2 diabetes management(Reference Theuwissen and Mensink6, Reference Vuksan, Rogovik and Jovanovski7) and even prevent pre-eclampsia(Reference Qui, Coughlin and Frederick8). The societal trend towards the consumption of highly processed and energy-dense foods has resulted in a decreased intake of dietary fibre(Reference Liu9). We have shown that a high-prebiotic fibre diet (approximately 5 %) is tolerated and effective in reducing body weight, fat mass and food intake in human subjects(Reference Parnell and Reimer10). These same effects can be seen in rodents fed diets containing 10–20 % prebiotic fibre(Reference Maurer and Reimer11–Reference Parnell and Reimer13). Despite the known benefits of fibre, pregnant women are not meeting current recommendations for dietary fibre intake(Reference Rifas-Shiman, Rich-Edwards and Kleinman14, Reference Bang and Lee15).
There are also large variations in protein intake in pregnant women, with some reports of intake as high as 350 g/d of protein in the third trimester(Reference Andreasyan, Posonby and Dwyer16). A high protein intake during pregnancy has been linked to low birth weight(Reference Rush, Stein and Susser17), increased blood pressure(Reference Campbell, Hall and Barker18, Reference Shiell, Campbell-Brown and Haselden19) and increased cortisol levels(Reference Herrick, Phillips and Haselden20). It has been previously shown in animal studies that a maternal diet high in protein can lead to fetal growth retardation and subsequently trigger increased fat mass in adulthood(Reference Daenzer, Ortmann and Klaus21).
We have previously shown that a high-protein diet introduced at weaning predisposes rats to an obese phenotype when they are given a high-energy diet in adulthood; whereas consumption of a high-prebiotic fibre diet during growth may provide some protection(Reference Maurer, Eller and Hallam22). Furthermore, when dams were fed the same high-protein and high-fibre diets during pregnancy and lactation, plasma glucose at 28 d of age was lower in high-fibre v. control and high-protein offspring, and glucagon-like peptide-1 (GLP-1), a potent insulin secretagogue and anorexigenic hormone, was increased in high-fibre offspring(Reference Maurer and Reimer11). In brown adipose tissue, high-protein offspring had increased resistin and IL-6 mRNA expression, two factors associated with inflammation and insulin resistance. Because changes in offspring were measured only from postnatal day 7 to 35, we do not know whether these early changes persist into adulthood and to what extent they affect glucose control and adiposity into adulthood.
The objective of the present study was therefore to determine the long-term effects of maternal diets high in protein or prebiotic fibre content on the offspring's glucose control and adiposity in adulthood. Specifically, we examined body weight, fat mass and the expression of satiety hormones and genes related to glucose control and lipid storage in the offspring from dams consuming a control, high-fibre or high-protein diet during pregnancy and lactation. Given evidence that the developmental programming effects of early nutrition can be latent, we used an 8-week high-fat, high-sucrose (HFS) diet challenge in adulthood to unmask the potential effects of early programming.
Methods
Ethical approval
The University of Calgary Animal Care Committee approved the experimental protocol that was conducted in accordance with the Guide for the Care and Use of Laboratory Animals.
Animals and diets
A total of thirty-seven virgin Wistar dams were obtained from Charles River and housed in a temperature- and humidity-controlled facility with a 12 h light–12 h dark cycle. After 1 week of acclimatisation, the animals were given one of three nutritionally complete experimental diets: high prebiotic fibre (HF, 21·6 % (w/w), 1:1 ratio of oligofructose and inulin; 13·73 kJ/g); high protein (HP, 40 % (w/w); 15·74 kJ/g); control (C, based on the American Institute of Nutrition (AIN)-93G; 15·74 kJ/g). All maternal diets were mixed in house using ingredients purchased from Dyets, Inc.; the detailed composition has been published previously(Reference Maurer, Chen and McPherson4). Dams consumed the diets for 1 week before being bred with male Wistar rats in wire-bottomed cages. Following the identification of a copulation plug, dams were housed individually and continued to consume their assigned experimental diet (C, HF or HP) until the pups were weaned. Dams were weighed weekly, and food intake was measured throughout week 2 of pregnancy.
Body composition
Pups were weighed on the day after birth, and litters then culled to ten pups with equal numbers of males and females where possible. Offspring were weighed weekly for the remainder of the study. Food intake was also measured for five consecutive days out of every 20 d by subtracting the weight of the cup and diet from the previous day's weight. At weaning (3 weeks), one male and one female pup were randomly selected from each litter to continue in the study until 22 weeks of age. By selecting one male and one female from each litter, we examined ten individual rats per sex that were not all from one litter, minimising the effect of any single dam. Pups were weaned onto the AIN-93G control diet(Reference Reeves, Nielsen and Fahey23). Offspring were then switched to AIN-93M (15·07 kJ/g) for maintenance at 10 weeks of age. At 14·5 weeks of age, offspring were fed a HFS diet (19·26 kJ/g)(Reference Pyra, Saha and Reimer12) for 8 weeks. The HFS diet was composed of (g/100 g): maize starch (5); casein (14), sucrose (51), soyabean oil (10), lard (10), Alphacel (5), AIN-93M mineral mix (3·5), AIN-93 vitamin mix (1), l-cystine (0·3) and choline bitartrate (0·25). Only one male and one female pup not selected for the study underwent a dual-energy X-ray absorptiometry scan (Hologic QDR-4500; Hologic, Inc.) while lightly anaesthetised using isoflurane 1 week post-weaning. Hologic QDR software for small animals was used to determine lean and fat mass. A separate group of pups referred to as reference rats (n 10 male and n 10 female offspring from n 5 control diet dams) was weaned at 3 weeks of age onto the control diet (AIN-93G) and continued to consume this diet (AIN-93M after 10 weeks of age) throughout the study (i.e. no maternal intervention and no exposure to the HFS diet). This reference group, matched for age and sex with the intervention groups, provides a standard of normal growth in these rats.
Oral glucose tolerance test and tissue sampling
At the end of the 8 weeks of HFS diet consumption, rats were fasted overnight and an oral glucose tolerance test (OGTT) performed. Blood was sampled from the tip of the tail in conscious rats followed by an oral glucose administration (2 g/kg). At 15, 30, 60, 90 and 120 min post-oral glucose administration, additional blood was sampled from the tail and immediately analysed using a blood glucose meter (Accu-Chek Blood Glucose Meter; Roche). At 1 d before study termination, rats underwent a dual-energy X-ray absorptiometry scan under light anaesthetic as described previously. A second OGTT for satiety hormone analysis was performed at the time of terminal tissue collection. After an overnight fast, rats were anaesthetised with isoflurane and a fasting cardiac blood sample was taken. Rats were then given 50 % dextrose (w/v) by oral administration at a dose of 2 g/kg. At 15, 30, 60 and 90 min post-oral dextrose administration, another cardiac blood sample was taken according to our previous study while rats were anaesthetised(Reference Reimer and Russell24). Blood was collected in tubes containing diprotin-A (0·034 mg/ml blood; MP Biomedicals); Sigma protease inhibitor (1 mg/ml blood; Sigma-Aldrich) and Roche Pefabloc (1 mg/ml blood; Roche), and then centrifuged at 1600 g for 12 min at 4°C. Plasma was stored at − 80°C until analysis. The OGTT was a terminal procedure and after the 90 min blood collection, rats were killed via over-anaesthetisation and aortic cut. The liver, stomach, small intestine, caecum and colon were weighed, and then a sample was snap-frozen in liquid N2 and stored at − 80°C.
Plasma analysis
A Milliplex Rat Gut Hormone kit (Millipore) and a Luminex instrument were used to measure ghrelin (active), insulin, amylin (active), leptin, glucose-dependent insulinotropic polypeptide (GIP, total) and peptide tyrosine tyrosine (PYY, total). An ELISA was used to measure active GLP-1 (Millipore). NEFA at fasting were measured using an enzymatic colorimetric assay according to the manufacturer's instructions (Wako Diagnostics). Homeostasis model assessment of insulin resistance (HOMA-IR) was calculated from fasting insulin and fasting glucose.
Hepatic TAG analysis
TAG content of the liver was quantified using 25 mg tissue according to the manufacturer's guidelines of the glycerol phosphate oxidase (GPO) reagent set (Pointe Scientific, Inc.).
RNA extraction and real-time PCR
Total RNA was extracted from the stomach, small intestine, colon and liver using TRIzol reagent (Invitrogen). RT was performed with an input of 1 μg of total RNA using the first-strand complementary DNA synthesis kit for RT-PCR (Invitrogen) with oligo d(T)15 as a primer. Complementary DNA was amplified using primers synthesised by the University of Calgary Core DNA Services (Calgary) and analysed by real-time PCR. Primer sequences were according to our previous study(Reference Maurer, Chen and McPherson4). A melt curve showed the melting point of the PCR product of interest. Glyceraldehyde-3-phosphate dehydrogenase (GAPDH) was verified as a suitable housekeeping gene for the tissues of interest and GAPDH primers included as an internal control in the reactions. The 2–= C T method (ΔC T= C T (gene of interest)–C T (reference gene)) was utilised for the data analysis, where the threshold cycle (C T) indicates the fractional cycle number at which the amount of the amplified target reaches a fixed threshold(Reference Silver, Best and Jiang25). ΔC T is the difference in threshold cycles for the gene of interest and GAPDH.
Statistical analysis
All data are presented as means with their standard errors. Data collected from the dams were analysed with one-way ANOVA with Tukey's post hoc analysis. In offspring, a two-way ANOVA was used to compare the main effects of diet and sex, and their interaction. Only when a significant interaction effect was identified were all the six groups compared using a one-way ANOVA with Tukey's post hoc analysis. The reference group data are provided as a comparator for rats that did not undergo any intervention (either maternal diet manipulation or offspring's HFS diet consumption). Given that there was no intervention and they were for reference purposes alone, the reference group was not included in the statistical analysis. Given the numerous variables examined in the offspring, a Bonferroni correction was applied such that only P≤ 0·01 was considered as significant. Statistical analysis was performed using PASW version 17.0 software (SPSS Inc.).
Results
Dams and litters
Of the thirty-seven dams originally obtained for the present study, twenty-four delivered viable litters. Of the control dams, three had spontaneous abortions and one exhibited abnormal behaviour towards her litter. The abnormal behaviour consisted of splitting the nest of pups into two at opposite ends of the cage and tending to one nest more than the other, thus resulting in greater weight gain in pups of one nest over the other. Of the HP dams, two had a number of pups that died within a week of delivery, resulting in litters too small to be used in the present study. In addition one HP dam delivered all stillborn pups and another also exhibited abnormal behaviour towards her litter. Of the HF dams, one did not conceive, one died during the first week of pregnancy from cardiac arrest, one became moribund after delivery of her pups and another two died at 1 and 2 weeks, respectively, after delivery due to intestinal complications.
The total weight gain during pregnancy was greater in the C and HP dams compared with the HF dams (P< 0·05; Table 1). The birth weight of female offspring from the HF dams was lower than that from the HP and C dams (Table 1), whereas male offspring birth weights did not differ (hereafter, offspring are referred to as HF1, HP1 or C1). There were no differences in the number of pups delivered and the number of males and females, or stillborns across the diet groups.
Table 1 Weight gain and litter statistics of dams fed a control, high-protein or high-prebiotic fibre diet during pregnancy and lactation* (Mean values with their standard errors, n 8–10 per group)

a,bMean values with unlike superscript letters were significantly different between the diets (P< 0·05).
* Food and energy intake was measured during the second week of pregnancy.
Offspring growth and food intake
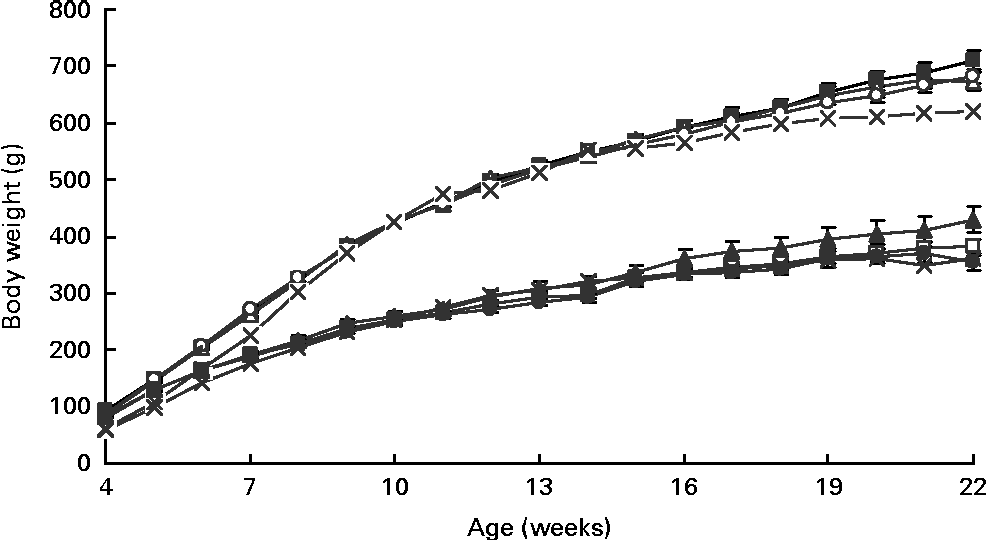
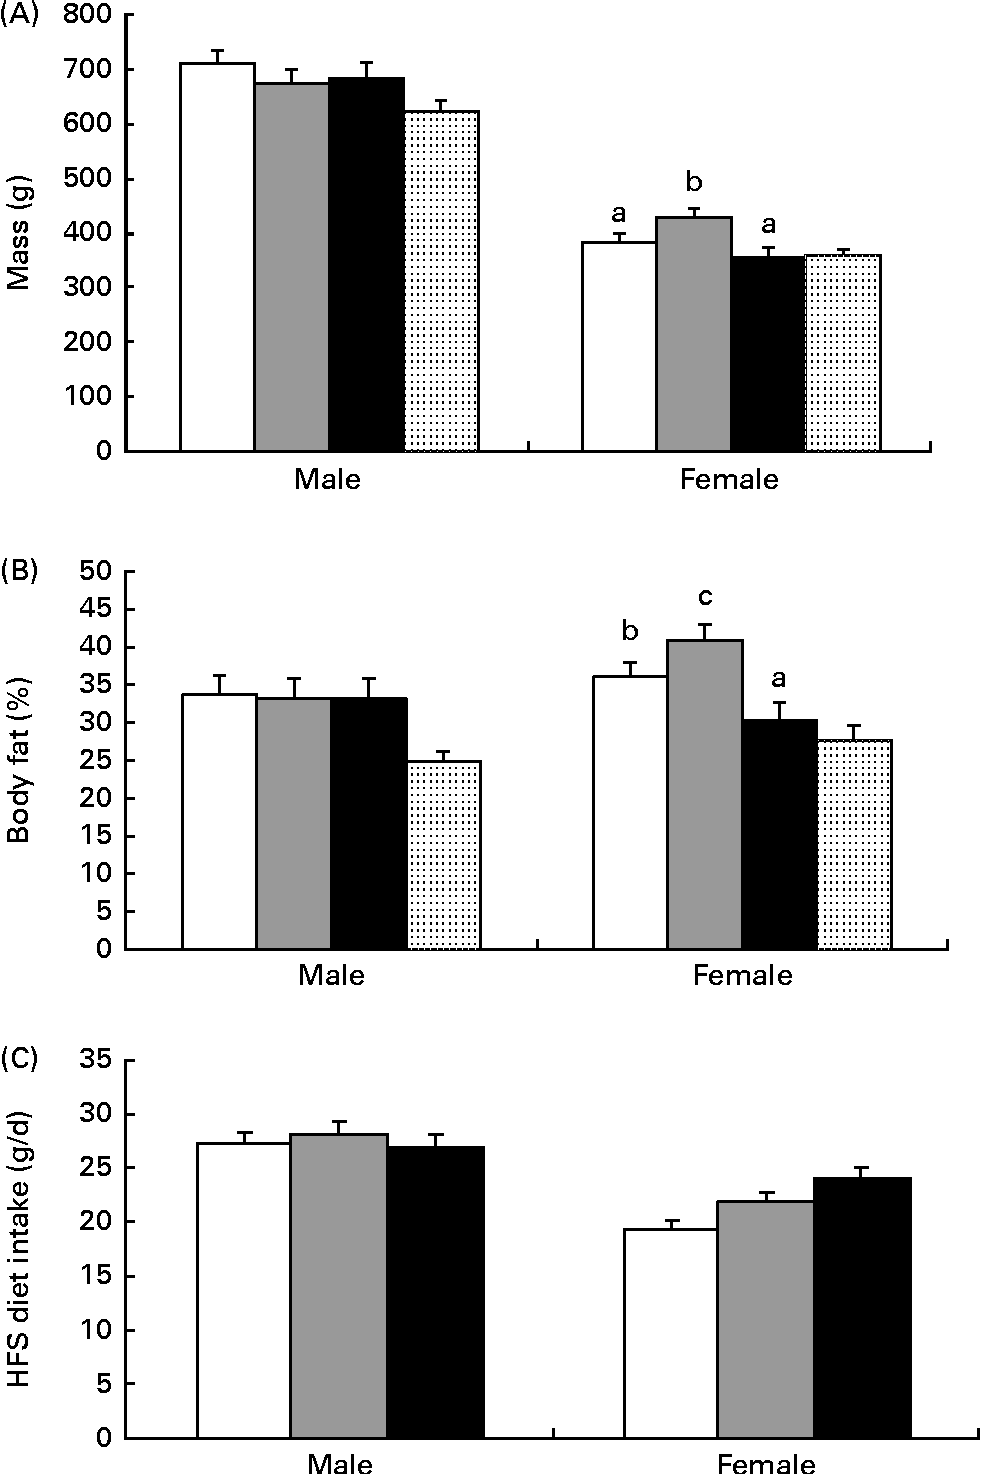
As measured by dual-energy X-ray absorptiometry at 4 weeks of age, the diet but not sex affected the percentage of body fat, with HF1 having lower levels than C1 (C1: 20·0 (se 0·9) %, HP1: 18·4 (se 1·7) %, HF1: 15·4 (se 1·0) %; P= 0·01). As expected with growth, there was a significant effect of week (P= 0·0001) and a week × sex interaction (P= 0·001) for body weight from 4 to 22 weeks of age, with males having a higher body weight than females (Fig. 1). The final body weight was affected by the interaction of diet and sex (P= 0·01), with female HP1 having a higher body weight than C1 and HF1 (Fig. 2(A)). Similarly, for the percentage of body fat, the interaction between diet and sex affected the body fat (P= 0·01), with female HP1 having a higher body fat than C1 which in turn were found to have a higher body fat than HF1 (Fig. 2(B)). When maternal weight gain was examined as a covariate, no significant effect was found for the female offspring's final body weight (P= 0·112) or percentage of body fat (P= 0·069). There were no differences in the naso-anal length within male or female offspring, and there were no differences between the diet groups for any organ weights or lengths (data not shown). Independently, time and sex affected the offspring's intake of the control diet from 4 to 13 weeks of age wherein food intake increased with increasing age and males consumed more food than females (P< 0·01). There were no differences between the diet groups during this period. When rats were switched to the HFS diet, there was a significant effect of sex (P= 0·001), with male rats consuming more of the diet than females (Fig. 2(C)).

Fig. 1 Longitudinal body weight in the female and male offspring of dams fed a control, high-protein or high-prebiotic fibre diet during pregnancy and lactation. Values are means (n 10 males and n 10 females), with their standard errors represented by vertical bars. There were significant effects for week (P= 0·0001) and the week × sex interaction (P= 0·001). Male: ![]() , control;
, control; ![]() , protein;
, protein; ![]() , fibre;
, fibre; ![]() , reference. Female:
, reference. Female: ![]() , control;
, control; ![]() , protein;
, protein; ![]() , fibre;
, fibre; ![]() , reference.
, reference.

Fig. 2 Final body weight, percentage of fat and high fat, sucrose diet intake in the offspring of dams fed a control (□), high-protein (![]() ) or high-prebiotic fibre (■) diet. (A) Body weight was greater in the female offspring of high-protein dams (HP1) than in those of high-prebiotic fibre dams (HF1) and control dams (C1) (P= 0·043), (B) percentage of fat was greater in HP1 females than in HF1 and C1 and (C) high-fat/sucrose (HFS) diet consumption was not different between the diet groups for males or females. Values are means (n 10 males and n 10 females), with their standard errors represented by vertical bars. a,b,cMean values with unlike letters were significantly different between the diets (P≤ 0·01). (A, B) There was a significant diet × sex interaction effect (P= 0·01) and (C) a significant effect for sex (P= 0·001).
) or high-prebiotic fibre (■) diet. (A) Body weight was greater in the female offspring of high-protein dams (HP1) than in those of high-prebiotic fibre dams (HF1) and control dams (C1) (P= 0·043), (B) percentage of fat was greater in HP1 females than in HF1 and C1 and (C) high-fat/sucrose (HFS) diet consumption was not different between the diet groups for males or females. Values are means (n 10 males and n 10 females), with their standard errors represented by vertical bars. a,b,cMean values with unlike letters were significantly different between the diets (P≤ 0·01). (A, B) There was a significant diet × sex interaction effect (P= 0·01) and (C) a significant effect for sex (P= 0·001). ![]() , Reference.
, Reference.
Plasma satiety hormones and blood glucose
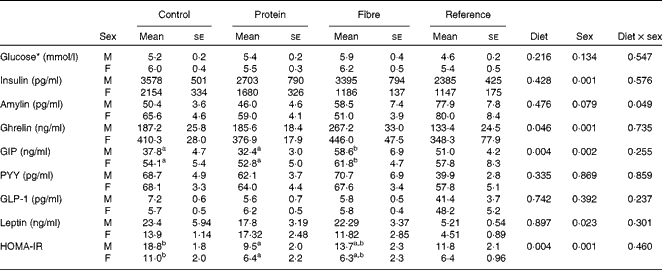
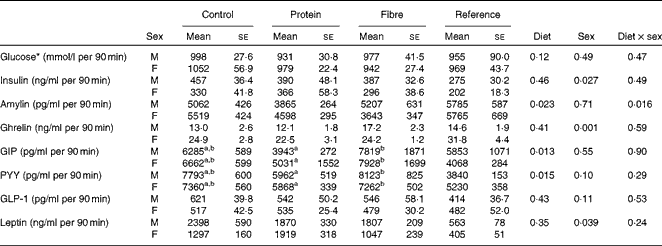
Fasting values and AUC were examined for seven appetite-regulating hormones. At fasting, there was a significant effect of sex on insulin (P= 0·001), with males having higher levels than females (Table 2). In contrast, females had higher fasting levels of ghrelin (P= 0·001) and GIP (P= 0·002) than males. Only fasting GIP was significantly affected by diet (P= 0·004), with HF1 having higher levels than C1 and HP1. For the AUC, which represents the exposure to the hormone of interest over the entire course of the OGTT, females had higher ghrelin than males (P= 0·001; Table 3). The diet affected the GIP AUC (P= 0·0013) with HF1 having higher levels than HP1 but not C1. Similarly, the PYY AUC was higher in HF1 (P= 0·0015) compared with HP1 but not C1. There were no differences between sexes for GIP or PYY AUC. There were no differences in fasting or AUC for glucose (Tables 2 and 3). Independently, diet (P= 0·004) and sex (P= 0·001) but not their interaction affected HOMA-IR, with males having higher values than females and C1 having higher levels than HP1 at the end of the study (Table 2).
Table 2 Fasting blood glucose and plasma satiety hormones in the offspring (Mean values with their standard errors, n 8–10 per group)

GIP, glucose-dependent insulinotropic polypeptide; PYY, peptide tyrosine tyrosine; GLP-1, glucagon-like peptide-1; HOMA-IR, homeostasis model assessment of insulin resistance.
a,bMean values with unlike superscript letters were significantly different between the diets (P≤ 0·01).
* Glucose concentrations were measured during an oral glucose tolerance test (OGTT) performed on conscious animals using a tail nick 1 week before study termination, while all other hormone data were from anaesthetised rats at the terminal OGTT.
Table 3 AUC for blood glucose and plasma satiety hormones in the offspring during the oral glucose tolerance tests (Mean values with their standard errors, n 8–10 per group)

GIP, glucose-dependent insulinotropic polypeptide; PYY, peptide tyrosine tyrosine; GLP-1, glucagon-like peptide-1.
a,bMean values with unlike superscript letters were significantly different between the diets (P≤ 0·01).
* Glucose data were taken from an oral glucose tolerance test (OGTT) performed on conscious animals using a tail nick 1 week before study termination, while all other hormone data were from anaesthetised rats at the terminal OGTT.
NEFA and liver TAG
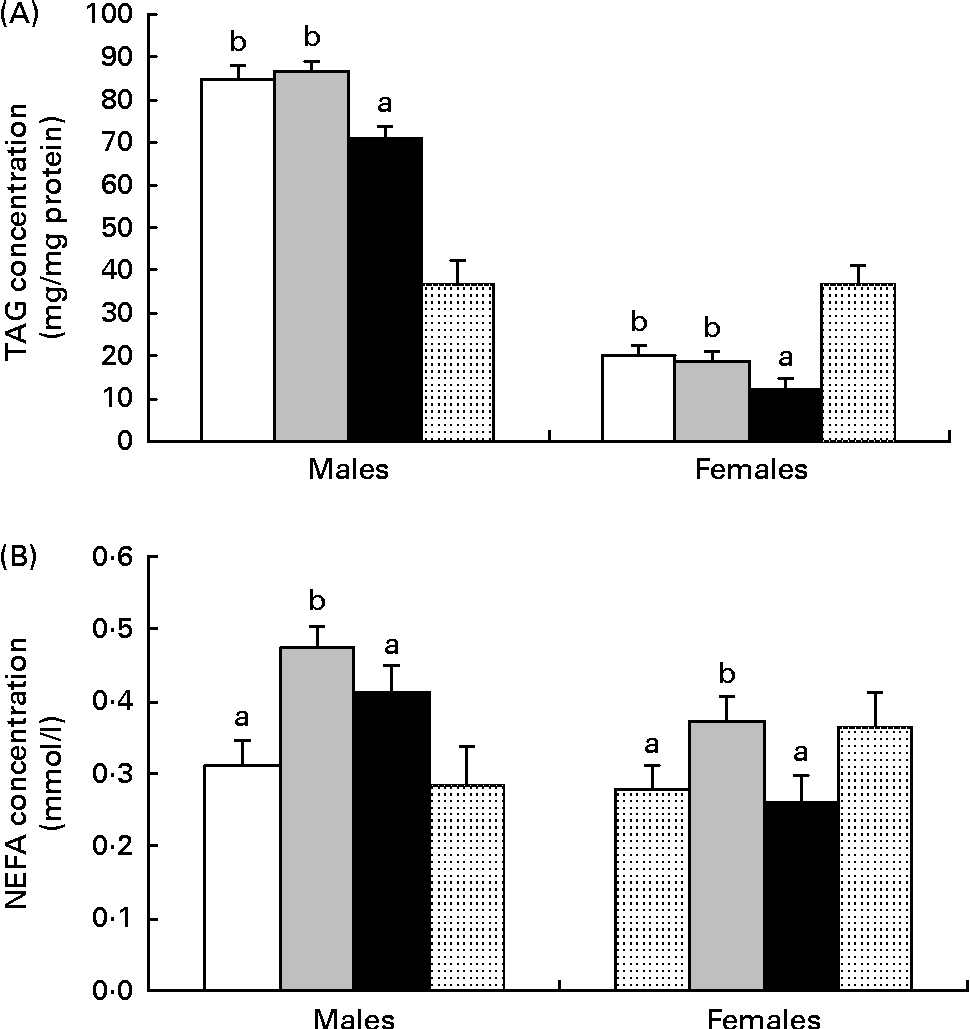
Independently, maternal diet (P= 0·001) and sex (P= 0·001) affected the liver TAG content. Hepatic TAG concentration was lower in females than in males and lower in HF1 than in C1 or HP1 (Fig. 3(A)). Independently, maternal diet (P= 0·001) and sex (P= 0·001) also affected plasma NEFA concentrations, with males having higher levels than females and HP1 having higher levels than C1 and HF1 (Fig. 3(B)).

Fig. 3 (A) Hepatic TAG content and (B) plasma NEFA in the female and male offspring of dams fed a control (□), high-protein (![]() ) or high-prebiotic fibre (■) diet during pregnancy and lactation. Values are means (n 10 males and n 10 females), with their standard errors represented by vertical bars. a,bMean values with unlike letters were significantly different between the diets (P≤ 0·01). (A, B) There were significant effects for diet (P= 0·001) and sex (P= 0·001).
) or high-prebiotic fibre (■) diet during pregnancy and lactation. Values are means (n 10 males and n 10 females), with their standard errors represented by vertical bars. a,bMean values with unlike letters were significantly different between the diets (P≤ 0·01). (A, B) There were significant effects for diet (P= 0·001) and sex (P= 0·001). ![]() , Reference.
, Reference.
Gastrointestinal tract gene expression
In the stomach, maternal diet affected ghrelin gene expression (P= 0·01), with HP1 having higher levels than HF1 (Table 4). The interaction of maternal diet and sex affected the mRNA levels of sodium glucose co-transporter 1 (SGLT1; P= 0·014) in the ileum, with male HF1 having lower levels than male HP1 and female C1. Maternal diet alone affected the expression of GLUT2 (P= 0·002), with HP1 and HF1 having lower levels than C1.
Table 4 Intestinal gene expression in the offspring of dams fed a control, high-protein or high-prebiotic fibre diet during pregnancy and lactation (Mean values with their standard errors, n 8–10 per group)
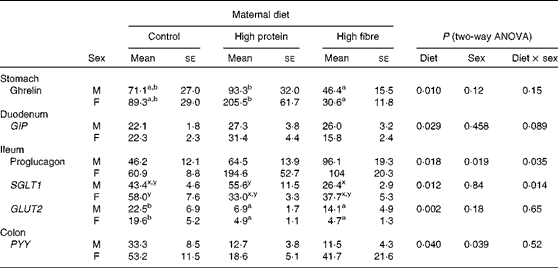
GIP, glucose-dependent insulinotropic polypeptide; SGLT1, sodium glucose co-transporter 1; PYY, peptide tyrosine tyrosine.
a,bMean values with unlike superscript letters were significantly different between the diets (P≤ 0·01).
x,yThere was a significant diet × sex interaction (P≤ 0·01).
Hepatic gene expression
Maternal diet affected the gene expression of hepatic fatty acid synthase (FAS) (P= 0·006), with HP1 having lower levels than HF1 and C1 (Table 5). Phosphoenolpyruvate carboxykinase (PEPCK; P= 0·006) differed between sexes, with males having higher mRNA levels than females. The interaction between maternal diet and sex affected PPARγ co-activator 1-α (PGC1α, P= 0·006). PGC1α mRNA levels were lower in all males and HF1 females compared with female C1. There were no differences in sterol regulatory element-binding protein 1c (SREBP1c) or acetyl-CoA carboxylase 1 (ACC1) expression (data not shown).
Table 5 Hepatic gene expression in the offspring of dams fed a control, high-protein or high-prebiotic fibre diet during pregnancy and lactation (Mean values with their standard errors, n 8–10 per group)

FAS, fatty acid synthase; PEPCK, phosphoenolpyruvate carboxykinase; PGC1α, PPARγ co-activator 1-α.
a,bMean values with unlike superscript letters were significantly different between the diets (P≤ 0·01).
x,yThere was a significant diet × sex interaction (P≤ 0·01).
Discussion
Maternal diet is a well-recognised environmental factor that influences the health of offspring later in life and is in part attributed to epigenetic changes(Reference Godfrey, Lillycrop and Burdge26). In the present study, examining the influence of maternal diets high in protein or prebiotic fibre, we showed a difference in susceptibility to an obese phenotype in the offspring of dams fed these diets and a distinct sex effect, females being affected while males were not. The pattern of growth and development in these offspring may shed some light on the lasting influence of maternal diet. Accelerated postnatal growth or ‘catch-up’ growth has been associated with later metabolic disease and susceptibility to obesity(Reference Berends, Fernandez-Twinn and Martin-Gronert27). We observed catch-up growth in HF1 offspring during the first 2 weeks of life. This rapid growth was evident in female HF offspring, wherein their birth weight was significantly lower than HP1 and C1 female pups but no longer different from the other groups at weaning. This observation is interesting on several fronts given that there were no lasting detrimental effects on adiposity and the availability of food to the dams did not change, although the offspring may have altered their suckling habits or maternal diet may have affected milk composition. While it has recently been shown that milk from the HP dams compromises offspring growth due to impaired lactational function(Reference Kucia, Langhammer and Gors28), it is not known how the HF diet affects milk composition. Maternal weight loss during lactation does not appear to explain the differences in the rate of growth in pups, given that there were no differences among the control, HP and HF dams. However, maternal weight gain during pregnancy was affected by the diet, and the HF dams gained less weight compared with the HP and C dams. It may be tempting to speculate that weight gain, independently of dietary exposure, could have influenced offspring growth; however, we have recently demonstrated that this may not be the case. Consistent with the magnitude of differences in maternal weight gain during pregnancy achieved in the present study, we recently showed that offspring body weight was not altered when maternal weight gain differed by 30–35 g on AIN-93G-based diets (AJ Eslinger and RA Reimer, unpublished results). This is in contrast to a maternal HFS diet that not only resulted in a higher pregnancy weight gain, but probably interacted with the fat and sugar content of the diet to produce increased offspring body weight as well (AJ Eslinger and RA Reimer, unpublished results). Outside of maternal influences, it is possible that catch-up growth in HF1 female offspring was influenced by changes to gut microbial communities. Given the known bifidogenic effect of prebiotics, the HF1 offspring may have acquired a unique profile of bacterial species, or simply a greater number of bacteria that could have led to an initial increase in energy harvest similar to that which has been seen with germ-free mice colonised with microbiota(Reference Turnbaugh, Ley and Mahowald29).
It is not clear what factors are responsible for catch-up growth seen in the HF1 animals; however, it is clear that they avoided the predicted increase in body weight and adiposity typically seen with accelerated postnatal growth(Reference Guilloteau, Zabielski and Hammon30). In fact, at 4 weeks of age, the percentage of body fat was lower in HF1 males and females than in C1. By the end of the study, male body weight and fat mass did not differ from the other two groups, but HF1 females retained a lower body weight and percentage of body fat than HP1 offspring. Fat mass in HF1 females was not only lower than that in HP1 but also decreased in comparison with C1. The elevated percentage of body fat in HP1 is consistent with other studies showing increased fat mass in the offspring of dams fed a high-protein diet during lactation(Reference Delamaire, Parnet and Coupe31). Part of the reason behind this shift to fat mass may be impaired muscle growth, which has been shown in offspring suckled by HP dams(Reference Rehfeldt, Langhammer and Kucia32). Although we did not observe the growth retardation in HP1 offspring that has been demonstrated previously(Reference Langhammer, Derno and Dietrich33), it is possible that growth restriction of lesser magnitude could have predisposed the HP1 animals to increased adipose accumulation as adults, especially when exposed to a HFS diet in adulthood. Postnatal increases in body growth seem to outpace increases in muscle growth in the offspring of dams fed a HP diet during lactation(Reference Rehfeldt, Langhammer and Kucia32), and this may have contributed to the higher percentage of body fat that we observed both at 4 weeks and 22 weeks of age.
Maternal satiety has been implicated as a key factor influencing catch-up weight gain, with levels of leptin and ghrelin in the cord blood able to predict catch-up growth in human subjects(Reference Ong, Ahmed and Sherriff34, Reference Gohlke, Huber and Hecher35), which in turn relate to food intake later in life(Reference Jennings, Ozanne and Dorling36). While plasma concentrations of these satiety hormones were not measured in our offspring at birth, we speculate that they may have played a role, especially since HF1 female offspring consumed approximately 25 % more HFS diet from 14 to 22 weeks of age than C1 females (although this did not reach statistical significance). In our previous study, we observed a decrease in plasma GLP-1 and amylin at 7 d of age in the offspring of dams fed a HF v. HP diet(Reference Maurer and Reimer11). Both GLP-1 and amylin reduce food intake and their lower levels at birth could be associated with greater food consumption and accelerated growth. Despite a lower birth weight in females, early catch-up growth and a higher intake of the HFS diet in adulthood, HF1 offspring did not gain excessive body weight or fat, suggesting that other mechanisms were at work that had a greater influence than the catch-up growth itself. While glucose control was not negatively affected in HF1 compared with the controls, HOMA-IR scores were still higher than HP1. It is possible that the catch-up growth had a negative impact on insulin sensitivity that may not be fully apparent until an older age. Other negative effects of catch-up growth, such as decreased longevity and/or senescence in various tissues(Reference Jennings, Ozanne and Dorling36), may also develop but were not measured in the present study, and may have been counteracted by exposure to prebiotic fibre, which has been shown to increase longevity(Reference Rozan, Nejdi and Hidalgo37).
The offspring of HF dams had lower levels of liver TAG than HP1. While elevated plasma TAG has been shown in the offspring of dams fed a high-protein diet during lactation(Reference Delamaire, Parnet and Coupe31), the TAG-lowering effect of the maternal HF diet in offspring is a novel finding. Oligofructose has been shown to decrease the production of TAG in the liver, as well as increase the catabolism of lipoproteins rich in TAG(Reference Delzenne and Kok38). In the present study, the reduced hepatic TAG content is intriguing given that the rats were not directly exposed to oligofructose, nor were there diet differences in the expression of acetyl-CoA carboxylase, an enzyme in the fatty acid synthesis pathway. NEFA levels were also elevated in our HP1 animals, indicating the availability of lipid as a fuel. The elevated NEFA that we observed seem to be consistent with the shift, albeit transient, towards oxidative metabolism and away from glycolytic muscle metabolism shown by Rehfeldt et al. (Reference Rehfeldt, Langhammer and Kucia32) in animals suckled by HP dams. The differences in body weight in females could be partially due to the decreased availability of NEFA, which may be involved in the regulation of hepatic fatty acid metabolism, although despite similar decreases in NEFA in males, they did not have a lower body weight(Reference Daubioul, Rousseau and Demeure39). The decreased expression of FAS in our HP1 animals may be affected by the increased availability of NEFA, affecting hepatic fatty acid metabolism. A similar decrease in FAS mRNA was observed in our previous work in rats aged 28 and 35 d(Reference Maurer, Eller and Hallam22). This may be a lasting effect from the maternal diet, as diets low in carbohydrates and high in protein have been shown to decrease hepatic FAS mRNA(Reference Morris, Namey and Zemel40–Reference Stepien, Gaudichon and Fromentin43). Male HP1 animals showed decreased PGC1α expression, which is characteristic for the animals consuming a high-fat diet and/or with hypertriacylglycerolaemia(Reference Barroso, Rodriquez-Calvo and Serrano-Marco44). This decreased expression, along with decreased PEPCK expression, could be related to their improved HOMA-IR score.
Decreases in the expression of GLUT2 and SGLT1 in the ileum of HF1 and HP1, and HF1 males, respectively, could be linked, particularly in HP1, to improvements in glucose homeostasis as demonstrated by improved HOMA-IR scores. However, SGLT1 mRNA expression, in particular, is not always related to SGLT1 activity, as protein levels are more influential than mRNA levels(Reference Ferraris45). Decreases in the expression of these transporters in HF1 may be related to differences in the gut microbiota, which remains to be examined. Should there be an alteration in the microbial community leading to increased fermentation, and therefore increased SCFA production, the decreased carbohydrate content in the lumen would result in the decreased expression of SGLT1. Glucose transport has been shown to decrease in the distal portions of the small intestine, and the decrease is more dramatic as rats age(Reference Doubek and Armbrecht46). This could contribute to the differences seen in SGLT1 expression in the ileum.
We have previously demonstrated that increases in GLP-1 and PYY secretion along with the up-regulation of PYY and proglucagon expression occur in response to prebiotic consumption in rats(Reference Maurer, Eller and Hallam22, Reference Reimer and Russell24). In this model, only the dams consumed the prebiotic fibre, and therefore we might expect that the effect may not be passed on to the offspring. This is largely confirmed, although the HF1 offspring did have a higher PYY AUC than HP1 offspring but not C1. We acknowledge that the use of anaesthesia during the OGTT could potentially influence the concentrations of satiety hormones in the plasma, although Zardooz et al. (Reference Zardooz, Rostamkhani and Zaringhalam47) showed that isoflurane had no effect on glucose and insulin levels in fed rats and decreased insulin but not glucose in fasted rats. Similarly, Andrikopoulos et al. (Reference Andrikopoulos, Blair and Deluca48) showed that there was no difference in blood glucose concentrations, and the ability to differentiate glucose tolerance in a chow-fed v. high-fat diet-fed mice under anaesthesia or while conscious was the same. While the plasma concentrations of satiety hormones obtained in our anaesthetised rats are within expected ranges, we have recently made procedural advancements that allow us to obtain sufficient blood from the tip of the tail in conscious rats and thereby avoid the use of anaesthesia.
While there were no differences in male body weight or composition, males did exhibit changes in hepatic and intestinal gene expression, as well as differences in satiety hormones and hepatic lipid storage and glucose control as measured by liver TAG, plasma NEFA and HOMA-IR. It is possible that prolonged exposure to the HFS diet could eventually result in differences in adiposity in response to the observed changes related to hepatic lipid storage and metabolism, especially since significant differences in female body weight were not apparent until 22 weeks. Sex differences observed here, wherein females were more affected than males, could be due to the differences in placental gene expression. It has been shown that placentae of females have been found to have twice as many changes in gene expression compared with the placentae of males, making females more sensitive to environmental changes such as diet(Reference Rosenfeld49).
In conclusion, we demonstrated that in utero exposure to a diet high in protein or prebiotic fibre has a lasting effect on offspring adiposity, hepatic lipid storage and expression of genes related to glucose and lipid metabolism. Within the time frame that we examined, the effect was more pronounced in female than in male offspring. Taken together, these findings suggest that a maternal diet high in protein appears to have some adverse effects, particularly with regard to body composition, while a high-prebiotic maternal diet appears to provide some protection against an obese phenotype in offspring once they reach adulthood.
Acknowledgements
The present study was supported by a research grant from the Natural Sciences and Engineering Research Council (RGPIN 238382–2008, 2009). M. C. H. was supported by an NSERC Postgraduate Scholarship, a Frederick Banting and Charles Best Canada Graduate Scholarship, and a CIHR Training Award in Genetics, Child Development and Health.
M. C. H. declares no conflict of interest. R. A. R. previously held a research grant from Beneo-Orafti, Inc., the manufacturer of Raftilose P95 and Raftiline HP, for a project unrelated to the present study.


