Studies of weaned rats fed a high-fat (H) diet have shown disorders characteristic of the human metabolic syndrome (MetS)(Reference Reaven1,Reference Ginsberg and Huang2) . Additionally, poor diet of the genitors can influence the health of the offspring(Reference Barker3). An increase in white adipose tissues(Reference Volpato, Schultz and Magalhaes-da-Costa4–Reference Zhang, Proenca and Maffei6) is prevalent among the disturbances observed in offspring, which are induced by a maternal H diet. Deposits of white adipose tissues produce leptin that acts on the brain inducing reduction in food intake and increased activity of the sympathetic nervous system(Reference Yu, Kimura and Walczewska7,Reference Otero, Lago and Gomez8) . Leptin-binding sites in the brain regions are also important in cardiovascular control, suggesting that the influence of leptin on cardiovascular functions(Reference Bornstein and Torpy9). Insulin resistance (IR) may also occur due to increased white adipose tissues, leading to hyperinsulinaemia(Reference Dominici, Burghi and Munoz10). Arterial hypertension has a genetic origin or environmental factors such as sedentary lifestyle and/or unbalanced diets(Reference Julius and Nesbitt11). Hypertension involves hyperactivity of the sympathetic nervous system with dysfunction of the baroreflex control that is crucial for short-term control of the mean arterial pressure (MAP)(Reference Julius and Nesbitt11).
Studies from the literature have subjected the genitors to a H diet for different periods of time, in which female rats received the H diet shortly after weaning or variable weeks before mating. The present study aims to investigate the characteristic disorders of the MetS induced by a H diet subjected to the genitors (G0) only during mating, gestation and breast-feeding, which in turn led to different cardio-metabolic parameters in both females and males of F1 and F2 offspring, even if those offspring after weaning were fed only the control diet (C).
Materials and methods
Animals
Fischer rats were kept in individual cages and they were exposed to 12 h dark–12 h light (Animal Science Center – UFOP). All procedures were performed in accordance with the Guidelines for Ethical Care of Experimental Animals and approved by the Animal Ethics Committee of the Federal University of OuroPreto (Protocol 2016/49).
Diets
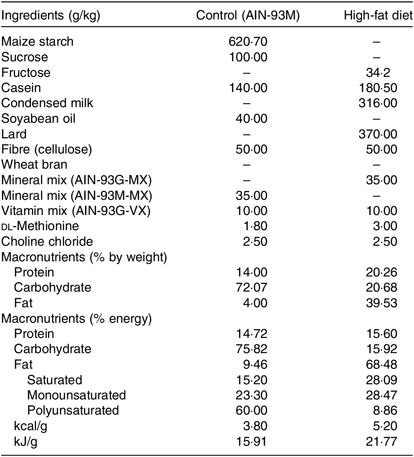
Rats subjected to the control (C) diet (American Institute of Nutrition (AIN)-93M) consisted of 14·7 % proteins, 75·8 % carbohydrates and 9·5 % lipids with an energy value of 15·91 kJ/g, and the H diet (37 % of lard; Pragsoluções Ltda.) consisted of 15·58 % proteins, 16·0 % carbohydrates and 68·42 % total lipids (37 % from lard) having an energy value of 21·77 kJ/g, according to de Castro (2013)(Reference de Castro, dos Santos and Silva12) (Table 1).
Table 1. Composition and energy content of diets*
AIN, American Institute of Nutrition.
* Composition of diets (g/kg) consumed by rats. The percentage of energy was calculated based on the energy provided by each macronutrient as follows: carbohydrates 4 kcal/g, 4 kcal proteins/g and lipids 9 kcal/g. The percentage of polyunsaturated, monounsaturated and saturated fats was calculated according to the total amount of lipids (g) supplied in each diet. To convert energy in kcal to kJ, multiply by 4·184.
Experimental protocol
Primiparous female (220 (SEM 10) g; n 20) and male (290 (SEM 10) g; n 20) non-consanguineous rats (90-d-old) (G0) were interbreed for 10 d. Rats were kept in plastic cage (30 × 21 × 19 cm) with free access to food and water. Females, in individual cages, continued to receive the C or H diet during gestation (21 d) and breast-feeding (28 d). Eight pups per genitor were maintained to ensure homogenous growth. After weaning, litter males and females (first-generation (F1) offspring) were relocated to collective cages (4–5 animals/cage) and received only the C diet until 90 d of age. A group of 90-d-old F1-generation male and female rats who are the offspring of genitors fed the C or H diet were separated for interbreed to obtain the second (F2) generation. The F2 generation was fed only the C diet for 90 d. The experimental groups (four C diets and four H diets) are described in Fig. 1.
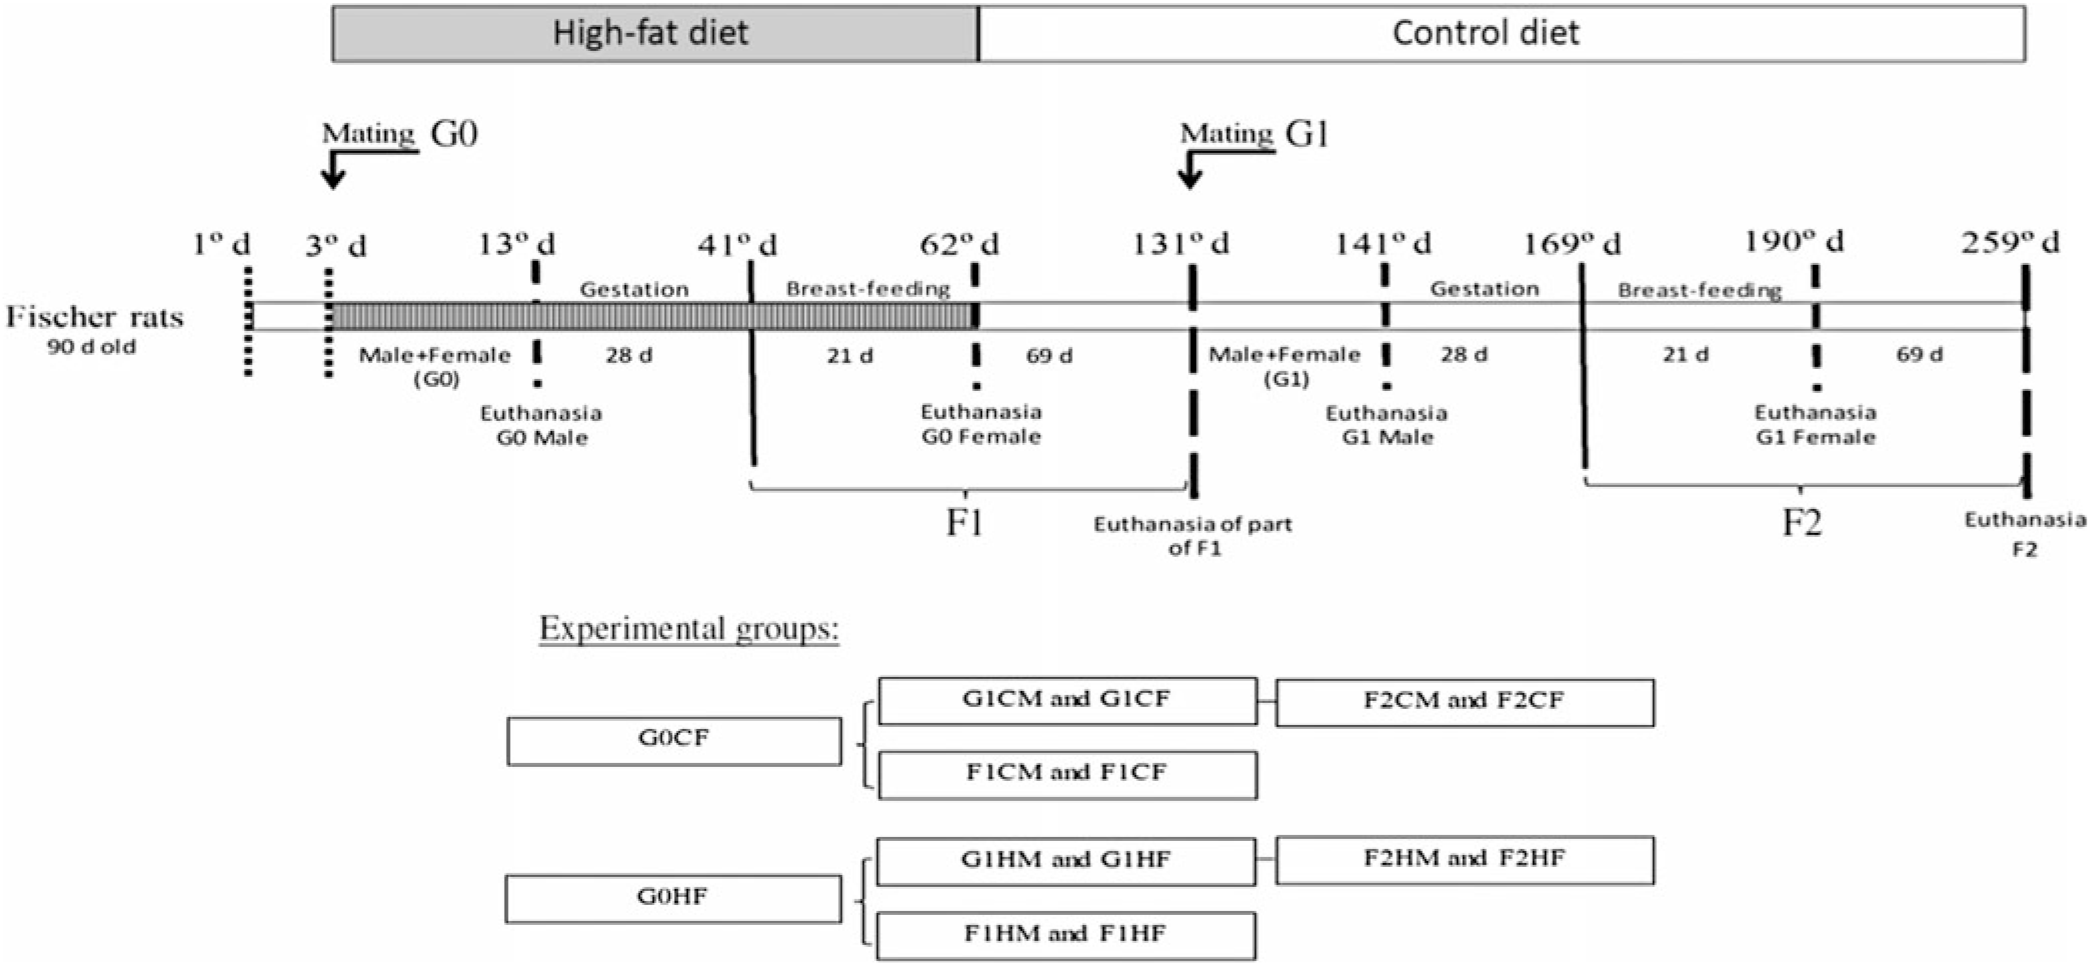
Fig. 1. Experimental design. G0CM and G0HM groups: male genitors subjected to control (C) or high-fat (H) diet, respectively, in the mating period (10 d); G0CF and G0HF groups: female genitors subjected to C and H diets, respectively, in the mating, gestation and breast-feeding period (59 d); F1CM and F1HM groups: male offspring from genitors who consumed the C and H diets, respectively. F1CF and F1HF groups: female offspring born from genitors who consumed C or H diet, respectively. All offspring (F1C or F1H) were fed only the C diet for 90 d immediately after weaning; G1CM and G1HM groups: F1 males whose the genitors (G0) consumed C and H diets, respectively, became the parent of F2 offspring and were only subjected to the C diet; G1CF and G1HF groups: F1 females whose the genitors (G0) consumed C and H diets, respectively, became the genitor of the F2 offspring and were subjected only to the C diet; F2CM and F2HM groups: male offspring from genitors (G1). F2CF and F2HF groups: female offspring from genitors (G1) who consumed the C and H diets, respectively. All offspring (F2C or F2H) were fed only the C diet for 90 d immediately after weaning.
Evaluation of food, energy and water intake and coefficient of food efficiency
Twice a week in the morning, diet was weighed and the volume of water consumed was measured. Food intake and water intake per animal were calculated. Energy intake was calculated by the formula: energy intake = food intake (g) × (energy value of the diet in kcal)(Reference Volpato, Schultz and Magalhaes-da-Costa4). (To convert energy in kcal to kJ, multiply by 4·184.)
Coefficient of food efficiency was calculated by the relation between the body mass (g) gain and energy intake (kcal), that is, the coefficient of food efficiency (kcal/g) = (body mass gain (g)/energy intake (kcal))(Reference Iossa, Lionetti and Mollica13).
Indirect and direct cardiovascular evaluations of mean arterial pressure
Indirect MAP levels were measured using plethysmography (LE 5160-R; Panlab) only in the genitor male rats after they were interbred.
Direct evaluations were performed after 48 h by artery and femoral vein cannulation under anaesthesia, with a mixture of ketamine and xylazine (80 and 10 mg/kg, respectively, intraperitoneally) (Syntec). Pulsatile MAP was monitored by an MLT1199 pressure transducer coupled to an arterial pressure signal amplifier (ML221 Bridge Amp; AD Instruments). Online data were obtained for MAP and heart rate (HR) from the pulsatile arterial pressure waves. All variables were continuously recorded using a PowerLab digital acquisition system (PowerLab 4/30; AD Instruments) with a 1000-Hz sampling rate and a 20-mV digitising window.
Sensitivity evaluation of the baroreflex bradycardia
Baroreflex bradycardia was determined by recording the reflex HR changes in response to transient increases in MAP caused by repeated bolus injections of graded doses of phenylephrine (0·5–40 µg, intravenously (i.v.); Sigma Chemical Co.) in conscious freely moving rats. The HR was converted to pulse interval (mseg) by the formula: 60 000/HR. For each animal, a best-fit regression line was drawn based on MAP and HR changes obtained due to the different doses of phenylephrine. Slope of regression line was used as an index of baroreflex sensitivity (baroreflex gain), as described elsewhere(Reference Cunha, Lima and Silva14).
Influence of sympathetic blockade on mean arterial pressure and heart rate
MAP was recorded before and 15 min after injecting the sympathetic ganglionic blocker, hexamethonium (20 mg/kg iv; Sigma Chemical Co.).
Evaluation of biometric parameters
Naso-anal length was used to calculate the Lee index: (body mass gain (g) 1/3/naso-anal length (cm) × 1000). Adiposity index was calculated using the formula (absolute mass (g) of the inguinal fat deposits + retroperitoneal + epididymal/body weight of the rat (g) × 100). The homeostatic model assessment of insulin resistance (HOMA-IR) = (IJ × GJ)/22·5. HOMA-β, homeostasis evaluation of the functional capacity of β cells = (20 × IJ)/(GJ − 3·5), where IJ = fasting insulin in μU/ml and GJ = fasting glucose in mmol/l(Reference Matthews, Hosker and Rudenski15).
Biochemical analysis
After 12-h fasting, the blood samples (3 ml) were collected in heparinised tubes and centrifuged (4000 rpm, 4°C, 6 min). Plasma samples were stored at −80°C for biochemical analysis. Total cholesterol, TAG and glucose levels were determined using individual commercial kits (Labtest), according to the instructions provided by the manufacturer. Insulin and leptin levels were determined by Elisa sandwich immunoassay method using the ultra-sensitive rat insulin Elisa kit (Crystal Chem).
Statistical analysis
Data were analysed using the Kolmogorov–Smirnov test to evaluate normality and followed the normal standard distribution. The results were statistically evaluated by the Student’s t test and expressed as mean values with their standard errors. Statistical analyses were performed by the GraphPad Prism software (version 6.00). Differences between pairs of means were considered significant at P < 0·05. Sample size, Cohen’s d effect size and statistical power (power calculator for independent t test or paired t test; https://www.dssresearch.com/resources/calculators/statistical-power-calculator-average) were calculated (effect size calculators by Dr Lee A. Becker, University of Colorado, Colorado Springs; https://www.uccs.edu/lbecker); d and r were calculated using means and standard deviations to analyse data and identify statistically relevant differences in the energy intake, dietary coefficient, MAP levels, baroreflex bradycardia sensitivity, reduction in MAP variation induced by the sympathetic ganglion blocker hexamethonium, adiposity index, leptin, fasting glucose (GJ), total cholesterol and TAG levels. The thresholds for small, medium and large effects were 0·20, 0·50 and 0·80, respectively. Complete sample statistical analyses are shown in the online Supplementary material.
Results
G0HF and G1HF female genitors
The G0HF showed decreased food intake (13 (SEM 2·1) g/d, n 6), water intake (8·8 (SEM 3·9) ml/d, n 6), increased body mass gain (287 (SEM 5·84) g, n 6) and coefficient of food efficiency (0·045 (SEM 0·006) kcal/g per d, n 6) compared with G0CF rats (21 (SEM 2·8), 12·8 (SEM 3·4), 243 (SEM 3·48), 0·040 (SEM 0·002), n 6, respectively), with no change in energy intake (69·4 (SEM 2·75), 78·7 (SEM 3·72) kcal/d, n 6, respectively) (Fig. 2(a)). The G1HF daughters of G0HF fed only the C diet showed increased body mass gain (256 (SEM 6·03), n 5) compared with the G1CF rats (216 (SEM 6·14), n 7), without any changes in energy intake (Fig. 3(a)), water intake (29·1 (SEM 4·3) G1CF, 32·6 (SEM 3·9) G1HF, n 6) and coefficient of food efficiency (0·031 (SEM 0·001) G1CF, 0·037 (SEM 0·003) G1HF). In addition, the G0HF and G1HF showed increased blood levels of leptin, GJ, TAG, HOMA-IR and MAP and reduction in MAP variation induced by hexamethonium, the sympathetic ganglion blocker when compared with their corresponding G0CF and G1CF groups. G0HF genitors showed an increase in the adiposity index and reduction in HOMA-β, with no change in blood levels of total cholesterol compared with G0CF group. However, the G1HF genitor showed increased total cholesterol and HOMA-IR, with no change in adiposity index, blood levels of insulin and HOMA-β compared with the G1CF group. There was no difference in the sensitivity of reflex bradycardia in G0HF and G1HF animals compared with their respective controls (Figs. 2 and 3).
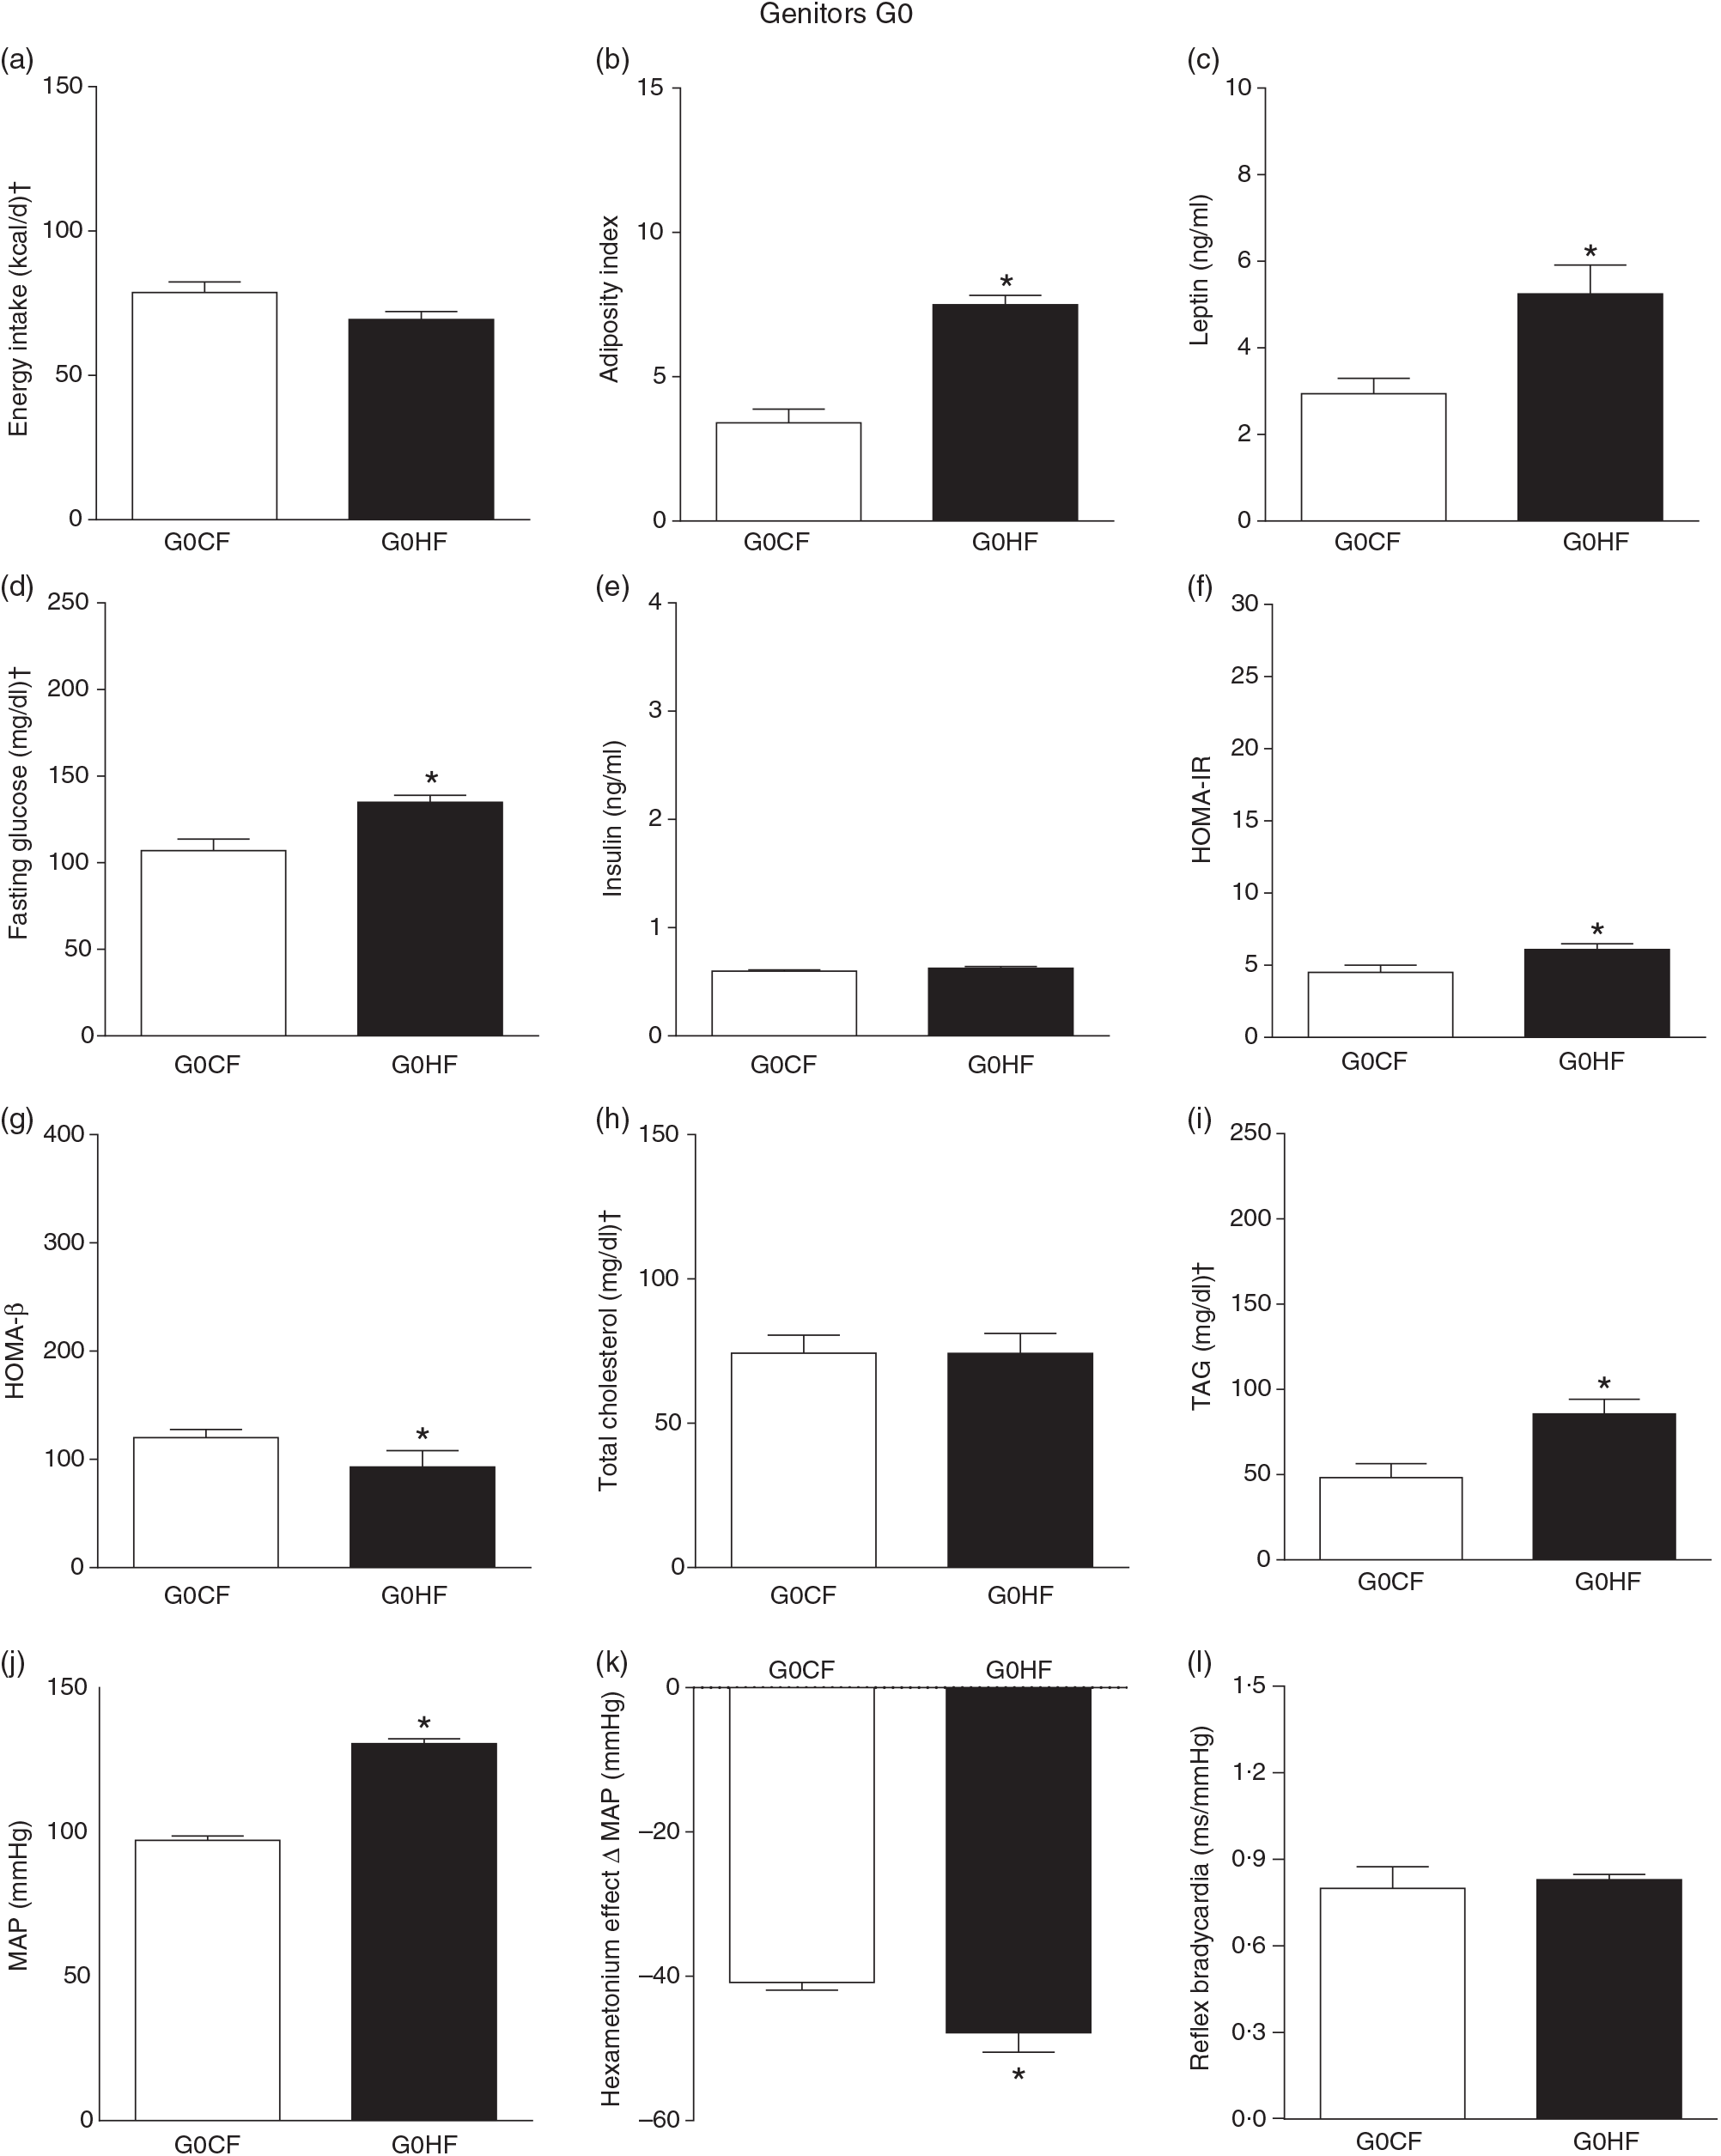
Fig. 2. Biometrical, biochemical and haemodynamic parameters of female G0 genitors subjected to high-fat (H; G0HF) or control (C; G0CF) diet during mating, gestation and breast-feeding (59 d). (a) Energy intake (kcal/d). (b) Adiposity index. (c) Plasma levels of leptin (ng/ml). (d) Fasting glucose (mg/dl). (e) Plasma levels of insulin (ng/ml). (f) Homeostatic model assessment of insulin resistance (HOMA-IR). (g) Homeostasis evaluation of the functional capacity of β cells (HOMA-β). (h) Plasma total cholesterol levels (mg/dl). (i) Plasma total TAG levels (mg/dl). (j) Mean arterial pressure (MAP, mmHg). (k) Variation in MAP induced by the hexamethonium ganglionic blocker (Δ mmHg). (l) Sensitivity of reflex bradycardia (ms/mmHg). * P < 0·05 compared with the G0CF group (Student’s t test). † To convert energy in kcal to kJ, multiply by 4·184. To convert glucose in mg/dl to mmol/l, multiply by 0·0555. To convert cholesterol in mg/dl to mmol/l, multiply by 0·0259. To convert TAG in mg/dl to mmol/l, multiply by 0·0113.
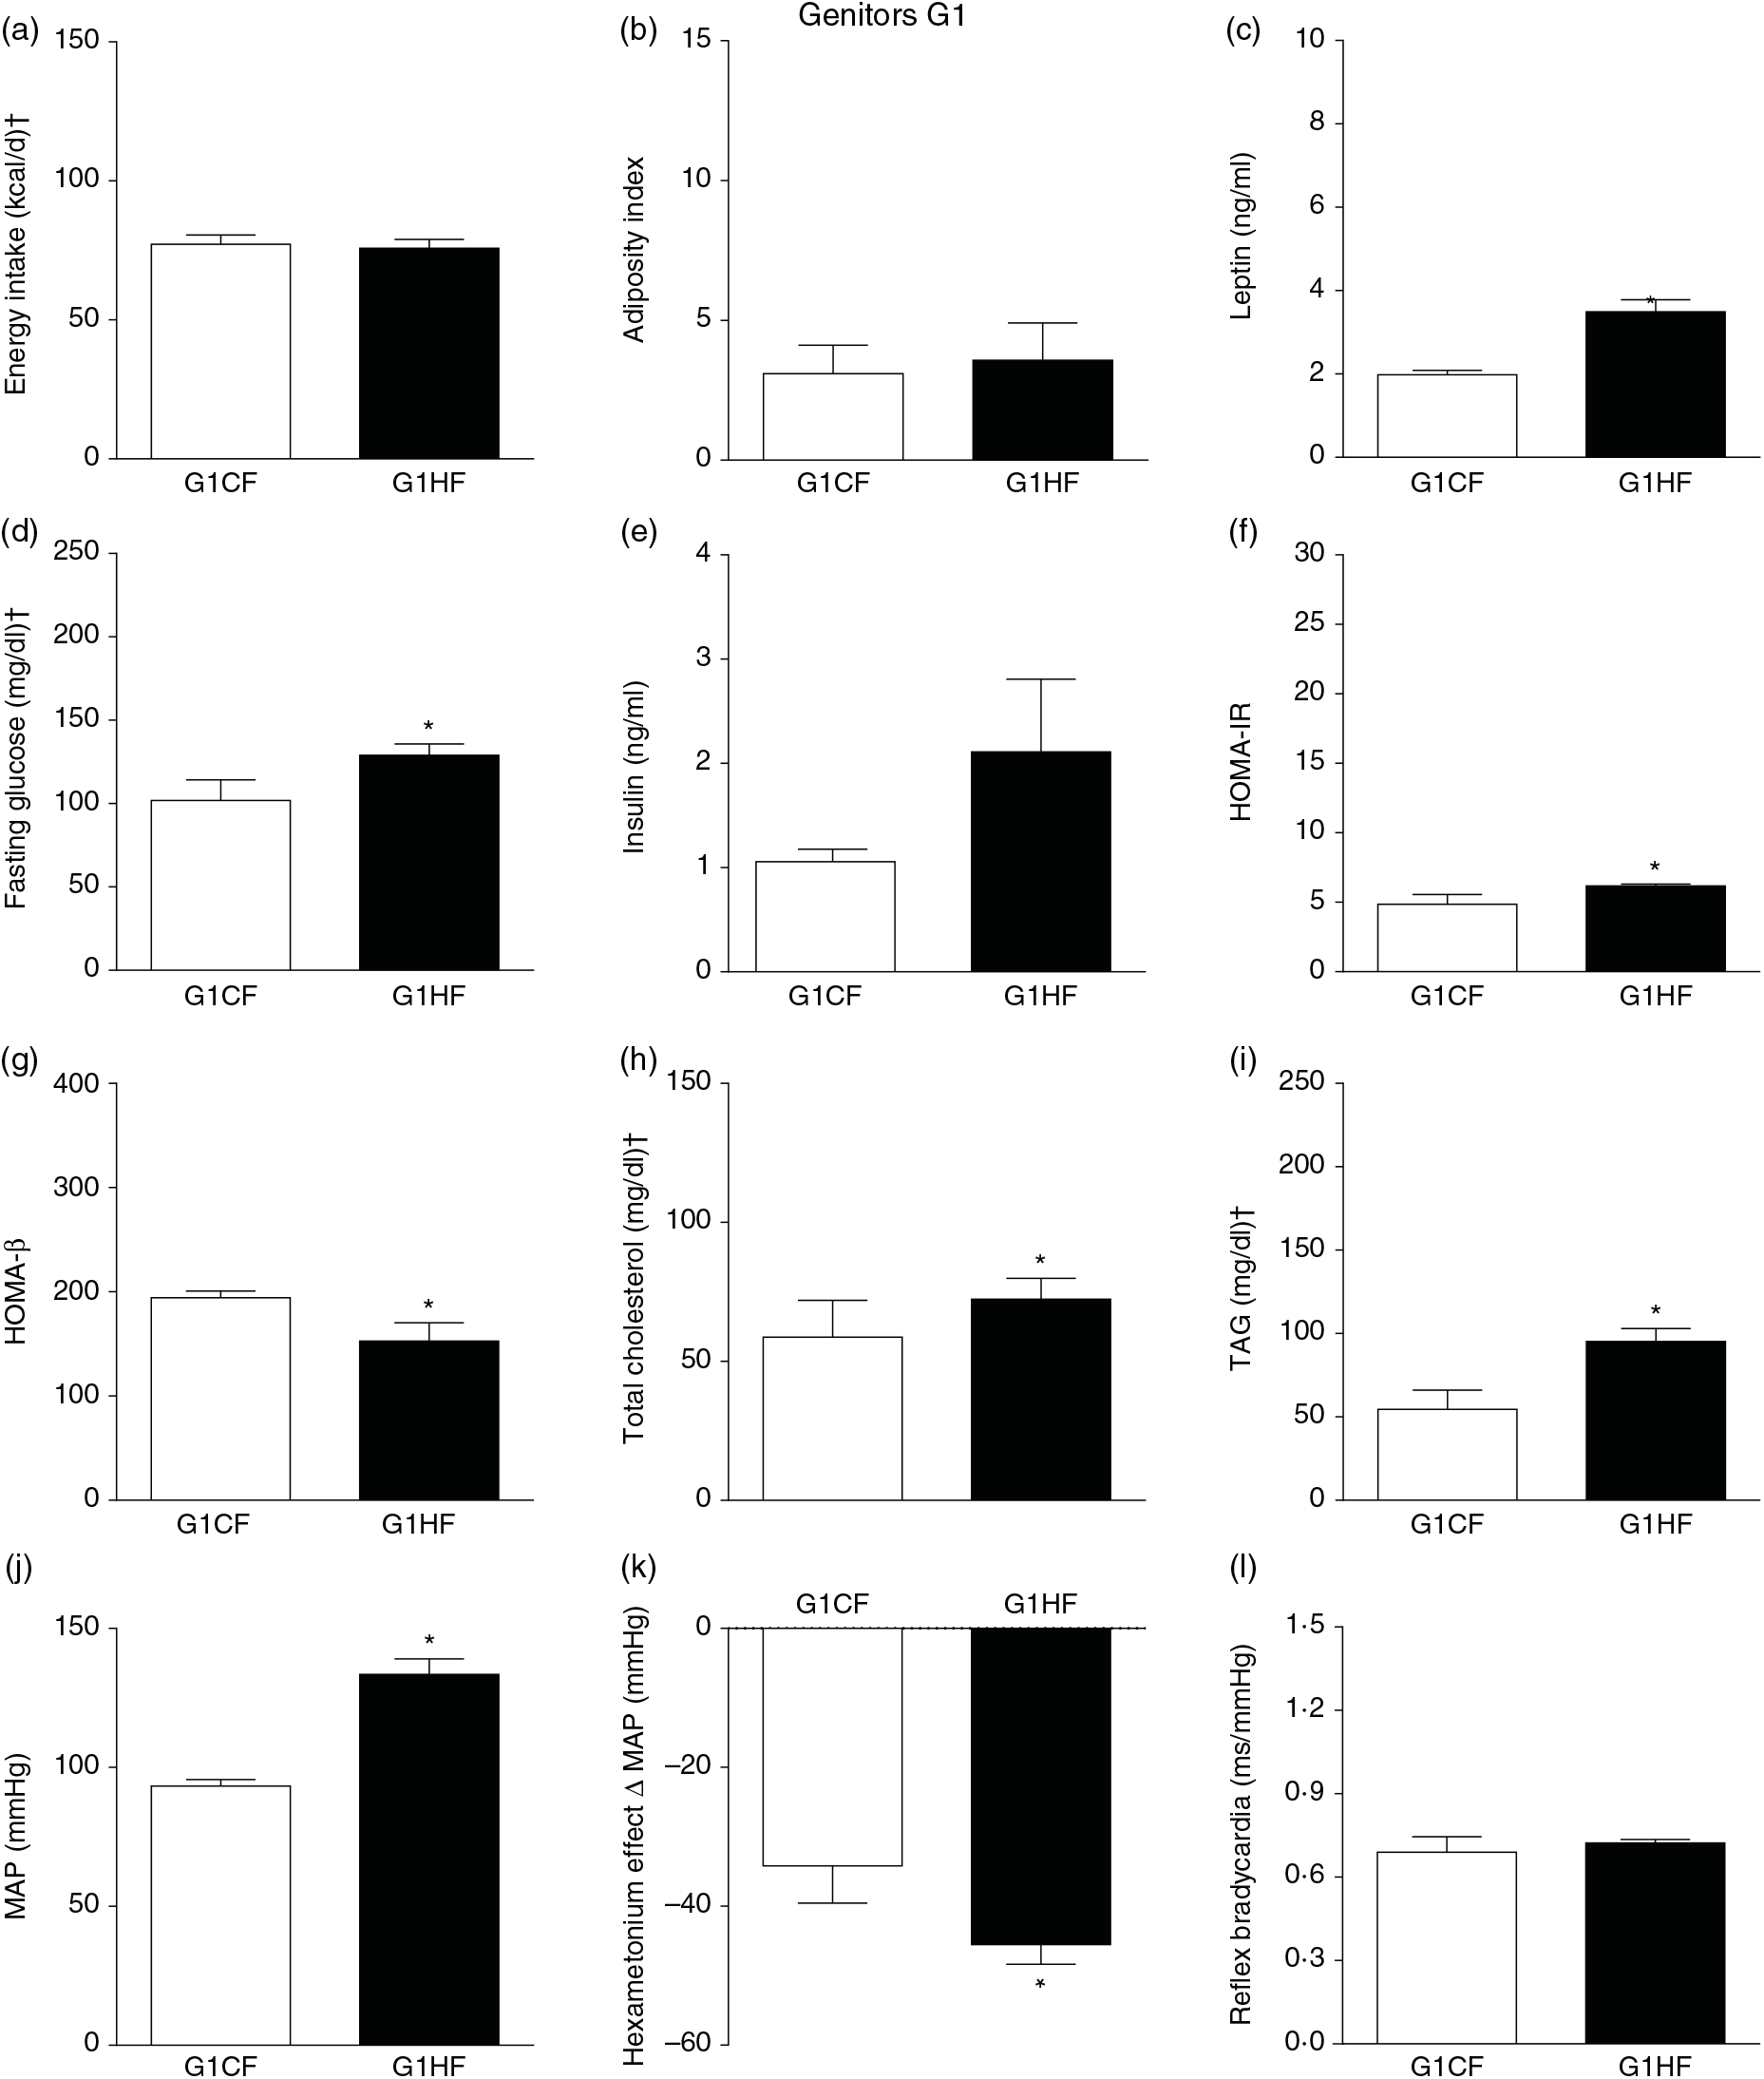
Fig. 3. Biometrical, biochemical and haemodynamic parameters of female G1 genitors whose parents were fed high-fat (H, G1HF) or control (C, G1CF) diet, who consumed only the C diet. (a) Energy intake (kcal/d). (b) Adiposity index. (c) Plasma levels of leptin (ng/ml). (d) Fasting glucose (mg/dl). (e) Plasma levels of insulin (ng/ml). (f) Homeostatic model assessment of insulin resistance (HOMA-IR). (g) Homeostasis evaluation of the functional capacity of β cells (HOMA-β). (h) Plasma total cholesterol levels (mg/dl). (i) Plasma total TAG levels (mg/dl). (j) Mean arterial pressure (MAP, mmHg). (k) Variation in MAP induced by the hexamethonium ganglionic blocker (Δ mmHg). (l) Sensitivity of reflex bradycardia (ms/mmHg). * P < 0·05 compared with the G1CF group (Student’s t test). † To convert energy in kcal to kJ, multiply by 4·184. To convert glucose in mg/dl to mmol/l, multiply by 0·0555. To convert cholesterol in mg/dl to mmol/l, multiply by 0·0259. To convert TAG in mg/dl to mmol/l, multiply by 0·0113.
G0HM and G1HM male genitors
Male rats were fed with the H diet (G0HM) only during mating (10 d) showed an increase in the body mass gain (335 (SEM 7·7) g, n 7), basal MAP (126 (SEM 4) mmHg, n 7) and HR (408 (SEM 15) beats/min, n 7) in comparison with the G0CM group (310 (SEM 4·6), 112 (SEM 4), 371 (SEM 7), n 8, respectively). There was no significant difference in the adiposity index, GJ, total cholesterol and TAG between the G0CM and G0HM groups (data not shown).
The G1HM genitors that were fed only the C diet, whose genitors were G0HF and G0HM, had an increase in GJ (96·5 (SEM 6·8) mg/dl, n 7) and TAG levels (207 (SEM 14·7) mg/dl, n 7) in comparison with their G1CM group (82·6 (SEM 2·41), 152 (SEM 3·6), n 6, respectively). No significant difference was observed in the adiposity index, body mass gain, total cholesterol, basal MAP and HR among groups G1CM and G1HM (data not shown). (To convert GJ in mg/dl to mmol/l, multiply by 0·0555. To convert TAG in mg/dl to mmol/l, multiply by 0·0113.)
F1HF and F2HF female offspring
The F1HF and F2HF showed an increase in food intake (24 (SEM 5·4) g/d, n 9, F1HF and 25 (SEM 5·5), n 15, F2HF), water intake (23 (SEM 6·8) ml/d, n 9, F1HF and 26·8 (SEM 7·4), n 15, F2HF), coefficient of food efficiency (0·072 (SEM 0·003) kcal/g per d, n 5, F1HF and 0·079 (SEM 0·011), n 7, F2HF), body mass gain (218 (SEM 5·14) g, n 9, F1HF and 209·1 (SEM 2·07), n 15, F2HF) compared with the F1CF (14 (SEM 2·9), n 18; 18 (SEM 6·1), n 18; 0·061 (SEM 0·002), n 6; 192 (SEM 3·9), n 15, respectively) and F2CF (14·7 (SEM 3·0), n 12; 19·5 (SEM 10·3), n 12; 0·047 (SEM 0·001), n 7; 187 (SEM 1·82), n 12, respectively). In addition, the F1HF and F2HF rats presented an increase in energy intake, adiposity index, plasma leptin levels, fasting plasma glucose, HOMA-IR and reduction in HOMA-β; and increase in plasma levels of total cholesterol and TAG and MAP and a greater reduction in MAP variation induced by hexamethonium, the sympathetic ganglion blocker compared with the F1CF and F2CF, respectively (Figs. 4 and 5). However, no difference was observed in the sensitivity of reflex bradycardia in F1HF, F2HF, F1CF and F2CF groups (Figs. 4 and 5).
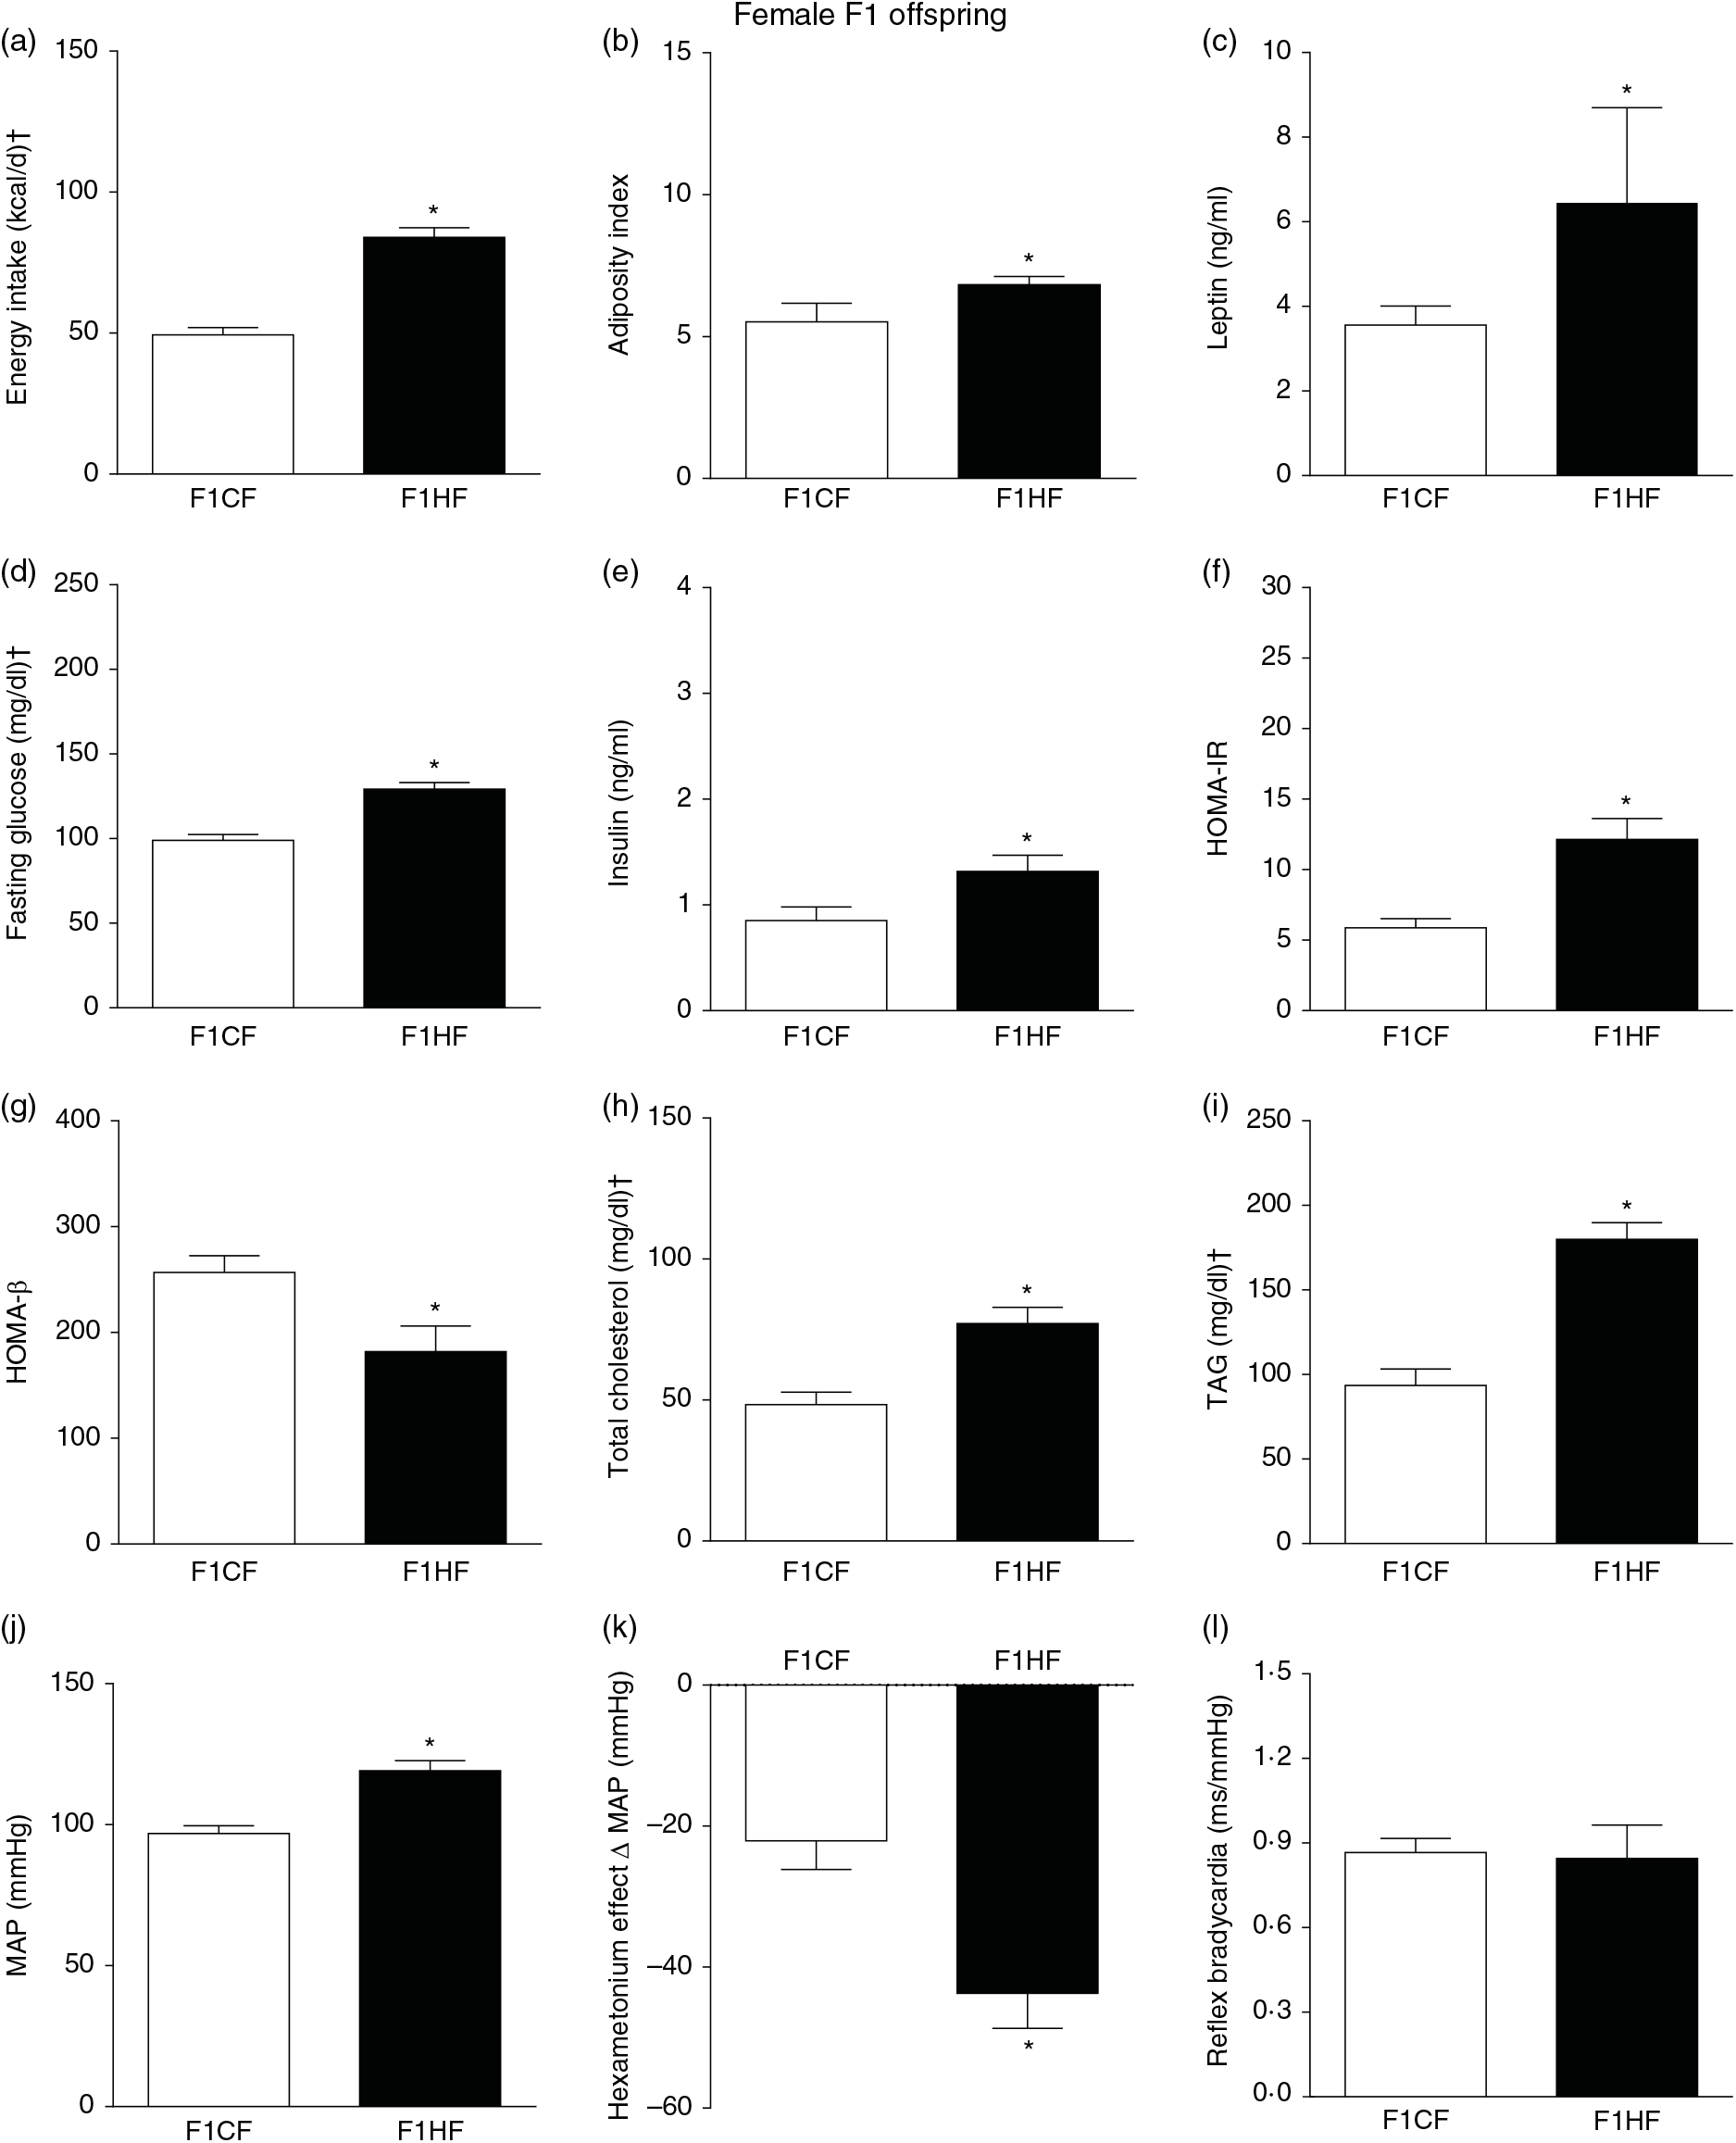
Fig. 4. Biometrical, biochemical and haemodynamic parameters of female F1 offspring whose parents were fed high-fat (H, F1HF) or control (C, F1CF) diet, who consumed only the C diet. (a) Energy intake (kcal/d). (b) Adiposity index. (c) Plasma levels of leptin (ng/ml). (d) Fasting glucose (mg/dl). (e) Plasma levels of insulin (ng/ml). (f) Homeostatic model assessment of insulin resistance (HOMA-IR). (g) Homeostasis evaluation of the functional capacity of β cells (HOMA-β). (h) Plasma total cholesterol levels (mg/dl). (i) Plasma total TAG levels (mg/dl). (j) Mean arterial pressure (MAP, mmHg). (k) Variation in MAP induced by the hexamethonium ganglionic blocker (Δ mmHg). (l) Sensitivity of reflex bradycardia (ms/mmHg). * P < 0·05 compared with the F1CF group (Student’s t test). † To convert energy in kcal to kJ, multiply by 4·184. To convert glucose in mg/dl to mmol/l, multiply by 0·0555. To convert cholesterol in mg/dl to mmol/l, multiply by 0·0259. To convert TAG in mg/dl to mmol/l, multiply by 0·0113.
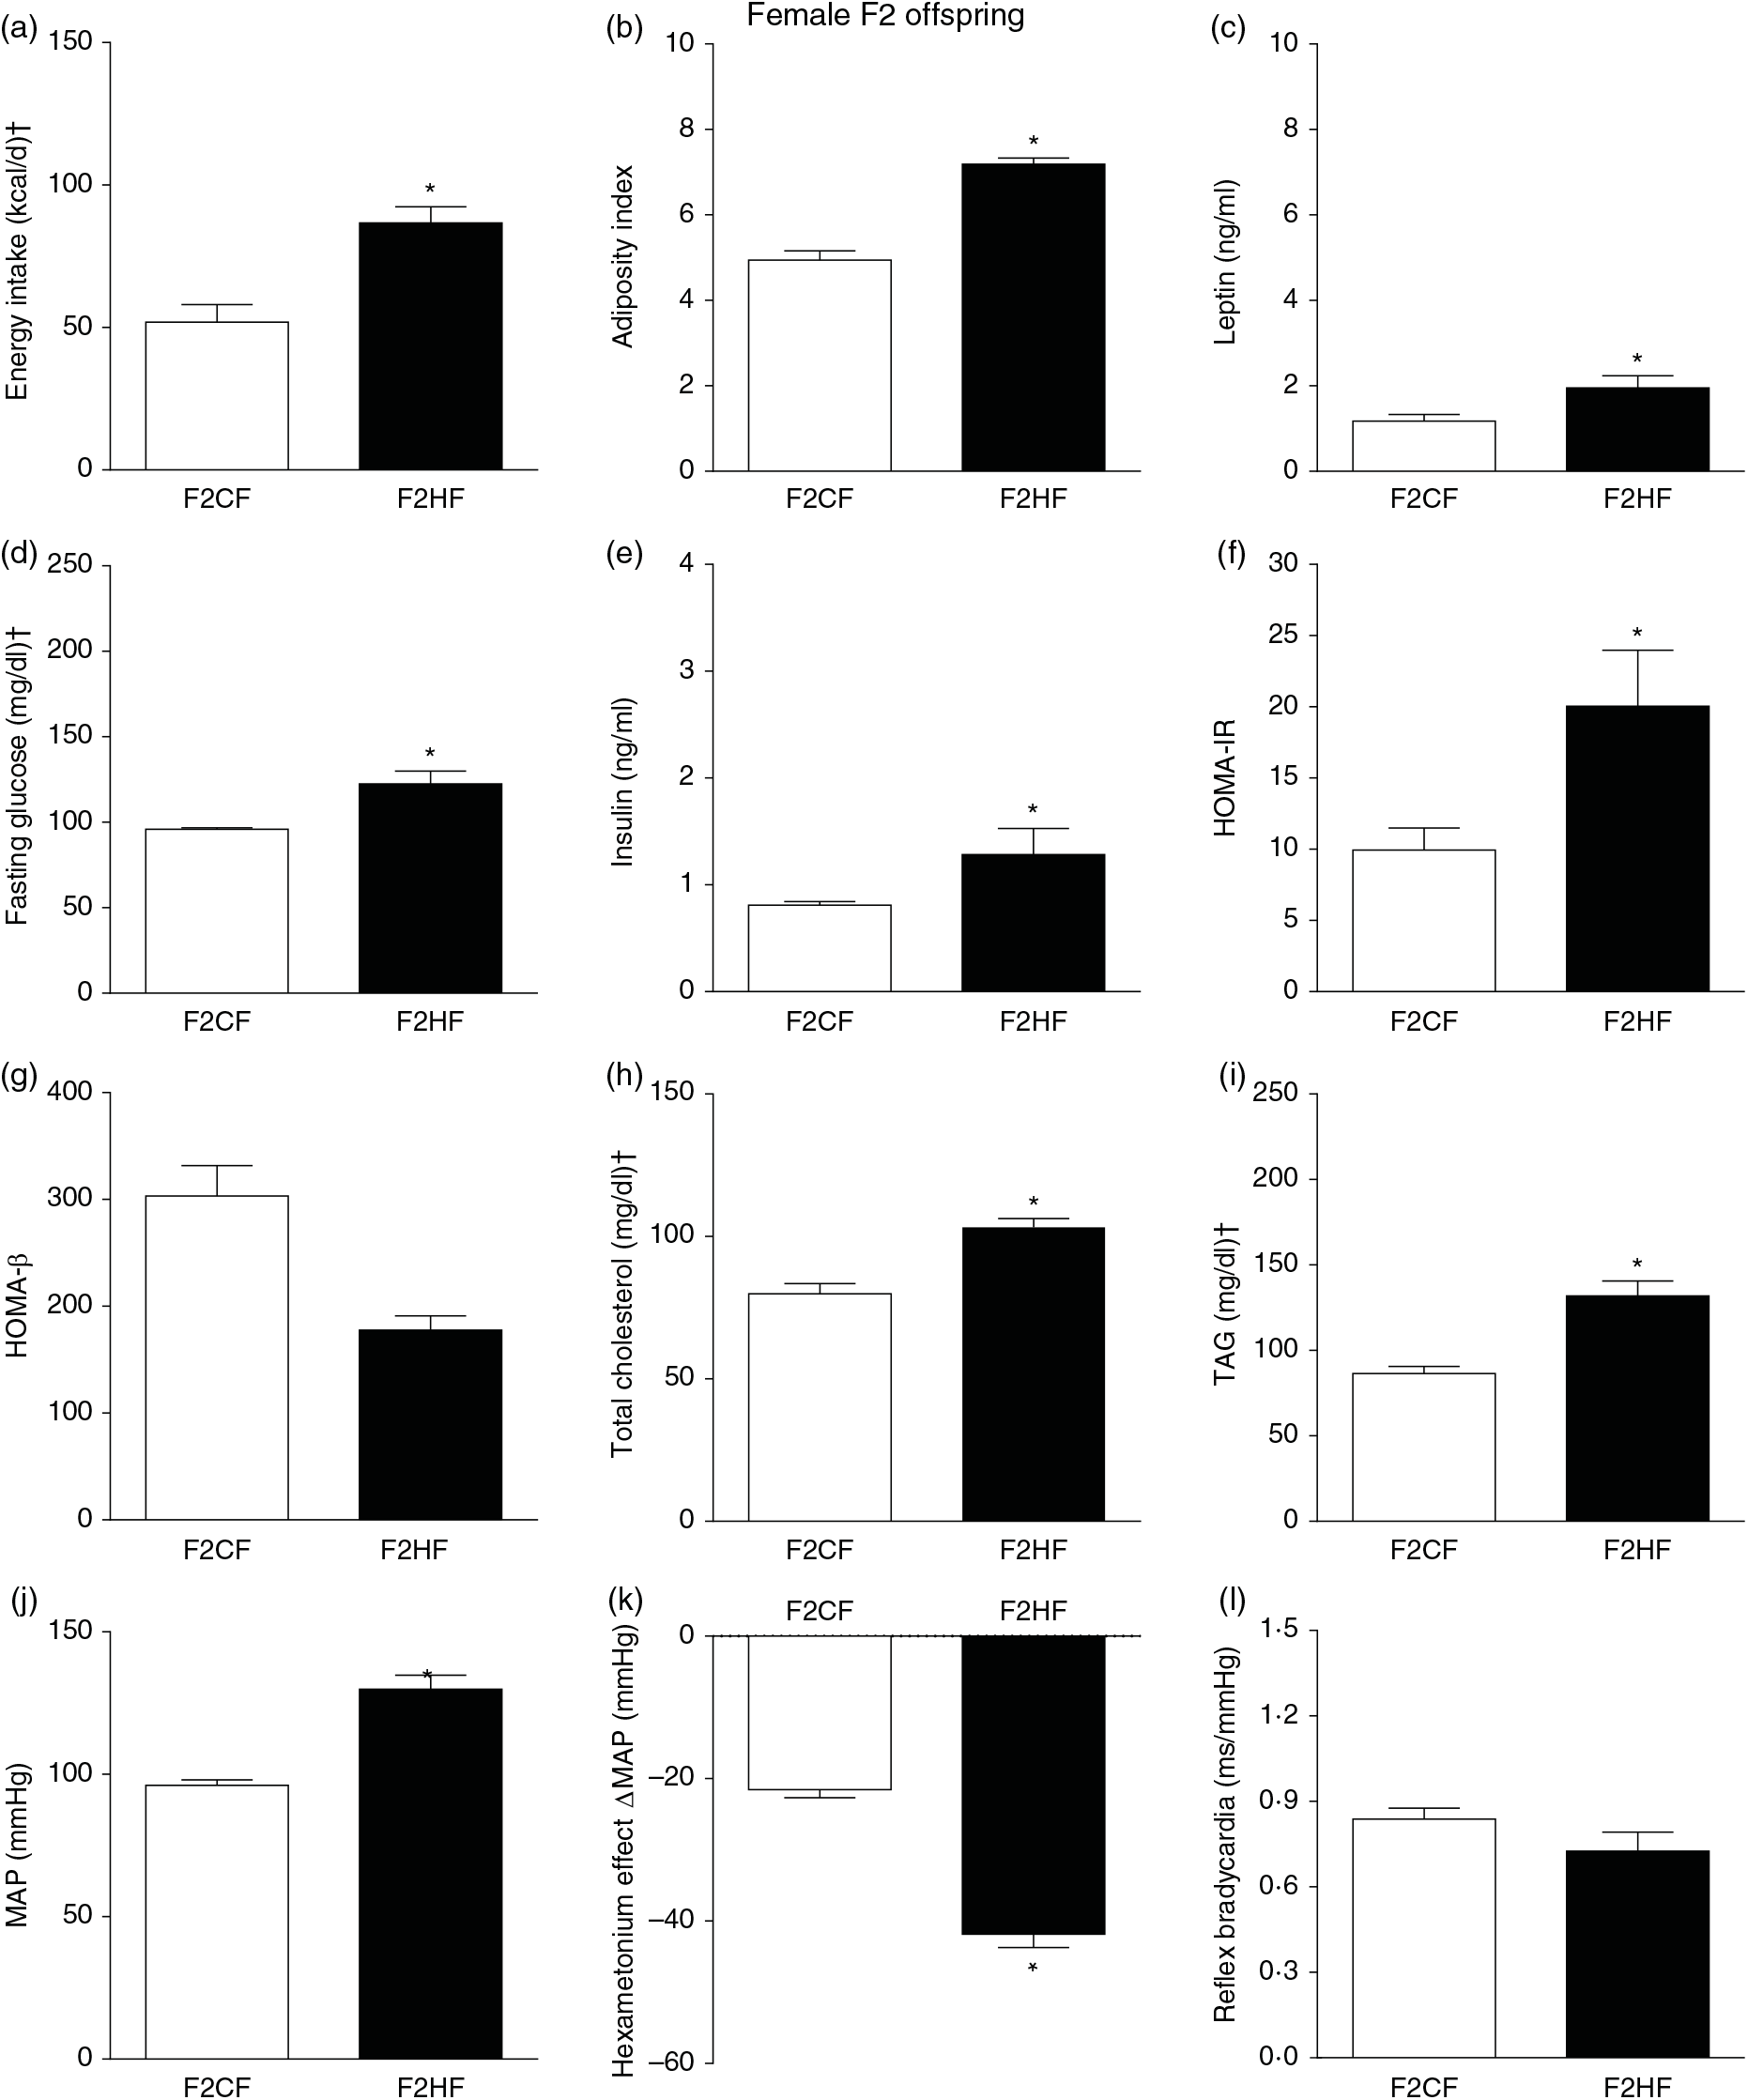
Fig. 5. Biometrical, biochemical and haemodynamic parameters of female F2 offspring, whose genitors were fed high-fat (H, F2HF) or control (C, F2CF) diet, who ate only the C diet. (a) Energy intake (kcal/d). (b) Adiposity index. (c) Plasma levels of leptin (ng/ml). (d) Fasting glucose (mg/dl). (e) Plasma levels of insulin (ng/ml). (f) Homeostatic model assessment of insulin resistance (HOMA-IR). (g) Homeostasis evaluation of the functional capacity of β cells (HOMA-β). (h) Plasma total cholesterol levels (mg/dl). (i) Plasma total TAG levels (mg/dl). (j) Mean arterial pressure (MAP, mmHg). (k) Variation in MAP induced by the hexamethonium ganglionic blocker (Δ mmHg). (l) Sensitivity of reflex bradycardia (ms/mmHg). * P < 0·05 compared with the F2CF group (Student’s t test). † To convert energy in kcal to kJ, multiply by 4·184. To convert glucose in mg/dl to mmol/l, multiply by 0·0555. To convert cholesterol in mg/dl to mmol/l, multiply by 0·0259. To convert TAG in mg/dl to mmol/l, multiply by 0·0113.
F1HM and F2HM male offspring
F1HM and F2HM showed increased food intake (32·3 (SEM 4·4) g/d, n 14, F1HM and 33 (SEM 5·5), n 12, F2HM), water intake (24 (SEM 4·3) ml/d, n 14; F1HM and 26 (SEM 4·1), n 12, F2HM), coefficient of food efficiency (0·095 (SEM 0·004) kcal/g per d, n 5, F1HM and 0·098 (SEM 0·003), n 6, F2HM) and body mass gain (341 (SEM 1·3) g, n 14, F1HM and 336 (SEM 2·6), n 12; F2HM) compared with the F1CM (18 (SEM 4·9), n 16; 12 (SEM 5·5), n 16; 0·081 (SEM 0·002), n 6; 299 (SEM 0·70), n 16, respectively) and F2CM (19 (SEM 5·0), n 11; 18 (SEM 3·7), n 11; 0·078 (SEM 0·003), n 6; 266 (SEM 0·47), n 11, respectively). In addition, the F1HM and F2HM rats demonstrated increased energy intake, adiposity index, plasma leptin levels, GJ levels, insulin, HOMA-IR and reduction in HOMA-β; and increase in plasma TAG levels, MAP and a greater reduction in MAP variation induced by hexamethonium, the sympathetic ganglion blocker compared with the F1CM and F2CM, respectively (Figs. 6 and 7). Only F1HM offspring showed an increase in plasma levels of total cholesterol (Fig. 7). No difference was observed in the sensitivity of reflex bradycardia among the F1CM, F1HM, F2CM and F2HM groups (Figs. 6 and 7).
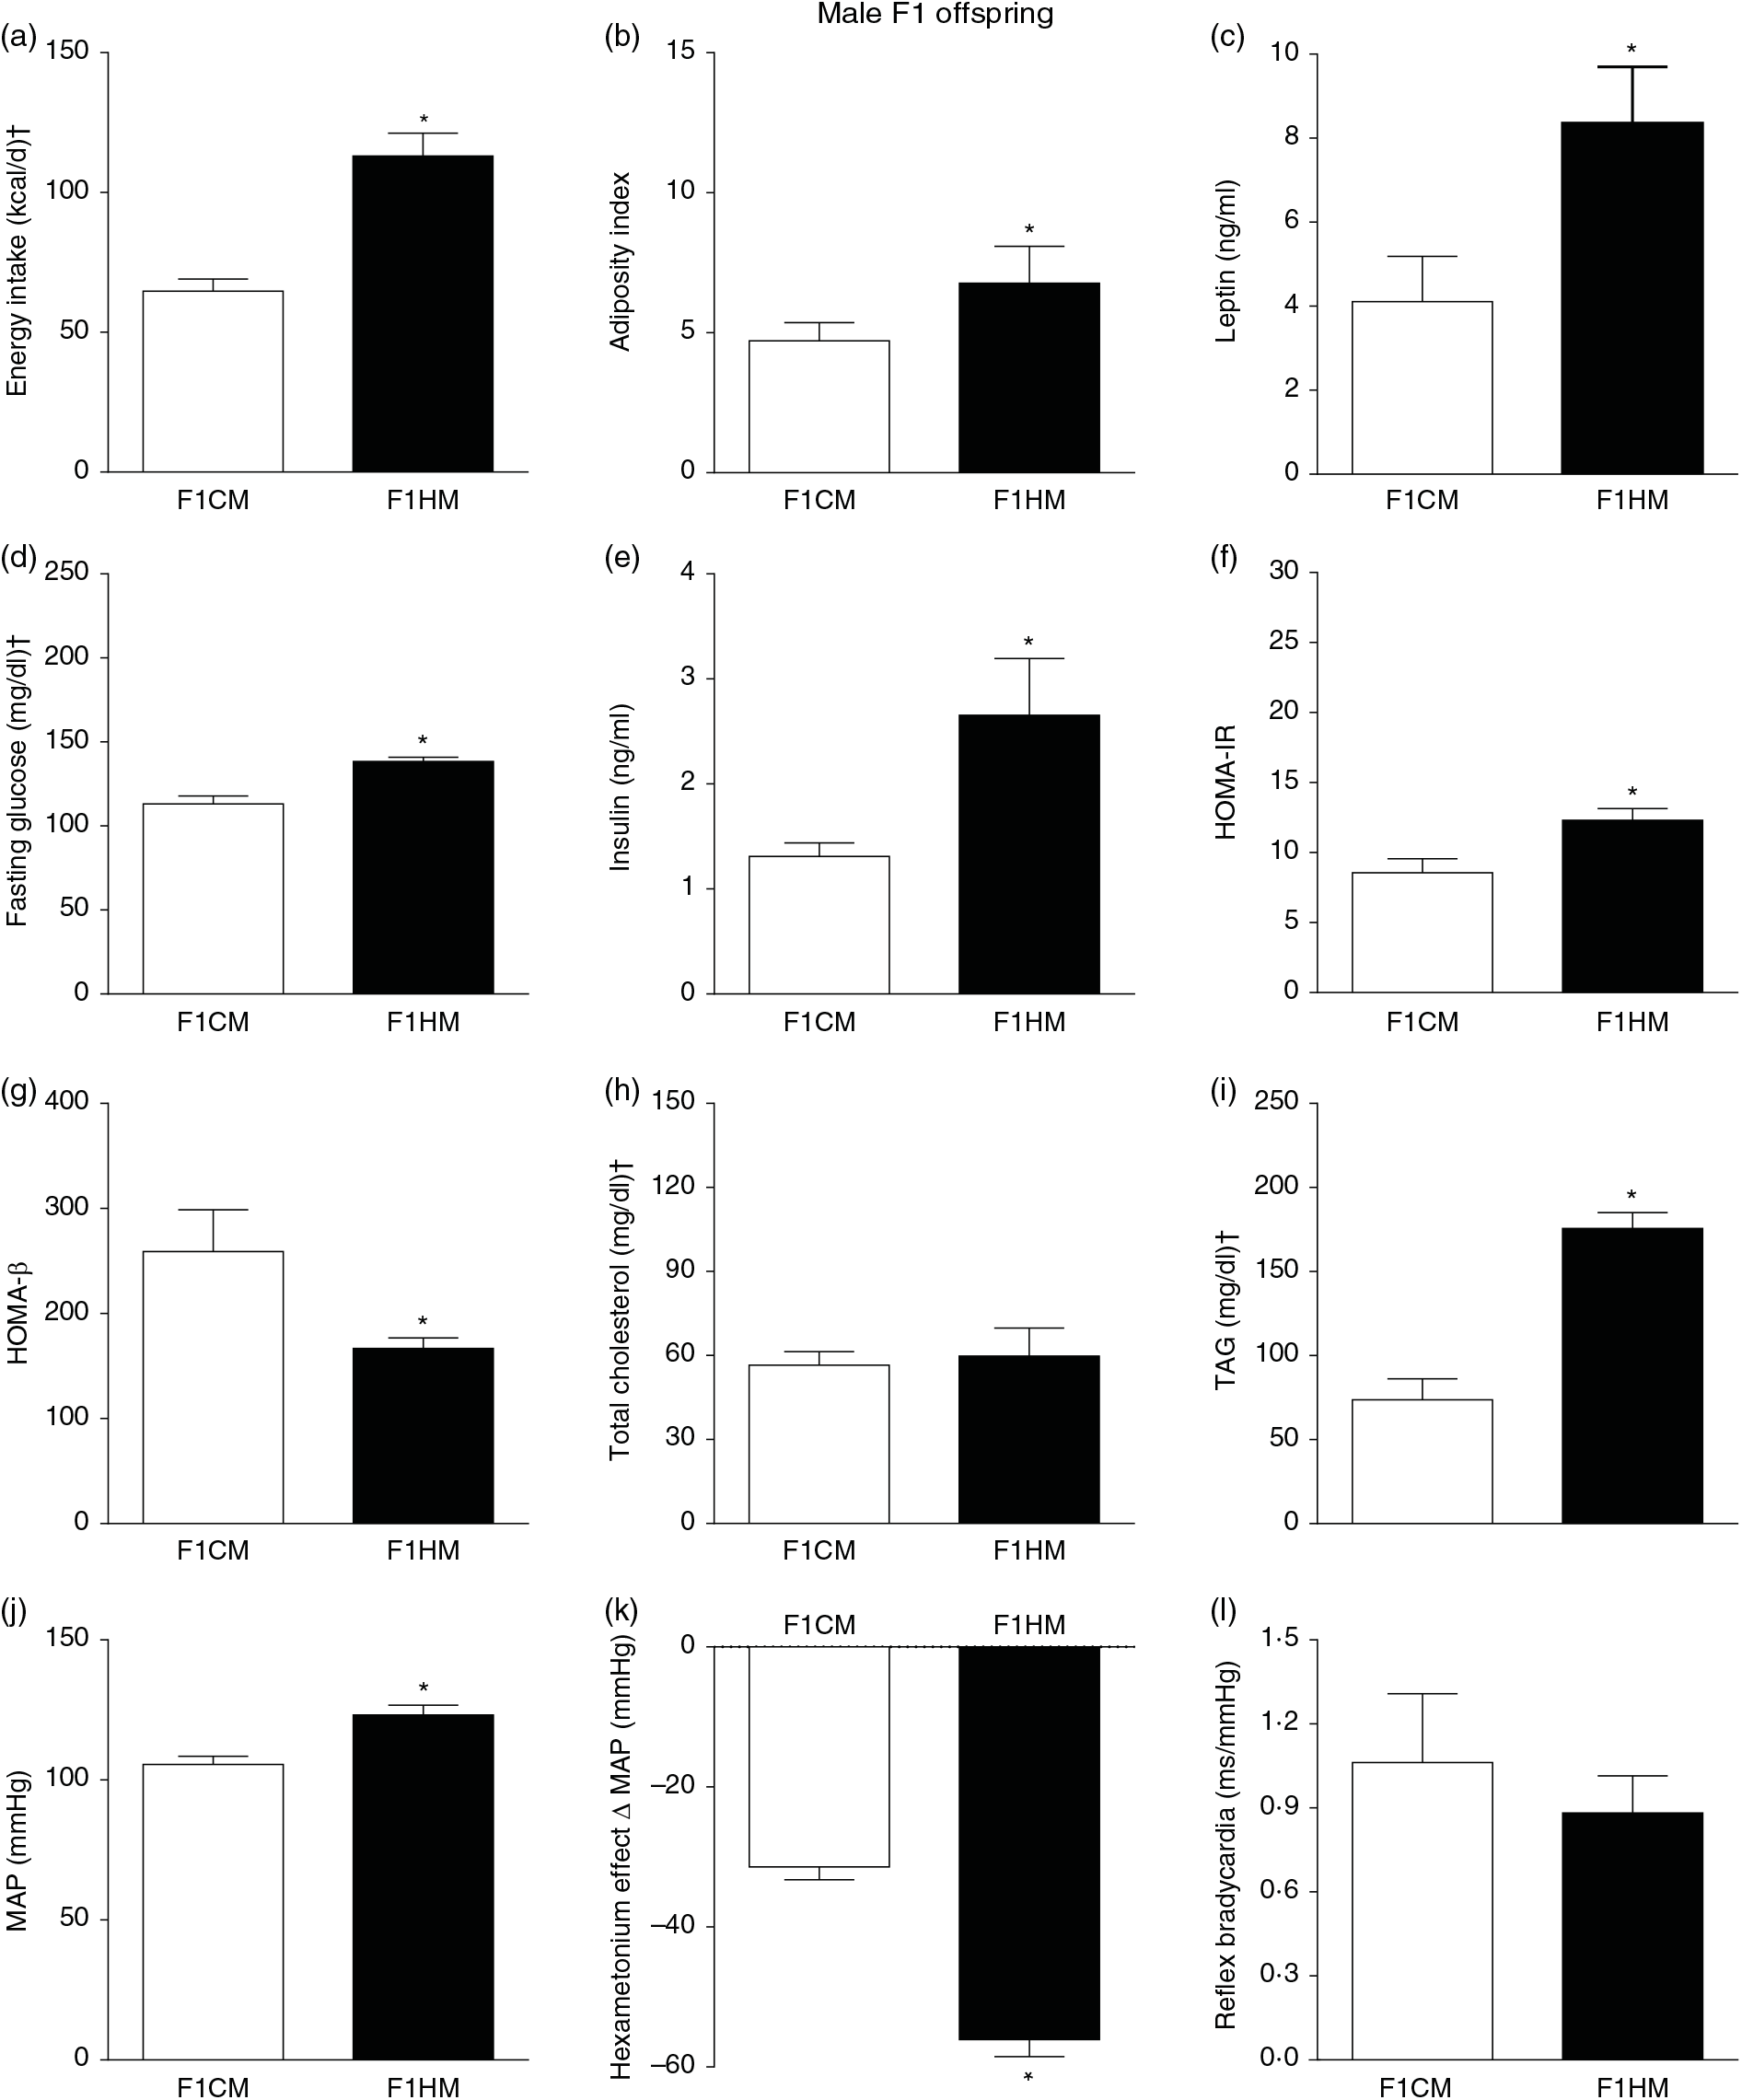
Fig. 6. Biometrical, biochemical and haemodynamic parameters of male F1 offspring, whose parents were fed high-fat (H, F1HM) or control (C, F1CM) diet, who consumed only the C diet. (a) Energy intake (kcal/d). (b) Adiposity index. (c) Plasma levels of leptin (ng/ml). (d) Fasting glucose (mg/dl). (e) Plasma levels of insulin (ng/ml). (f) Homeostatic model assessment of insulin resistance (HOMA-IR). (g) Homeostasis evaluation of the functional capacity of β cells (HOMA-β). (h) Plasma total cholesterol levels (mg/dl). (i) Plasma total TAG levels (mg/dl). (j) Mean arterial pressure (MAP, mmHg). (k) Variation in MAP induced by the hexamethonium ganglionic blocker (Δ mmHg). (l) Sensitivity of reflex bradycardia (ms/mmHg). * P < 0·05 compared with the F1CM group (Student’s t test). † To convert energy in kcal to kJ, multiply by 4·184. To convert glucose in mg/dl to mmol/l, multiply by 0·0555. To convert cholesterol in mg/dl to mmol/l, multiply by 0·0259. To convert TAG in mg/dl to mmol/l, multiply by 0·0113.
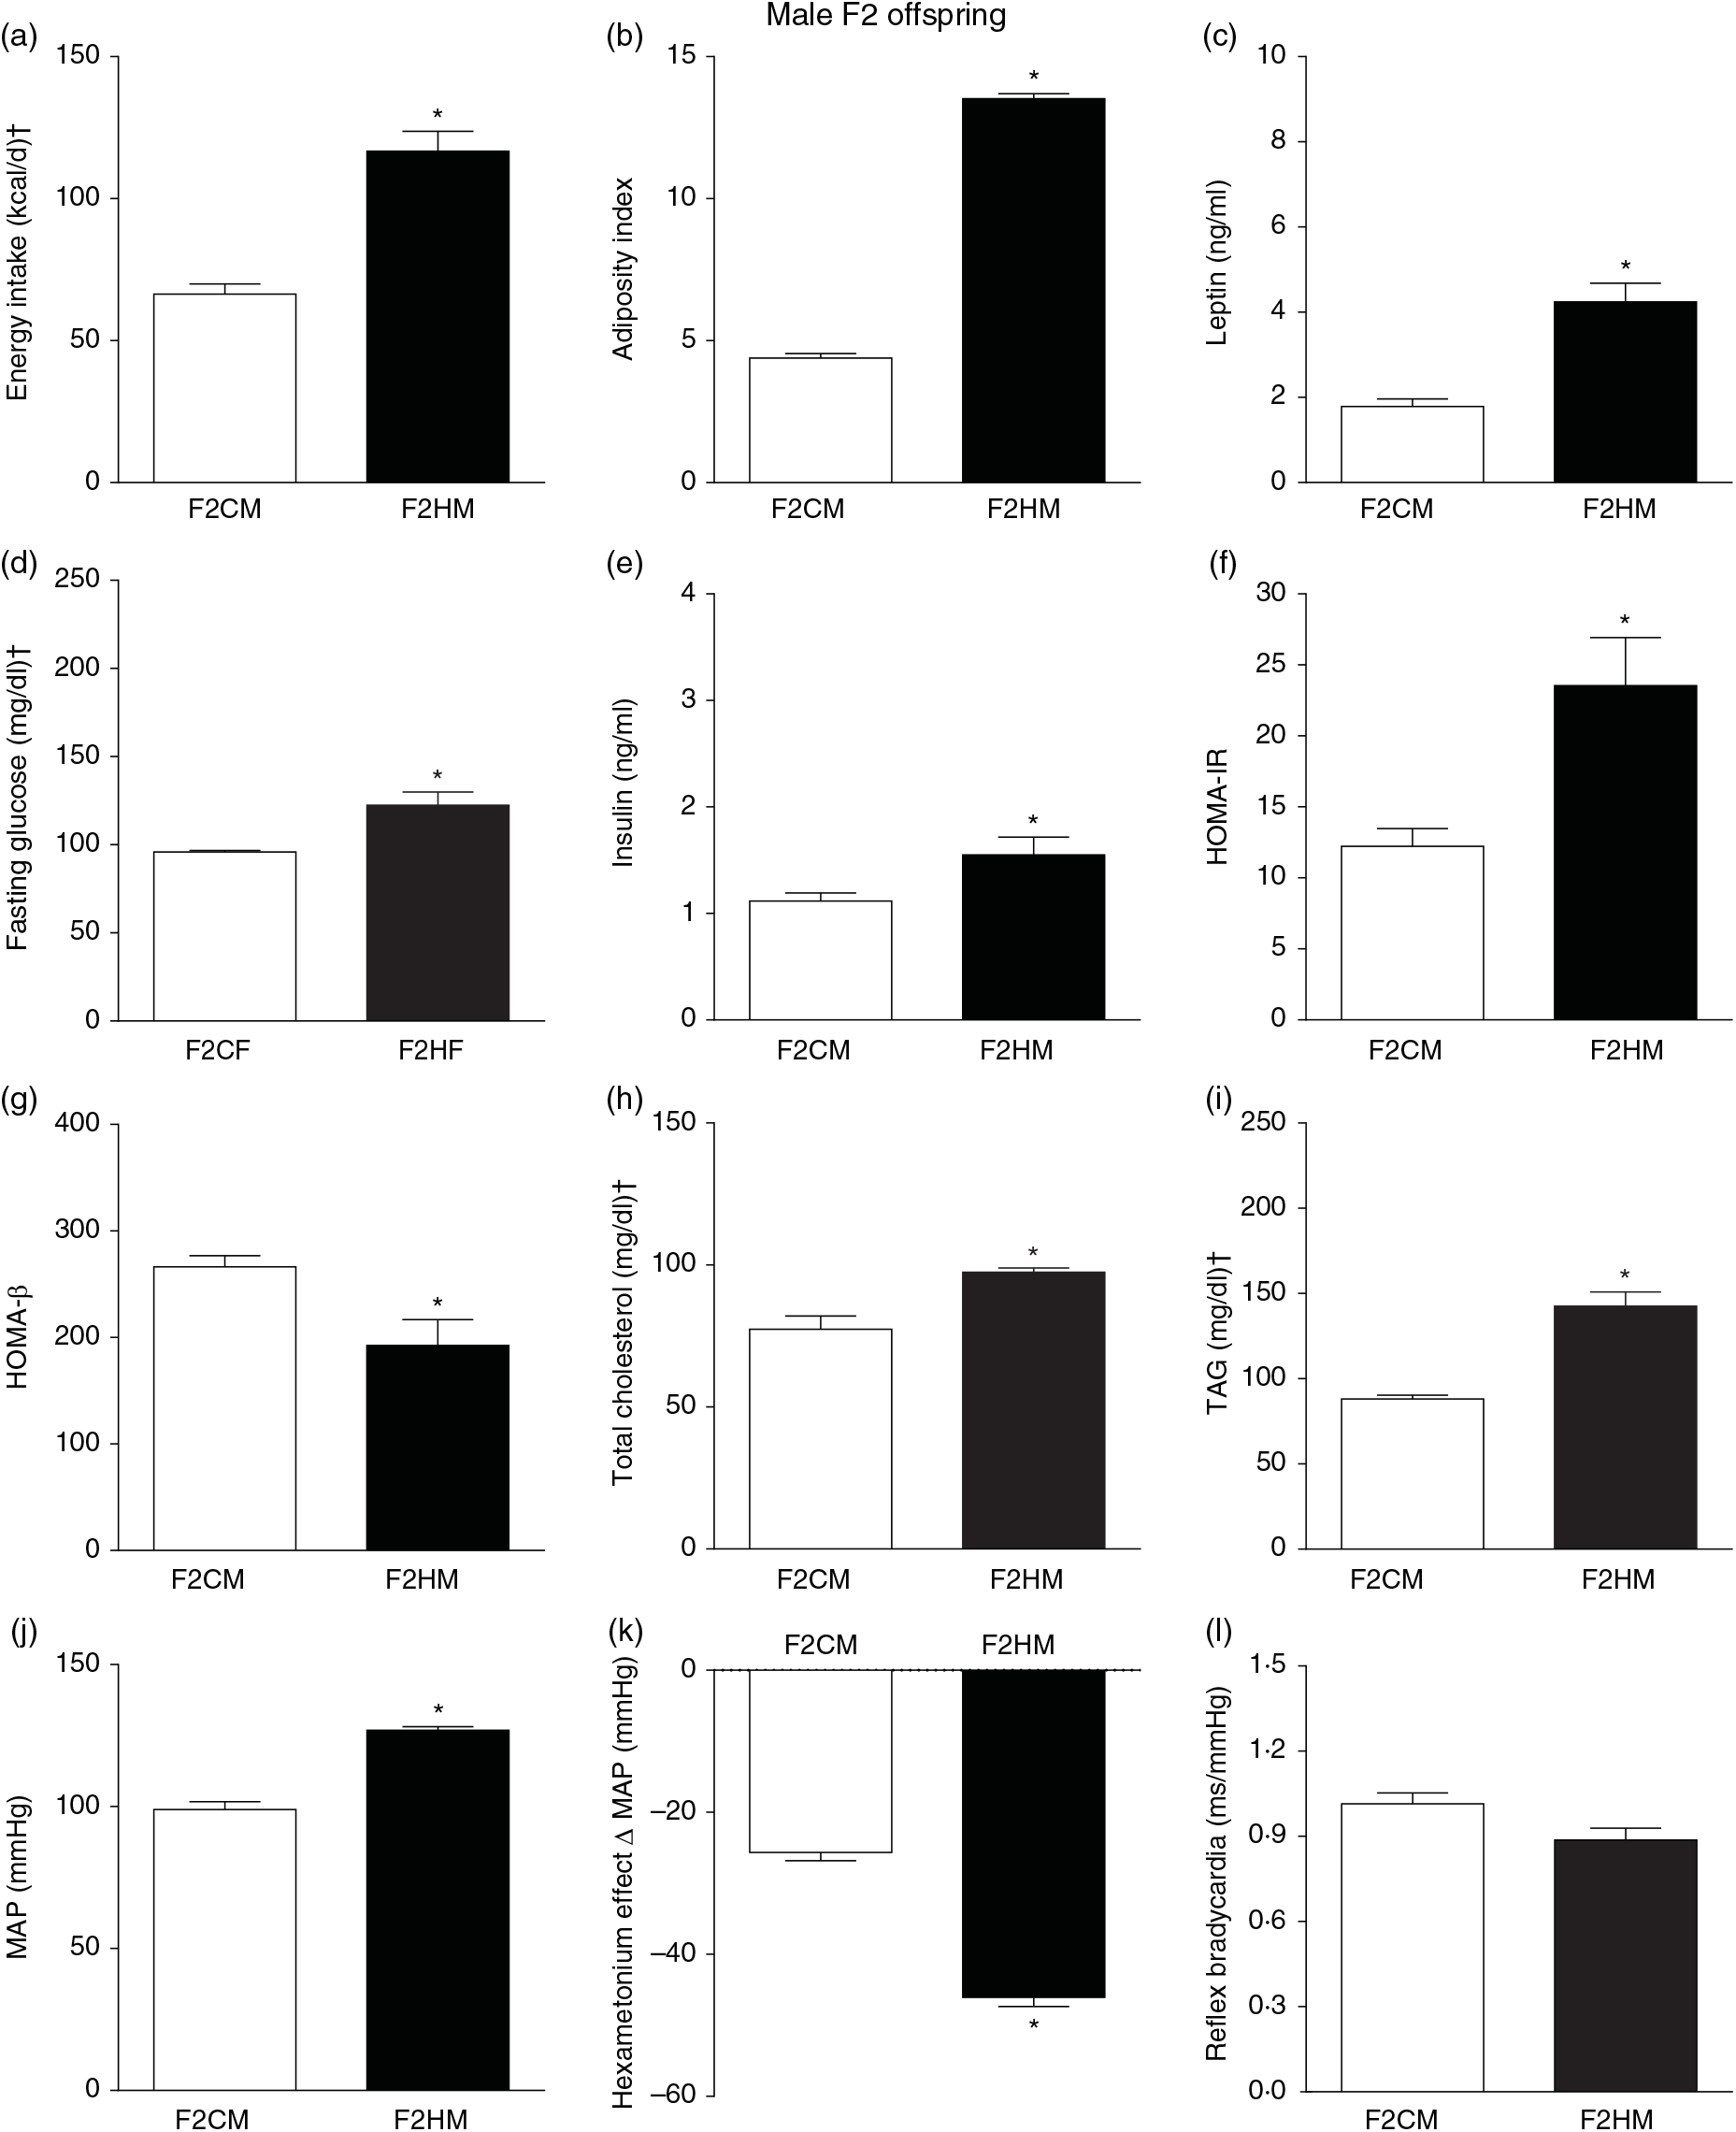
Fig. 7. Biometrical, biochemical and haemodynamic parameters of male F2 offspring, whose genitors were fed high-fat (H, F2HM) or control (C, F2CM) diet, who ate only the C diet. (a) Energy intake (kcal/d). (b) Adiposity index. (c) Plasma levels of leptin (ng/ml). (d) Fasting glucose (mg/dl). (e) Plasma levels of insulin (ng/ml). (f) Homeostasis evaluation of insulin resistance (HOMA-IR). (g) Homeostasis evaluation of the functional capacity of β cells (HOMA-β). (h) Plasma total cholesterol levels (mg/dl). (i) Plasma total TAG levels (mg/dl). (j) Mean arterial pressure (MAP, mmHg). (k) Variation in MAP induced by the hexamethonium ganglionic blocker (Δ mmHg). (l) Sensitivity of reflex bradycardia (ms/mmHg). * P < 0·05 compared with the F2CM group (Student’s t test). † To convert energy in kcal to kJ, multiply by 4·184. To convert glucose in mg/dl to mmol/l, multiply by 0·0555. To convert cholesterol in mg/dl to mmol/l, multiply by 0·0259. To convert TAG in mg/dl to mmol/l, multiply by 0·0113.
Discussion
In summary, our data show that the genitors subjected to the H diet demonstrated disorders characteristic of the MetS, which in turn were transferred to F1 and F2 offspring, even when they were fed the C diet after weaning. Interestingly, rats fed the H diet (G0HF) adjusted energy consumption through lower food intake. However, although the F1H and F2H offspring were fed only the C diet after weaning, these rats showed increased diet and energy intake. In spite of this difference in energy intake observed between genitors and offspring, all these animals showed several cardio-metabolic disturbances characteristic of the MetS. Our hypothesis explaining the transference of these cardio-metabolic disturbances to the F1H and F2H offspring, respectively, due to the altered uterine environment and germ cells of F1H induced by the progenitor’s H diet is due to the injury in the metabolic intracellular signalling pathways(Reference Dunn and Bale16–Reference Vickers18).
Food intake, energy expenditure and body mass gain are regulated by leptin that acts as a signalling factor between adipose tissue and the central nervous system(Reference Zhang, Proenca and Maffei6,Reference Campfield, Smith and Guisez19) . Studies from the literature(Reference Kennedy20–Reference Schwartz, Woods and Porte23) and from our previous data(Reference Barbosa, Sá and De Castro24) subjecting rats to a H diet showed that rats have the ability to balance food intake and energy intake. In fact, literature data using mice(Reference Townsend, Lorenzi and Widmaier25) fed a H diet showed higher energy efficiency with similar consumption of energy intake and hyperleptinaemia, suggesting alteration in hypothalamic modulation of leptin signalling. Similarly, the present study shows that the genitors fed the H diet consumed a smaller amount of the H diet but displayed energy intake similar to those fed the C diet. Despite this similarity in energy intake, these G0H genitors showed greater coefficient of food efficiency, adiposity index and high plasma levels of leptin, meaning that the G0H genitors were more efficient in converting the same amount of energy into a larger body mass gain, evidencing the importance of SFA representing the main change in H diet composition used in the present study.
Additionally, studies(Reference Volpato, Schultz and Magalhaes-da-Costa4,Reference Bouret26) showed that females subjected to a H diet after weaning until breast-feeding induce hypothalamic resistance to leptin in F1 offspring, leading to an increase in body mass in adulthood. In our present data, although the genitors were fed the H diet only during mating, gestation and breast-feeding, it seems to agree with these studies in the literature(Reference Volpato, Schultz and Magalhaes-da-Costa4,Reference Bouret26) related to the F1H offspring and extends this observation to F2H offspring. Indeed, although the progenitors showed a similarity in the energy intake, they showed alteration in uterine and sanguine environment in gestation and breast-feeding, as increase in adiposity index, high plasma levels of leptin and GJ could contribute to the increase in leptin levels in F1H and F2H rats. The high plasma levels of leptin in F1H and F2H rats probably have induced higher energy intake and consequently triggered other disorders. In fact, the evaluation of the correlation between the plasma level of leptin of G0H progenitor and F2H offspring showed a positive correlation with the plasma level of leptin (r 0·8363, effect size = −1·29; statistical power = 0·99) and energy intake (r 0·9797, effect size = −3·12; statistical power = 1).
The literature already presents studies showing the effect of H diet on F1H offspring(Reference Srinivasan, Katewa and Palaniyappan27–Reference Tamashiro, Terrillion and Hyun31) and few studies on F2H offspring(Reference Dunn and Bale29,Reference Gniuli, Calcagno and Caristo32) . However, these studies presented a great variability in experimental protocols such as the percentage of energy from H diet, the period of time when the H diet was subjected to the genitors or even to offspring and also the parameters evaluated. This large variability in these studies makes it difficult to understand the importance of the H diet subjected to the progenitors in the health of offspring. In the present study, our goal was to highlight the nutritional importance of the female genitor only during the mating, gestation and breast-feeding period in the cardio-metabolic health of F1 and F2 offspring.
Studies using rats genitors(Reference Huang, Ye and Liu17,Reference Srinivasan, Katewa and Palaniyappan27,Reference Tamashiro, Terrillion and Hyun31) and mice(Reference Ashino, Saito and Souza28–Reference Masuyama, Mitsui and Eguchi30) that were subjected to a H diet for a long time after weaning until breast-feeding exhibited increased body mass, plasma levels of leptin, total cholesterol, glucose, insulin and HOMA-IR, which are transmitted to F1(Reference Srinivasan, Katewa and Palaniyappan27–Reference Tamashiro, Terrillion and Hyun31), while high body mass gain, impaired glucose tolerance and lower insulin levels were transmitted to F2(Reference Dunn and Bale29,Reference Gniuli, Calcagno and Caristo32) . According to and extending these observations, data from the present study showed that both male and female F1H and F2H offspring showed increase in plasma levels of leptin leading to increased food and energy intake, adiposity index and consequently body mass gain(Reference Volpato, Schultz and Magalhaes-da-Costa4,Reference Ashino, Saito and Souza28,Reference Desai, Jellyman and Han33) , and IR evidenced by the HOMA-β (Reference Aref, Ahmed and Ali34) reduction and increased HOMA-IR, plasma levels of glucose, TAG and total cholesterol(Reference Yu, Kimura and Walczewska7).
Additionally, cardiovascular alterations induced by the H diet in the genitors were transferred to both male and female F1H and F2H offspring. The F1H and F2H showed an increase in basal MAP, without any change in HR or bradycardia sensitivity. The evaluation of the sympathetic contribution to the basal MAP levels using the ganglion blocker hexamethonium showed a greater drop in MAP in the G0HM genitors and in female and male F1H and F2H offspring, suggesting that an increase in MAP is due, at least in part, to the increase in sympathetic drive to the cardiovascular system(Reference Li, Gong and Sun35–Reference Santajuliana, Hornfeldt and Osborn37). The increase in basal MAP in F1H and F2H offspring are consistent with the previous studies where female genitors were fed H diet for long-term, including before pregnancy until lactation(Reference Khan, Dekou and Douglas38–Reference Elahi, Cagampang and Mukhtar40). According to Zhang et al. (Reference Zhang, Huo and Fang41), female rats fed a H diet for 2 weeks before pregnancy until lactation showed no changes in basal MAP and blunted tachycardia baroreflex sensitivity in the F1H offspring. The difference in the basal MAP observed between our present study and Zhang et al. study(Reference Zhang, Huo and Fang41) may be due to the differential age of the F1H offspring. In addition, the baroreflex presents two components, the tachycardic that represents sympathetic activity and the bradycardic that represents parasympathetic activity(Reference Dampney42,Reference Alzamora, Santos and Campagnole-Santos43) . In the Zhang et al. (Reference Zhang, Huo and Fang41) study, only reflex tachycardia was evaluated, whereas in the present study only reflex bradycardia was evaluated. The sympathetic dysfunction was evidenced in our present study and suggests a dysfunction in the reflex tachycardia according to data from Zhang et al. (Reference Zhang, Huo and Fang41). On the other hand, our present data suggest that the parasympathetic activity is not yet significantly altered because of any change in the sensitivity of the reflex bradycardia. Furthermore, it is well established in the literature that the increase in sympathetic activity induces an increase in plasma leptin(Reference Bornstein and Torpy9), dietary intakes(Reference He, Boesveldt and Delplanque44,Reference Guarino, Nannipieri and Iervasi45) , adipose tissue(Reference La Fountaine, Cirnigliaro and Kirshblum46,Reference Schumann, Jenkinson and Alt47) and IR(Reference Gastaldelli, Gaggini and DeFronzo48,Reference Ying, Riopel and Bandyopadhyay49) . In this way, in the present study, the increase in sympathetic activity must be involved in all cardio-metabolic alterations induced by the H diet of the progenitors that were transmitted to female and male F1H and F2H offspring. Again, the evaluation of the correlation between the plasma levels of leptin of G0H progenitor and F2H offspring showed a positive correlation with total cholesterol (r 0·9684, effect size = −1·48; statistical power = 0·98), TAG (r 0·9857, effect size = −3·04; statistical power = 1), glycaemia (0·9034, effect size = −2·56; statistical power = 1) and MAP (r 0·9551, effect size = −3·11; statistical power = 1) and negative correlation with sympathetic inhibition (r −0·9321, effect size = 4·79; statistical power = 1).
In G1HF genitor, we observed less disturbances compared with G0HF genitor. The G1HF genitors showed similarity in the amount of C diet ingested, energy intake, adiposity index and HOMA-β but increased plasma levels of leptin, total cholesterol, TAG and HOMA-IR. The less disturbances in G1HF are probably due to greater metabolic demand in the gestation and breast-feeding periods, inducing physiological adjustments(Reference King50). However, these adjustments did not avoid the G1HF to transfer the disturbances totally to the F2H offspring(Reference King50,Reference Bell, Hayen and Irwig51) .
The contribution of the father cannot be ignored in the transmission of metabolic dysfunction to the offspring(Reference Rando52,Reference Fullston, Palmer and Owens53) . In the present study, male genitors who received only the H diet for a short period of 10 d of mating showed increased body mass gain and MAP and HR compared with male genitors fed the C diet.
Conclusion
The present study shows that although the progenitors had a similarity in the energy intake, the H diet fed only during mating, gestation and breast-feeding increased arterial pressure, sympathetic activity, adiposity index, plasma levels of leptin and GJ. These progenitor disorders during pregnancy and breast-feeding induced increase in leptin levels and energy intake in offspring, even when they were fed only control diet and then triggering the occurrence of other disturbances characteristic of the MetS in F1H and F2H rats. Finally, our data reinforce the importance of balanced diet during pregnancy and breast-feeding for the generation of healthy F1 and F2 offspring.
Acknowledgements
This study was supported by the Universidade Federal de Ouro Preto (UFOP), Pró-Reitoria de Pós-Graduação (PROPP-UFOP), FAPEMIG (Fundação de Amparo à Pesquisa do Estado de Minas Gerais), CNPq (Conselho Nacional de Desenvolvimento Científico e Tecnológico). Claudiane Maria Barbosa received a Coordenação de Aperfeiçoamento de Pessoal de Nível Superior (CAPES) fellowship as doctoral student in the Programa de Pós-graduação–Ciências Biológicas, NUPEB, UFOP; CNPq (grant number universal 472497/2013-8); FAPEMIG (grant number APQ-01685-15).
A. C. A. conceived, designed the experiment, analysed the data and wrote the manuscript. C. M. B., V. P. F., M. A. B. and A. C. A. performed the experiments, analysed the data and wrote the manuscript. L. M. C analysed the data. All authors reviewed and approved the final version of the manuscript.
The authors declare that they have no conflicts of interest.
Ethical Statement
All procedures were performed in accordance with the Guidelines for Ethical Care of Experimental Animals and it was approved by the Animal Ethics Committee of the Federal University of Ouro Preto (protocol 2016/49) to not to cause suffering or pain to the animal. In experimental methods section, a specific ethics/approval number was inserted.
Supplementary material
For supplementary material referred to in this article, please visit https://doi.org/10.1017/S0007114519002708


