The WHO reported that CVD were the leading cause of death, representing about 30 % of all global deaths in 2008( 1 ). The prevalence of CVD have been rising fast in the developing countries over the past several decades. In China, they have increased from 3·1 % in 1993 to 25·2 % in 2015( 2 ). There are several modifiable risk factors contributing to the risk of CVD, including hypertension (HT), dyslipidaemia, diabetes, unhealthy diet and sedentary lifestyle, overweight and obesity( Reference Balakumar, Maung and Jagadeesh 3 ). Modification of lifestyles, mainly unhealthy diet and physical inactivity/prolonged sedentary time, have been regarded as the most applicable approaches for reducing the risk of CVD at population level( Reference Lloyd-Jones, Hong and Labarthe 4 ).
Most previous studies explored the relationships between CVD risk factors and individual dietary components, such as dietary fat and Na; however, those studies had several conceptual and methodological limitations. In recent years, dietary pattern analysis has been emphasized more than the studies of individual nutrients because it demonstrates all of diet’s effects( Reference Hu 5 ). So far, more evidence indicates that dietary patterns are associated with the risk of CVD( Reference Conlin, Chow and Miller 6 – Reference de Jesus, Kahan and Eckel 13 ). Sedentary behaviour is another important CVD risk factor. Several systematic review and meta-analyses have documented the evidence on the associations between sedentary behaviour and CVD( Reference Young, Hivert and Alhassan 14 ). Television viewing, as the most important and prevalent mode of sedentary behaviour,, has been identified as an independent risk of CVD( Reference Grontved and Hu 15 ).
Until now, none of the previous studies has attempted to examine the joint association of dietary pattern and television viewing with the risk of CVD. We hypothesise that unhealthy dietary patterns together with longer television viewing times may exert additional risk to the development of CVD compared with their separate effects. Thus, this study aims to examine the joint associations of dietary patterns and television viewing with CVD risk factors using the data from community-based cross-sectional study conducted in the urban areas of Nanjing, China.
Methods
Study design and sampling
A community-based nutrition and health survey was conducted in 2007 in urban areas of Nanjing, China. In this cross sectional study, a multistage sampling approach was used to select participants, which has been described in detail elsewhere( Reference Hong, Xu and Wang 16 ). In brief, two urban districts were randomly selected from all eight urban districts of Nanjing. Then, three or four streets were randomly selected from each chosen district. Finally, one community in each chosen street was randomly selected, which led to a total of seven urban communities being included in this study. All the regular residents who were aged 35 years old and resided in these selected communities were eligible participants. Subjects were excluded if they had specific diseases requiring a special diet (e.g. a low-carb, low-sugar diet were usually prescribed to diabetic people) or were on a weight-reduction diet. Written consent was obtained from each participant before the survey. This study was approved by the academic and ethical committee of Nanjing Municipal Center for Disease Control and Prevention (Nanjing CDC).
Dietary assessment
Dietary intake in the past 12 months was assessed using a validated, semi-quantitative FFQ( Reference Xu, J Dibley and D’Este 17 ) that included eighty-seven food items and twelve food categories. In all, twenty-eight separate food groups were further developed by combining similar food type and nutrient composition.
Dietary patterns were constructed using cluster and factor analysis methods according to following approaches( Reference He, Ma and Zhai 18 ). First, dietary patterns (main independent variables) were identified from twenty-eight food groups by exploratory factor analysis according to the standard principal component analysis method. Factors were rotated by orthogonal transformation (varimax rotation) to minimise the correlation between the factors and thus improve the interpretability of the data. The number of factors retained in the model were based on the criteria of eigenvalue (>1·0), scree plot, factor interpretability and the variance explained by each factor. Factor loadings represented correlation coefficients between food groups and dietary patterns. Food groups with absolute factor loadings ≥0·2 were considered as having significant contribution to the pattern and thus retained in the model. The newly developed dietary patterns were named according to the food items having high loadings (absolute value) in each dietary pattern. In this study, five groups of interrelated food categories were identified from twenty-eight food groups in the FFQ. Dietary factor scores for each participant were calculated by summing the standardised intakes of each food group weighted by the factor loading( Reference Hong, Xu and Wang 16 ). Then the factor scores were used in a cluster analysis and a five-cluster solution was obtained. Cluster 1, the ‘healthy traditional’ pattern, characterised by a high intake of green vegetables, rice and products, dry vegetables, other vegetables (e.g. tomatoes, turnips, etc.), fish and shrimp. Cluster 2, the ‘animal and plant protein’ pattern, including a high intake of poultry meat, dry beans, other soyabean products and livestock meat. Cluster 3, the ‘condiments’ pattern, featured by a high consumption of soya sauce, sugar, vinegar and salt. Cluster 4, the ‘fruits, eggs, and juice’ pattern, including a higher intake of fruits, eggs, soyabean milk, juice, nuts, cola and sweets. Cluster 5, the ‘alcohol, milk and tea’ pattern, characterised by a high consumption of beer, liquor, dairy products, wine and tea.
Television viewing level and other exposure variables
Trained investigators conducted face-to-face interview using a standardised questionnaire to acquire information on each participant’s daily hours spent in viewing television in the past 12 months. Television viewing time was then accumulated to the total hours spent watching television every week. Based on our previous studies, participants who spent >7 h/week viewing television had a significant higher risk of developing obesity/type 2 diabetes than those who spent ≤7 h/week, after adjusting for potential confounding factors, which justified classifying television viewing time into two subgroups (≤7 or >7 h/week)( Reference Hong, Yin and Liang 19 , Reference Li, Hong and Liang 20 ).
Socioeconomic status was assessed according to education attainment and family annual income. In our study, education was classified into three categories: (1) primary school and lower; (2) middle/high school; and (3) college and higher. Family annual income from all family members was classified into three subgroups by tertile: (1) lower, (2) middle and (3) upper tertile. Information on smoking and alcohol drinking were also collected from each participant. Current smokers were defined as individuals who had smoked at least one cigarette per d or not less than eighteen packs in the last year. Alcohol drinkers referred to individuals who drank alcohol on an average of two or more times per week in the last year.
Risk factors of cardiovascular diseases
Anthropometric measures including weight, height and waist circumference (WC) were recorded according to a standard protocol by trained interviewers. Height was measured without shoes to the nearest 0·1 cm and weight was measured with light clothing to the nearest 0·1 kg. WC was recorded to the nearest 0·1 cm midway between the inferior margin of the last rib and the iliac crest in a horizontal plane. BMI was calculated by dividing body weight (kg) by the height (m) squared. A blood sample was collected from each participant to assess fasting plasma glucose concentration, total cholesterol (TC) and plasma TAG. The participants’ blood pressures (BP) were assessed on the right arm with standardised mercury sphygmomanometers. Two consecutive readings of BP were recorded according to the1999 WHO/International Society of Hypertension guidelines on hypertension, whereas the participant was required to be in a seated position after at least 5 min of rest( Reference Whitworth 21 ).
Selected CVD risk factors of this study included abdominal obesity(AO) (WC≥85 cm for men and≥80 cm for women)( Reference Zhou 22 ), HT (systolic BP≥140 mmHg or/and diastolic BP≥90 mmHg)( Reference Chobanian, Bakris and Black 23 ), hyperglycaemia(HG) (HG≥6·1 mmol/l)( 24 ), elevated TC (ETC≥5·18 mmol/l)( Reference Chobanian, Bakris and Black 23 ) and elevated TAG (TAG≥1·7 mmol/l)( 25 ).
Sample size estimation
Sample size was estimated based on the TC (P=0·049) as it has the lowest prevalence amongst all five selected CVD risk factors of our study.
The equations used to estimate the study sample size was: u 2 P (1−P)/d 2, where u is the two-sided significance level (α=0·05, u=1·96), P is the prevalence of TC, d is calculated by relative tolerance (0·15) times P. Finally, 3314 participants were required to achieve the adequacy of statistical power.
Statistical analysis
The separate or joint associations of dietary patterns and television viewing with CVD risk factors were estimated using multivariable logistic regression models to obtain OR and the 95 % CI. Two multivariate logistic regression models were constructed: Model 1 was made by adjustment for age, sex, education level (primary school and lower, middle/high school, college and higher), family annual income of all family members (three categories by tertile), smoking status and alcohol consumption. Model 2 was further adjusted for BMI. To examine the joint associations of dietary patterns and television viewing time with CVD risk factors, dietary patterns were classified into two subgroups: healthy traditional pattern and other dietary pattern (including the remaining four patterns: animal and plant protein pattern, condiments pattern, fruits, eggs and juice pattern and alcohol, milk and tea pattern), Participants were further categorised into four subgroups based on the status of television viewing time and two summarised dietary patterns: (1) other dietary pattern and television time >7 h/week (reference group, ‘the highest risk group’); (2) healthy traditional dietary pattern and television time >7 h/week; (3) other dietary pattern and television time ≤7 h/week; (4) healthy traditional dietary pattern and television time ≤7 h/week(‘the lowest risk group’). Data were also analysed for men and women separately. All the analyses were conducted using SPSS 20.0 (IBM Corp.).
Results
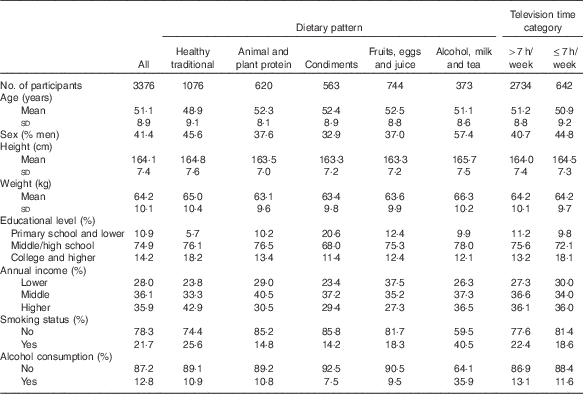
Overall, 3376 individuals agreed to participate in the survey, with age ranging from 35 to 81 years old. Table 1 shows the distributions of selected characteristics of participants by dietary patterns and television viewing time. Among all participants, 31·9 % of them adopted the healthy traditional pattern, 18·4 % followed the animal and plant protein pattern, whereas the remaining participants used the condiments pattern (16·7 %), fruits, eggs and juice pattern (22 %) and alcohol, milk and tea pattern (11·0 %), respectively. Participants using the healthy traditional pattern were younger and had a higher economic level than those adopting other dietary patterns. Women and less educated people tended to use the condiment pattern, whereas more smokers adopted the alcohol, milk and tea pattern. There were 19·0 % of participants spending >7 h/week in viewing television. More less educated women, smokers and alcohol drinkers tended to have a television viewing time >7 h/week.
Table 1 Selected characteristics of participants according to dietary patterns and television time level in urban areas of Nanjing, China (Mean values and standard deviations; percentages)

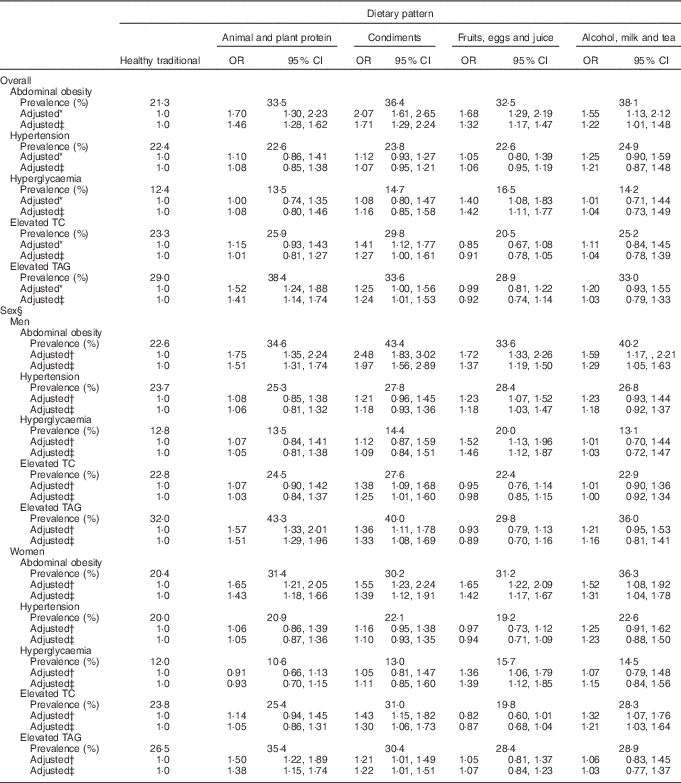
Table 2 displays the relationships between the dietary patterns and CVD risk factors. Participants taking the healthy traditional pattern had the lowest prevalence of AO, HT and HG; however those who used the fruits, eggs and juice pattern showed the lowest prevalence of ETC and elevated TAG (ETG).
Table 2 Prevalence of CVD risk factors among urban participants by dietary pattern in Nanjing, China (Odds ratios and 95 % confidence intervals)

* Multivariable model adjusted for age, sex, education level (primary school and lower, middle/high school, college and higher), annual income of all family members (total income was divided into tertiles to derive three categories), smoking status, and alcohol consumption.
† Multivariable model adjusted for age, education level (primary school and lower, middle/high school, college and higher), annual income of all family members (total income was divided into tertiles to derive three categories), smoking status, and alcohol consumption.
‡ Further adjusted BMI (continuous).
§ Data were analysed separately, for men and women.
After adjustment for age, sex, education level, family annual income, smoking status and alcohol consumption, the participants using the condiments pattern demonstrated the highest OR of AO (2·07; 95 % CI 1·61, 2·65), ETC (1·41; 95 % CI 1·12, 1·77) and ETG (1·25; 95 % CI 1·00, 1·56). Compared with the healthy traditional pattern, those taking the fruits, eggs and juice pattern showed an OR of 1·40 (95 % CI 1·08, 1·83) for HG, whereas the OR was 1·52 (95 % CI 1·24, 1·88) for the association between animal and plant protein pattern and ETG. After BMI was further adjusted for, these associations were attenuated, but were still statistically significant.
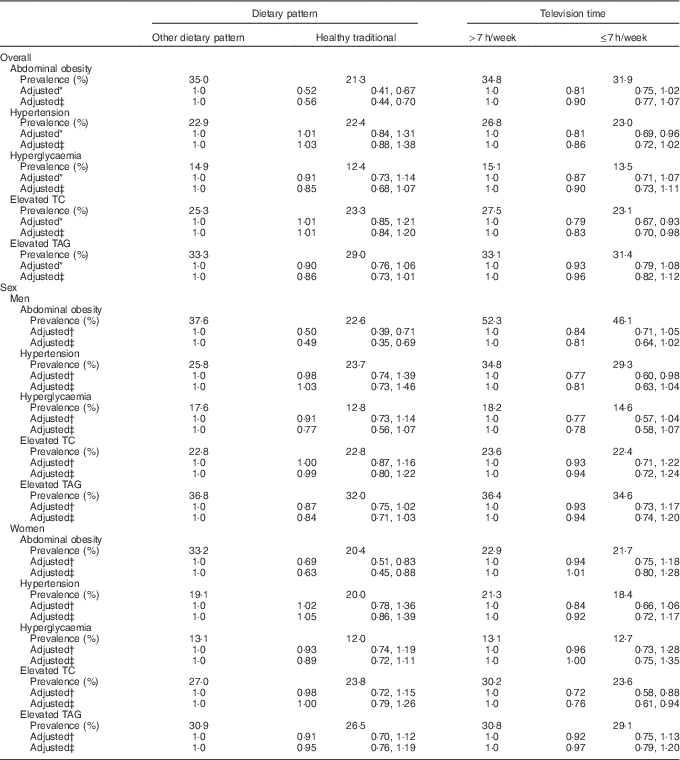
Table 3 presents the separate associations of dietary patterns (categorised into other dietary pattern v. healthy traditional pattern) and television time with different CVD risk factors. After adjustment for age, sex, education level, family annual income, smoking status and alcohol consumption, participants taking the healthy traditional pattern had 48 % lower likelihood for AO than those taking other dietary patterns. Compared with participants spending >7 h/week in viewing television, those with ≤7 h/week television time were 19 and 21 % less likely to have HT and ETC; however, there was no statistical significance after BMI was further adjusted for in the model (P for trend=0·079).
Table 3 Prevalence of CVD risk factors among urban participants according to dichotomized dietary pattern and television time separately in Nanjing, China (Odds ratios and 95 % confidence intervals)

* Multivariable model adjusted for age, sex, education level (primary school and lower, middle/high school, college and higher), annual income of all family members (total income was divided into tertiles to derive three categories), smoking status, and alcohol consumption.
† Multivariable model adjusted for age, education level (primary school and lower, middle/high school, college and higher), annual income of all family members (total income was divided into tertiles to derive three categories), smoking status, and alcohol consumption.
‡ Further adjusted BMI (continuous).
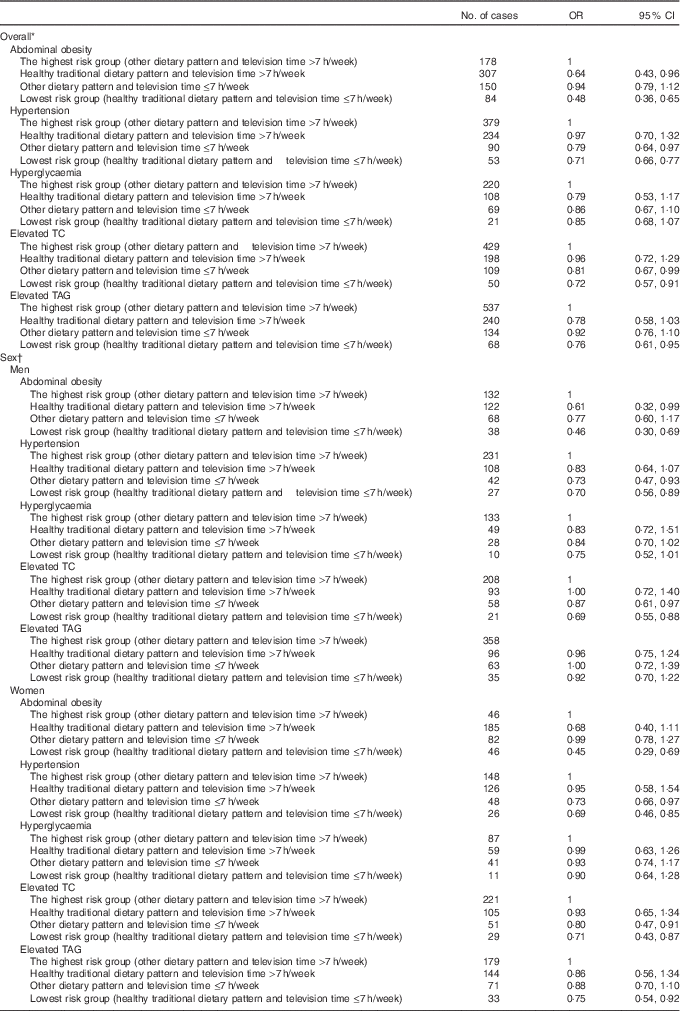
The joint associations of dietary pattern and television time with CVD risk factors are displayed in Table 4. Compared with the reference group, individuals with healthy traditional pattern were at a lower risk for the prevalence of AO (OR 0·64; 95 % CI 0·43, 0·96), and those with less television time were also at a lower risk for the prevalence of HT (OR 0·79; 95 % CI 0·64, 0·97) and ETC (OR 0·81; 95 % CI 0·67, 0·99). Participants categorised as the lowest risk subgroup had the lowest OR for the prevalence of AO (OR 0·48; 95 % CI 0·36, 0·65), HT (OR 0·71; 95 % CI 0·66, 0·77), ETC (OR 0·72; 95 % CI 0·57, 0·91) and ETG (OR 0·76; 95 % CI 0·61, 0·95), respectively. Furthermore, similar associations were also observed for men and women, respectively.
Table 4 Joint association of dietary pattern and television time with CVD risk factors among urban participants in Nanjing, China (Odds ratios and 95 % confidence intervals)

* Multivariable model adjusted for age, sex, education level (primary school and lower, middle/high school, college and higher), annual income of all family members (total income was divided into tertiles to derive three categories), smoking status and alcohol consumption.
† Multivariable model adjusted for age, education level (primary school and lower, middle/high school, college and higher), annual income of all family members (total income was divided into tertiles to derive three categories), smoking status and alcohol consumption.
Discussion
This community-based study demonstrated that the healthy traditional pattern and a lower amount of Television viewing time might have separate and joint effects in additively reducing the selected CVD risk factors among adults from urban areas in Nanjing, China. The associations between CVD risk factors and dietary pattern or television time were independent of the classical confounders, and did not materially change by the sex. These findings suggested that dietary patterns and television viewing time (one major mode of sedentary behaviours) might be used as the predictors to identify people at high risk for CVD in China in population-based precision prevention campaigns. In this study, five dietary patterns were identified among urban Chinese adults, which are similar to the findings from the previous studies( Reference Wang, He and Li 12 , Reference Odegaard, Koh and Butler 26 ). The healthy traditional pattern represents the traditional Chinese diet, reflecting a low fat content but plenty of healthy food items, such as vegetables, rice, fish and shrimp that contain highly beneficial nutrition as well as antioxidants and polyphenols. This may partly explain that the healthy traditional pattern was associated with a decreased CVD risk( Reference Esposito, Kastorini and Panagiotakos 27 ). The detrimental effect of the other dietary patterns on CVD risk factors may be attributed to the content of high saturated fat and carbohydrates, low content of fresh vegetables and aquatic products. Our findings are in agreement with the previous studies( Reference Fung, Rimm and Spiegelman 7 – Reference Kerver, Yang and Bianchi 9 , Reference Wang, He and Li 12 , Reference Kim 28 – Reference Wang, He and Li 30 ). Wang et al.( Reference Wang, He and Li 12 ) found that the traditional dietary pattern was associated with the lowest prevalence of CVD risk factors among all dietary patterns. In addition, several studies have documented the effects of the healthy dietary patterns on preventing CVD and its risk factors( Reference Fung, Rimm and Spiegelman 7 – Reference Kerver, Yang and Bianchi 9 , Reference Kim 28 – Reference Wang, He and Li 30 ). A recent study of nutrition interventions for CVD emphasised the effect of dietary patterns on BP and lipid management as well as CVD risk( Reference de Jesus, Kahan and Eckel 13 ). It is noteworthy that the healthy traditional dietary pattern users were younger and had higher socioeconomic level, which may be explained by an increased awareness of health knowledge, or pressures of social acceptability that were related to people’s food consumption habits( Reference Mullie, Clarys and Hulens 31 ).
Physical inactivity was a convincingly independent risk factor of CVD( Reference Same, Feldman and Shah 32 ). Traditionally, television viewing is the typical daily activity apart from working and sleeping in Nanjing city, and is also the most prevalent sedentary behaviour. In our study, less television time was associated with a decreased risk of HT and ETC, which was consistent with previous studies( Reference Grontved and Hu 15 , Reference Wijndaele, Healy and Dunstan 33 – Reference Wijndaele, Brage and Besson 35 ). Wijndaele et al.( Reference Wijndaele, Healy and Dunstan 33 ) observed that those who had their television viewing time over 5 years (10 h/week 1 unit), had a 0·47 mmHg increase in diastolic BP. Recent findings from the European Prospective Investigation into Cancer and Nutrition (EPIC) Norfolk cohort study demonstrated that prolonged television time was independently associated with an increased hazard of CVD( Reference Wijndaele, Brage and Besson 35 ). In addition, the results from a meta-analysis also suggested that prolonged television viewing time was consistently associated with an increased risk of CVD( Reference Grontved and Hu 15 ).
To the best of our knowledge, no study has examined the combined effect of dietary pattern and television viewing on CVD risk. Our study identified that the healthy traditional dietary pattern and less television viewing time might be jointly associated with an additionally low prevalence of CVD risk factors, which suggested an important strategy for CVD prevention at population level. Several previous observational studies also reported similar results( Reference Wang, He and Li 12 , Reference Mozaffarian, Kamineni and Carnethon 36 ). Wang et al.( Reference Wang, He and Li 12 ) found that either physical activity level (PAL) or healthy dietary pattern was independently associated with a lower risk of CVD among Chinese men( Reference Wang, He and Li 12 ). Furthermore, the joint effect of two low-risk lifestyle factors on CVD risk factors showed the lowest effect size. A study conducted by Mozaffarian et al.( Reference Mozaffarian, Kamineni and Carnethon 36 ) also found that the active PAL and healthy dietary habits were jointly associated with a 46 % lower risk of diabetes compared with the active PAL (26 %) or healthy dietary habits (31 %) alone among the older adults. With the development of economy and technology since 2007, using mobile phones, computers and pads instead of viewing traditional television, has become the major mode of screen time for most people. Therefore, it is of particular importance for prevention of CVD risk factors through not only reducing screen time (including newly emerged mode of screen facilities) but also adopting traditional dietary pattern.
Strengths of the present study include the population-based representative sample, high quality of the data and adjustment for a broad range of potential confounding variables. In addition, the individual food consumption information was collected via face-to-face interview using a validated FFQ. A previous study suggested that a self-administered FFQ survey was not advisable, A face-to-face interview was regarded as the proper approach in the current context of educational levels for most people in China that increased quality of FFQ over the previous studies( Reference Shi, Hu and Yuan 37 ).
This study has some potential limitations. First, based on a cross-sectional study design, we cannot establish the time sequence of exposure and the outcomes and thus cannot draw a conclusion about causality. Second, compared with the previous study( Reference Wang, He and Li 12 ), we had a relatively small sample size; only 642 participants were categorised as less television viewing time which may lead to lack of sufficient power in detecting a significant association with some CVD risk factors. Third, some established CVD risk factors were not included in this study, such as HDL and LDL. Finally, selection and recall bias cannot be totally ruled out in the cross-sectional design and this poses another limitation of our study. In addition, the data included in this study were collected 10 years ago, but it still deserved to be used to examine the association of dietary pattern and television viewing with CVD risk factors, as these lifestyles were habitual and were likely to be relatively stable over time. Large-scale prospective, cohort studies are warranted to confirm the associations observed from this cross-sectional study.
In conclusion, this study provided further supportive evidence that the healthy traditional dietary pattern and less television viewing time might have a joint effect on reducing the levels of CVD risk factors. This study has important public health implications regarding the precision prevention of CVDs at population level.
Acknowledgements
The authors are grateful to all the dedicated fieldworkers who took part in the survey and all participants who facilitated the survey implementation in each community.
This study was supported by Nanjing Municipal Medical Science and Technique Development Foundation, China (2007-ZKX07026).
Q. Y. contributed to study design, data collection and analysis, manuscript writing; F. X. was responsible for study design, data analysis, manuscript writing and revision; X. H., Z. W., Z. Q., C. L. and Y. L. were responsible for data collection and manuscript revision.
None of the authors has any conflicts of interest to declare.


