Potatoes, as the world's third largest food crop and most extensively consumed root vegetable, have received much attention in recent years from nutritionists and agriculturalists(1). Consumption is currently greatest in the Western world, but potatoes are rapidly becoming a staple in developing countries. Annual per capita potato consumption in 2005 was estimated to be 93 kg in Europe, 60 kg in North America and 22 kg in China(2). Compared with bread and rice, potatoes are more satiating(Reference Holt, Miller and Petocz3) and a source of vitamin C (up to 42 mg/100 g) and Mg(Reference Burlingame, Mouille and Charrondiere4). In prospective observational studies, however, potato consumption has been reported to be associated with higher weight gain(Reference Mozaffarian, Hao and Rimm5) and increased risk of type 2 diabetes(Reference Ludwig6).
Nutritional studies on different cultivars of potatoes using in vivo and in vitro approaches to classify the digestibility and glycaemic properties of carbohydrates indicate that cooked potatoes contain mostly rapidly digested starch(Reference Leeman, Barstrom and Bjorck7) and have a high glycaemic index (GI)(Reference Atkinson, Foster-Powell and Brand-Miller8). Hence, some health professionals advise that potatoes should be substituted with a low-GI carbohydrate to reduce the risk of chronic disease(Reference Brand-Miller, McMillan-Price and Steinbeck9, Reference Willett, Manson and Liu10). However, given the importance of potatoes as a food, the discovery and development of low-GI potatoes would be desirable from consumer, agricultural, food industry and health perspectives.
In in vitro studies, the physico-chemical breakdown of starch in a carbohydrate food is measured by determining the rate and extent of glucose release from enzymatic digestion under controlled conditions(Reference Englyst, Englyst and Hudson11). In vitro methods have been proposed as an alternative approach for classifying carbohydrates, with the results reported by some studies showing a correlation with in vivo GI testing(Reference Englyst, Englyst and Hudson11–Reference Granfeldt, Bjorck and Drews13). However, the number of foods that have been subjected to both in vitro and in vivo testing for direct comparison is very limited.
The aim of the present study was to use a standardised GI testing methodology to screen the established and newly introduced commercial cultivars of potatoes, in a bid to identify a low-GI potato. Emphasis was placed on the direct determination of the carbohydrate content (as starch+sugars) of the different potatoes studied, as opposed to reliance on food composition tables. We determined whether amylose content was a significant predictor of potato GI as has been suggested for cereals and legumes(Reference Bjorck and Asp14, Reference Hu, Zhao and Duan15). To our knowledge, this is the first study to test the practical value of in vitro testing where the botanical cultivar is the only point of difference between the food samples.
Experimental methods
Test foods
A total of seven commercial potato cultivars comprising a mix of well-established cultivars and newly released cultivars were sourced from growers in Tasmania (Russet Burbank, Maiflower, Nicola and Bintje) and South Australia (Carisma, Desiree and Virginia Rose). The potatoes were prepared for testing according to the method specified by the producers of the cultivars. The potatoes were peeled, cut into 5 cm by 5 cm slices, at a thickness of 0·5 cm, added to excess water at room temperature and brought to boil. The potatoes were cooked in boiling water for a further 4 min, drained, cooled by rinsing in tap water and served immediately along with 250 ml of water (total cooking time 8–9 min). The testing volunteers provided feedback that the Carisma, Nicola and Virginia Rose cultivars were cooked and firm and the other four cultivars were softer. Glucose solution was used as the reference food and tested on three separate occasions; each potato cultivar was tested once according to the International Organisation for Standardisation standard(16). The test and reference foods were fed as a portion providing 25 g of carbohydrate determined as the sum of starch and sugars by direct measurement.
Determination of starch and reducing sugar and total dietary fibre content
Fresh potatoes were peeled and homogenised in a blender. The homogenate was frozen at − 80°C and freeze-dried, and the dried material was ground into a powder for total starch and total dietary fibre content determination using the respective Megazyme assay kits (Megazyme International Ireland Limited). Total starch and total dietary fibre content was determined using duplicate samples.
Reducing sugar content was assayed using potato juice extracted from peeled and homogenised fresh potatoes. The juice was filtered and diluted 1:10 with distilled water and then frozen and stored at − 20°C before the assay. Reducing sugar content was measured using triplicate samples with the Megazyme reducing sugar assay kit (Megazyme International Ireland Limited). The sum of total starch content and reducing sugar content was considered to be the glycaemic carbohydrate content.
Determination of amylose content in potato starch
Starch was extracted from each potato cultivar using a modified method of Noda et al. (Reference Noda, Tsuda and Mori17). Potato tubers (1 kg) were peeled and homogenised in a blender with distilled water. The slurry was filtered successively through muslin, and 250 and 100 μm sieves. The starch suspension was allowed to settle overnight at 4°C, and the supernatant was removed by decantation. The sedimented starch was washed with deionised water, and the granules were collected on a filter paper with suction, washed with ethanol, dried under a gentle air stream and stored in sealed containers at room temperature for further analysis. Total amylose content of the potato starches was determined by the iodine binding method of Chrastil(Reference Chrastil18) using a standard curve of 10, 20, 40, 50 and 60 % potato amylose mixed with potato amylopectin (A0512 and A8515 from Sigma Chemical Company).
Glycaemic index testing subjects
Healthy subjects were recruited among students at the University of Sydney. A total of twenty-seven subjects (twelve males and fifteen females) were recruited over a 1-year period, and potato cultivars were tested in subgroups of ten subjects. Their mean age was 27·0 (sd 5·1) (range 18–38) years, BMI was 22·3 (sd 2·0) kg/m2, and fasting plasma glucose value was 5·32 (sd 0·31) mmol/l. The inclusion criteria were as follows: non-smoking; 18–40 years of age; stable body weight; BMI of 19–25 kg/m2; normal glucose tolerance; no food allergy or intolerance; not taking medications known to affect glucose tolerance. On average, each subject tested four cultivars in a random order separated by 3–5 d. The present study was conducted according to the guidelines laid down in the Declaration of Helsinki, and all procedures involving human subjects were approved by the Human Research Ethics Committee of the University of Sydney. Written informed consent was obtained from all the subjects.
Glycaemic index testing procedures
The study protocol used was in accordance with the International Organisation for Standardisation standard for the determination of GI of foods(16). The subjects were instructed to refrain from unusual physical activity and alcohol and legume consumption and to eat a high-carbohydrate, low-fat dinner meal the day before the test. On the morning of the test day, the subjects arrived at the metabolic kitchen after a 10–12 h overnight fast. After warming the hand in hot water, two baseline finger-prick blood samples (0·5 ml each) were collected 5 min apart from the subjects. The subjects then consumed the reference or test food at a comfortable pace within 12 min. The portion of potatoes fed was adjusted so that each contained 25 g of glycaemic carbohydrate. Additional finger-prick capillary blood sample was collected 15, 30, 45, 60, 90 and 120 min after the commencement of eating. The subjects remained seated throughout the session and were not permitted to eat or drink until the end of the session. Blood samples were collected into anticoagulant-coated tubes (Eppendorf tubes, grade II; Sigma Chemical Company) containing 10 IU heparin Na salt and centrifuged immediately (10 000 g for 1 min at room temperature). The plasma layer was pipetted into a labelled tube and stored at − 20°C until analysis. Plasma glucose concentration was determined using the glucose hexokinase enzymatic assay on a centrifugal analyser (model HITACHI 912; Hitachi). Both the mean within-assay and between-assay precisions (CV) were < 6 %.
Glycaemic index calculations
The incremental AUC was calculated using the trapezoidal method(16). The GI of each potato cultivar was defined as the incremental AUC of the blood glucose response curve of a 25 g glycaemic carbohydrate portion expressed as a percentage of the response to the same amount of carbohydrate from the reference food. The GI was calculated from the two incremental glucose areas using glucose as a reference (i.e. GI of 100). One-way ANOVA was used to compare the final mean GI of the different cultivars.
In vitro potato digestibility procedure
In vitro digestion of starch from the cooked potatoes was determined using duplicate samples with a modified Englyst procedure(Reference Englyst, Kingman and Cummings19). Enzyme solution was prepared by suspending 0·45 g of porcine pancreatic α-amylase (150 U/mg; EC 3.2.1.1.; A3176, Sigma Chemical Company) in 16 ml of water at 37°C with magnetic stirring for 10 min. The mixture was centrifuged (1500 g for 10 min), and 2 ml of amyloglucosidase (3260 U/ml, EC 3.2.1.3.; Megazyme) were added to 10·8 ml of the enzyme supernatant. The preparation and cooking procedures of potatoes were the same as those used in GI testing. After cooking, the potato pieces were mashed evenly with a spatula, and an amount of mash containing 100 mg starch (dry weight) was dispersed into 4 ml of 0·1 m-sodium acetate buffer (pH 5·2). After adding 1 ml of the freshly prepared enzyme solution, the mixture was incubated in a shaking water-bath (37°C, 160 strokes/min). Aliquots (0·1 ml) were taken at time intervals that were the same as those used in GI testing and mixed with 1 ml of 95 % ethanol. Glucose that was released was measured using the glucose oxidase–peroxidase reagent according to the supplier's instructions (Megazyme International Ireland Limited).
Statistical analyses
Statistical analyses were carried out using the PASW statistical package (version 18.0; SPSS, Inc.). Inter- and intra-individual variations of the three standard (glucose) tests were assessed by determining the CV. One-way ANOVA followed by Duncan's test (P <0·05) was used to compare all the data obtained for the seven potato cultivars using the SPSS 20 Statistical Software Program (IBM Corporation) .
Results
Chemical composition and glycaemic index testing portions of the seven potato cultivars
The potato cultivars had different chemical compositions (Table 1). The Virginia Rose cultivar had the lowest total starch content (9·1 %), the highest reducing sugar content (0·68 %), the highest amylose content of starch (27·7 %) and the lowest glycaemic carbohydrate (9·8 g/100 g). In contrast, the Russset Burbank cultivar had the highest total starch content (16·0 %), the lowest reducing sugar content (0·16 %) and the highest glycaemic carbohydrate (16·2 g/100 g). Accordingly, the GI testing portion differed considerably with the smallest portion for the Russet Burbank cultivar (154 g) and the largest portion for the Virginia Rose cultivar (255 g).
Table 1 Carbohydrate content and glycaemic index (GI) testing portion of the seven potato cultivars* (Mean values and standard deviations, n 2 with the exception of reducing sugar content, where n 3)

a,b,c,dMean values within a column with unlike superscript letters are significantly different (P <0·05; one-way ANOVA).
* Percentage-wet basis, except for amylose content, which was percentage-starch basis.
In vivo glycaemic response
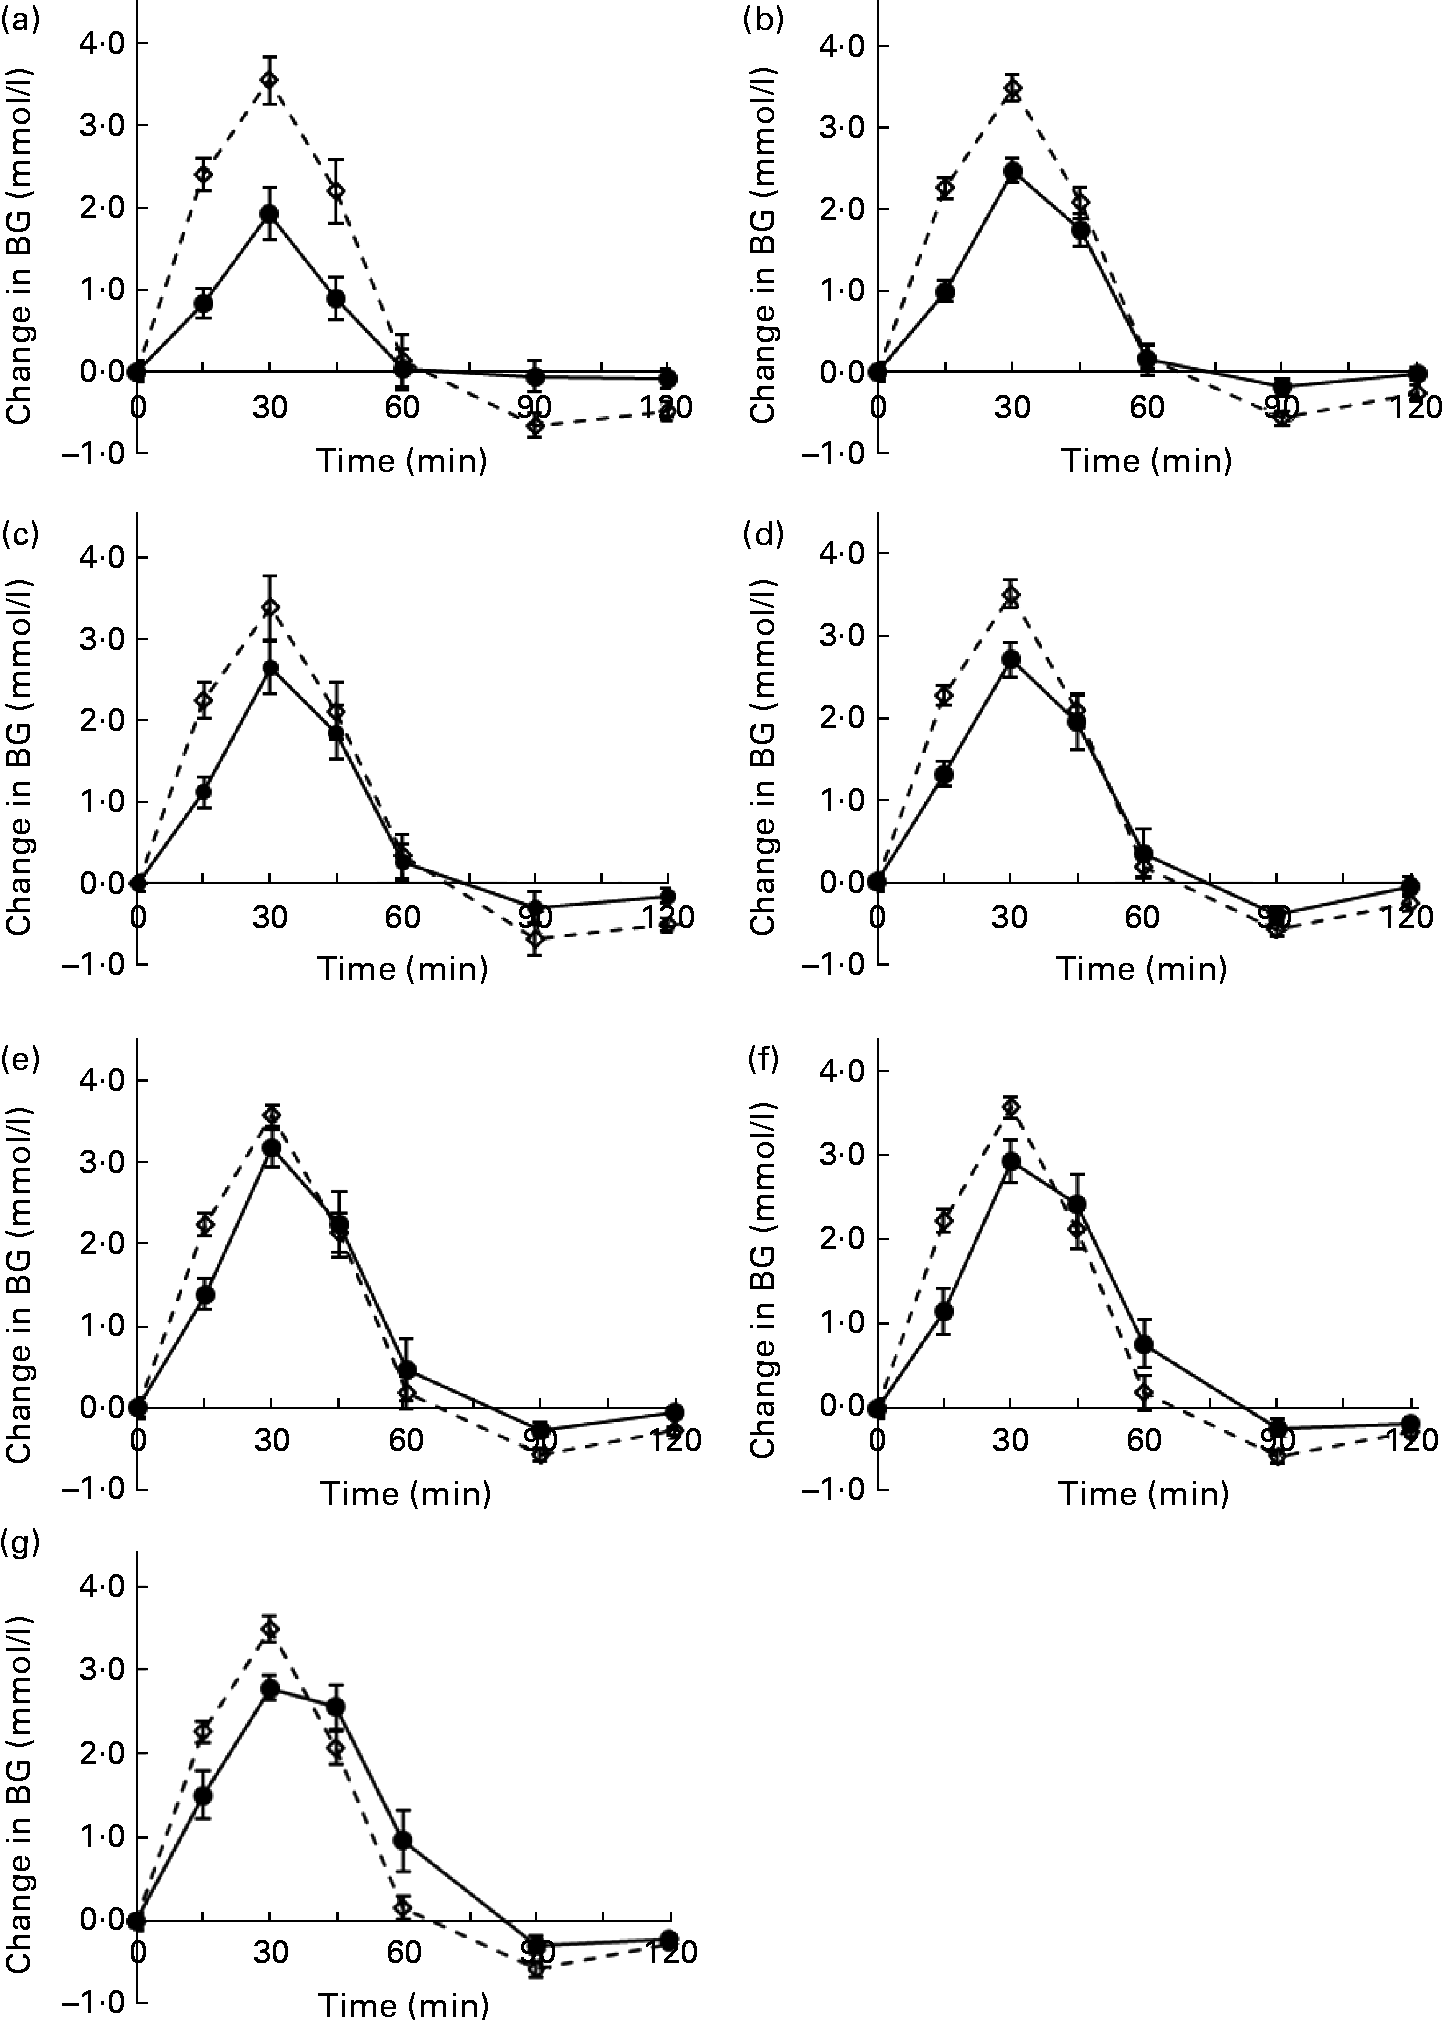
Blood glucose concentration increased to the maximum value at 30 min for all the potato cultivars and then decreased rapidly until 120 min. The postprandial response to the Carisma cultivar was lower than that to the other six potato cultivars at all time points (Fig. 1). When GI values were calculated (Table 2), there were significant differences among the cultivars. The majority had a high GI (70 or above), with the Nicola cultivar just falling into the medium-GI category (GI = 69). Only the Carisma cultivar fell into the low-GI category (GI = 53), according to the International Organisation for Standardisation-recommended classification(Reference Araya, Contreras and Alvina12).

Fig. 1 Blood glucose (BG) response curves for the seven potato cultivars: (a) Carisma; (b) Nicola; (c) Desiree; (d) Russet Burbank; (e) Virginia Rose; (f) Bintje; (g) Maiflower. ![]() , Glucose;
, Glucose; ![]() , glucose reference. Values are the mean change in BG levels (n 10), with their standard errors represented by vertical bars.
, glucose reference. Values are the mean change in BG levels (n 10), with their standard errors represented by vertical bars.
Table 2 Glycaemic index (GI) and classification of the seven potato cultivars (Mean values with their standard errors, n 10)
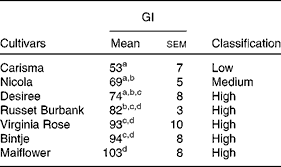
a,b,c,dMean values within a column with unlike superscript letters are significantly different (P <0·05; one-way ANOVA).
In vitro starch digestibility
The amount of glucose released from the cooked potatoes as a percentage of the initial 100 mg of starch increased progressively with time during in vitro digestion, reaching a plateau at 45–60 min, while the hydrolysis rate decreased gradually (Fig. 2). The percentage of starch hydrolysed at different time points is given in Table 3. The Carisma and Nicola cultivars exhibited significantly lower percentages of carbohydrate hydrolysed at all time points, e.g. 24·0 % by Carisma and 24·5 % by Nicola compared with 34·5 % by Bintje and 36·5 % by Maiflower after 15 min of hydrolysis. Similarly, by the end of 120 min, the Carisma and Nicola cultivars exhibited hydrolysis percentages of 50·5 and 52·2 %, respectively, compared with the Bintje and Maiflower cultivars exhibiting hydrolysis percentages of 67·0 and 76·8 %, respectively.
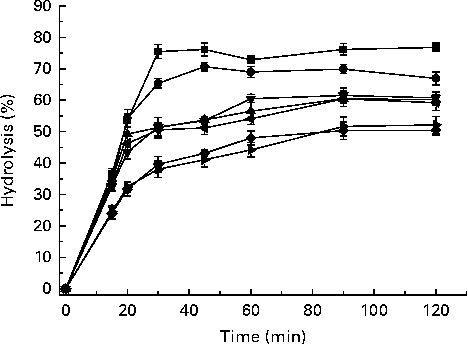
Fig. 2 Percentage of in vitro starch hydrolysis of cooked potatoes from different cultivars. Values are the mean hydrolysis percentages, with their standard errors represented by vertical bars. ![]() , Maiflower;
, Maiflower; ![]() , Bintje;
, Bintje; ![]() , Russet Burbank;
, Russet Burbank; ![]() , Virginia Rose;
, Virginia Rose; ![]() , Desiree;
, Desiree; ![]() , Nicola;
, Nicola; ![]() , Carisma.
, Carisma.
Table 3 Values for in vitro hydrolysis of starch in the seven potato cultivars (n 2)*
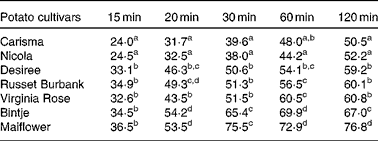
a,b,c,dMean values within a column with unlike superscript letters are significantly different (P <0·05).
* Values are the percentages of starch hydrolysed at each time point.
Correlation between in vivo glycaemic response and in vitro starch digestibility
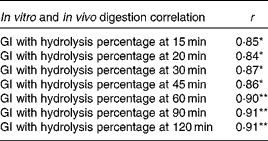
All the GI values of the cooked potatoes were significantly and positively correlated with hydrolysis percentage during in vitro starch digestion at each time point (Table 4). In vitro hydrolysis percentages at 90 and 120 min exhibited the strongest positive correlation with GI values (r 0·91 and P <0·01; Fig. 3). No significant correlations were found between GI values and amylose, dietary fibre or total starch content. Similarly, there were no correlations between in vitro starch digestibility and amylose, dietary fibre or total starch content.
Table 4 Correlation between glycaemic index (GI) and starch digestion percentage at different time points
*P <0·05, **P <0·01.
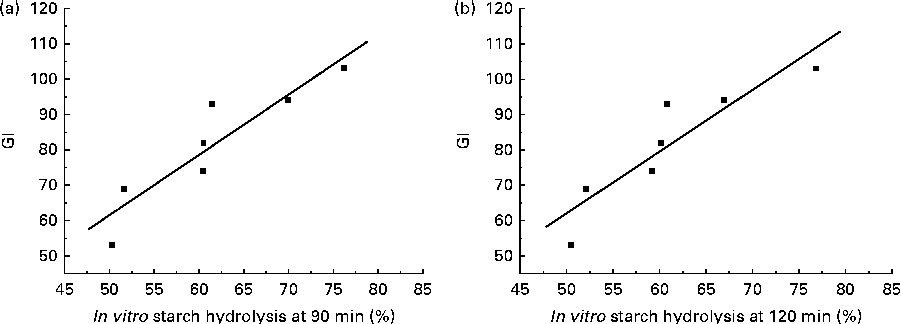
Fig. 3 Correlation between the ratio of in vitro starch digestibility (a) at 90 min (r 0·91; P= 0·00393) and that (b) at 120 min (r 0·91; P= 0·00493) and glycaemic index (GI) values of the cooked potatoes.
Discussion
The present study compared the in vivo and in vitro digestibility of a series of potato cultivars that had been prepared, cooked and consumed under identical conditions. Therefore, differences could be attributed to the characteristics of the potatoes rather than to differences in processing. Of the seven potato cultivars tested, the Carisma cultivar (GI = 53) was identified as low GI and the Nicola cultivar (GI = 69) as medium GI and the other five cultivars were identified as high GI (e.g. Russet Burbank, GI = 82). The low-GI property of the Carisma cultivar was unrelated to amylose or total starch content, but it could be predicted from in vitro measures of the rate of starch digestion. The amount of non-starch carbohydrate was too small ( < 1 g/100 g) to account for the large differences in blood glucose response. Previous studies on potatoes have shown a wide range of GI values from as low as 23 to as high as 118(Reference Atkinson, Foster-Powell and Brand-Miller8). However, much of this variability in GI values may be due to non-standard variations in methodology, inaccurate estimation of glycaemic carbohydrate content of the portion fed, differences in cooking method or processing before consumption, and the overall meal composition(Reference Atkinson, Foster-Powell and Brand-Miller8, Reference Fernandes, Velangi and Wolever20–Reference Ek, Brand-Miller and Copeland22).
For the purpose of comparison, we refer the reader to a condensed table of potato GI values listed in an earlier review(Reference Ek, Brand-Miller and Copeland22). This table shows that the GI values of potatoes ranged from 56 to 104 in studies where the cultivar was specified and tested with no additional ingredients and when at least ten healthy subjects were used(Reference Ek, Brand-Miller and Copeland22). The Marfona cultivar had a GI value of 56 compared with the Maris Piper cultivar having a value of 85, when both the cultivars were boiled for 15 min before consumption(Reference Henry, Lightowler and Strik23). These findings, similar to those of the present study, show that there is considerable variability in the GI values of potatoes solely due to botanical characteristics.
Another important finding of the present study was the significant positive correlation between the rate of in vitro digestion and the in vivo glycaemic response. The blood glucose response curves of each of the seven potato cultivars showed a similar rate of increase in blood glucose levels (Fig. 1) to the rate of carbohydrate hydrolysis (Fig. 2). The strong correlation between the hydrolysis percentage at 120 min and GI values indicates that the glycaemic response to the potatoes was largely dependent on the percentage of starch hydrolysed by 120 min measured by the in vitro method. As much as 75 % of the total starch in raw potatoes is highly resistant to enzymatic attack(Reference Englyst, Trowell and Southgate24, Reference Kingman and Englyst25). As the cooking time used in the present study was relatively short (as specified by the potato growers), starch gelatinisation may not have been complete(Reference Hoover26) and the potatoes consumed would have contained a mixture of granules with a partially disrupted structure. Under the same cooking conditions, however, differences between the cultivars with regard to the fine structure of starch would have resulted in the conversion of different amounts of the enzymatically resistant starch in raw potatoes into available starch for hydrolysis.
To the best of our knowledge, this is the first time that the in vitro digestibility of starch has reliably predicted GI classifications for the same food item prepared in the same way but varying only in botanical origin. This has important practical implications in that simple in vitro digestion methods might be used to screen foods and as a predictor of GI classification, i.e. high or low GI, although the actual GI value of the food would require in vivo testing. However, it is likely that the in vitro method is more suitable for screening simple foods such as potatoes, rather than for screening complex foods with a mixture of ingredients. High-throughput in vitro methods would be greatly useful for plant breeding programmes that seek to improve the glycaemic response of carbohydrates in food crops.
The present study has shown that under identical cooking conditions, potato cultivars with similar amylose content differ significantly in both in vitro digestion and in vivo blood glucose responses. The composition and state of starch in foods are the major determinants of the rate at which foods are digested and at which they elicit postprandial blood glucose and insulin responses. In general, native starches with high amylose content are considered to be more resistant to enzymatic digestion, whereas high-amylopectin starches are more susceptible to digestion. High-amylose native starches are thought to be more difficult to swell and gelatinise under typical cooking conditions, and therefore digested more slowly, eliciting lower blood glucose and insulin responses than those with low amylose content(Reference Goddard, Young and Marcus27, Reference Thorne, Thompson and Jenkins28). However, this interpretation needs refinement as the fine structure of amylose and amylopectin has also been shown to be important in the determination of the digestibility of starch(Reference Blazek and Copeland29, Reference Syahariza, Sar and Hasjim30).
Starch-containing foods that are digested slowly and elicit a low glycaemic response have been considered to be more beneficial to health and in the prevention and management of diabetes and hyperlipidaemia than starchy foods that are digested rapidly and elicit high glycaemic responses(Reference Ludwig6, Reference Eckel, Grundy and Zimmet31, Reference Venn and Green32). Hence, the identification of foods with a low GI and the factors that influence GI should be of continuing research interest in the future. It is pertinent that the two lowest-GI cultivars did not produce an undershoot in postprandial glucose values below baseline levels, as this has implications for appetite control through decreased satiety or increased hunger and subsequent food intake.
In summary, the present study identified the first commercially grown low-GI cultivar of potato (Carisma, GI = 53) among a group of commonly used and newly introduced cultivars. We demonstrated that the rate of in vitro digestion of starch, in particular, the percentage of available (glycaemic) carbohydrate hydrolysed by 120 min in the cooked potato product, could be used as a predictor of the GI classification. The importance and popularity of potatoes as a food crop dictate the need to identify and develop cultivars that are digested slowly and have a low GI, regardless of the preparation method.
Acknowledgements
The authors thank the Mitolo Group and Agronico for supplying the potato cultivars used in the present study.
K. L. E. is supported by a scholarship from Agrico Holland, the Mitolo Group (Australia) and the Glycaemic Index Foundation Limited. S. W. is the recipient of the University of Sydney Postdoctoral Research Fellowship Scheme (U2527-2009/2012). Agrico Holland, the Mitolo Group (Australia), the Glycaemic Index Foundation Limited and the University of Sydney Postdoctoral Research Fellowship Scheme had no role in the design and analysis of the study or in the writing of this article.
The author's responsibilities were as follows: J. C. B.-M., L. C. and K. L. E. designed and conceived the study; K. L. E. selected the potato cultivars, conducted the chemical analyses and GI testing, and undertook statistical analyses; K. L. E. and S. W. conducted the starch extraction and in vitro experiment; S. W. analysed the in vitro digestibility data and carried out all correlation analyses; K. L. E. and S. W. interpreted the findings and wrote the manuscript; L. C. and J. C. B.-M. reviewed and edited the paper. All authors read and approved the final manuscript.
K. L. E., S. W. and L. C. have no conflicts of interest to declare. J. C. B.-M. is a co-author of The Low GI Handbook book and other books (DeCapo, New York, NY), President of the Glycaemic Index Foundation, and Director of a non-profit GI-based food endorsement programme in Australia and manages the University of Sydney GI testing service.


