


Fe deficiency remains one of the most serious and prevalent health problems worldwide, with > 1·1 billion individuals experiencing more severe haematological manifestations, that is, Fe deficiency anaemia(Reference Camaschella1,Reference Safiri, Kolahi and Noori2) . Additionally, a higher number of cases, which remain unclear, are undiagnosed with depleted body Fe stores due to an absence of abnormal concentrations of Hb(Reference Camaschella1). Despite the contrast in the main underlying aetiologies between developed and developing countries, the majority of Fe deficiency cases result from insufficient Fe intake and/or bioavailability to cover the body requirements of high-risk groups, especially preschool children and women of childbearing age(Reference Camaschella1). According to the Global Burden of Disease Study, Fe deficiency was ranked as the leading risk factor attributable to years lived with disability burden among adolescents and young adults in 2019(Reference Murray, Aravkin and Zheng3). This is not surprising, owing to the primordial roles of body Fe not only in oxygen transport but also in various physiological and cellular processes, such as energy production, immunity, neurotransmission, and DNA synthesis and repair(4).
Dietary Fe can be found in the form of the highly bioavailable haem, exclusively present in animal tissues, and in various forms of non-haem, widely distributed in both animal- and plant-derived foods(4). Mandatory or voluntary Fe fortification of staple foods, especially grains and condiments, is an interventional strategy adopted by many countries as part of public health policies aimed at preventing Fe deficiency(Reference Hurrel5). Therefore, iron-fortified wheat and maize products, rice, breakfast cereals, infant formulas, oil, and salt may also contribute to increasing the dietary Fe intake of populations(Reference Hurrel5,Reference Tong and Walker6) . Iron-fortified foods are present in > 87 countries despite greatly varying in their contribution to the RDA across high-, middle-, and low-income settings and were presumed to prevent > 4 million cases of Fe deficiency anaemia among women of childbearing age in 2021(Reference Tong and Walker6).
In Brazil, fortified wheat and maize flours have been mandated since July 2004 by a law that requires the provision of at least 30 % of the RDA of Fe for healthy male and women adults in each serving of 100 g of these foods/ingredients (4·2 mg of iron/100 g of flour)(7). According to the WHO, a decreasing trend in the prevalence of low Hb levels among women of childbearing age occurred in the country from 2004 (24·9 %) to 2018 (16·2 %)(8). However, no nationally representative data on biomarker changes in population Fe status have been assessed following the implementation of the fortification programme, precluding conclusions on its real effectiveness in preventing Fe deficiency(Reference Santos, Nilson and Verly Junior9). As an alternative and complementary evaluation in this regard, data on post-fortification dietary Fe intake inadequacy of adolescents, adults and elderly individuals were assessed in the first National Dietary Survey-Brazilian Household Budget Survey (NDS-HBS) performed in 2008–2009(Reference Veiga, Costa and Araujo10–13). With a new, recently released edition of the NDS-HBS(14), it is now possible to assess the long-term trends of the impact of food fortification on dietary Fe intake across the country.
Hence, the present study aimed to assess the dietary Fe intakes and the prevalence of inadequate Fe intake over two distinct post-fortification periods (2008–2009 and 2017–2018) in Brazil according to sex, life stage, geographic region and stratum of family income per capita. We intend to provide scientific evidence to better comprehend dietary Fe intake data in different contexts and consequently guide the (re)formulation of effective public health strategies to combat Fe deficiency.
Methods
Study population and design
The NDS are part of the HBS 2008–2009 and HBS 2017–2018, the two most recent nationwide surveys conducted by the Brazilian Institute of Geography and Statistics (IBGE) using household samplings to measure living conditions, incomes, expenditures and consumption profiles of families(13,14) . Both HBS had two-stage cluster sampling, in which census sectors and households were randomly selected with geographical and socio-economic stratifications of the primary sampling units based on the 2000 Demographic Census. Subsamples of 13 569 and 20 112 households from 55 970 (24·2 %) and 57 920 (34·7 %) households included in the HBS were randomly selected for the NDS 2008–2009 and NDS 2017–2018, with food consumption data collected from all residents aged ≥ 10 years, totalling information from 34 003 and 46 164 individuals, respectively. Presently, we excluded pregnant and lactating women (n 1254 in 2008–2009 and n 1420 in 2017–2018), totalling 32 749 and 44 744 individuals, respectively, in the final samples.
Dietary intake assessment
In both surveys, individual food consumption was assessed on two non-consecutive days, selected during the week in which the researcher agent visited the household, with weekdays and weekends being represented throughout the 12 months of the survey period: May 2008 to May 2009 (NDS 2008–2009) and July 2017 to July 2018 (NDS 2017–2018). Details on data collection, training, quality control and imputation can be found in the official IBGE publications(13,14) .
In 2008–2009, the instrument used was food records (FR). Individuals were instructed to record all foods and beverages consumed throughout the day (97 % responded to a second food record), including details on eating time, occasion and place, recipes, ingredients, and food preparation methods, with portion sizes preferably quantified in household measures. During household interviews, all recorded information was reviewed, completed when necessary, and typed by research agents on a specific data entry programme installed on tablets(13).
In 2017–2018, the 24-h recalls (24hR) were used. Individuals were asked to report all food and beverages (including water) consumed during the previous day in an in-person structured interview (84 % responded to a second 24hR), following the US Department of Agriculture (USDA) Automated Multiple-Pass Method(Reference Moshfegh, Rhodes and Baer15). While the interviewee reported the data uninterruptedly, the interviewer made a quick list on paper, registering eating time, occasion and place. Similar to the previous survey, research agents used a specific data entry programme installed on tablets to detail data from the quick list, including recipes, ingredients, food preparation methods, portion sizes in household measures and items added to foods(14).
The food and beverage intake databases had 1503 items in the NDS 2008–2009 and 1832 items in the NDS 2017–2018(Reference Rodrigues, De Carli and Araujo16). To estimate the amounts consumed of each food or beverage, in both surveys, the Table of Reference Measures for Food Consumed in Brazil developed in NDS 2008–2009 and reviewed and updated in NDS 2017–2018 was used(17). This tool is a compilation of data from national tables of household measurements, food labels, scientific articles and direct weight measurements performed in research centres at Brazilian universities. This table provides the mass units (g) of each food and beverage referred in the two surveys(17). Dietary Fe intake was calculated using the Brazilian Food Composition Table (TBCA-USP), version 7.0(18). This database considers both the intrinsic Fe content of all foods and added Fe from the national mandatory fortification(Reference Grande, Giuntini and Coelho19). Supplemental Fe was not evaluated in the present study.
Statistical analysis
The National Cancer Institute method was used to estimate the distributions of usual dietary Fe intake, accounting for within-person variation, using a mixed-effect model after the Box-Cox transformation(Reference Tooze, Midthune and Dodd20). Model parameters (population mean, within- and between-person variances, and lambda value for the Box-Cox transformation) were estimated on the basis of data from the two FR or 24hR and then used to create usual consumption distributions, employing Monte Carlo simulations. Data were estimated for the entire population and by strata of sex-age, income and geographic regions. Sex-age groups were categorised, as defined by the US Institute of Medicine (IOM), into 10–13 years, 14–18 years, 19–30 years, 31–50 years and ≥ 51 years old(4). Geographic regions were categorised as north, northeast, southeast, south and central-west, and income strata as <0·5, 0·5 to 1, 1 to 2, and > 2 per capita minimum wage (equivalent to R$ 415·00 or U$$ 174·40 on 15 January 2009, and R$ 954·00 or U$$ 298·50 on 15 January 2018).
Dietary Reference Intake values proposed by the IOM were used as criteria to estimate the probability of individuals not meeting dietary Fe requirements, that is, the prevalence of inadequate Fe intake. A feasible way to estimate is to calculate the proportion of a population with usual intake levels below its respective Estimated Average Requirement, provided that the following assumptions are satisfied: (a) the distribution of nutrient intake is independent of the distribution of requirement; (b) the distribution of nutrient requirements is symmetrical; and (c) the distribution of nutrient requirements has lower variance compared with the distribution of nutrient intakes(21). Considering Fe data from the analysed sex-age groups, the Estimated Average Requirement cut-off point method could not be employed among women of reproductive age (14–50 years old), as the distribution of Fe requirement is skewed. Therefore, in this group, it was necessary to use a full probabilistic approach attaching the probability of inadequacy to each individual’s usual Fe intake, considering the distribution of Fe requirement for the specific population. The prevalence of inadequate Fe intake was then calculated as the average risk of inadequacy for all individuals in the population group(21).
Particularly, the Fe requirement distributions employed in the probabilistic approach were calculated by weighing specific IOM reference values for users and non-users of hormonal contraceptives according to their respective prevalence among Brazilians women aged 14–18 years (23·9 % and 76·1 %), 19–30 years (49·5 % and 50·5 %) and 31–50 years (26·1 % and 73·9 %), as described in a national representative study performed in 2013–2014(Reference Farias, Leite and Tavares22). This modification was adopted considering that menstrual blood losses are approximately 60 % lower among hormonal contraceptives users. Thus, IOM’s reference values proposed for a mixed population would overestimate Fe requirements in our setting, since it assumes that more than 80 % of adolescent and adult women are naturally menstruating and do not use hormonal contraceptives(4).
The Brazilian surveys have a slightly different design from that used in the National Cancer Institute method. A variation of the Balanced Repeated Replication method, known as Fay’s Balanced Repeated Replication method, was used to calculate 95 % CI(Reference Barbosa, Sichieri and Junger23). The results of 95 % CI were used to compare dietary values across sex-age, region and income groups, as well as between survey periods. These statistical analyses were performed with the aid of the SAS® software of the SAS System for Windows, version 9.4.
To estimate the major contributors to the total Fe intake in each survey, food items were categorised according to their conceptual and nutritional similarities, following an original proposal of IBGE(13), with adaptations to aggregate iron-poor food groups (i.e. coffee and tea, soda and other non-alcoholic beverages, and vegetables, leaves, roots, and soups) and to disaggregate iron-rich food groups (i.e. meats and fortified maize flour recipes). The final twenty food groups considered in the analyses were alcoholic drinks, added sugars and sweeteners, beans, breads, cakes and cookies, cassava flour and farofas, dairy products, eggs, fish and seafood, fortified maize flour recipes, fruits and nuts/seeds, red meats, non-alcoholic beverages, offal, oils and fats, pasta and pizza, poultry, processed meats, rice and other cereals, and soups, roots and vegetables. The contribution of each food group to the total Fe intake was estimated for the entire population as well as according to sex, age, income and geographic region groups using the approach proposed by Block et al. (Reference Block, Dresser and Hartman24). All analyses were performed weighted and taking into account the complexity of the surveys with the aid of STATA® Statistics/Data Analysis software, version 14.2.
Results
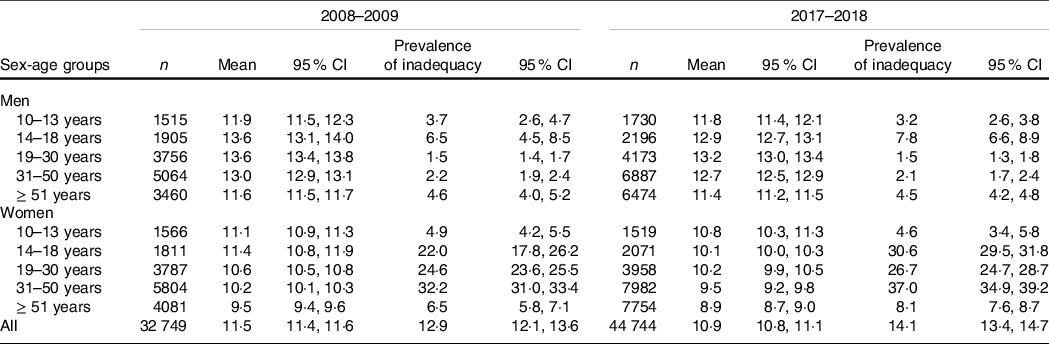
As presented in Table 1, mean Fe intakes of Brazilians aged ≥ 10 years were 11·5 mg/d in 2008–2009 and 10·9 mg/d in 2017–2018, without a significant difference in the estimated overall prevalence of inadequacy between the two periods (12·9 %; 95 % CI 12·1, 13·6 v. 14·1 %; 95 % CI 13·4, 14·7, respectively). Nevertheless, when assessing sex-age groups, significant variations in overall Fe intakes between 2008–2009 and 2017–2018 were found for women, except those aged 10–13 and 19–30 years, with the highest relative increase in inadequacy values occurring among adolescents aged 14–18 years (22·0 %; 95 % CI 17·8, 26·2 v. 30·6 %; 95 % CI 29·5, 31·8, respectively). Meanwhile, the overall highest prevalence of Fe intake inadequacy was observed among women aged 31–50 years in 2017–2018 (37·0 %; 95 % CI 34·9, 39·2).
Table 1. Mean Fe intake (mg/d) and prevalence of inadequate Fe intake (%) according to sex and age groups in the National Dietary Survey: 2008–2009 and 2017–2018
Individuals classified in the first stratum of family income per capita had lower Fe intakes in comparison with counterparts of the same sex and age groups, with prevalence of inadequacy reaching above 40 % among women aged 31–50 years, but without significant variations between the studied periods (Tables 2 and 3). In this regard, increases in inadequate Fe intakes over time were found only among women aged 14–18 years with family income per capita classified from the second stratum, from the third stratum on for women aged 31–50 and ≥ 51 years, and in the fourth stratum for women aged 19–30 years (Table 2).
Table 2. Mean Fe intake (mg/d) and prevalence of inadequate Fe intake (%) among men according to age and family income per capita groups in the National Dietary Survey: 2008–2009 and 2017–2018
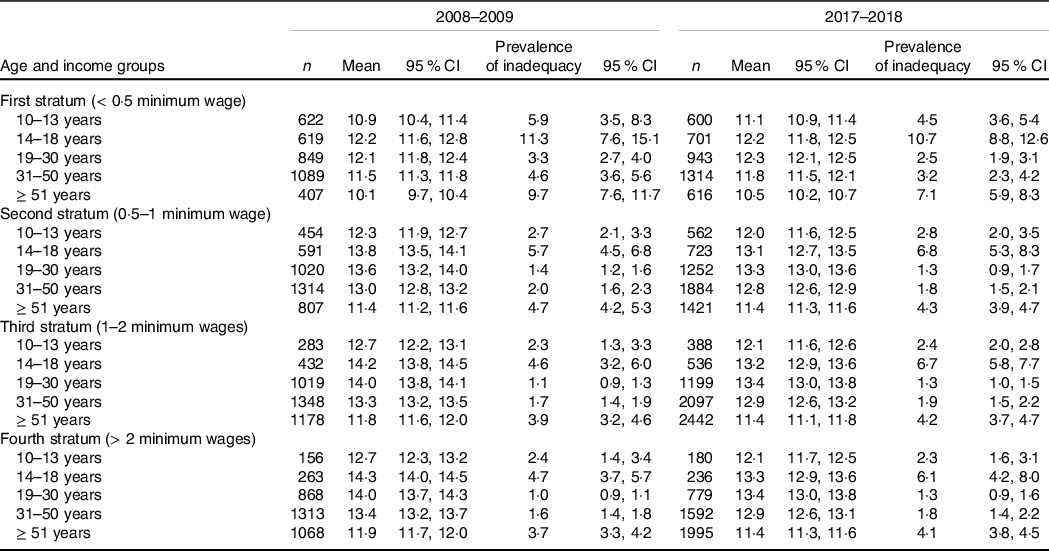
Table 3. Mean Fe intake (mg/d) and prevalence of inadequate Fe intake (%) among women according to age and family income per capita groups in the National Dietary Survey: 2008–2009 and 2017–2018

When exploring regional differences, it was found that variations between 2008–2009 and 2017–2018 in the prevalence of Fe intake inadequacy among women occurred in all Brazilian regions for adolescents aged 14–18 years, but only in the southern region for adults aged 31–50 years and in the southeast region for adults of all age groups (Table 4). Furthermore, in the last region, a slight increase (< 0·5 percentage point) in the prevalence of Fe intake inadequacy was found for adult men aged 19–30 years (Table 5). Exceptionally, a slight reduction (< 2·0 percentage points) in the prevalence of Fe intake inadequacy over time was found among males aged ≥ 51 years from the northeast region (Table 5).
Table 4. Mean Fe intake (mg/d) and prevalence of inadequate Fe intake (%) among women according to age and Brazilian geographic regions groups in the National Dietary Survey: 2008–2009 and 2017–2018

Table 5. Mean Fe intake (mg/d) and prevalence of inadequate Fe intake (%) among men according to age and Brazilian geographic regions groups in the National Dietary Survey: 2008–2009 and 2017–2018

The top five food groups contributing to approximately 70 % of Fe intake in the entire Brazilian population were beans (all types of beans and peas, dishes prepared with beans and peas, and vegetable proteins), breads (all types of whole and white breads), red meats (all cuts of beef, pork, lamb, and goat), pasta and pizza (all types of pasta, pizzas, sandwiches, and fried or baked cafeteria items), and cakes and cookies (all types of cakes, cookies and crackers), both in 2009–2008 and 2017–2019, but with some regional variation in their respective ranking positions (Table 6). Particularly in the southern region, iron-fortified foods contributed to total Fe intakes ranked above beans, with breads leading in 2008–2009 and pasta and pizza in 2017–2018. In turn, only in the central-west region, red meat had a contribution to total Fe intake higher than breads in both assessed periods (Table 6).
Table 6. Relative and cumulative contribution (%) of food groups to Fe intake in Brazil and geographic regions groups. Brazilian National Dietary Survey: 2008–2009 and 2017–2018

Both in 2008–2009 and in 2017–2018, the pattern of food Fe sources was comparable across sex (online Supplementary Table 1) and age groups (online Supplementary Table 2), while contrasts in the contribution of beans to the total mineral intake were found among individuals in the fourth stratum of family income per capita (about 16 %) compared with others (about 25 %) (online Supplementary Table 3). However, over the studied periods, few variations occurred in the ranking of food Fe source relevancy across sex, age and income groups (online Supplementary Tables 1, 2 and 3).
Discussion
The dietary Fe intake of Brazilians aged ≥ 10 years remained almost unchanged over an interval of 10 years in the post-fortification era, according to data from the two largest national surveys of food consumption. However, a trend for an increase in the prevalence of Fe intake inadequacy was found between 2008–2009 and 2017–2018 among menstruating adolescent and older adult women, despite few variations in the relative contribution of major iron-sourced foods. Hence, the inadequacy of Fe intake among women of childbearing age, which was already concerning in 2008–2009, remained high in 2017–2018, with more than one-quarter showing inadequacy irrespective of the studied income strata and Brazilian regions.
The estimated mean dietary Fe intakes, after stratifying by sex-age groups, ranged from 9·5 to 13·6 mg/d in 2008–2009 and from 8·9 to 13·2 mg/d in 2017–2018. Despite a lack of national population-based Fe intake data from the pre-fortification era, our mean values showed similarities to those described by Vieira et al. (2017) and Sales et al. (2021) for representative samples of adolescents, adults and elderly residents in São Paulo-SP, the largest Brazilian city, in 2008 (7·8 to 15·2 mg/d)(Reference Vieira, Steluti and Verly25) and in 2015 (7·8 to 12·0 mg/d)(Reference Sales, Rogero and Sarti26), while significantly higher from those found in 2003 (3·9 to 7·0 mg/d)(Reference Vieira, Steluti and Verly25). These data are in line with improvements in Fe intake and population status among countries that have adopted strategies for flour fortification with Fe(Reference Sadighi, Nedjat and Rostami27). However, recent mean Fe intakes of Brazilians are consistently below those described for North Americans of similar sex-age groups in the National Health and Nutrition Examination Survey (NHANES) 2017–2018 (11·6 to 16·8 mg/d)(28), despite exposure to similar amounts of Fe added to flours by mandated fortification (4·2 v. 4·4 mg/100 g, respectively)(7,29) .
Irrespective of sex-age groups, the highest prevalence of Fe intake inadequacy was found among individuals from the lowest family income stratum (< 0·5 wage per capita), both in 2008–2009 and in 2017–2018. Socio-economic disparities have already been described in the same population for the intake of other micronutrients, such as vitamin C, vitamin A, riboflavin and thiamine(Reference Verly Junior, Marchioni and Araujo30). This is despite iron-rich sources such as beans, breads and beef being among the top six most commonly consumed foods in Brazil(Reference Rodrigues, Souza and Bezerra31), even among the poorest stratum of the population(14). National data suggest that, in 2009 and in 2017–2018, 13 % and 14 % of Brazilians were experiencing quantitative food restriction or disruption in eating patterns resulting from the lack of food, respectively(32). Low energy and micronutrient intake associated with severe food insecurity have been described by Kubo et al. using data from the NDS-HBS 2008–2009(Reference Kubo, Costa and Gubert33). Although poor food consumption cannot be explained by socio-economic restriction alone, it is worth to noting that the highest Fe intake inadequacy observed here among women aged 31–50 years from the lowest stratum of family income (> 40 %) was similarly described in that survey among menstruating women in the highest quartile for food insecurity risk(Reference Kubo, Costa and Gubert33). These findings suggest that, along with the fortification policy, any strategy that aims to improve Fe intake in Brazil needs to emphasise on the equitable physical and financial access of the most disadvantaged population to regular and sufficient high-quality foods.
Contrastingly, while Fe intake did not significantly vary among the poorest, the most important reductions were paradoxically found among the wealthiest women. This was especially true for menstruating adolescent and adult women aged 31–50 years from the two upper-strata of family income, for which inadequacy figures increased by approximately 50 % and 20 % from 2008–2009 to 2017–2018, respectively. Accordingly, significant Fe intake differences over time were more pronounced among women from the wealthiest Brazilian regions (southeast and southern) relative to those from the poorest regions (north and northeast). Possible explanations for these results might be related to previously described sociodemographic disparities in the nutritional transition-related trends of substituting traditional staple Brazilian foods, such as rice and beans, for more convenient alternative items, such as ready-to-eat and ultra-processed products(Reference Popkin and Reardon34–Reference Granado, Maia and Mendes36). In fact, studies with adolescent students and adults from capital cities suggest that the frequency of regular consumption of beans (≥ 5 times/week) over the last decade declined mainly among women compared with men (–3·6 % v. –2·9 %/year between 2009 and 2015(Reference Gonçalves, Canella and Bandoni35) and –1·4 % v. –1·2 %/year between 2012 and 2017(Reference Granado, Maia and Mendes36), respectively). In turn, data from the NDS-HBS indicated that decreasing trends between 2008–2009 and 2017–2018 in the frequency of consumption of rice (–9·4 %) and breads (–19·2 %) were especially pronounced among individuals with a family income above two minimum wages per capita (–16·0 % and –28·1 %, respectively)(14,Reference Rodrigues, Souza and Bezerra31) . Women and individuals from the highest income strata have also consistently scored the lowest adherence to a traditional Brazilian food consumption pattern, characterised by rice, beans and meats(Reference Antunes, Cunha and Baltar37,Reference Andrade, Louzada and Azeredo38) , while also exhibiting the highest percentage of dietary energy shared by ultra-processed foods, such as fast foods and sweets(Reference Louzada, Baraldi and Steele39). In this context, an overall dilution of dietary Fe as a possible consequence of these dietary pattern combinations has been previously suggested(Reference Louzada, Baraldi and Steele39,Reference Louzada, Martins and Canella40) , owing to the lower Fe content of ultra-processed products in relation to the same energy units of natural or minimally processed foods(Reference Louzada, Martins and Canella40). This phenomenon is in line with the described constancy in the total energy intake estimated in the NDS-HBS 2008–2009 and 2017–2018(Reference Verly Junior, Marchioni and Araujo30) and with the few variations found in the cumulative contribution of major food sources to the total mineral intake, despite its mean reduction over time.
The specific sex- and income-decreasing trend of Fe intake found in the present study signals relevant challenges for public health policies aimed at combating Fe deficiency in the country. Over the last decades, as in other Latin American countries, profound socio-economic transformations in the food systems of Brazil have evolved in parallel with deteriorating diet quality and an increase in the prevalence of obesity, especially among women(Reference Popkin and Reardon34). While this high-risk group is mainly targeted by the food fortification policy(Reference Hurrel5), a number of iron-fortified foods include some types of cookies, snacks, packed breads, and ready-to-eat cakes, pastas, and pizzas. These food groups should be avoided in order to control the overweight and obesity epidemics, considering their classification as ultra-processed products(Reference Gonçalves, Canella and Bandoni35,41) . Instead, consumption of natural food sources of Fe should be encouraged. Notwithstanding, recommended reductions in the high levels of meat consumption in Brazil, in line with the current national dietary guidelines to fight malnutrition and climate change(41), should have an effect on the population Fe intake and needs to be carefully evaluated, as performed by other studies in different settings(Reference Farsi, Uthumange and Munoz42–Reference Vatanparast, Islam and Shafiee44). Besides beans and iron-fortified foods, potential plant-based iron-sourced alternatives to meats include nuts and whole cereals, which lack haem Fe and contain the relatively low bioavailable non-haem iron(4).
According to our findings, the previously described concerns regarding the effectiveness of the mandatory Fe fortification policy seemed to have persisted in Brazil over the last decade. As pointed out by Santos et al. (2014), already in 2008–2009, the estimated average consumption of wheat and maize flour by Brazilians (about 80 g/d) was somewhat lower than that planned when designing the Fe fortification programme (100 g/d)(Reference Santos, Nilson and Verly Junior9). Despite our limitation in not directly measuring flour intakes by disaggregating all recipes into ingredients, this scenario did not vary substantially in 2017–2018, considering the relatively constant contribution of the main iron-fortified foods (breads, pasta and pizza, cake and cookies, and fortified maize flour recipes) to the total mineral intake in both studied periods (approximately 40 %). It is worth mentioning that rates of compliance with the minimum recommended Fe fortification level in Brazil have been suggested to be above 80 %, based on flour samples analysed between 2006 and 2019 by a governmental surveillance commission(45,46) . With this in mind, another important concern raised is that elemental Fe was mostly employed by Brazilian mills for fortification purposes, despite its low bioavailability(Reference Santos, Nilson and Verly Junior9). In this sense, an update of the fortification programme, with compliance starting in April 2019, has established the obligatory addition of 4 to 9 mg of Fe to each 100 g of wheat and maize flours(47). This update also limits mills to the use of the high bioavailability compounds ferrous sulphate and ferrous fumarate(47).
This study had some limitations. The first is related to changes in the dietary data collection instruments between the two surveys, with FR used in 2008–2009 while 24hR in 2017–2018(Reference Rodrigues, De Carli and Araujo16), which could bias Fe inadequacy figures differently. In fact, the recent methodological change was mainly driven by evidence from validation studies pointing to a lower degree of energy underreporting in 24hR than in FR(Reference Lopes, Luiz and Hoffman48). However, a compatibility study concluded that comparison concerns between the two surveys would be mainly regarding data on added sugars and fats(Reference Rodrigues, De Carli and Araujo16), which do not directly interfere with the estimates of dietary Fe, as both methods allow us to obtain detailed information on the consumption of the main iron-rich foods and beverages. Another limitation is that our Fe intake estimates did not account for supplement use. Despite being unavailable in the NDS-HBS 2008–2009, the information was assessed in the NDS-HBS 2017–2018, from which it was estimated that 2·4 % of the overall population was using an iron-containing tablet or powder during the preceding 30 d(14). It is noteworthy that pregnant and lactating women, who were excluded from our analysis, accounted for > 75 % of Fe supplement users in the country, possibly reflecting their benefit as the main targeted groups receiving, since 2005, prophylactic ferrous sulphate from the National Iron Supplementation Program (Programa Nacional de Suplementação de Ferro)(49).
Owing to the lack of a comprehensive Brazilian food composition database on haem Fe, phytate and iron-binding polyphenols, we could not directly evaluate the dietary Fe bioavailability in our study, which represents another limitation. In addition, considering the current lack of specific Fe requirement distributions or dietary recommendation references for the Brazilian population, we relied on the proposal of the US IOM, as in previous national studies(Reference Veiga, Costa and Araujo10–13,Reference Block, Dresser and Hartman24,Reference Vieira, Steluti and Verly25) . Although we could not guarantee the feasibility of assuming the recommended values, it is worth mentioning that, even in the USA, the IOM’s dietary bioavailability factor has been criticised(Reference Armah, Carriquiry and Reddy50). However, a small study including Brazilian women with a similar Fe intake pattern from the general population suggested that assuming North American dietary reference values, based on the estimated bioavailability of a Western-style diet (18 %), might be acceptable in our setting(Reference De Carli, Dias and Morimoto51). Moreover, against a possible variation in dietary Fe bioavailability over the studied period, which could not be ignored, we observed that red meat, the major dietary source of haem Fe(4), showed quite similar contributions to the total Fe intake of the population in 2008–2009 (about 13 %) and 2017–2018 (about 14 %).
The use of data from the two largest representative surveys of dietary intake in Brazil is one of the major strengths of this study. Different from that performed at the time of the first NDS-HBS, when the North American nutrient database derived from the Nutrition Data System for Research (NDSR) software (University of Minnesota, 2003) aided the assessment of Fe intakes(13), here, we have used genuine national food composition values, dispensing corrections for differences in flour fortification levels between the USA and Brazil, allowing more accurate estimates and precise comparisons(Reference Grande, Giuntini and Coelho19). Furthermore, rather than assuming a unique Fe requirement distribution from the IOM’s proposed alternatives for adolescent and adult menstruating women(4), we used the best quality available data on hormonal contraceptive use from a population-based study performed at the midpoint between the surveys (2013–2014) to weigh dietary Fe inadequacy figures based on the specific prevalence of hormonal contraceptive use in the Brazilian population(Reference Farias, Leite and Tavares22). This approach provides us with more realistic results and allows us to verify nuances of intervention priorities within this greatest risk population group, for example, highlighting women aged 19–31 years with a relatively lower prevalence of Fe intake inadequacy, even with a comparable or higher mean Fe intake than those from other age groups, owing to the high frequency of hormonal contraceptive use (about 50 %)(Reference Farias, Leite and Tavares22).
This study demonstrated that, 4 to 5 and 13 to 14 years after the implementation of the national mandatory Fe fortification programme in Brazil, the prevalence of Fe intake inadequacy remained high in the targeted group of menstruating women. This was especially true for the lowest income stratum, for which figures reaching approximately 40 % were found in both studied periods for prevalence of inadequate Fe intake. Conversely, women from the highest income strata and from the richest Brazilian regions appear to have modified their Fe intake between 2008–2009 and 2017–2008, particularly those in the extremities of the childbearing age range, with the highest reductions observed among adolescent women. We also highlighted that wheat and maize flours were staple foods regularly and widely consumed across the country over the studied periods. This was reflected in iron-fortified foods contributing to approximately 40 % of total mineral intake, exceeding the relevancy of isolated naturally iron-sourced foods, such as beans and red meats. The results suggest a sustained dietary impact of the Fe fortification programme of flour. Despite its impact, long-standing trends suggest that on its own, it is insufficient to correct the concerning prevalence of Fe intake inadequacy among Brazilian menstruating women, irrespective of the country’s socio-economic and geopolitical strata and recent changes in population food consumption patterns.
Acknowledgements
The study analysed secondary data from the survey NDS/HSB 2008–2009 and 2017–2018 (IBGE), which was funded by the Brazilian Ministry of Health. This work was financed in part by the Coordination of Improvement of Higher Education Personnel – Brazil (CAPES) – Finance Code 001. E.C. and C.Z.P. are supported by a CAPES’ research grant.
E. D. C. and D. M. L. M. formulated the research question, designed the study, carried out the study, analysed the data, interpreted the findings and wrote the article. C. Z. P. formulated the research question, designed the study, interpreted the findings and wrote the article. E. V.-J. formulated the research question, designed the study, analysed the data, interpreted the findings and wrote the article. R. S., E. M.Y. and R. A. P. designed the study, carried out the study, interpreted data and wrote the article.
This study was conducted in accordance with the Helsinki Declaration, and all procedures involving research study participants were approved by the ethics committee of the Institute of Social Medicine of State University of Rio de Janeiro (CAAE 37923320·0·0000·5260). All data were obtained from secondary sources and available publicly.
There are no conflicts of interest.
Supplementary material
For supplementary material/s referred to in this article, please visit https://doi.org/10.1017/S0007114523000119


