The WHO recommends to exclusively breastfeed children during the first 6 months of life(1). In this period, breast milk should preferably be the sole source of nourishment for the child’s growth and development(2). Exclusive breast-feeding imparts the child with health benefits and reduces the risk of childhood morbidity and mortality(Reference Chung, Raman and Chew3,Reference Jones, Steketee and Black4,Reference Sankar, Sinha and Chowdhury5) . To determine the adequacy of breast milk quantity and nutrient intake and to link breast-feeding patterns to children’s growth and development, accurate quantification of breast milk intake is essential.
Breast milk intake used to be quantified by test weighing methods, for which the child’s weight is taken before and after each breastfeed, and the difference between these two weights amounts to breast milk ingested by the child(Reference Arthur, Hartmann and Smith6,Reference Meier, Engstrom and Fleming7) . However, this method is time-consuming and disturbs breast-feeding routine. Another disadvantage is the inability to assess if a child is exclusively breastfed because the test weighing method does not capture water intake from other sources(8). In surveys, the prevalence of exclusive breast-feeding is usually based on maternal recalls, which are often associated with recall bias and socially desirable responses that lead to over-estimation of the true prevalence(Reference Owino, Slater and Loechl9).
To overcome these challenges, a more objective technique called the ‘2H oxide dose-to-mother technique’ involving the use of stable isotopes was developed(8,Reference Butte, Wong and Patterson10) . The 2H oxide dose-to-mother technique, first described by Coward in 1980(Reference Coward, Cole and Sawyer11), was found to give comparable estimates of breast milk intake to the test weighing method(Reference Butte, Wong and Patterson10). The major advantage of the stable isotope technique is that daily breast milk intake is estimated over a 14-d period without interfering with the breast-feeding routine or being too much of a burden to mothers(8). Additionally, with this technique, a child can either be classified as exclusively breastfed or not. The technique is based on the 2H enrichment of the body fluids of both the mother and the child. For the easiness of collection, either saliva or urine is usually preferred as body fluid(Reference Schierbeek, Rieken and Dorst12,Reference Jankowski, Sonko and Gozansky13) . However, in studies with labelled water, the level of isotope enrichment has been found to differ between types of body fluids, with saliva samples having a slightly higher isotopic enrichment than urine samples(Reference Schierbeek, Rieken and Dorst12–Reference Schoeller and Brown15). Therefore, the use of either of these types of body fluids is likely to result in different outcomes(Reference Rieken, Schierbeek and van Goudoever16). To this end, Rieken et al. assessed the comparability of saliva and urine samples to quantify energy expenditure and body composition and they concluded that both types of body fluids give comparable estimates(Reference Rieken, Schierbeek and van Goudoever16). However, Jankowski et al. and Schierbeek et al. found that, as opposed to urine, saliva provides a more accurate estimate of the intended outcome(Reference Schierbeek, Rieken and Dorst12,Reference Jankowski, Sonko and Gozansky13) .
Although both saliva and urine have been sampled in studies to measure breast milk intake with the 2H oxide dose-to-mother technique(Reference Arthur, Hartmann and Smith6,Reference Motswagole, Matenge and Mongwaketse17–Reference Moore, Prentice and Coward19) , it is not known how the type of body fluid affects the estimate for breast milk intake. Therefore, we aimed to quantify and compare estimates of breast milk intake with the 2H oxide dose-to-mother technique when based on either saliva or urine samples among 2- to 4-month-old children. In addition, since we expected large differences in physical activity patterns between mothers, we simultaneously measured maternal energy expenditure by using doubly labelled water and explored how this was related to breast milk output.
Methods
Study site and participants
The study was conducted in a rural area of Muhanga District, Southern Province, Rwanda, and in the town of Wageningen, the Netherlands. In the Netherlands, we collected samples in the homes of the mothers during the autumn of 2015, and in Rwanda during the rainy season. The Rwandan National Ethics Committee and the Medical Ethics Committee of Wageningen University and Research approved the present study. We followed the ethical guidelines as laid down in the declaration of Helsinki and its amendments. In accordance, the study objective and procedures were explained to parents both verbally and in writing before they gave their written consent.
A convenience sample of thirteen mother–child pairs (five Dutch and eight Rwandans) took part in the study. The Rwandan participants were recruited through the Rutobwe health centre, and Dutch participants were recruited at the local swimming pool during baby swimming sessions and at child consultation clinics. The recruited mothers were exclusively breast-feeding (reported by mother), apparently healthy, and were willing to stay in the study areas for the next 2 weeks. The children were aged 2–4 months, full-term, singleton and were apparently healthy. Fig. 1 summarises the flow of the study.
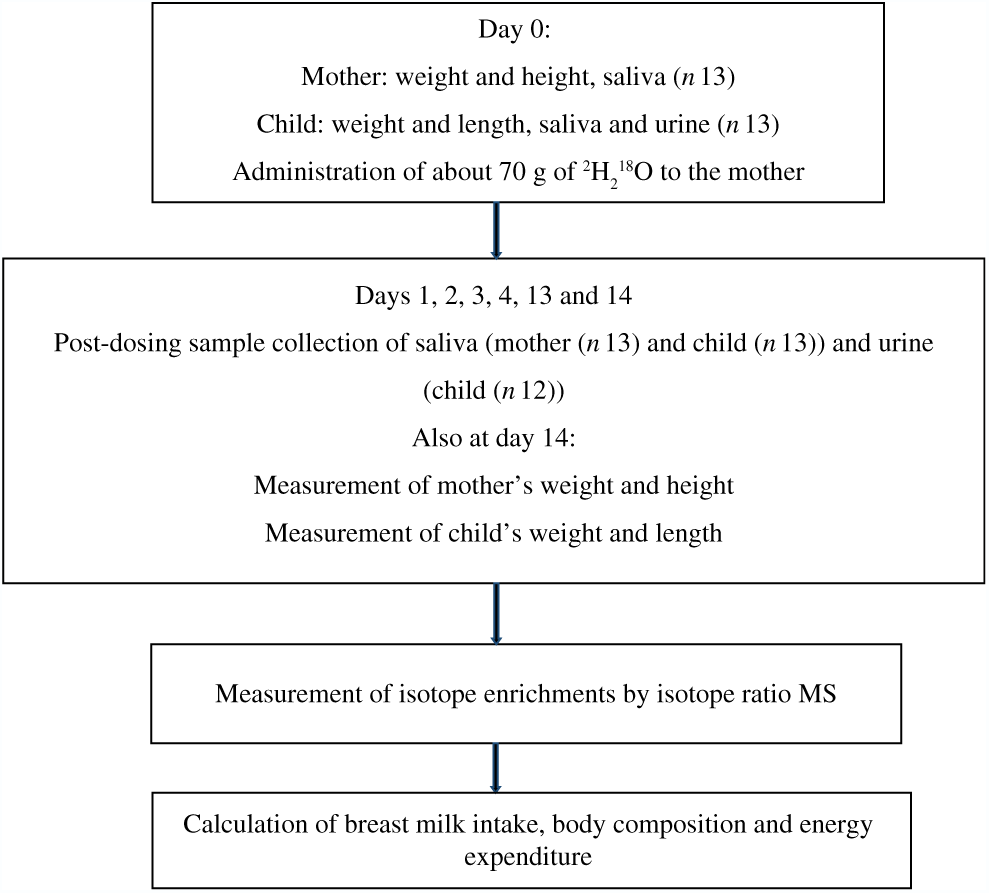
Fig. 1. Study flow diagram: summary of the main steps of the study.
Preparation and administration of doubly labelled water doses
The doubly labelled water mixture was prepared several days before the start of the dosing. Before aliquoting individual doses of approximately 70 g, doubly labelled water was filtered using Whatman puradisc FP 30/0·2 syringe filters (GE Healthcare Europe GmbH) and dispensed into a 250 ml polyethylene bottle. The prepared doses were stored overnight in a refrigerator until administered to the mothers. Mothers received a mixture of 1·8 g 10 % enriched H2 18O (Centre for Molecular Research Ltd) and 0·3 g 99 % enriched D2O (Cambridge Isotope Laboratories, Inc.) per kg body water. It was assumed that the body weight of females comprised 50 % of body water(Reference Chumlea, Guo and Kuczmarski20). In human studies for breast milk output and body composition, the 2H consumed by study participants enriches the body water to a maximum of 0·1 %, which is a safe level and far lower than 15 % at which harmful effects can occur(Reference Jones and Leatherdale21,Reference Koletzko, Demmelmair and Hartl22) .
Each mother drank an accurately weighted dose of approximately 70 g from the polyethylene bottle using a straw. Immediately after drinking the dose, we rinsed the bottle with approximately 100 ml drinking water and the mother drank this water rinse as well using the same straw. The time when the mother drank the dose was recorded on data collection sheets.
Data and sample collection
MSc students from Wageningen University and Research collected samples from both study sites. These students were trained in sample collection and study procedures by one investigator until they complied with the sample collection procedure. During the study implementation, the same protocol was used for both sites. We used the UNICEF electronic scale and length or height boards to measure weight and length (child) or height (mother), respectively. These anthropometric measures were collected in duplicates from mothers and children at baseline (day 0) and at day 14 of the study (Fig. 1). Weight was recorded to the nearest 0·1 kg and height or length to the nearest 0·1 cm.
After baseline anthropometric measures and before the mother drank the dose (day 0), we collected 2 ml of saliva from both mother and child and 5 ml of urine only from the child. Subsequent urine and saliva samples were collected on 1–4, 13 and 14 d post-dosing (Fig. 1).
To collect maternal saliva samples, the mother held a sterile cotton ball in her mouth until saturated with saliva. The saliva-saturated cotton ball was then transferred into a 20 ml syringe, and saliva was squeezed into a 2 ml cryogenic vial. Cotton swabs were used to collect saliva samples from the child. We kept the cotton swabs moving in the child’s mouth for about 2 min. The saliva-sodden cotton swabs were then placed into a syringe to express saliva into a 2 ml cryogenic vial. This process was repeated two to three times to collect enough saliva from the child (1–2 ml).
We collected urine samples from children only. After cleaning genital parts, the child wore a diaper fitted with a cotton inlay pad. Once a child urinated, we removed the cotton inlay pad and placed it into a plastic bag. After cutting a corner tip from the plastic bag, we manually squeezed out urine into a cup. Of this, 5 ml of urine was immediately transferred into a cryogenic vial. We recorded the sampling time of all samples on data collection sheets.
Storage of samples
The sealing caps of the cryogenic vials were wrapped with parafilm for tight closure. On the day of collection, the cryogenic vials were transported in a cooler box to the local laboratory at the University of Rwanda and stored in a freezer at −20°C until they were transported frozen to the laboratory of the Division of Human Nutrition and Health, Wageningen University, The Netherlands.
Analysis of samples for the isotope enrichment
All samples were flame-sealed in 25 µl pre-calibrated pipettes (Vitrex Medical A/S). Isotopic enrichment of the saliva samples, urine samples and diluted doses was analysed at the Center for Isotope Research, Groningen, The Netherlands, as described elsewhere(Reference Guidotti, Jansen and Aerts‐Bijma23). Briefly, the urine samples in the capillaries were subjected to a micro-distillation procedure to obtain pure distilled water. Next, a volume of 0·12 µl of distilled water was injected using an auto-sampler (CTC PAL, CTC Analytics) through a heated septum into a high-temperature pyrolysis unit consisting of a glassy carbon reactor with a temperature >1300°C (Hekatech). The reaction products of the pyrolysis process (H2 and CO2 gasses) were led by a continuous flow of He gas on a GC, where the gasses were separated and led into a continuous flow isotope ratio MS (IRMS) system (Isoprime, GV Instruments). Each sample was injected six times for δ2H analysis followed by three more injections for δ18O analysis. Ratios (R) of C18O/C16O and 3H/2H relative to reference water (VSMOW, Vienna Standard Mean Ocean Water) were expressed in δ units of ‰ after correction for memory effects. The relative difference between sample isotope ratio and the isotope ratio of the international standard was expressed as delta units using this formula: δ18O or δ2H (‰) = 1000 × (Rs–RVSMOW)/RVSMOW). Enrichments expressed as delta units were converted into parts per million excess(24,Reference Slater, Preston and Weaver25) . 2H and 18O dilution spaces were calculated using the intercept method.
The reference water (biomedical enriched waters gravimetrically prepared from VSMOW) was analysed for quality control and showed analytical variations of <0·5 % for both isotopes, and accuracy defined as deviation from the certified values was <1 % for δ2H and <0·3 % for δ18O.
Calculations of breast milk intake and water intake from other sources
A multipoint protocol was used for concurrently estimating breast milk intake of the children and the energy expenditure of the mothers. We calculated breast milk intake according to Haisma et al.(Reference Haisma, Coward and Albernaz26) The calculations were based on fitting the 2H enrichment data to a model for water turnover in the mother and child. We used solver function in Microsoft excel to fit data of enrichment to the following equations:
where E m(t) is the 2H enrichment in the mother’s body water at time t, in mg/kg; t is the time since the dose was taken; E m(0) is the 2H enrichment in the mother’s body water at time zero, mg/kg; k mm is the fractional water turnover in the mother (kg/d).
Data from the child:
where E b(t) is the 2H enrichment in the baby’s body water at time t, in mg/kg; t is the time since the dose was taken by the mother, in d; E m(0) is the 2H enrichment in the mother’s body water at time zero (mg/kg); F bm is the transfer of water from the mother to the child via breast milk (kg/d); V b is the baby’s total 2H distribution space (kg). V b was assumed to change linearly with weight over study period, V b = 0·84 W0·82; k mm is the fractional water turnover in the mother (kg/d); F bb is the total water loss in the child (kg/d).
The amount of breast milk intake was calculated from the water flow from the mother to the child assuming that 87·1 % of breast milk is water(Reference Holland, Welch and Unwin27). Therefore, F bm/0·871 gives breast milk intake (g/d).
Calculation of child and maternal body composition
The calculated components of the body composition were total body water (TBW), fat mass and fat-free mass. TBW was calculated as the average of the 2H dilution space divided by 1·041 and 18O dilution space divided by 1·01 to account for non-aqueous isotope exchange(Reference Racette, Schoeller and Luke28). We calculated the fat-free mass (FFM, kg) of the mothers as TBW (kg)/0·732, assuming that 73·2 % of FFM is water(Reference Pace and Rathbun29). The difference between body weight and FFM gave fat mass. For the children, the FFM was calculated as TBW (kg)/h FFM with h FFM being hydration constant of the FFM, which was assumed to be 0·80 for boys and 0·79 for girls(Reference Fomon, Haschke and Ziegler30).
Calculation of maternal total energy expenditure
Isotope elimination rates (kO and kD) were calculated as the gradient of the plot of the natural logarithm of the enrichment in body water v. time since the dose was taken. The rate of carbon dioxide production was calculated using the following formula: rCO2 (litres per d) = 0·455 × TBW (litres) × (1·007 kO–1·041 kD)(24) and total energy expenditure using the modified Weir equation(Reference Weir31). Total energy expenditure (kJ/d) = rCO2 (litres per d) × (1·1 + 3·90/RQ) × 4·184, where RQ is respiratory quotient and was assumed to be 0·85.
Statistical analysis
We compared the mean difference between breast milk intake based on saliva and urine with paired and independent t tests. The square root of the mean squared error (MSE) was used to evaluate the goodness of the modelled data fit, which reflects the difference between the measured and model-predicted 2H enrichments in the mother and child. The P value was set at 0·05 for each statistical test of significance. To assess the patterns of the differences between breast milk intake based on saliva and urine, the differences between breast milk intake based on saliva and urine were plotted against the means of two intakes using a Bland-Altman pairwise comparison.
Results
Table 1 presents the characteristics of the study participants. The mean age and mean body weight of Rwandan children were slightly higher than those of Dutch children. The body fat mass percentage of Dutch children (25·7 (sd 2·3) %) was slightly higher than that of Rwandan children (23·7 (sd 5·1) %). The age of mothers ranged from 21 to 38 years with a mean of 30 years. Dutch mothers tended to have a slightly higher mean body weight and fat mass, and they were taller on average. Nonetheless, the BMI of Dutch mothers (23·2 (sd 4·7) kg/m2) was comparable with that of Rwandan mothers (23·4 (sd 2·6) kg/m2). In addition, the mothers had similar FFM (41 (sd 3·4) kg).
Table 1. Characteristics of the study participants
(Mean values and standard deviations; numbers of participants)
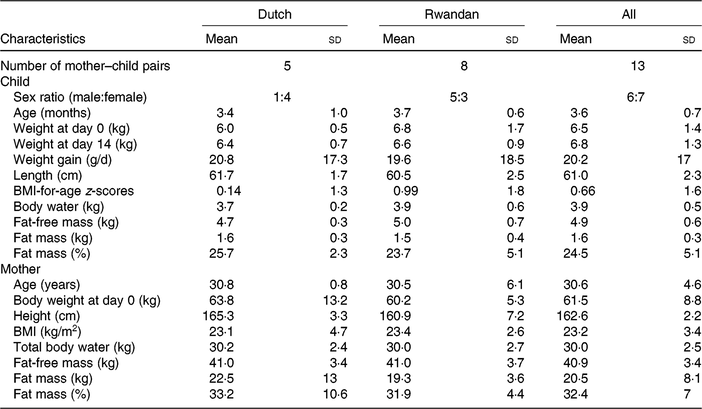
Table 2 shows the quality parameters of the kinetic data based on analysis with GC-pyrolysis-isotope ratio MS. Table 3 compares the isotope kinetic results between saliva and urine samples. The 2H enrichment tended to be higher in saliva samples than in urine samples at each time point. Additionally, the overall mean of 2H enrichment and AUC were slightly higher for saliva samples (89·3 and 1505 parts per million) than that for urine samples (87·4 and 1461 parts per million). However, enrichments were only statistically different for the AUC (P = 0·009).
Table 2. Kinetic parameters for analysis of doubly labelled water
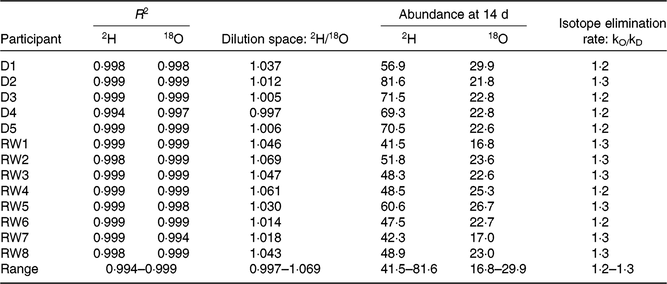
R 2, coefficient of the determination regression line; 18O, oxygen-18; kO, oxygen-18 elimination rate; kD, 2H elimination rate; D, Dutch; RW, Rwandan.
Table 3. Kinetic results based on saliva and urine body fluids
(Mean values and standard deviations)
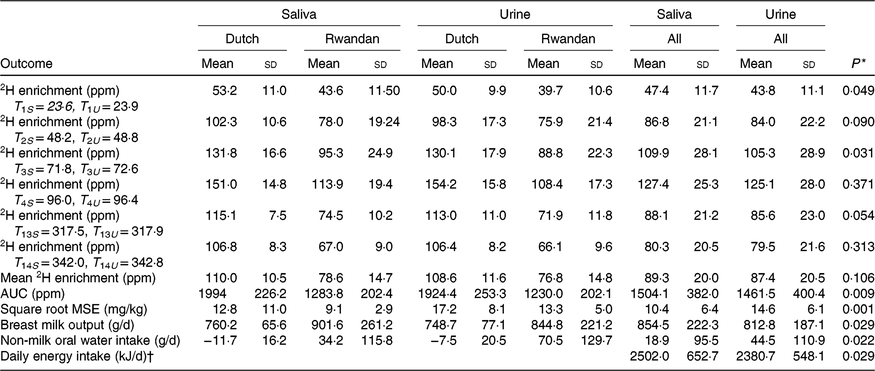
T, time (h) of sample collection after dosing; S, saliva; U, urine; ppm, parts per million; MSE, mean squared error, which is the differences between the measured and model-predicted 2H enrichment in the mother and child.
* P value between saliva and urine estimates of each outcome for all participants.
† Energy intake is estimated based energy density of 2·93 kJ/g according to Dewey et al.(Reference Dewey, Heinig and Nommsen32).
The square root of MSE in data from saliva samples (10·4 (sd 6·4) g/d) was significantly lower compared with that in data from urine samples (14·6 (sd 6·1) g/d), P = 0·001). Furthermore, average breast milk intake based on saliva samples was higher (854·5 (sd 222·3) g/d) than that based on urine samples (812·8 (sd 187·1) g/d), P = 0·029. Moreover, saliva samples resulted in significant lower estimated non-breast milk water intake. At the individual level, for ten out of twelve mother–child pairs, saliva provided higher breast milk intake estimates compared with urine and only one child was classified as not exclusively breastfed based on non-breast milk water intake estimated from either saliva or urine (data not presented). The calculated energy intake based on both types of samples showed that saliva-based breast milk intake provided significantly higher energy intake than urine-based breast milk intake (2502 v. 2377 kJ/d, P = 0·029) (Table 3).
Mean breast milk output based on saliva (760 (sd 65·6) g/d) was higher but not significantly different from the mean intake based on urine samples (749 (sd 77·1) g/d) among Dutch participants (P = 0·27) (Table 3). In contrast, saliva samples provided significantly higher mean breast milk intake (901 (sd 261·2) g/d) compared with urine samples (844 (sd 221·2) g/d) among Rwandan participants (P = 0·045). For both types of body fluid, the mean breast milk intake of Dutch children was lower, but not significantly different from that of Rwandan children (P = 0·70 for saliva and P = 0·42 for urine) (Table 3) and Lin’s correlation coefficient test showed a high concordance between saliva and urine samples (r 0·94). Fig. 2 shows individual differences between breast milk intakes based on saliva and urine.
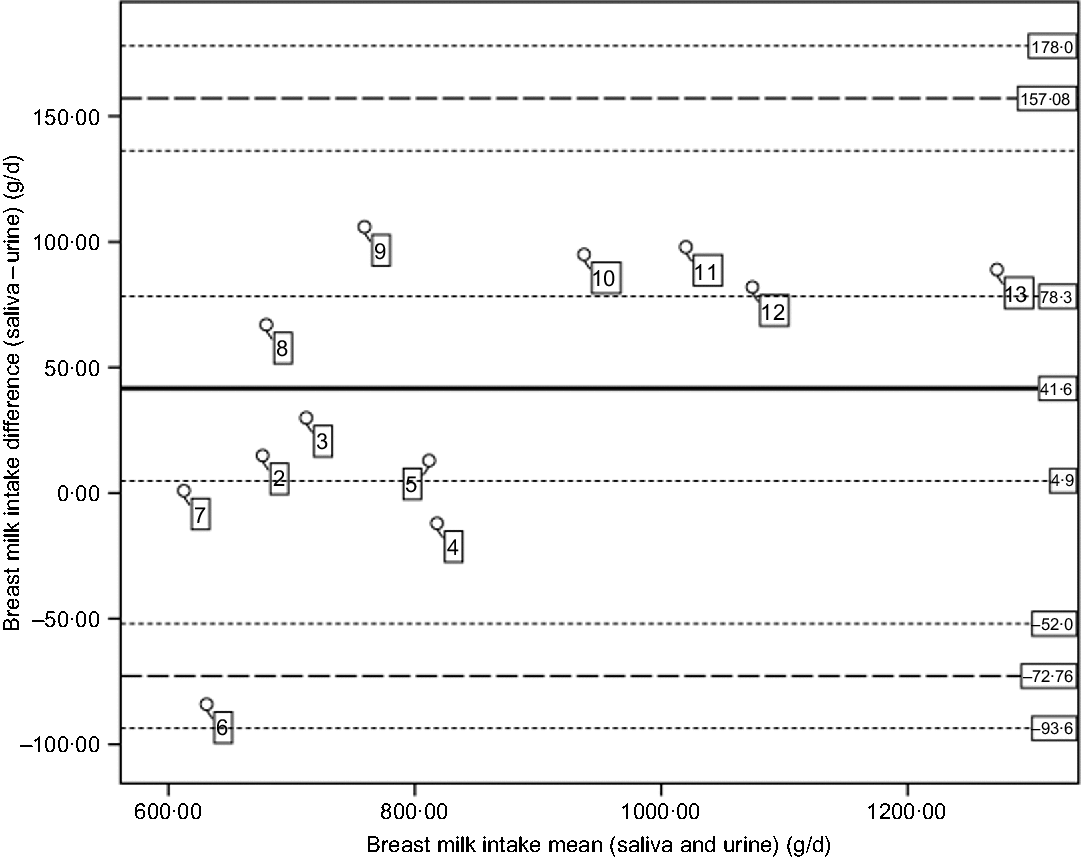
Fig. 2. Bland and Altman plot of the differences of breast milk intakes (saliva – urine) plotted against mean intakes ((saliva + urine)/2). The central plain line is the mean difference in breast milk intakes from saliva and urine (41·6 g/d). The lower and upper thick dashed lines indicate the mean difference plus two standard deviations (mean, 2sd = −72·76, 157·08). The thin dotted lines indicate the CI for the mean (4·9, 78·3), lower limit (−93·6, −52) and the CI for the upper limit (136·2, 178·0). The numbers in the figure represent the participants per country (2–5 for Dutch and 6–12 for Rwandans).
Mean total daily energy expenditure was significantly higher in Rwandan mothers than in Dutch mothers (13 480 (sd 1966) v. 10 695 (sd 2414) kJ/d, P = 0·043). Maternal total daily energy expenditure did not significantly correlate with breast milk intake, neither for the total sample (r 0·33, P = 0·28) (Fig. 3) nor for the Dutch and Rwandan group separately (Dutch: r 0·05,P = 0·88; Rwandan: r 0·27, P = 0·50). Breast milk intake did not also correlate with mother’s age (r 0·006, P = 0·98) and mother’s body fat (r 0·29, P = 0·32), but it did correlate with child’s BMI-for-age (r 0·80, P = 0·001), child’s FFM (r 0·62, P 0·032), and with the mother’s BMI (r 0·60, P = 0·036).
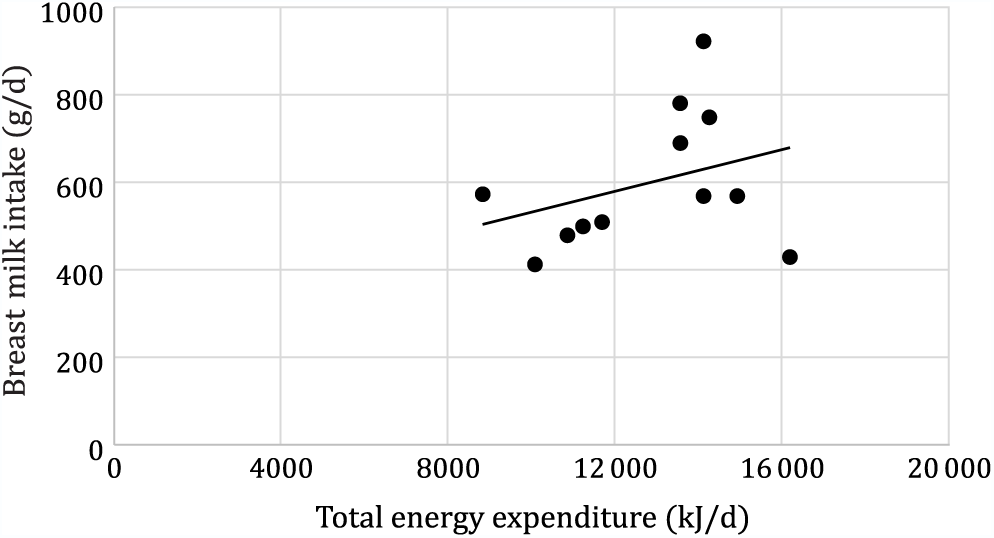
Fig. 3. Correlation between maternal energy expenditure and breast milk intake (r 0·33; P = 0·284).
Discussion
The present study showed that saliva samples resulted in approximately 5 % higher estimates of breast milk intake than urine samples and that maternal energy expenditure did not correlate with breast milk intake. There are two main reasons that can explain the observed difference between saliva and urine as media for a breast milk intake assessment. First, it may be due to a higher level of 2H enrichment in saliva compared with urine and secondarily to a poorer fit of the enrichment data based on urine samples.
In our study, saliva samples were slightly more enriched in 2H than urine samples. This finding is in accordance with earlier observations by Schoeller et al.(Reference Schoeller and Brown15) and Schierbeek et al.(Reference Schierbeek, Rieken and Dorst12) who found a similar difference in enrichment patterns between saliva and urine. This observed difference in 2H enrichment may be related to fractionation patterns, that is, the relative abundance of 2H oxide isotopes in body fluids(Reference Jankowski, Sonko and Gozansky13). Since breast milk intake is quantified based on 2H enrichment(8), the different levels of 2H enrichment between saliva and urine samples are therefore likely to influence the magnitude of breast milk intake estimates. Accordingly, Rickien et al. attributed a lower estimate of energy expenditure to a slightly lower isotopic enrichment in urine compared with saliva(Reference Rieken, Schierbeek and van Goudoever16).
To quantify breast milk intake, the 2H enrichment data are fitted to model for water turnover in mother and child(8). With the model, the square root of MSE is calculated to assess the fit of the modelled data. The smaller the square root of MSE, the more precise the data(Reference Bandara, Hettiarachchi and Liyanage33). In our study, the square root of MSE is significantly smaller for saliva samples than for urine samples indicating a poorer fit when urine samples are used. This is probably caused by, on the one hand, the longer time taken by tracers to equilibrate in the contents of the bladder, and on the other hand, the time lag between initial urine production in the kidney and sample collection, particularly in children who are still incontinent at younger age(Reference Schoeller and Van Santen14,Reference Schoeller, Van Santen and Peterson34) . Therefore, the urine-based data resulted in larger random errors as opposed to saliva-based data. These larger random errors together with a relatively small sample size (twelve participants) may have contributed to less reliable measurements based on urine samples. Consequently, this may have resulted in a small but statistically significant difference in estimated breast milk intake between the two types of sample media. However, based on a cutoff of 86·6 g/d for classifying exclusivity of breast-feeding(Reference Liu, Diana and Slater35), a difference of 5 % between two sample media seems to be less important and Lin’s correlation coefficient test shows that both types of samples were highly correlated.
Although the mean breast milk intake based on saliva and urine samples differs, each of these mean intakes exceeds the pooled mean breast milk intake of 820 g/d reported for exclusively breastfed 3- to 4-month-old children(Reference Da Costa, Haisma and Wells36). Likewise, based on estimated mean energy intakes of 2502 kJ/d (saliva-based breast milk) and 2376 kJ/d (urine-based breast milk), children in the present study would meet, for example, the energy need of 2384 and 2184 kJ/d for a 3-month-old boy or girl, respectively(Reference Butte, Lopez-Alarcon and Garza37). In addition, for individual children in the present study, a similar proportion of children (50 %) would meet their daily energy needs by consuming breast milk as estimated based on either saliva or urine. Thus, a mean difference of not more than 5 % between saliva and urine samples does not affect estimates of energy adequacy; however, Fig. 2 shows that the variability in differences between breast milk intake based on the two types of samples is higher at lower intake.
From a practical perspective, we experienced that collecting urine samples was challenging due to the uncontrollable time of the release of urine by the child, sometimes resulting in a long waiting time and frequently disturbing the child for checking the wetness of the cotton inlay pad. This waiting time was sometimes lengthened when a child defecated, which required us to change the diaper and inlay pad. For these reasons, urine collection was more cumbersome contrary to saliva. Taken together, saliva, therefore, seems to be more suitable as a medium for studies using the 2H oxide dose-to-mother technique than urine.
Breast milk intake did not statistically differ between Dutch and Rwandan children. Brown et al. also reported that breast milk intake in developing countries does not differ from intake in developed countries(Reference Brown, Dewey and Allen38). Mean breast milk intakes estimated in the present study are approximatively within the intake range of 744–925 g/d reported in other studies using the 2H oxide dose-to-mother technique(Reference Butte, Wong and Patterson10,Reference Motswagole, Matenge and Mongwaketse17–Reference Moore, Prentice and Coward19,Reference Haisma, Coward and Albernaz26,Reference Weir31,Reference Samuel, Thomas and Bhat39) . In addition, despite a small sample size, the breast milk intake in our study also compares well with approximately 700–800 g/d reported by Dewey et al. who used the test weighing method(Reference Dewey, Heinig and Nommsen40).
Since we used doubly labelled water in the present study, we measured maternal body energy expenditure in addition to breast milk intake. The energy expenditure of Rwandese mothers was significantly higher than that of Dutch mothers. This finding agrees well with what Singh et al. found in Gambian and English lactating mothers(Reference Singh, Prentice and Diaz41). The rural livelihood conditions for the Rwandan study mothers, dominated by farming activities, are the basis of the observed difference in energy expenditure. Rural residents are generally more active than urban residents(Reference Torun, Stein and Schroeder42), and adult Africans generally participate more in vigorous-intensity physical activity than Europeans(Reference Hallal, Andersen and Bull43). In addition, a study conducted in the Gambia showed that the energy cost of physical activity among mothers during the season of highest farming activities was up to 2·5 times higher than that of affluent non-farming mothers(Reference Singh, Prentice and Diaz41). These factors explain the difference in energy expenditure between Dutch and Rwandan mothers. Nevertheless, energy expenditure did not correlate with the quantity of breast milk in either setting. Therefore, it seems that energy expenditure in lactating mothers does not affect breast milk output in the present study, as has also been reported earlier from studies on maternal exercise and lactation performance(Reference Dewey, Lovelady and Nommsen-Rivers44,Reference Dewey45) .
The strength of the present study is that it used an objective technique to measure breast milk intake and energy expenditure. In addition, the quality of the enrichment data in the present study was acceptable. This is shown by the accuracy, precision and other details of the kinetic data based on analysis with GC-pyrolysis-isotope ratio MS (Table 2), which were within an acceptable range and comparable to other studies(24). Additionally, the study compares the findings between two different settings. However, the small sample size is the major limitation of our study, and therefore, results are not representative of the respective source populations. In addition, possible differences in conditions during collection (such as humidity and temperature) between the study sites could have resulted in different fractionation of the isotopes and therefore differential retention of the isotopes in the body, which consequently affected breast milk intake estimates. However, we estimate the impact to be limited: in the Netherlands, the samples were collected in autumn (from 28 September to 1 December 2015) in the homes of the mothers. The room temperature and humidity in the homes were not recorded, but can be expected to be between 16 and 22°C. In Rwanda, the samples were collected from 15 April to 5 May 2015. This corresponded to the rainy season with an average temperature of 18°C.
To conclude, saliva samples resulted in higher estimates of breast milk intake than urine samples. The difference between the two types of body fluid may mainly be attributed to differences in 2H enrichment and to larger random errors in urine data indicating a poorer fit. The collection of urine samples is more cumbersome compared with saliva. Therefore, both from a methodological and from a practical perspective, saliva sampling is preferable over urine sampling in studies measuring the amount of breast milk intake with the 2H dose-to-mother technique. Energy expenditure in lactating mothers does not affect breast milk output.
Acknowledgements
We acknowledge Roelinda Jongstra and Nanette van der Spek to have contributed to proposal writing; Carina Flux to have taken part in data collection in Rwanda; all the mothers and children to have friendly participated, and Head of Department of Human Nutrition and Dietetics, University Rwanda to have provided administrative support.
The present study was supported by the Embassy of the Kingdom of the Netherlands through UNICEF Rwanda and Wageningen University and Research.
E. M. designed the study, analysed the data, interpreted the results and wrote the manuscript. P. J. M. H. advised on data collection, oversaw laboratory analysis for the samples, carried out data modelling and contributed to the results’ interpretation and manuscript writing. L. V. V. and M.-F. K. collected data in the Netherlands and contributed to data analysis and the results’ interpretation. L. T. advised on data collection and contributed to manuscript writing. A. M.-B. supervised all activities and contributed to study design and manuscript writing. All the authors approved the manuscript.
There are no conflicts of interest.


