Excess energy intake is recognised as a strong contributing factor to the global rise of being overweight and obese(Reference Swinburn, Sacks and Hall1, Reference Drewnowski and Bellisle2). The prevalence of obesity worldwide has been increasing over the past years, necessitating an increased understanding of the drivers of food intake. Foods high in dietary carbohydrates in the form of complex carbohydrates and simple carbohydrates represent a major source of energy in our diet. For example, the estimated Acceptable Macronutrient Distribution Ranges related to reduced risk of chronic disease are 45–65 % of total energy intake from carbohydrate, 20–35 % from fat and 15–25 % from protein(3). Foods high in dietary carbohydrate (simple carbohydrate, complex carbohydrate) has been shown to have a weaker effect on satiation in comparison with other food groups such as those high in dietary protein(Reference Bertenshaw, Lluch and Yeomans4, Reference Keast, Azzopardi and Newman5) and result in overconsumption within a meal.
Individual differences in their ability to perceive complex carbohydrates and the role of oral complex carbohydrate sensitivity in the overconsumption of energy or specific foods associated with the development of obesity deserve more attention. For example, individuals vary in terms of their satiety responses to dietary fat(Reference Blundell, Burley and Cotton6–Reference Stewart, Seimon and Otto8), and one possible explanation may be due to the individual’s oral and gastrointestinal sensitivity to fatty acids(Reference Stewart, Seimon and Otto8, Reference Bolhuis, Costanzo and Newman9). It has been suggested that abnormalities in any or several taste receptors are known to influence intake of specific food components related to the taste receptor(Reference Dinehart, Hayes and Bartoshuk10). For example, it has been well documented in the literature that individuals’ abilities to detect bitter tastants at low concentrations (i.e. n-6-propylthiouracil (PROP) and phenylthiocarbamide (PTC)) are determined via genetics(Reference Guo and Reed11) and influence the palatability and consumption of bitter-tasting vegetables such as kale, broccoli and Brussels sprouts(Reference Dinehart, Hayes and Bartoshuk10). This food choice behaviour has also been reported for orally detected compounds such as fatty acids, whereby a negative relationship between habitual fat intake and oral sensitivity to fatty acids has been found, that is, individuals who were less sensitive to fatty acids were found to consume more fatty foods(Reference Stewart, Seimon and Otto8, Reference Stewart, Feinle-Bisset and Golding12). More recent studies found that oral sensitivity to fatty acids was negatively associated with ad libitum intake of high-fat meals (i.e. satiation or intrameal satiety in response to fat(Reference Bolhuis, Costanzo and Newman9)) and in subsequent meal intake (i.e. satiety responses to fat(Reference Keast, Azzopardi and Newman5)). In regards to oral complex carbohydrate sensitivity, a recent cross-sectional study from our laboratory observed a positive association between oral complex carbohydrate sensitivity, intake of complex carbohydrate foods and waist measurements (i.e. being more sensitive to complex carbohydrate was associated with greater energy and starch intakes and a bigger waist measurement)(Reference Low, Lacy and McBride13). It is uncertain why we observed an opposite direction in our previous work. However, we speculate that the valence of sensing small amounts of simple carbohydrate (sugar) may promote consumption, and perhaps all carbohydrate sensing may be similarly aligned. Of course, sugars do this via appetitive sweetness, but complex carbohydrates may have an unconscious mode of action on consumption. In this way, sensing all carbohydrates including sugars may promote consumption. However, the relation between habitual diet, body composition and sweet taste sensitivity is complicated because most data showed no relationship between these measures(Reference Low, Lacy and McBride14), suggesting a need to differentiate between simple and complex carbohydrates. As the previous studies used self-reported dietary measures of habitual/usual intake, it is unclear if the differences in dietary intake were solely due to oral perception as consumption of foods in the real world, being a much less controlled environment than a laboratory, could be influenced by many different factors(Reference Drewnowski and Bellisle2). It is therefore important to understand whether oral complex carbohydrate sensitivity influences satiation (i.e. meal size or intrameal satiety) from dietary carbohydrate using an experimental approach in controlled laboratory conditions to look at food or energy intake. If there is an effect of complex carbohydrate on satiation, it is unclear whether individual’s liking of complex carbohydrate foods influences this effect as foods with higher palatability could trigger overeating(Reference Drewnowski, Mennella and Johnson15).
The aim of this paper was to investigate if oral sensitivity to complex carbohydrate relates to ad libitum consumption of complex carbohydrate foods. We assessed this by comparing homogenous milkshakes containing a sweet (glucose) and a non-sweet carbohydrate (maltodextrin). A secondary aim was to investigate if liking of carbohydrate (sweet and non-sweet) foods plays a role in ad libitum intake of carbohydrate milkshakes. We hypothesise oral complex carbohydrate sensitivity will be positively associated with ad libitum consumption of complex carbohydrate foods. Liking towards carbohydrate foods will be positively associated with ad libitum consumption of carbohydrate-based foods. For consistency throughout this paper, the terminology ‘oral complex carbohydrate sensitivity’ refers to all types of complex carbohydrates and its derivatives, while not diminishing the prospect that oral perception of complex carbohydrate could be due to textural differences(Reference Low, Lacy and McBride16).
Methods
Study design
Participants consumed two different iso-energetic preload milkshakes followed by ad libitum intake of milkshakes – (1) sweet milkshake (glucose) and (2) non-sweet carbohydrate milkshake (maltodextrin) in a randomised crossover design. Maltodextrin was chosen as a complex carbohydrate because it dissolves easily in water, whereas glucose was chosen as a simple carbohydrate/sugar because maltodextrin contains a small amount of glucose. Therefore, by measuring participants’ sensitivity towards both glucose and maltodextrin, we were able to observe if differences in the amount of milkshakes consumed were due to sensitivity towards sweet taste (glucose) or oral complex carbohydrate sensitivity (maltodextrin). Participants attended two laboratory sessions, separated by at least 7 d of washout period. The outlines of the two sessions are shown in Fig. 1.
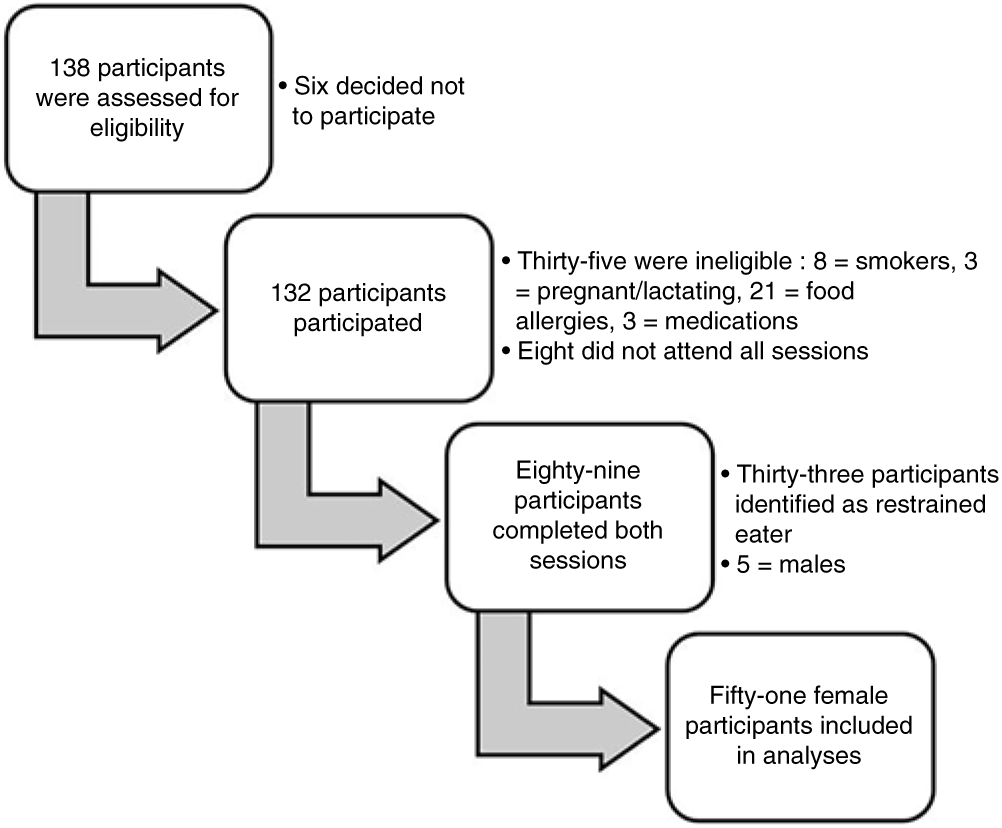
Fig. 1. Number of participants who were recruited, screened and completed both sessions. The dietary restraint score was measured according to factor 1 of the Three-Factor Eating Questionnaire(Reference Stunkard and Messick17). Restrained eaters were defined as participants with a score on factor 1 of >11 on the Three-Factor Eating Questionnaire.
As the sessions were part of a laboratory class, each class (seven participants maximum at a time) was randomly assigned to the sequence of sweet (glucose) and non-sweet (maltodextrin) carbohydrate milkshakes using a web-based program (http://randomizer.org). In addition, during the same sessions, detection threshold (DT) and suprathreshold intensity perception (ST) for glucose and maltodextrin, hedonic ratings for glucose and maltodextrin solutions, and hedonic ratings for a range of sweet and complex carbohydrate prototypical foods were also determined. Each session lasted approximately 2 h, and participants were given breaks between tasks lasting 15–30 min. Participants were asked to refrain from eating, drinking (except water) or chewing gum for at least 1 h prior to testing.
Demographic information was also collected, including sex, age, height and weight measurements, during session 1. BMI (kg/m2) was calculated from the height and weight measurements. Participants also completed two online questionnaires: Likes and Dislikes Questionnaire, and a Three-Factor Eating Questionnaire within 1 week of sensory testing. The present study was part of a larger study focusing on the psychophysics of oral complex carbohydrate sensitivity, liking and consumption of complex carbohydrate-based foods(Reference Low, Lacy and McBride18). Psychophysics tasks (DT, ST), consumption of milkshakes, as well as hedonic ratings for a range of sweet (glucose) and complex carbohydrate (maltodextrin) solutions were conducted in computerised, partitioned sensory booths in the Centre for Advanced Sensory Science using Compusense Cloud Software as part of the Compusense Academic Consortium (Compusense Inc.). Hedonic ratings for a range of sweet and complex carbohydrate-based foods were conducted in individual workbenches at our teaching laboratory. The standardising protocols prior to each testing sessions were similar to the ones outlined in Low et al. (Reference Low, Lacy and McBride16, Reference Low, McBride and Lacy19). All solutions and prototypical foods were served at room temperature. Milkshakes were served chilled at approximately 3°C.
Participants
Participants were recruited from a convenience sample of 138 students enrolled in a third-year Sensory Evaluation of Foods unit during March 2016 at Deakin University, Melbourne campus, Australia. A total of 132 participants gave written informed consent to take part in the study (response rate = 96 %). The exclusion criteria were included in Fig. 2. A dietary restraint score was measured according to factor 1 of the Three-Factor Eating Questionnaire(Reference Stunkard and Messick17). The mean restraint score was 8·9 (SD 3·7).
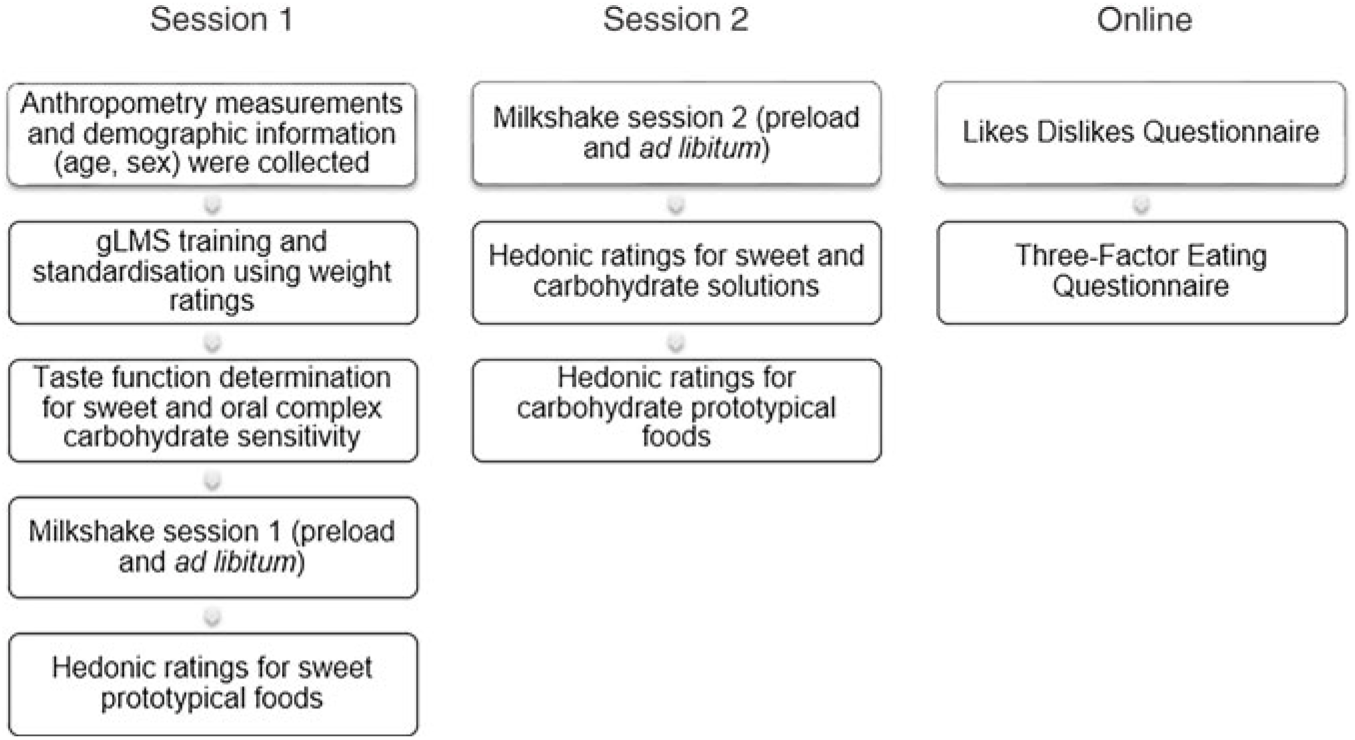
Fig. 2. Study outline. The left chart represents the session outline for session 1, middle chart represents the session outline for session 2 and the right chart represents the online questionnaires. Each session lasted about 2 h. As the data collection was part of a laboratory class, participants were given intermittent breaks (teaching) lasting 15–30 min between each task. Participants were also asked to cleanse their palate with deionised water before starting each task during sessions 1 and 2. gLMS, general Labeled Magnitude Scale.
Ethics
The present study was approved by the institutional review board regulations of Deakin University (2012_162). The experimental protocol was also registered under the Australian New Zealand Clinical Trials Registry (ACTRN12617000551392; www.anzctr.org.au). The present study also complies with the Declaration of Helsinki for Medical Research involving Human Subjects.
Stimuli and test foods
Glucose was used to investigate sweet taste function (DT and ST for sweet taste; for details of stimuli, see Table 1). Maltodextrin was used to investigate oral complex carbohydrate sensitivity (DT and ST for complex carbohydrate). Detailed in Table 1 are the amount of glucose and total sugars (%, w/v) present in each maltodextrin DT concentration.
Table 1. Sweetener and complex carbohydrate concentrations used for determination of detection thresholds of healthy female adults (n 51)

* The concentration series for glucose and maltodextrin were prepared with successive 0·25 log dilution steps.
† Reference chemical details: glucose (The Melbourne Food Depot); maltodextrin (Star-Dri 5, Tate & Lyle Ingredients Americas). The ninth concentration was presented only when participants were unable to detect a difference from water solution in the previous eight(Reference Webb, Bolhuis and Cicerale20).
‡ Calculation of the amount of common and total sugars in maltodextrin concentrations were according to the report of analysis by the Australian Government National Measurement Institute from samples used in the present study, where there were a total of 1·7g/100g (1·7 %, w/w) of free sugars for the maltodextrin (glucose: 0·9 %, w/w; fructose and sucrose: <0·2 %, w/w).
The nutrient compositions of the sweet (glucose-based) and complex carbohydrate (maltodextrin-based) milkshakes were calculated using the Foodworks8 (Xyris Software) (Table 2). The milkshakes were mixed until no lumps were visible using an immersion (stick) blender for 15 s (per 100 g) at 10 000 rpm (KitchenAid KHB2569 Hand Blender, Whirlpool Corporation). All milkshakes were prepared fresh on the day of testing.
Table 2. Nutrient composition (per 100 g) of sweet (glucose) and non-sweet (maltodextrin) carbohydrate milkshakes containing different amounts of glucose and maltodextrin
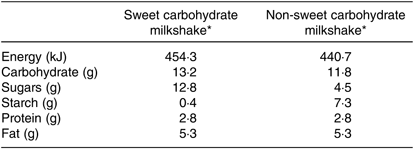
* The nutrient composition of the milkshakes (8·8 % (w/w) glucose/maltodextrin (The Melbourne Food Depot; Star-Dri 5, Tate & Lyle Ingredients Americas), 63·7 % (w/w) long-life skimmed milk (99·9 % fat free; Devondale Murray Goulburn), 26·5 % (w/w) light thickened cream (approximately 18 % fat; Bulla) and 1 % (w/w) imitation vanilla essence (Queen Fine Foods)) per 100g was calculated using Foodworks8 (Xyris Software).
Participant training
At the start of session 1, participants were trained to use the general Labeled Magnitude Scale (gLMS) to rate taste intensity using the standard protocol outlined by Green et al. (Reference Green, Shaffer and Gilmore21, Reference Green, Dalton and Cowart22), except the top of the scale was described as the strongest imaginable sensation of any kind(Reference Bartoshuk23). This method has been described in Low et al. (Reference Low, Lacy and McBride14, Reference Low, McBride and Lacy24).
BMI
All participants were asked to remove their shoes and any heavy clothing to ensure accurate measurements. Height and weight were measured right after the scale training during the first session after a 2-h fast (food only). This method has been described in Low et al. (Reference Low, Lacy and McBride14, Reference Low, Lacy and McBride16).
Detection threshold determination for sweet taste and oral sensitivity to complex carbohydrates
DT was determined using the procedure outlined in the International Standards Organisation (ISO) Method of Investigating Sensitivity of Taste(25). The concentration series for glucose and maltodextrin were prepared with successive 0·25 log dilution steps(Reference Low, Lacy and McBride14) (Table 1).
The eight samples for each stimulus were served in ascending concentration (15 ml per sample), and each stimulus was presented to participants independently. Participants were unaware of the presentation order. Participants were instructed to taste each sample for 5 s then spit and rate whether there was an absence of taste/oral perception (water-like) or if a taste/oral perception was identified but not recognised(25). DT was defined as the concentration at which the participants selected the ‘taste/oral perception identified, but unknown taste quality/oral perception’(25).
Suprathreshold intensity ratings for glucose and maltodextrin
Three concentrations (weak, medium and strong) and a control (blank) solution were prepared to determine perceived ST for glucose and maltodextrin (Table 3)(Reference Low, Lacy and McBride13, Reference Low, McBride and Lacy24). The concentrations for each stimulus ranged from ‘weak’ to ‘strong’ on the gLMS. These samples were presented to participants in a randomised order.
Table 3. Concentrations (weak, medium and strong intensity) of glucose and maltodextrin used for determination of suprathreshold intensity of healthy female adults (n 51)
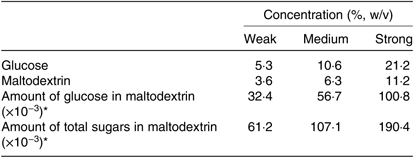
* Calculations of the amount of common and total sugars in maltodextrin concentrations were according to the report of analysis by the Australian Government National Measurement Institute from samples used in the present study, where there were a total of 1·7g/100g (1·7 %, w/w) of free sugars for the maltodextrin (glucose: 0·9 %, w/w).
Standardisation of general Labeled Magnitude Scale usage with weight ratings
To standardise gLMS usage within participants, a modified version of the method used by Delwiche et al. (Reference Delwiche, Buletic and Breslin26) was adapted for the present study (see Low et al. (Reference Low, Lacy and McBride14, Reference Low, McBride and Lacy24)). There was a significant correlation between the overall mean sweetness ratings for glucose and overall mean heaviness ratings (r 0·38, P < 0·01) indicating that the gLMS ratings were subject to differences in individual scale-use and thus requires standardisation across participants(Reference Webb, Bolhuis and Cicerale20, Reference Delwiche, Buletic and Breslin26, Reference Keast and Roper27). Method to determine standardisation factor for each participants was previously described in Keast & Roper(Reference Keast and Roper27).
Hedonic ratings for sweet and complex carbohydrate solutions and prototypical foods
To measure liking of glucose and maltodextrin solutions, identical concentrations used to assess ST ratings were prepared and presented to participants in a randomised order. To assess liking of sweet and complex carbohydrate prototypical foods, participants were required to rate liking of sixteen food items (eight sweet taste and eight non-sweet carbohydrate foods). The foods included in testing had approximately equivalent fat per 100 g. Participants were given a variety of different sweet and complex carbohydrate-based foods representing a range of dietary carbohydrate contents per serve (differences in g of sugar or starch per 100 g), approximately equivalent to the concentrations (%, w/v) used to measure ST ratings for glucose and maltodextrin. Eight small samples (5–20 g) per tray were served in a randomised order, and each tray was presented to participants independently. The foods included in testing can be viewed in online Supplementary Table S1. Liking of both solutions and foods was measured using a nine-point hedonic scale. All liking evaluations were conducted without the use of nose clips and following psychophysics tests. All solutions/foods were ingested.
Standardisation of hedonic scale usage with non-food items
To control for idiosyncratic scale usage, standardisation of hedonic scale usage method was previously described(Reference Low, Lacy and McBride18). There was a significant correlation between the overall mean hedonic ratings for food/beverage items and overall mean hedonic ratings for non-food items (r 0·22, P < 0·05). As individual hedonic ratings for food/beverage items and non-food items were assumed unrelated, the significant correlation indicated that the hedonic scale ratings were subject to differences in individual scale-use and required standardisation across participants. Therefore, each individual ratings were standardised with his or her personal standardisation factor to account for hedonic scale-use bias(Reference Low, Lacy and McBride18).
Satiation measures – preload and ad libitum intake of milkshakes, drinking rate, and appetite and hedonic ratings
A modified procedure outlined by Rolls & McDermott(Reference Rolls and McDermott28) was used to assess the satiation effect of glucose- and maltodextrin-based milkshakes. Participants were first served a cup containing 200 g of milkshake (glucose: 908·6 kJ, maltodextrin: 881·4 kJ) and were instructed to finish the whole cup of milkshake within a minute (maximum time). At 2 min after consumption of the preload milkshake, participants were presented with another serving of the same milkshake (600 g; glucose: 2725·8 kJ; maltodextrin: 2644·2 kJ). For the 600 g milkshake, participants were told to drink until they are comfortably full (maximum time: 5 min). The serving sizes for preload (200 g) and ad libitum (600 g) milkshakes were derived through previously published finding by Rolls & McDermott(Reference Rolls and McDermott28) using young adult samples. In that study(Reference Rolls and McDermott28), a fixed volume of yogurt (300 g) was given to participants as a preload as it was found to be the average amount of yogurt consumed by participants. However, as the participants in the present study were mainly young female adults, we chose to use 200 g as the serving size for preloads to ensure that all participants were given the opportunity to consume similar amount of milkshakes prior to the ad libitum experiment. By standardising the same amount of preload milkshakes, the differences in the amount of milkshakes consumed in the ad libitum experiment would be due to the satiating and reward effects of the preload milkshakes. A concentration of 8·8 % (per 100 g of maltodextrin milkshake) of maltodextrin was derived based on previous published findings of perceptually distinctive sensation concentration without perceivable viscosity(Reference de Ataide e Silva, Di Cavalcanti Alves de Souza and de Amorim29, Reference Lapis, Penner and Lim30). A concentration of 8·8 % (per 100 g of glucose milkshake) of glucose was used for sweet milkshakes. The ad libitum milkshake intake was calculated as the difference in the weight of the cup of milkshake before and after consumption. The milkshake intake in g was used to determine the energy intake in kJ. Drinking rate (g/s or kJ/s) was calculated by dividing the ad libitum milkshake intake in g or kJ by the total drinking duration (s). During the milkshake experiments, participants were asked to start drinking the milkshake as soon as they were instructed to start. The researcher, using a stopwatch, measured the total duration time (seconds) used to drink the ad libitum milkshake.
Prior to consuming the preload and ad libitum milkshakes, participants completed several questions relating to appetite and hedonic ratings(Reference Bolhuis, Costanzo and Newman9, Reference Rolls, Rolls and Rowe31–Reference Havermans, Janssen and Giesen33). When the milkshakes were served, participants were instructed to drink a sip of their milkshake and to rate their liking of it on a nine-point hedonic scale. Participants were also instructed to rate their feelings of hunger, fullness and prospective consumption prior to consumption of both milkshakes (preload and ad libitum) on a 100 mm visual analogue scale anchored at each end with descriptors (e.g. ‘not hungry at all’ at one end and ‘very hungry’ at the other).
Statistical analyses
According to previous literature(Reference Bolhuis, Costanzo and Newman9), a difference of 10 % in intake (in g) would be detected using forty-nine participants in a paired design with the following assumptions: α = 0·05, two-sided, power of 80 % and a variation of 25 %. Statistical analysis was performed using IBM SPSS statistical software version 23.0 (SPSS). Data are presented as means and standard deviations. Significance was accepted at P < 0·05. Descriptive statistics were employed to describe demographic information, thresholds and perceived intensity of sweet taste and oral complex carbohydrate sensitivity, hedonic ratings of sweet taste and complex carbohydrate foods (water-based solutions, prototypical foods and milkshakes), intake of milkshakes (g and kJ), drinking rate, appetite ratings and BMI. Due to low number of male participants, seven males were also eliminated from the data set. Potential confounding variable such as order of presentation (being served a glucose/maltodextrin milkshake first) and BMI on sweet taste function and oral complex carbohydrate sensitivity (DT and ST for glucose and maltodextrin), liking and milkshake intake were checked prior to the analyses using independent t tests. The order of presentation and BMI had no effect on liking, milkshake intake, and sweet taste function and oral complex carbohydrate sensitivity (see Results) in this data set.
Participants who are termed more sensitive to the carbohydrate compounds tested have a lower DT and higher intensity ratings than less-sensitive participants (higher DT, lower intensity rating). DT and ST for glucose and maltodextrin were treated as grouping variables (tertiles) with participants categorised as more sensitive/who experienced low intensity (1/3), normal sensitive/moderate intensity (2/3) and less sensitive/high intensity (3/3) to explore differences between continuous (milkshake intake, BMI) variables. DT and ST for glucose and maltodextrin were grouped into tertiles to allow comparison of most and least sensitive groupings or those groups who experienced low and high intensity (i.e. four sets of tertiles were determined: one for DT for glucose and maltodextrin, and one for ST for glucose and maltodextrin)(Reference Stewart, Feinle-Bisset and Golding12, Reference Low, Lacy and McBride14). We used an exploratory approach to allow us to observe a clear indication of any effect the variable may have on other attributes of interest. Similarly, individuals’ hedonic ratings for sweet and complex carbohydrate solutions and prototypical foods were treated as grouping variables (tertiles) with participants categorised as those who rated low (1/3), moderate (2/3) and high (3/3) on the hedonic scale to explore differences between variables (milkshake intake). Hedonic ratings for sweet and complex carbohydrate solutions and prototypical foods were grouped into tertiles to allow comparison of those groups who rated low and high on the hedonic scale (i.e. four sets of tertiles were determined for hedonic ratings: for sweet solutions, sweet prototypical foods, complex carbohydrate solutions and complex carbohydrate prototypical foods). An independent t test was used to detect differences in milkshake intake between more-sensitive and less-sensitive participants, those who experienced low and high intensity, and those who rated low and high on the hedonic scale groups (low- and high-tertile groups). Pearson’s product-moment correlations were conducted to also analyse the relationship between sweet taste function and oral complex carbohydrate sensitivity (DT and ST for glucose and maltodextrin), hedonic ratings for sweet and complex carbohydrate solutions and prototypical foods, milkshakes and BMI. Appetite ratings and hedonic ratings for milkshakes from before compared with after preload within a session were assessed using paired t tests. Effects of simple carbohydrate and complex carbohydrate on ad libitum milkshake intake, drinking rate and liking of milkshakes were compared using paired t tests. The effects of simple carbohydrate and complex carbohydrate on Δ appetite ratings and liking of milkshakes (before ad libitum intake – rating before preload intake) were compared using paired t tests.
Results
Participants
Of the fifty-one female participants who completed the study (age 23·0 (sd 4·0) years (range 20·0–41·0 years), BMI 22·1 (sd 2·5) kg/m2 (range 18·0–29·1 kg/m2)), eight were classified as overweight/obese (BMI 26·3 (sd 1·2) kg/m2 (range 25·2–29·1 kg/m2)).
Ad libitum intake of glucose and maltodextrin milkshakes
There were no significant differences in ad libitum consumption of both glucose and maltodextrin milkshakes (all P > 0·05) (Fig. 3(a) and (b)). However, there was a trend towards significance where participants consumed more glucose milkshake in comparison with the maltodextrin milkshake (P = 0·06; approximately 23 % greater). Similarly, no significant differences between BMI groups (lean and overweight/obese participants) and the order of presentation (presented with glucose milkshakes first v. maltodextrin milkshakes) in ad libitum consumption of milkshakes were found (all P > 0·05).
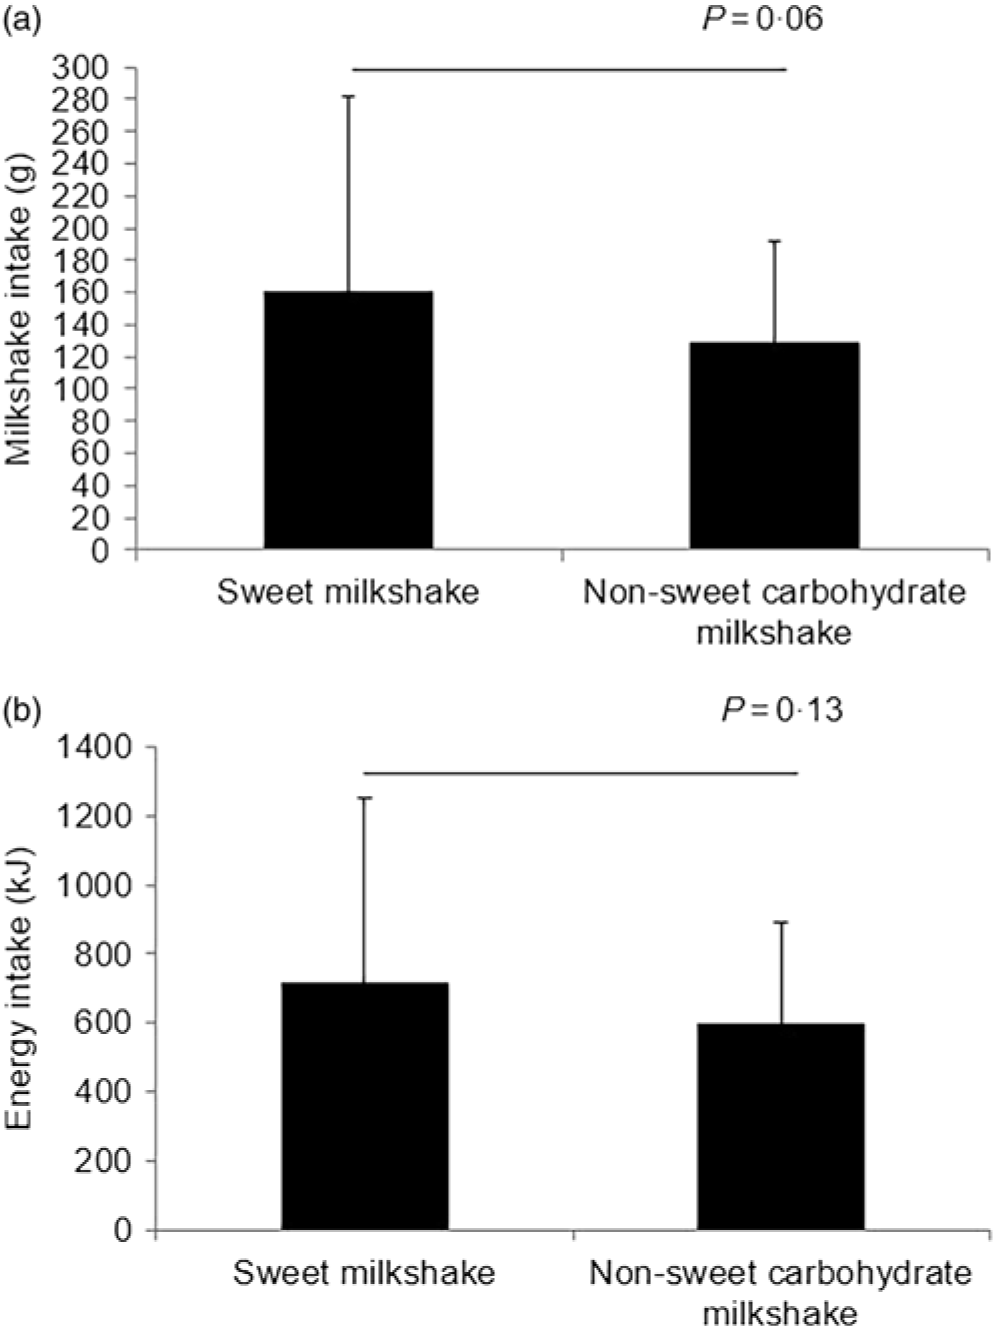
Fig. 3. Ad libitum milkshake intakes by weight (g) (a) and energy (kJ) (b) of healthy female adults (n 51) who consumed sweet (glucose) and non-sweet carbohydrate (maltodextrin) milkshakes in random order. Values are means, with standard deviations represented by vertical bars.
Liking of milkshakes, drinking rate and BMI
Liking ratings of preload and ad libitum milkshakes showed a significantly higher liking rating for the glucose milkshake than for the maltodextrin milkshake (all P < 0·05) (Fig. 4). Following preload consumption of each milkshake, liking ratings decreased significantly for ad libitum milkshake (all P < 0·05; Table 4). There were no significant differences between both types of milkshakes on decrease in liking (Δ) (P = 0·78). Ad libitum drinking rate expressed as g/s and kJ/s did not differ between types of milkshakes (all P > 0·05; Table 5).
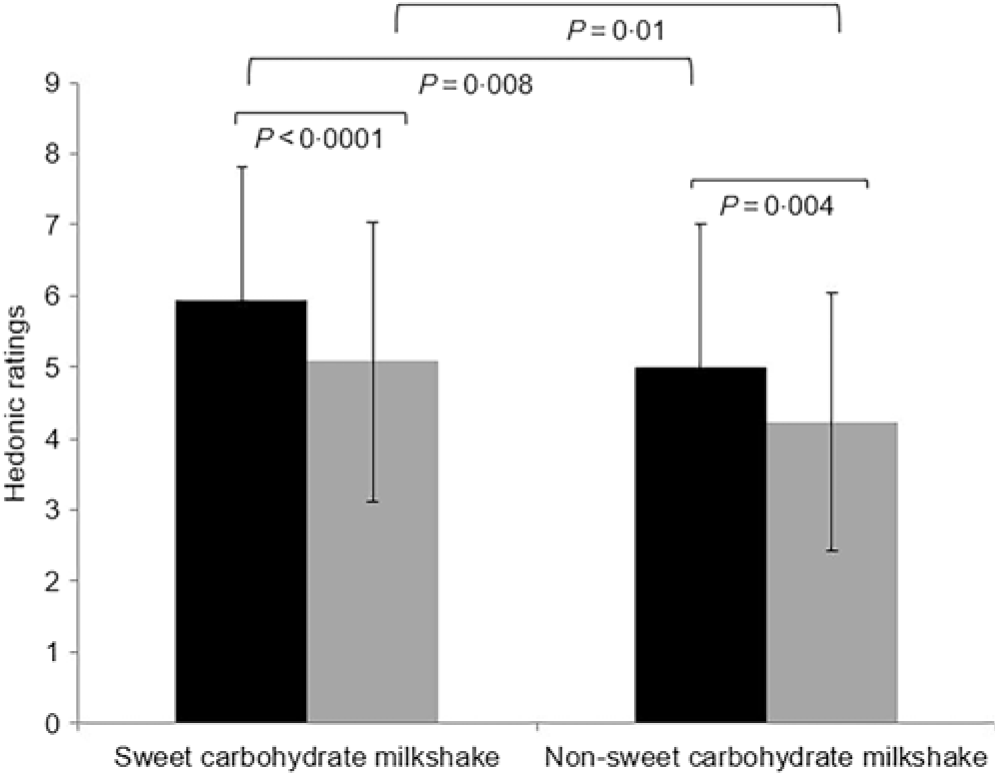
Fig. 4. Hedonic ratings for preload (![]() ) and ad libitum (
) and ad libitum (![]() ) sweet (glucose) and non-sweet carbohydrate (maltodextrin) milkshakes of healthy female adults (n 51). The y-axis is the adjusted hedonic ratings from a nine-point hedonic scale. The x-axis represents the preload and ad libitum milkshakes measured. Values are means, with standard deviations represented by vertical bars.
) sweet (glucose) and non-sweet carbohydrate (maltodextrin) milkshakes of healthy female adults (n 51). The y-axis is the adjusted hedonic ratings from a nine-point hedonic scale. The x-axis represents the preload and ad libitum milkshakes measured. Values are means, with standard deviations represented by vertical bars.
Table 4. Hedonic ratings and appetite ratings of healthy female adults (n 51) who consumed two types of milkshakes containing different amounts of glucose (sweet carbohydrate milkshake) and maltodextrin (non-sweet carbohydrate milkshake) on two separate days*
(Mean values and standard deviations)
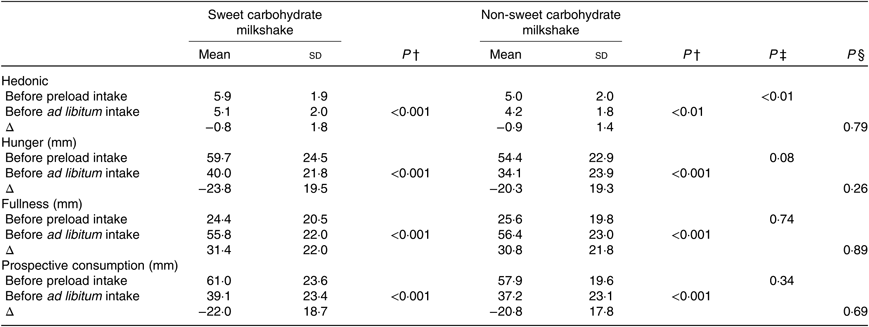
* Δ: rating before ad libitum intake − rating before preload intake. Hedonic values are adjusted hedonic ratings from a nine-point hedonic scale.
† P values representing differences between before preload intake and before ad libitum intake in hedonic, hunger, fullness and prospective consumption ratings (paired t tests).
‡ P values representing differences between sweet and non-sweet carbohydrate milkshake sessions before preload intake in hedonic, hunger, fullness and prospective consumption ratings (paired t tests).
§ P values representing differences between sweet and non-sweet carbohydrate milkshakes in terms of changes before preload intake and before ad libitum intake (Δ) in hedonic, hunger, fullness and prospective consumption ratings (paired t tests).
Table 5. Drinking rates and meal durations of healthy female adults (n 51) for ad libitum consumption of two types of milkshakes containing different amounts of glucose (sweet milkshake) and maltodextrin (non-sweet carbohydrate milkshake)
(Mean values and standard deviations)
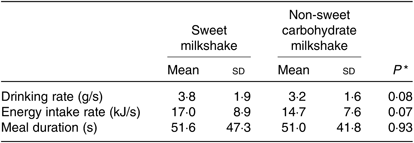
* P values representing differences between sweet milkshake and non-sweet carbohydrate milkshake (paired t tests).
Ad libitum intakes of both milkshakes were positively correlated with drinking rate (g/s; r 0·75 (P = 0·001) and r 0·54 (P = 0·001) for the glucose and maltodextrin milkshakes, respectively). No significant correlations were observed between drinking rate (g/s), liking ratings (ad libitum) and changes in liking ratings for both types of milkshakes (Δ) (all P > 0·05). No significant correlations were observed between BMI and ad libitum intake of both milkshakes (all P > 0·05). Similarly, BMI was not significantly correlated with intake differences (Δ) of both types of milkshakes (all P > 0·05). Drinking rates (g/s), liking ratings (preload and ad libitum) and changes in liking ratings for both types of milkshakes (Δ) were not correlated with BMI (all P > 0·05).
Appetite ratings
No significant differences were observed between ratings of fullness, hunger and prospective consumption before consumption of preload milkshakes (all P > 0·05) signifying that participants were in a similar state of satiety before preload intake. Fullness ratings increased, hunger decreased and ratings of prospective consumption decreased significantly following preload intake of both milkshakes (all P < 0·001; Table 4). There were no significant differences in terms of Δ fullness, hunger and ratings of prospective consumption of glucose milkshake in comparison with maltodextrin milkshake (i.e. differences in fullness, hunger and ratings of prospective consumption before and after preload consumption between both milkshakes) (all P > 0·05; Table 4).
Sweet taste function, oral complex carbohydrate sensitivity and ad libitum intake of milkshakes
The DT and mean intensity ratings, standard deviations and ranges for both glucose and maltodextrin are presented in Table 6; for more details see online Supplementary Fig. S1. Significant negative correlations were identified between maltodextrin DT and ad libitum consumption of maltodextrin-based milkshakes (r−0·36, P = 0·01). However, no significant correlations were identified between any measures of sweet taste function and ad libitum consumption of glucose milkshakes (all P > 0·05; Table 7).
Table 6. Detection threshold (DT) (%, w/v) and mean intensity ratings (general Labeled Magnitude Scale) for glucose and maltodextrin of healthy female adults (n 51)*
(Mean values, standard deviations and ranges)

>* Mean intensity ratings calculated based on the geometric mean score of the three solution ratings (weak, moderate and strong). Participants who are termed more sensitive to the carbohydrate compounds tested have a lower DT and higher intensity ratings than less-sensitive participants (higher DT, lower intensity rating). DT and suprathreshold intensity perception for glucose and maltodextrin were treated as grouping variables (tertiles) with participants categorised as more sensitive/who experienced low intensity (1/3), normal sensitive/moderate intensity (2/3) and less sensitive/high intensity (3/3) to explore differences between continuous (milkshake intake, BMI) variables. DT and suprathreshold intensity perception for glucose and maltodextrin were grouped into tertiles to allow comparison of most and least sensitive groupings or those groups who experienced low and high intensity.
Table 7. Pearson product-moment correlations between detection thresholds, mean intensity ratings and ad libitum milkshakes for glucose and maltodextrin of healthy female adults (n 51)†
(Pearson’s r correlation coefficient values)
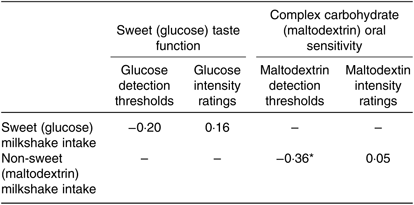
* P = 0·01.
† For sweet (glucose) detection thresholds and mean intensity ratings, statistical relationships were only calculated for sweet (glucose) milkshakes, and vice versa for complex carbohydrate (maltodextrin).
When stratified into tertile groups (according to the complex carbohydrate and sweetener tested and all taste measures), we observed significant differences in terms of ad libitum consumption of maltodextrin-based milkshakes between the participant groups who were more sensitive and less sensitive towards maltodextrin (DT only) (Fig. 5(a)). Participants who were more sensitive towards maltodextrin (DT) consumed significantly more maltodextrin milkshake (mean intake (g) = 150·1 g; mean intake (kJ) = 695·3 kJ) in comparison with less-sensitive participants (mean intake (g) = 100·1 g; mean intake (kJ) = 463·1 kJ) (P = 0·01). Despite differences in maltodextrin milkshake intake (approximately 50 % greater energy intake consumed), no significant changes in appetite ratings (i.e. increase in fullness ratings, decrease in hunger and prospective consumption) were observed between the more-sensitive and less-sensitive participants towards maltodextrin DT (all P > 0·05). There were no significant differences in terms of ad libitum consumption of glucose-based milkshakes between the participant groups who were more sensitive and less sensitive towards glucose (DT) (Fig. 5(a)). Similarly, no significant differences in terms of ad libitum consumption of both glucose and maltodextrin-based milkshakes between the participant groups who experienced low intensity or high intensity to glucose (ST) and maltodextrin (ST) (all P > 0·05; Fig. 5(b)).
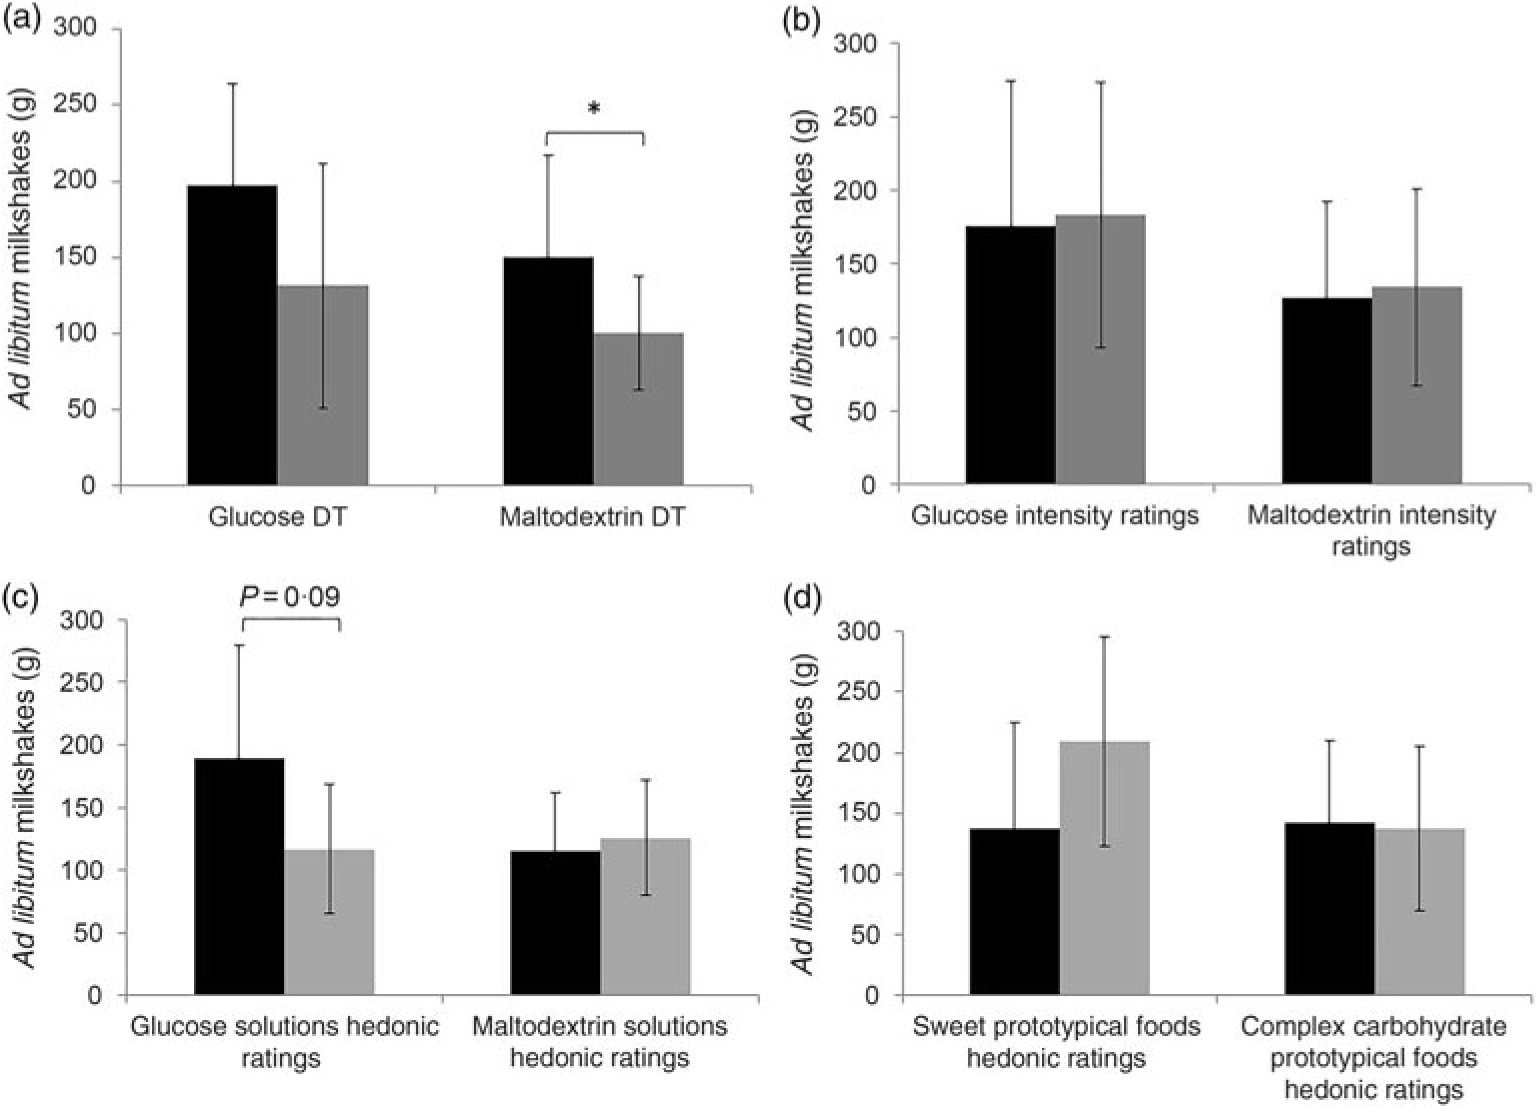
Fig. 5. (a,b) Ad libitum milkshake intakes of more-sensitive (![]() ) and less-sensitive (
) and less-sensitive (![]() ) participants or those who experienced high (
) participants or those who experienced high (![]() ) and low (
) and low (![]() ) intensity ratings. (c,d) Ad libitum milkshake intakes of participants with high hedonic ratings (
) intensity ratings. (c,d) Ad libitum milkshake intakes of participants with high hedonic ratings (![]() ) and low hedonic ratings (
) and low hedonic ratings (![]() ) for both sweet and complex carbohydrate solutions and prototypical foods. For sweet taste function and sweet hedonic ratings, comparisons were only made for sweet (glucose) milkshakes, and vice versa for complex carbohydrate (maltodextrin). Values are means, with standard deviations represented by vertical bars. *P = 0·01. DT, detection threshold.
) for both sweet and complex carbohydrate solutions and prototypical foods. For sweet taste function and sweet hedonic ratings, comparisons were only made for sweet (glucose) milkshakes, and vice versa for complex carbohydrate (maltodextrin). Values are means, with standard deviations represented by vertical bars. *P = 0·01. DT, detection threshold.
Hedonic ratings for glucose and maltodextrin solutions, prototypical foods, milkshakes and ad libitum intake of milkshakes
No significant differences in hedonic ratings for glucose and maltodextrin solutions and prototypical foods were identified between BMI and order of session groups (all P > 0·05). The mean hedonic ratings, standard deviations and ranges for both sweet and complex carbohydrate solutions (glucose, maltodextrin) and prototypical foods are presented in Table 8. Liking of glucose milkshake was significantly correlated with glucose milkshake intake (r 0·30; P = 0·03). No significant associations were observed between other sweet and complex carbohydrate hedonic measures (solutions, prototypical foods) and ad libitum intake of milkshakes (all P > 0·05).
Table 8. Hedonic ratings for sweet and complex carbohydrate solutions and prototypical foods of healthy female adults (n 51)
(Mean values, standard deviations and ranges)

* Hedonic rating for solutions calculated based on the geometric mean score of the three solution ratings (weak, medium and strong).
† For hedonic ratings of a range of sweet and complex carbohydrate foods, a geometric mean score of the eight food items was used.
When stratified into tertile groups (according to the complex carbohydrate and sweetener tested and all taste measures), we observed significant differences in terms of hedonic ratings for both preload and ad libitum glucose-based milkshakes between the participant groups who were more sensitive and less sensitive towards glucose (DT, ST). Participants who were more sensitive towards glucose solutions (DT, ST) rated higher on the hedonic scale for both preload and ad libitum glucose milkshakes (DT/ST: mean preload hedonic ratings = 6·6/6·5; mean ad libitum hedonic ratings = 6·0/6·0) in comparison with participants with lower hedonic ratings (mean preload hedonic ratings = 5·1/5·5; mean ad libitum hedonic ratings = 4·2/4·5) (all P < 0·05). However, there were no significant differences in hedonic ratings for glucose milkshakes between oral sensitivity groups towards maltodextrin (both DT, ST) (all P > 0·05). Similarly, there were no significant differences in hedonic ratings for maltodextrin milkshakes between more-sensitive and less-sensitive participants or those who experienced high intensity or low intensity to both glucose and maltodextrin (DT, ST) (all P > 0·05).
When stratified into tertile groups (according to liking ratings towards solutions, prototypical foods and milkshakes), we observed a trend (P = 0·09) towards significant differences in terms of ad libitum consumption of glucose milkshakes between participants with high hedonic ratings and low hedonic ratings for glucose solutions (Fig. 5(c)). Significance differences were observed between those with high hedonic ratings and low hedonic ratings for glucose milkshakes and ad libitum consumption of glucose milkshakes (P = 0·049) (Fig. 6). Participants who had high hedonic ratings for the glucose-based milkshake consumed significantly more for the same milkshake (mean intake (g) = 212·9 g; mean intake (kJ) = 946·3kJ)) in comparison with participants with low hedonic ratings (mean intake (g) = 123·9 g; mean intake (kJ) = 550·8 kJ)). There were no significant differences between participants who rated low and high on the hedonic scale according to their liking towards sweet (prototypical foods) and complex carbohydrate hedonic ratings (solutions, prototypical foods, milkshake) for ad libitum consumption of milkshakes (all P > 0·05; Figs. 5(d) and 6).
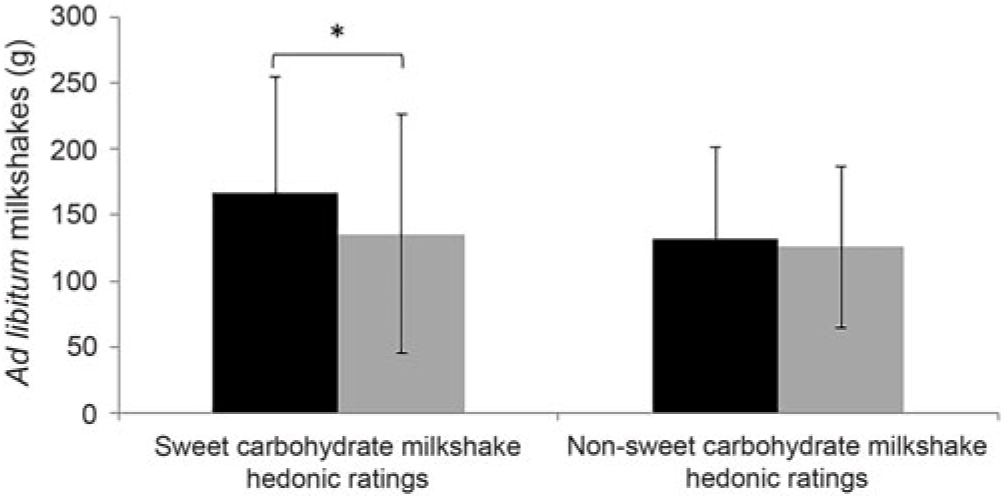
Fig. 6. Ad libitum milkshake intakes for participants with high hedonic ratings (![]() ) and low hedonic ratings (
) and low hedonic ratings (![]() ) for both sweet (glucose) and non-sweet (maltodextrin) carbohydrate milkshakes. For sweet hedonic ratings, comparisons were only made for sweet milkshakes, and vice versa for complex carbohydrate. Values are means, with standard deviations represented by vertical bars. *P = 0·049.
) for both sweet (glucose) and non-sweet (maltodextrin) carbohydrate milkshakes. For sweet hedonic ratings, comparisons were only made for sweet milkshakes, and vice versa for complex carbohydrate. Values are means, with standard deviations represented by vertical bars. *P = 0·049.
Discussion
To our understanding, the present study is the first to investigate if individuals’ ability to detect and perceive complex carbohydrates at a range of concentrations is associated with ad libitum intake of energy/foods in the form of liquid. The major finding was that those who were able to detect complex carbohydrate in water at a lower concentration (DT, more-sensitive group) consumed 50 % more non-sweet carbohydrate (maltodextrin-based) milkshake than of those who were less sensitive to complex carbohydrate, and this was independent of liking. Despite differences in intake of non-sweet carbohydrate (maltodextrin-based) milkshake, there were no significant changes in appetite ratings (i.e. decrease in hunger and prospective consumption, increase in fullness) between those who were more sensitive and less sensitive to complex carbohydrate (DT). Presumably liking was driving consumption of the glucose milkshake; however, liking of maltodextrin was not driving consumption of the maltodextrin-based milkshake. In fact, we observed that the maltodextrin-based milkshakes were not liked by participants at all (i.e. average mean hedonic ratings went from neutral in the preload to dislike in the ad libitum milkshake). It appears that maltodextrin sensitivity (DT) is associated with increasing consumption although the mechanism remains unknown. We speculate that sensing small amounts of complex carbohydrates (maltodextrin) may promote unconscious consumption due to the activation of specific brain regions involved with taste and reward. For example, previous neuroimaging sequence studies using fMRI to assess corticol responses to a maltodextrin mouth rinse revealed activation within the primary taste cortex and the neural networks (reward) associated with sensory perception(Reference Turner, Byblow and Stinear34, Reference Chambers, Bridge and Jones35). All in, these data suggest a novel role of the oral perceptual system to complex carbohydrates in regards to the overconsumption of energy within a meal.
In the present study, participants who were more sensitive to complex carbohydrate (DT) consumed more of the non-sweet carbohydrate milkshake, thus energy intake, than less-sensitive participants did. These findings provide strong evidence to support our first hypothesis where oral complex carbohydrate sensitivity will be positively associated with ad libitum consumption of complex carbohydrate foods. Furthermore, they were in line with our previous studies showing that oral sensitivity to complex carbohydrate is positively associated with habitual energy intake and intake of dietary starch(Reference Low, Lacy and McBride16). Interestingly, these were only observed between DT measures (not intensity perception) and ad libitum consumption of milkshakes. As there are multiple perceptual phases of taste with no single measure being able to represent taste function globally(Reference Webb, Bolhuis and Cicerale20), this emphasis the need to include more than one measure of the oral function to measure the complex relationship between perception and dietary intake.
In the present work, we found that those who rated higher on the hedonic scale for sweet milkshakes had greater consumption of the sweet milkshakes. In contrast, despite an increase in consumption between participants who were more sensitive to complex carbohydrate, no significant associations were found between complex carbohydrate liking, appetite ratings and ad libitum intake of the non-sweet carbohydrate milkshakes. This provides a partial support for our second hypothesis, whereby only liking towards sweetness was associated with ad libitum consumption of sweet-carbohydrate-based foods. More importantly, our previous work also showed positive association between oral sensitivity to complex carbohydrate and waist circumference measurements(Reference Low, Lacy and McBride16). This suggests a possibility of some sub-conscious mechanism relating to oral sensitivity to complex carbohydrates (longer-term outcome of sensitivity), but not conscious liking that encourages consumption.
Regarding sweet taste function, there were no significant differences between participants who were more sensitive and less sensitive or those who experienced low and high intensity to sweet taste (both DT, ST) and ad libitum intake of sweet milkshakes. Although some studies found significant associations between sweet taste function, BMI and dietary intake(Reference Jayasinghe, Kruger and Walsh36–Reference Bartoshuk, Duffy and Hayes38), this is in line with a larger body of evidence indicating no significant associations(Reference Low, Lacy and McBride14, Reference Cicerale, Riddell and Keast39–Reference Bertoli, Laureati and Battezzati47). In addition, we found that the participants who had higher liking ratings for sweet milkshakes consumed more of the ad libitum sweet milkshake than the participants who had lower liking. It is likely that no significant associations were found between sweetness liking, BMI and intake of sweet foods in the previous studies(Reference Malcolm, O’Neil and Hirsch41, Reference Wooley, Wooley and Dunham43, Reference Rodin45, Reference Thompson, Moskowitz and Campbell46, Reference Thompson, Moskowitz and Campbell48–Reference Drewnowski, Kurth and Rahaim51), as most of these studies looked at self-reported habitual or usual intake rather than satiation/acute intake in a controlled laboratory environment. By looking at satiation/acute intake in a controlled environment, we were able to observe significant differences between hedonic ratings and ad libitum consumption of sweet milkshakes, in comparison with other measures such as solution and prototypical foods liking ratings suggesting that satiation measures are more appropriate/sensitive. Furthermore, it is also possible that no associations were observed between liking and consumption of sweet foods in the previously mentioned studies, as foods high in dietary sugar are most likely accompanied by other taste qualities such as salty, sour, bitter and fatty tastes. Thus, by matching both sweet and non-sweet carbohydrate milkshakes in energy, serving size, protein, fat, as well as salt and fibre levels, we were able to observe the direct influence of liking of sweetness on intake of a sweet milkshake within a meal. Therefore, foods high in dietary sugar may be one of the many risk factors for overconsumption of energy for individuals with high liking for sweetness due to the sweet taste or flavours present.
The present study needs to be considered alongside limitations, which may have confounded the results. First, the present study measured the intake of only a single food (milkshake). Although laboratory setting research using single foods is the most sensitive approach and provides clear results when quantifying the role of sensory properties on food intake, in reality, however, we normally consume multiple foods in a much less controlled environment as well as foods that consist of a more complex flavour(Reference Drewnowski and Bellisle2). Therefore, it is difficult to extrapolate these findings to everyday life. Second, we did not measure appetite ratings and liking ratings after consumption of the ad libitum milkshakes, or appetite ratings and intake of other foods in subsequent hours following the milkshake experiment as this was beyond the scope of the present study. Last, but not least, the participants were mainly young female adults within the normal BMI range, thus the present findings may be difficult to generalise to the broader population.
Conclusions
Participants who were orally more sensitive to complex carbohydrate (DT) consumed 50 % more of the non-sweet carbohydrate milkshake than those who were less sensitive to complex carbohydrate and this was independent of liking. However, no relationships were observed between sweet taste function and ad libitum intake of sweet milkshakes. For sweet taste, the present study showed that those who had higher liking ratings for sweet milkshake consumed significantly more sweet milkshakes in comparison with those who had lower liking ratings and this was independent of taste sensitivity to glucose. All in, these results support an association between oral (may be taste system) sensitivity to complex carbohydrate and the potential to overconsume complex carbohydrate foods. The present findings also provide insights into the relationship between liking of sweet taste and the potential to overconsume sweet foods within a meal.
Acknowledgements
Our friend and colleague Dr R. L. McBride passed away during preparation of the paper after a short illness.
The present study was supported by the Centre for Advanced Sensory Science, School of Exercise and Nutrition Sciences of Deakin University, Victoria, Australia.
J. Y. Q. L., K. E. L., R. L. M. and R. S. J. K. designed the research; J. Y. Q. L. conducted the research, analysed the data and wrote the main part of the manuscript; K. E. L., R. L. M. and R. S. J. K. provided expert input and were involved with the drafting of the manuscript; and R. S. J. K. had primary responsibility for final content. J. Y. Q. L., K. E. L. and R. S. J. K. read and approved the final manuscript.
All authors disclose no conflicts of interest.
Supplementary material
To view supplementary material for this article, please visit https://doi.org/10.1017/S0007114519001703


