The worldwide obesity epidemic has seen the proportion of pregnant women with excess weight rise to unprecedented levels( 1 ). Moreover, because the prevalence of obesity has risen more rapidly than the prevalence of overweight, an increasing proportion of pregnant women are obese( 1 ). In 2012–2013, almost half of Canadian women of reproductive age (18–39 years) were overweight (25 %) or obese (23 %)( 2 ). This situation is alarming because maternal obesity is associated with adverse pregnancy and health outcomes for mothers and can have long-term health consequences for children( Reference Leddy, Power and Schulkin 3 , Reference O’Connor and Blake 4 ).
Another source of concern is excessive gestational weight gain (GWG). It affects large proportions of women in all prepregnancy BMI categories. Recent studies in the USA and Canada have estimated that up to half of normal-weight women, and up to two-thirds of overweight (25 kg/m2≤BMI<30 kg/m2) or obese (BMI≥30 kg/m2) women, have excessive GWG( Reference Rasmussen and Yaktine 5 – Reference Deputy, Sharma and Kim 7 ). Excessive GWG correlates with adverse outcomes (e.g. fetal macrosomia), independently of prepregnancy BMI( Reference Ferraro, Barrowman and Prud’homme 6 , Reference Dzakpasu, Fahey and Kirby 8 ). Obese women with excessive GWG are thus particularly at risk for pregnancy complications, and their children are at risk for short- and long-term health problems such as obesity, diabetes and other chronic diseases( Reference O’Connor and Blake 4 , Reference Guelinckx, Devlieger and Beckers 9 , Reference Godfrey, Gluckman and Hanson 10 ). Inadequate GWG is also a public health concern because of its links to preterm birth, low birth weight and fetal growth restriction, three conditions that may also be related to obesity, metabolic dysfunction and other chronic diseases among offspring later in life( Reference Godfrey, Gluckman and Hanson 10 , Reference Yajnik and Deshmakh 11 ). To respond to these issues, in 2009, the US Institute of Medicine (IOM) revised its GWG recommendations( Reference Rasmussen and Yaktine 5 ). The revised recommendations have been adopted by many countries, including Canada( 12 ). Overweight and obese women are advised to gain less weight, and underweight women (BMI<18·5 kg/m2) to gain more weight than normal-weight women (18·5 kg/m2≤BMI<25 kg/m2), during pregnancy. The IOM-recommended GWG ranges from 12·5 to 18·0 kg for underweight women, 11·5 to 16·0 kg for normal-weight women, 7·0 to 11·5 kg for overweight women and 5·0 to 9·0 kg for obese women( Reference Rasmussen and Yaktine 5 ).
Nutritional requirements, and, therefore, dietary reference intakes (DRI) for many nutrients, increase during pregnancy( Reference O’Connor and Blake 4 , 13 ). Adjusting maternal dietary intake to align with both recommended GWG levels and DRI can prove challenging, particularly for overweight or obese pregnant women who are encouraged to limit their GWG. As a consequence, enhancing the nutrient density of dietary intakes is of the utmost importance to ensure that maternal and fetal nutritional needs are met during this crucial period( Reference O’Connor and Blake 4 ). Recently, however, a meta-analysis has reported poor compliance with nutritional recommendations during pregnancy in industrialised countries( Reference Blumfield, Hure and Macdonald-Wicks 14 , Reference Blumfield, Hure and Macdonald-Wicks 15 ). A recent study we conducted estimated usual intakes of energy and of several macro- and micro-nutrients among a large cohort of pregnant women( Reference Dubois, Diasparra and Bédard 16 ). The results identified a number of nutrient inadequacies in dietary intakes( Reference Dubois, Diasparra and Bédard 16 ).
Several studies have reported that women who enter pregnancy with a higher BMI tend to have less healthy dietary patterns throughout pregnancy( Reference Shin, Lee and Song 17 – Reference Tsigga, Filis and Hatzopoulou 21 ). Obese women in particular have been found to consume fewer fibre sources (e.g. vegetables( Reference Laraia, Bodnar and Siega-Riz 19 ), fruit( Reference Shin, Bianchi and Chung 22 ), whole grains( Reference Shin, Bianchi and Chung 22 )), whereas women with a lower BMI were more likely to exhibit health-conscious dietary patterns during pregnancy( Reference McGowan and McAuliffe 18 ). We may thus reasonably expect that adequacy of nutritional intakes and nutrient density also vary according to prepregnancy BMI. A fuller appreciation of these differences may prove particularly helpful in identifying priority areas for dietary interventions. Interventions could then be tailored to the needs of pregnant women in different BMI categories to whom different GWG recommendations would apply.
So far, studies investigating dietary intakes during pregnancy relative to prepregnancy BMI have mainly used composite measures of diet, which has allowed identifying differential dietary patterns by means of factor analysis, cluster analysis and index analysis( Reference Shin, Lee and Song 17 – Reference Tsigga, Filis and Hatzopoulou 21 ). Few studies have focused on nutritional intakes during pregnancy relative to prepregnancy BMI. In a small study conducted in the UK in 2002–2003 (n 72), Derbyshire et al. ( Reference Derbyshire, Davies and Costarelli 23 ) collected dietary information using a 4-to-7-d weighed-food diary and performed analyses of correlations between prepregnancy BMI and nutritional intakes (in absolute values) in the first trimester of pregnancy. The authors did not, however, consider energy-adjusted nutrient intakes( Reference Derbyshire, Davies and Costarelli 23 ). Moreover, since the revised IOM-GWG recommendations were published, to our knowledge no large-scale study has documented nutritional intakes (including a broad range of nutrients) among pregnant women with different prepregnancy BMI relative to DRI compliance.
A primary objective of our study is, therefore, to compare nutritional intake adequacy among women across prepregnancy BMI categories and to assess associations between nutritional intakes (energy adjusted) during pregnancy and prepregnancy BMI. As diet is a modifiable risk factor for GWG and may to a certain extent determine compliance with GWG recommendations, we will also explore potential associations between nutritional intakes during pregnancy and GWG for different prepregnancy BMI categories.
Methods
Studied population
The present study was performed using data from a pregnancy/birth cohort, the 3D Cohort Study (Design, Develop, Discover). This cohort study has been described in detail elsewhere( Reference Fraser, Shapiro and Audibert 24 ). In brief, a total of 2366 pregnant women were recruited between May 2010 and August 2012 from nine obstetric clinics in urban areas in the Province of Quebec, Canada. The women taking part in the 3D Study were recruited in the first trimester of pregnancy (8 to<14 weeks) with follow-up visits in the second (20 to<24 weeks) and third (32 to<34 weeks) trimesters, and at delivery. The children were followed from birth to 2 years of age. All instances of data collection covered a broad range of dimensions (e.g. sociodemographic, environmental, behavioural, medical) and employed multiple instruments (e.g. face-to-face interviews, self-reported questionnaires, medical charts). This study was conducted according to the guidelines laid down in the Declaration of Helsinki. As such, all procedures involving human subjects were approved by the research ethics committee at the coordinating centre at Sainte-Justine’s Hospital in Montreal, as well as academic and hospital ethics committees at all participating study sites. Written informed consent was obtained from all 3D Cohort Study participants upon recruitment.
Prepregnancy BMI (weight(kg)/height(m2)) was calculated from measured height and self-reported prepregnancy body weight captured during the first visit. Four categories of prepregnancy weight status were defined based on internationally accepted cut-offs for BMI: underweight (<18·5 kg/m2), normal weight (18·5–24·9 kg/m2), overweight (25·0–29·9 kg/m2) and obese (≥30·0 kg/m2). GWG was calculated as the difference between weight measured in the 3 weeks before delivery and self-reported prepregnancy weight. GWG conformity with the IOM-recommended levels published in 2009( Reference Rasmussen and Yaktine 5 ) was determined using the specific cut-offs for the four BMI categories and defined as comprising three levels (below, within, above).
Dietary intake was assessed from data gathered using a 3-d food record provided to participants on their second visit (i.e. in the second trimester). Participants were asked to record all food and drinks consumed on 2 weekdays and 1 weekend day during a week-long reference period. The use of food records allowed detailed information to be collected on both food products ingested and food preparation methods. Food quantities were estimated using common household items (e.g. measuring cups, tablespoons). Dietary information obtained from food records was coded by nutrition professionals trained in the use of Food Processor software, version 10.13.1 (ESHA Research, Inc.), which incorporated the latest version of the Canadian food composition database (Canadian Nutrient File)( 25 ). Coding activities also included quality control procedures where accuracy was validated by reviewing 20 % of the coded records and verifying extreme values. The coded information was then used to derive the energy and nutrient content of participants’ diets. We also assessed the extent of misreporting by comparing the ratio of estimated energy intake (eEI):estimated BMR (eBMR) for pregnant women with plausible cut-off values derived from Goldberg’s equations( Reference Black 26 ). We assumed a physical activity level of 1·55, and used CV for BMR, physical activity and within-subject energy intakes of 8·5, 15 and 23, respectively. Participants having a eEI:eBMR ratio between 1·00 and 2·40 were identified as ‘acceptable reporters’ (which was the case for 93 % of the pregnant women who provided complete and valid nutrition data from 3-d food records).
Only full-term pregnancies (37 weeks or more) were considered for inclusion in the study. To be eligible for the study, women also had to have provided information on prepregnancy weight, to have had their height measured (required for calculating BMI) and to have had final weight measured in the 3 weeks before delivery (to assess GWG). Out of 1319 eligible participants, 924 women reported 3 d of dietary intake on valid food records. Because the prevalence of energy misreporting is known to vary according to weight status, we used data from acceptable reporters only. Thus, nutritional analysis was conducted on a sample of 861 pregnant women.
Statistical analyses
We estimated usual dietary intakes of energy (E; kJ (kcal)), macronutrients and several other nutrients essential for a healthy pregnancy by using the National Cancer Institute method( Reference Tooze, Kipnis and Buckman 27 ). For each nutrient, a non-linear mixed model was derived from the whole sample. We then computed the distribution of usual intakes for all women and separately for each prepregnancy BMI category. We applied a Box–Cox transformation to all nutritional variables before analysis as they were not normally distributed. Certain covariates (i.e. mother’s age; ordinal food diary day (1st, 2nd or 3rd); weekday or weekend day; prepregnancy BMI category; and category of GWG relative to recommended levels (below, within or above)) were included in the models, when significant. Estimated distributions of usual intakes were used to calculate the proportions below estimated average requirement (EAR), above tolerable upper intake level (UL) for Na and below and above acceptable macronutrient distribution range (AMDR) for macronutrients (as %E)( 13 ). A two-tailed population proportion test was used to compare proportions across prepregnancy BMI categories. We also performed Pearson’s correlations between energy and nutrient intakes (energy adjusted) and prepregnancy BMI. Finally, we computed Pearson’s correlations between nutritional intakes (total and energy adjusted) and GWG for all participants and by prepregnancy BMI category. All analyses were conducted using SAS (version 9.4; SAS Institute); the significance level was set at 0·05.
Results
Table 1 presents characteristics of the studied population. A majority of pregnant women had university degrees (63 %) and lived in middle-to-upper-income households (59 % reporting annual family incomes ≥$80 000 (Canadian dollars)). A quarter (27 %) of the women reported excess weight before pregnancy (BMI≥25 kg/m2). Relative to their prepregnancy BMI category, 17 % of the women had a GWG below, whereas almost half (48 %) of the women had a GWG above, as per IOM recommendations. Prepregnancy BMI was also associated with GWG (see online Supplementary Table S1). A higher proportion of overweight and obese women (74 % in both cases) had GWG values above levels recommended for their BMI categories than did normal-weight and underweight women (39 and 27 % respectively). At the other end of the spectrum, one in five normal-weight and underweight women (20 % in both cases) and about one in ten obese women (11 %) had GWG values below recommended levels for their BMI categories. Overweight women had a low prevalence of inadequate GWG.
Table 1 Description of the studied population (n 861) (Numbers and percentages)
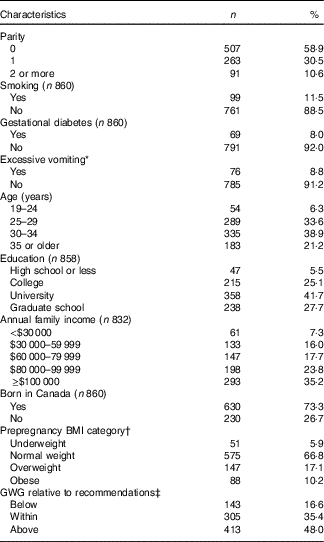
GWG, gestational weight gain.
* Excessive vomiting with weight loss reported in either first or second trimester of pregnancy.
† Underweight: BMI<18·5 kg/m2; normal weight: 18·5 kg/m2≤BMI<25·0 kg/m2; overweight: 25·0 kg/m2≤BMI<30·0 kg/m2; obese: BMI≥30·0 kg/m2.
‡ The Institute of Medicine (IOM)-recommended GWG( Reference Rasmussen and Yaktine 5 ) ranges from 12·5 to 18·0 kg for underweight women, 11·5 to 16·0 kg for normal-weight women, 7·0 to 11·5 kg for overweight women and 5·0 to 9·0 kg for obese women.
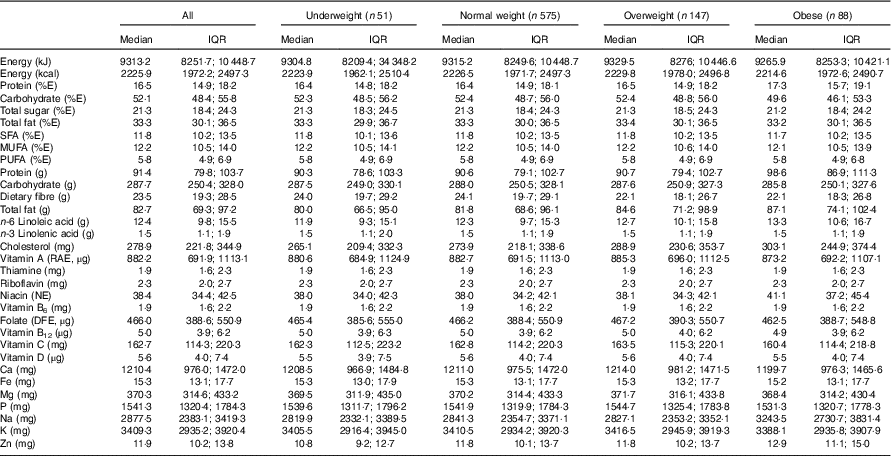
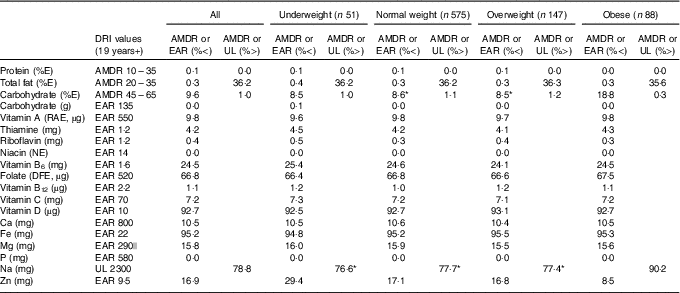
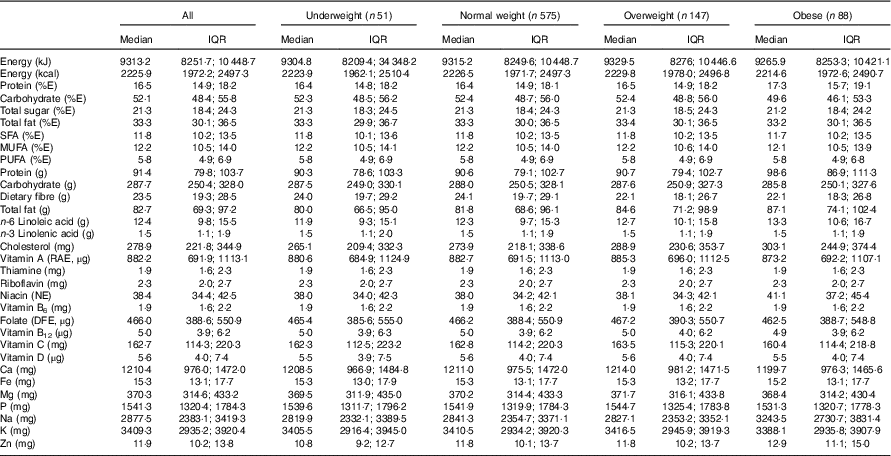
Table 2 presents estimated usual dietary intakes of energy and various nutrients (medians and interquartile ranges) during pregnancy relative to prepregnancy BMI categories, whereas Table 3 shows comparisons with DRI values. EAR comparisons indicate several nutrient inadequacies for pregnant women in all BMI categories. Higher estimated prevalences of nutrient inadequacy were found for Fe and vitamin D (>90 %), folate (67 %) and vitamin B6 (25 %), and to a lesser extent for Mg (16 %), Zn (17 %), Ca (11 %) and vitamin A (10 %). In addition, 36 % of the women in all BMI categories had total fat intakes above the AMDR. Among obese women, we found a significantly higher estimated prevalence of carbohydrate intakes (relative to EI) below the AMDR compared with normal-weight and overweight women (19 v. 9 %). Na intakes exceeded the UL for the majority of pregnant women; for those who were obese, the proportion was significantly higher compared with those in other BMI categories (90 v. 77–78 %). In all four BMI categories, median intakes of K and fibre were below recommended values (Adequate Intake of 4700 mg and 28 g, respectively), whereas median intakes of essential fatty acids (linoleic and α-linolenic) were in-line with Adequate Intakes (13 and 1·4 g, respectively). Although there is no specific DRI for cholesterol, the general recommendation is for adults to limit consumption to 300 mg/d( 28 ). A higher proportion of obese pregnant women had cholesterol intakes above this recommended value compared with normal-weight women (51 v. 39 %; data not shown).
Table 2 Usual dietary intakes of energy and nutrients during pregnancyFootnote * for all participants (n 861)Footnote † and by prepregnancy BMI categoryFootnote ‡ (Medians and interquartile ranges (IQR))
E, energy; RAE, retinol activity equivalent; NE, niacin equivalent; DFE, dietary folate equivalent.
* Usual intakes were estimated by using the National Cancer Institute method( Reference Tooze, Kipnis and Buckman 27 ). For each nutrient, a non-linear mixed model was derived for the whole sample. The distribution of usual intakes was then computed for all participants and separately for each prepregnancy BMI category. A Box–Cox transformation was applied to all nutritional variables before analysis. Certain covariates (e.g. mother’s age; 1st, 2nd or 3rd day of the food diary; weekday/weekend day) were included in the models when relevant.
† Acceptable reporters only (ratio of energy intake:BMR between 1·00 and 2·40).
‡ Underweight: BMI<18·5 kg/m2; normal weight: 18·5 kg/m2≤BMI<25·0 kg/m2; overweight: 25·0 kg/m2≤BMI<30·0 kg/m2; obese: BMI≥30·0 kg/m2.
Table 3 Adequacy of nutritional intakes during pregnancyFootnote † relative to dietary reference intakes (DRI) for all participants (n 861)Footnote ‡ and by prepregnancy BMI categoryFootnote § (Percentages below or above selected DRI values for pregnancy)
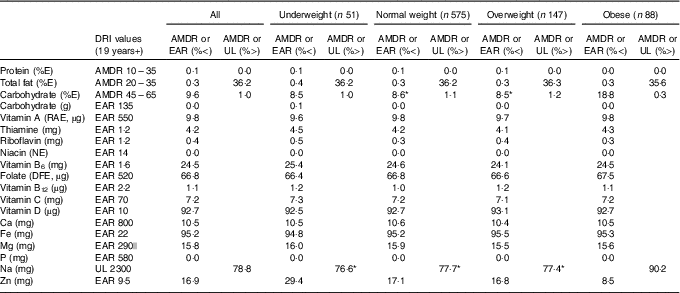
AMDR, acceptable macronutrient distribution range; EAR, estimated average requirement; UL, tolerable upper intake level; E, energy; RAE, retinol activity equivalent; NE, niacin equivalent; DFE, dietary folate equivalent.
* Value significantly different from that for obese women (P<0·05).
† Usual intakes were estimated by using the National Cancer Institute method( Reference Tooze, Kipnis and Buckman 27 ). For each nutrient, a non-linear mixed model was derived for the whole sample. The distribution of usual intakes was then computed for all participants and separately for each prepregnancy BMI category. A Box–Cox transformation was applied to all nutritional variables before analysis. Certain covariates (e.g. mother’s age; 1st, 2nd or 3rd day of the food diary; weekday/weekend day) were included in the models when relevant. Estimated distributions of usual intakes served to calculate proportions below EAR, above UL (for Na) and below and above AMDR (for major macronutrients as %E). A two-tailed population proportion test was used to compare proportions across prepregnancy BMI categories.
‡ Acceptable reporters only (ratio of energy intake:BMR between 1·00 and 2·40).
§ Underweight: BMI<18·5 kg/m2; normal weight: 18·5 kg/m2≤BMI<25·0 kg/m2; overweight: 25·0 kg/m2≤BMI<30·0 kg/m2; obese: BMI≥30·0 kg/m2.
|| EAR value for 19–30-year-old pregnant women specifically. Since EAR is slightly higher for pregnant women aged 31–50 years (i.e. 300 mg), calculated percentages below EAR represent a conservative estimate.
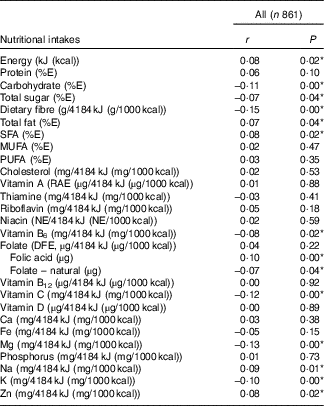
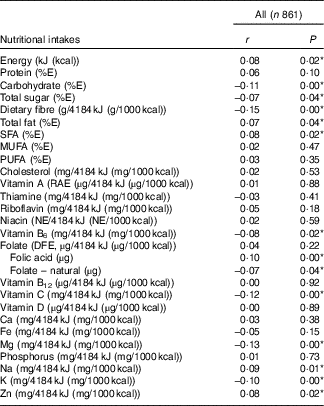
Table 4 presents Pearson’s correlations between BMI and nutritional intakes. We detected a positive linear relationship (r 0·08) between BMI and total intake of energy. Intakes of several nutrients (adjusted for energy) were also found to be weakly correlated with BMI. Positive correlations (r 0·07 to 0·09) with BMI were noted for intakes of total fat, saturated fat, Na and Zn, whereas negative correlations (r −0·07 to −0·15) were observed for carbohydrates, total sugars, dietary fibre, vitamin B6, vitamin C, Mg and K. Although there was no significant correlation between BMI and folate (µg dietary folate equivalent), we did notice weak correlations for both folate sources. Folic acid, the synthetic form found in fortified food, was positively correlated (r 0·10) with BMI, whereas naturally occurring folate was negatively correlated (r −0·07) with BMI.
Table 4 Correlation between prepregnancy BMI and nutritional intakes (adjusted for energy) during pregnancyFootnote † (Pearson’s correlation coefficients and P values)
E, energy; RAE, retinol activity equivalent; NE, niacin equivalent; DFE, dietary folate equivalent.
* P<0·05.
† Acceptable reporters only (ratio of energy intake:BMR between 1·00 and 2·40).
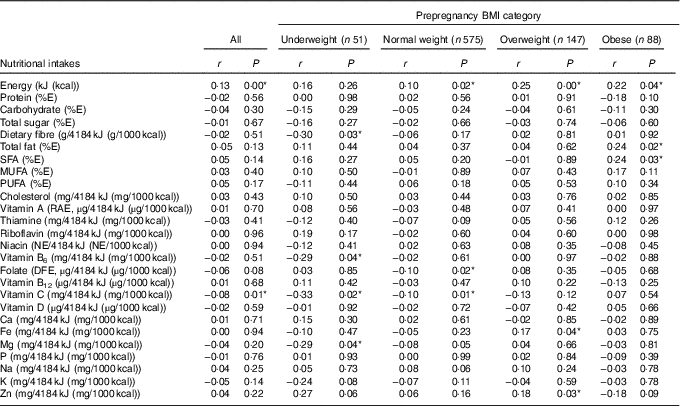
Table 5 presents Pearson’s correlations between GWG and nutritional intakes. Energy intake was positively correlated (r 0·13) with total GWG. Total intakes (in absolute values) of nutrients providing energy (proteins, carbohydrates, total fats and various types of fats), cholesterol and several micronutrients (riboflavin, niacin, vitamin B6, Ca, Fe, P, Na and Zn) also tended to show a positive linear relationship with GWG (see online Supplementary Table S2). When nutrient intakes were adjusted for energy, certain correlations were detected with total GWG; for the most part, these were specific to certain categories of prepregnancy BMI. For underweight women, negative correlations (r −0·29 to −0·33) were found between GWG and intakes of dietary fibre, vitamin C, vitamin B6 and Mg. Among normal-weight women, weaker negative correlations (r −0·10) were detected between GWG and dietary intakes of folate and vitamin C. Conversely, among overweight women, we detected positive correlations (r 0·17–0·18) between GWG and dietary intakes of Fe and Zn. Among obese pregnant women, positive correlations (r 0·24) with GWG were found for intakes of total fat and saturated fat.
Table 5 Correlation between gestational weight gain and nutritional intakes (adjusted for energy) during pregnancyFootnote † for all participants (n 861) and by prepregnancy BMI categoryFootnote ‡ (Pearson’s correlation coefficients and P values)
E, energy; RAE, retinol activity equivalent; NE, niacin equivalent; DFE, dietary folate equivalent.
* P<0·05.
† Acceptable reporters only (ratio of energy intake:BMR between 1·00 and 2·40).
‡ Underweight: BMI<18·5 kg/m2; normal weight: 18·5 kg/m2≤BMI<25·0 kg/m2; overweight: 25·0 kg/m2≤BMI<30·0 kg/m2; obese: BMI≥30·0 kg/m2.
Discussion
Diet and prepregnancy BMI
One objective of this study was to compare the adequacy of nutritional intakes during pregnancy among women with a different prepregnancy weight status. Our study identified several nutrient inadequacies. Although this observation is generalisable across all prepregnancy BMI categories, we found that a higher proportion of obese women had Na intakes above the UL, carbohydrate intakes (relative to EI) below the AMDR and higher-than-recommended cholesterol intakes compared with women in lower BMI categories.
Previous research on participants of the 3D Cohort Study showed that the vast majority of pregnant women used a multivitamin supplement during pregnancy, which reduced the prevalence of inadequate intake to below 10 % for most micronutrients( Reference Dubois, Diasparra and Bédard 16 ). As there was no significant difference in supplement use during pregnancy across prepregnancy BMI categories (data not shown), we may reasonably expect supplement use to contribute similarly to total nutritional intakes across all prepregnancy BMI categories.
By contrast, we found median intakes of fibre and K lower than reference values, total fat intake above the AMDR for a certain proportion of pregnant women and Na intakes above the UL for a majority of women. These intake levels, thus, remain a source of concern. Although these observations were noted in all prepregnancy BMI categories, obese pregnant women were more likely than other pregnant women to have Na intakes in excess of the UL. Moreover, prevalence estimates of carbohydrates intakes below the AMDR were lower than 10 % in all BMI categories, except for obese women. Our observations for cholesterol intakes among obese women suggest that lower carbohydrate intakes are compensated for by higher fat and protein intakes from animal-food sources.
Future in-depth research on the dietary patterns of 3D Cohort Study participants will allow deriving more specific information on food intake during pregnancy. Still, our findings reinforce the importance of dietary guidance for pregnant women who enter pregnancy with a BMI≥30 kg/m2 as a means for ensuring appropriate macronutrient intake distribution in overall dietary intake and a higher fibre intake throughout pregnancy. High Na intakes combined with low K intakes‚ which are associated with higher hypertension risks‚ have been observed for the entire Canadian population( Reference Tanase, Koski and Laffey 29 ). These intake levels suggest that nutritional counselling, including strategies to help achieve a better Na–K balance in dietary intakes, should also be part of prenatal interventions for all pregnant women, and to an even greater extent for obese women.
We did not find a comparable study reporting adequacy (relative to DRI) of nutritional intakes during pregnancy for prepregnancy BMI categories. A US study conducted between 1995 and 2000 (n 2394) offered only partially comparable information. It used a self-administered FFQ to derive an index of diet quality (Diet Quality Index for Pregnancy (DQI-P))( Reference Laraia, Bodnar and Siega-Riz 19 ). Analysis of specific components of the DQI-P indicated that as prepregnancy BMI status increased, the proportion of pregnant women having intakes below the EAR for Fe and folate also generally increased( Reference Laraia, Bodnar and Siega-Riz 19 ). Our analyses did not show significant differences across prepregnancy BMI categories for adequacy of Fe and folate intakes. Differences in dietary assessment methods, in the timing of the studies, and in study participant characteristics could have contributed to these divergent observations, although both studies appear in agreement on the generally low compliance with nutritional recommendations (DRI) for Fe and folate during pregnancy. Another study conducted in Ireland on obese pregnant women (n 100; n 75 in analyses excluding under-reporters) reported that a substantial proportion had low intakes of carbohydrates and high intakes of fats, particularly saturated fats (as %E); inadequate dietary intakes of certain key micronutrients (e.g. folate, Fe, Ca, vitamin D); and high consumption of energy-dense foods rich in fat and sugar( Reference Lindsay, Heneghan and McNulty 30 ). Our findings appear to be consistent with these observations and support the notion that women having excess weight before pregnancy may be particularly vulnerable nutritionally.
This conclusion appears to be further supported by the results of our analysis of correlations between prepregnancy BMI and energy-adjusted nutrient intakes during pregnancy. Energy intake was found to be weakly but positively associated with prepregnancy BMI. Analyses of energy-adjusted nutrient intakes by prepregnancy BMI suggested that women with different weight statuses before pregnancy also differed in dietary intake profiles while pregnant. A higher BMI before pregnancy was associated with higher intakes of certain nutrients found in animal-based sources (e.g. total fat, saturated fat, Zn) or processed (e.g. Na) and enriched (e.g. folic acid) food products. By comparison, a lower BMI before pregnancy was associated with higher intakes of carbohydrates (including total sugars), dietary fibre and nutrients such as naturally occurring folate, vitamin C, vitamin B6, K and Mg. This combination of nutrients suggests a higher consumption of plant-based food sources, such as vegetables, fruit, legumes and whole-grain products among women with lower BMI.
Derbyshire et al. ( Reference Derbyshire, Davies and Costarelli 23 ) have looked at correlations between prepregnancy BMI and nutritional intakes (in absolute values) in the first trimester of pregnancy. Their study was conducted on a small sample of pregnant women in London, UK (n 72; n 51 in analyses excluding under-reporters). Once under-reporters were removed from the analyses, the study detected no association between BMI and energy or nutrient intakes, except for folate (i.e. prepregnancy BMI was negatively correlated with folate intake). Another, larger study (n 795), which used nutritional data collected among pregnant women who participated in the US National Health and Nutrition Examination Survey between 2003 and 2012, did not find associations between prepregnancy weight status and intakes of energy or major macronutrients as %E( Reference Shin, Lee and Song 17 ). This study used single-day dietary recall to derive an overall diet quality score (Healthy Eating Index (HEI)-2010). It did not consider the misreporting of energy intakes in reported results. The authors did note, however, that obese women before pregnancy tended to have a lower score for the Na component of the HEI-2010 compared with normal-weight women( Reference Shin, Lee and Song 17 ). This result is indicative of higher intakes of Na/4184 kJ (1000 kcal) for obese women. Conversely, dietary intakes of folate and Fe/4184 kJ (1000 kcal) were found to be significantly lower for obese women than for underweight women( Reference Shin, Lee and Song 17 ). The results for Na appear to accord with our observations. Our study detected associations between folate intake (on a per 4184 kJ (1000 kcal) basis) and prepregnancy BMI only for specific sources of folate (i.e. an inverse association was found for folate naturally occurring in food and a positive association found for folic acid, which is present only in fortified food).
Diet and gestational weight gain
Our findings show that adherence to GWG recommendations posed problems for many pregnant women. One in six did not gain enough weight during pregnancy according to IOM recommendations, whereas almost one in two exceeded the BMI-specific GWG recommendation. The purpose of our study was to explore potential associations between nutritional intakes during pregnancy and GWG. Overall, our analyses showed a positive correlation between total intakes of energy and nutrients, and GWG. The relationship between energy intake and GWG is consistent with the conclusions of two recent systematic reviews of observational studies in industrialised countries( Reference Streuling, Beyerlein and Rosenfeld 31 , Reference Tielemans, Garcia and Peralta Santos 32 ). Because intakes of many nutrients are correlated with energy intakes( Reference Willett, Howe and Kushi 33 ), pregnant women with high-energy intakes are also more likely to ingest higher absolute quantities of nutrients, which may explain a similar positive association with GWG for several nutrients in absolute values. We did not, however, detect any association between macronutrient composition (as %E) and GWG, except for total fat and saturated fat specific to obese pregnant women.
Other studies examining dietary macronutrient composition during pregnancy relative to GWG have yielded inconclusive results( Reference Tielemans, Garcia and Peralta Santos 32 ). Recent systematic reviews, moreover, have shown considerable variability in the attributes of studies on macronutrient composition relative to GWG (e.g. in the measurement and definition of GWG; in dietary assessment methods; in the types of analyses)( Reference Streuling, Beyerlein and Rosenfeld 31 , Reference Tielemans, Garcia and Peralta Santos 32 ). This methodological inconsistency might explain irregular associations between GWG and intakes of protein, carbohydrates, and total fat, independent of energy content. Nevertheless, associations may well exist for certain types of fat (e.g. saturated fat( Reference Tielemans, Garcia and Peralta Santos 32 )) or may be specific to certain subgroups (e.g. overweight or obese women)( Reference Tielemans, Garcia and Peralta Santos 32 ), all of which would accord with our findings.
When considering energy-adjusted (i.e. per 4184 kJ (1000 kcal)) intakes of other nutrients, we observed specific patterns of association between GWG and certain prepregnancy BMI categories. For women in lower BMI categories (<25 kg/m2), and particularly for underweight women (BMI<18 kg/m2), lower GWG was associated with higher energy-adjusted intakes for certain nutrients commonly found in plant-based food sources such as fibre, vitamin C, vitamin B6, Mg or folate. These results may suggest a propensity toward health-conscious dietary choices among underweight or normal-weight women who have low GWG. By contrast, for overweight women (25 kg/m2≤BMI<30 kg/m2), higher GWG was associated with higher intakes (energy adjusted) of both Zn and Fe, which could result from a propensity toward higher consumption of animal-based sources of protein (e.g. meat) among overweight women who have high GWG. More extensive research into the dietary patterns of our study participants will allow examining food intake during pregnancy relative to GWG in greater detail. In any case, our analyses of nutritional intakes to date already indicate the existence of differential relationships between diet and GWG across prepregnancy BMI categories, as other studies have likewise suggested( Reference Tielemans, Garcia and Peralta Santos 32 , Reference Hillesund, Bere and Haugen 34 ).
Strengths and limitations
Participants in the 3D Cohort Study were recruited from a variety of geographical areas in the Canadian province of Quebec. Our sample was not, however, representative of the Quebec population. Almost two-thirds of participants had university degrees and half came from high-income families, which indicates a higher socio-economic status than that of the general population. Our study findings may also not be generalisable to preterm pregnancies as we included only participants who delivered at 37 weeks or later. Because participants were recruited in the first trimester of pregnancy, reported prepregnancy weights were used to determine prepregnancy weight status and to assess total GWG. Reported anthropometric data are frequently used in pregnancy/birth cohorts because recruiting women for pregnancy-related studies before they become pregnant can prove challenging in countries that have low birth rates. Despite later-than-ideal recruitments, a recent study conducted in the USA concluded that prepregnancy weight statuses estimated from self-reported data are reliable and valid for population-based studies( Reference Shin, Chung and Weatherspoon 35 ).
We collected detailed dietary data from pregnant women using a 3-d food record. In a recent systematic review of the validity of methods for assessing dietary intakes during pregnancy, food records proved to have the highest validity vis-à-vis biomarkers( Reference Vézina-Im and Robitaille 36 ). Although most dietary assessment methods that rely on self-reporting are prone to energy under-reporting( Reference Subar, Freedman and Tooze 37 ), we minimised the impact of misreported dietary information by estimating misreporting levels in our sample and by analysing only data provided by plausible reporters.
Our study presents an in-depth assessment of dietary intake in the second trimester of pregnancy for a large number of women. During the second trimester, pregnant women are less likely to experience the physical distress that often characterises early pregnancy (e.g. vomiting) and late pregnancy (e.g. heartburn). In the third trimester, certain complications (pre-eclampsia, diabetes) can alter participants’ diets, and premature births can prompt women to withdraw from studies. Despite its comprehensive scope and extensive database, our portrait of dietary intake may not be representative of participant’s diets throughout an entire pregnancy. One study of overweight and obese pregnant women has indicated that dietary quality tends to decrease throughout pregnancy( Reference Moran, Sui and Cramp 38 ). Other studies, however, have reported that diet composition and dietary patterns, whether before and during pregnancy or between trimesters, vary little( Reference Talai Rad, Ritterath and Siegmund 39 – Reference Crozier, Robinson and Godfrey 41 ). To gain a fuller understanding of dietary changes throughout pregnancy, more prospective dietary studies (which ideally would include the preconceptional period) are warranted.
Conclusion
Our assessment of nutritional intakes among pregnant women revealed several nutrient inadequacies generalisable across all prepregnancy BMI categories. We also observed that higher proportions of obese women had carbohydrate intakes (adjusted for energy) below the acceptable range and Na intakes above the UL. Our analyses suggest that differential relationships between diet and GWG exist across all prepregnancy BMI categories. Overall, our findings indicate that nutrition interventions are needed to help pregnant women achieve their optimal GWG while also meeting their nutritional requirements.
Acknowledgements
The authors are grateful to the 3D participants who took part in the nutrition study during their pregnancy and to members of the 3D study who contributed to data collection and coding. The authors also thank Robert Sullivan for assisting with manuscript editing.
This work was supported by the Canadian Institutes of Health Research (CIHR) (L. D., grant no. MOP 133422), (W. D. F., grant no. CRI 88413). CIHR had no role in the design, analysis or writing of this article.
L. D. designed the nutrition study, directed the analyses and interpretation of data, and had primary responsibility for final content. M. D. was responsible for all statistical analyses. L. D. and B. F.-B. wrote the paper. C. K. C., B. F.-B., R. E. T. contributed to study design and results interpretation. W. D. F. is the director of the 3D Cohort Study and was incharge of data collection and the overall direction of the study. All authors made critical revisions to the text and approved the manuscript submitted for publication.
None of the authors has any conflicts of interest to declare.
Supplementary material
For supplementary material/s referred to in this article, please visit https://doi.org/10.1017/S0007114518001393


