Introduction
The amount of radiation that reaches into and under Arctic snow is important because physical and biological processes depend on it and would change with an alteration of radiation amplitude or timing. The attenuation of solar radiation depends on a combination of snow-index properties and snow thickness. The relevance of optical solar radiation penetration into snow for energy exchange between atmosphere and soil, climatic-change research, the ecosystem and modeling has been extensively documented. A number of papers have been published on snow physical index properties connected to radiation properties as well as modeling of radiation interaction with the snowpack (Reference SchlatterSchlatter, 1972; Reference Wiscombe and WarrenWiscombe and Warren, 1980; Reference Grenfell, Perovich and OgrenGrenfell and others, 1981; Reference Brandt and WarrenBrandt and Warren, 1993; Reference Leroux, Lenoble, Brogniez, Hovenier and de HaanLeroux and others, 1998; Reference Winther, Gerland, Ørbæk, Ivanov, Blanco and BoikeWinther and others, 1999). In this paper we analyze outputs from an existing radiation-snow interaction model (see Reference GerlandGerland and others, 1999; Reference Listen, Winther, Bruland, Elvehoy and SandListon and others, 1999) in combination with modern quantum-meter and spectroradiometer measurements of photosynthetically active radiation (PAR). The field measurements are used to validate the model simulations and to understand possible model deficiencies. The measurements used here were performed on the tundra of the northwestern part of the Svalbard archipelago during May and June 1997 and 1998. Doing observations in spring made three different conditions available for our tests:
-
(a) cold Arctic snow with maximum thicknesses of 0.9 m (1997) and 0.6 m (1998)
-
(b) snow that was affected by melting only in the upper part of the snowpack
-
(c) isothermal, melting snowpack.
The model considers two-stream geometry of radiation, as well as spectral dependence of solar radiation penetrating snow, and physical properties such as snow depth, bulk surface albedo, bulk soil albedo, extinction coefficient of snow (constant or variable), snow grain-size and snow density.
Field Measurements
All measurements were performed in the tundra near Ny-Alesund, which is located on the Broggerhalvoya at 78°56’ N, 11°55’ E (Fig. 1) on the southern edge of Kongsfjorden on the northwestern coast of Svalbard. Due to the North Atlantic Current, the regional climate is relatively mild. Longterm records of meteorological data from Ny-Ålesund at the southern shore of Kongsfjorden show a mean annual precipitation of 402.9 mm w.e. (1975–96) and a mean annual temperature of –5.8°C (1935–96; Reference Forland, Hanssen-Bauer and NordliForland and others, 1997). Measurements were performed at two locations; one (A in Fig. 1) 100 m south of the settlement of Ny-Ålesund, and the other (B in Fig. 1) near the Bayelva River, 2000 m west of the settlement.

Fig. 1. Map of Kongsfjorden area. The research sites A (My-Ålesund) and B (Bayelva) in the tundra are indicated. The Svalbard archipelago is shown in the inset.
Snow pits
Snow pits were dug to enable the density (volumetric measurement using a 0.5 L tube), temperature (electronic thermometer with Ptl00 needle probe) and stratigraphy of the snowpack to be determined every 2–3 days. Snow types, according to the classification of Reference LaChapelleLaChapelle (1992), and sizes of snow grains (longest visible dimension) were determined using a magnifying glass and a millimeter-scale pad. The spatial resolution for the different methods lies in the millimeter range (temperature needle probe) and in the centimeter range (size of density probe).
Radiation studies
We performed photosynthetically active radiation (PAR) measurements in air and snow, as well as measurements of the spectral attenuation in snow. To study the attenuation of PAR radiation within the snowpack, a Licor LI-189 PAR quantum meter (LICOR, Lincoln, U.S.A.) was used in combination with snow-pit measurements of physical properties. This instrument measures an average value over a wavelength range of 400–700 nm. The sensor was mounted on a pole, which could be placed in holes dug in from the side of snow pits at different levels and closed before measurement, in order to avoid radiation scattering from the side.
For the spectral measurements, we used a FieldSpec FR spectroradiometer (Analytic Spectral Devices, Boulder, U.S.A), which is able to measure irradiance of 350–2500 nm wavelength. Results presented here were measured with one of the three built-in separate spectrometer units. This unit measures in the visible/near-infrared (VNIR) at wavelengths of 350–1000 nm. The spectrometer consists of 512 sensors, each covering 1.4 nm of the wavelength range. The spectral resolution is approximately 3 nm. In this paper, we concentrate on the wavelength range (PAR) covered by the Licor quantum meter (400–700 nm). With this wavelength-range choice we ensured direct comparability with the Licor quantum-meter data and we avoided using possibly less accurate data from the edges of the spectrometer’s measurement range. The spectroradiometer sensor is placed in a cosine receptor housing, which is connected by an optical fibre with the main console of the instrument. For the PAR measurements, this sensor was also placed under the snow in small holes dug in from the side of the snow pits. A second sensor on the surface enabled us to measure the incoming radiation directly before and after the under-snow measurement and thus allows us to suppress errors caused by changing atmospheric conditions. This spectroradiometer was also used for recording spectral surface albedo data of snow and soil (Reference GerlandGerland and others, 1999; Reference Winther, Gerland, Ørbæk, Ivanov, Blanco and BoikeWinther and others, 1999), which are also used as input parameters for the modeling (Reference Listen, Winther, Bruland, Elvehoy and SandListon and others, 1999).
Model
The theory for the physically based two-stream one-dimensional model is described in detail by Reference Listen, Winther, Bruland, Elvehoy and SandListon and others (1999). It is based on the work of Reference SchlatterSchlatter (1972), who developed a model using an extinction coefficient that is constant with depth, and of Reference Brandt and WarrenBrandt and Warren (1993) who modified Schlatter’s method to include the spectral dependence of solar radiation penetrating snow and ice. Consequently, the model is able to run in two different ways: (i) using a constant extinction coefficient so that an exponential relation describes the attenuation; and (ii) calculating and using an extinction coefficient variable with depth with a two-stream approach using input parameters of average snow grain-size (assuming spherical grain geometry), average snow density, surface albedo, soil albedo and the spectrum of the solar radiation measured at the surface. The model output consists of information for 5000 layers, including the calculated extinction coefficient, as well as the downward and upward fluxes for both cases.
Results
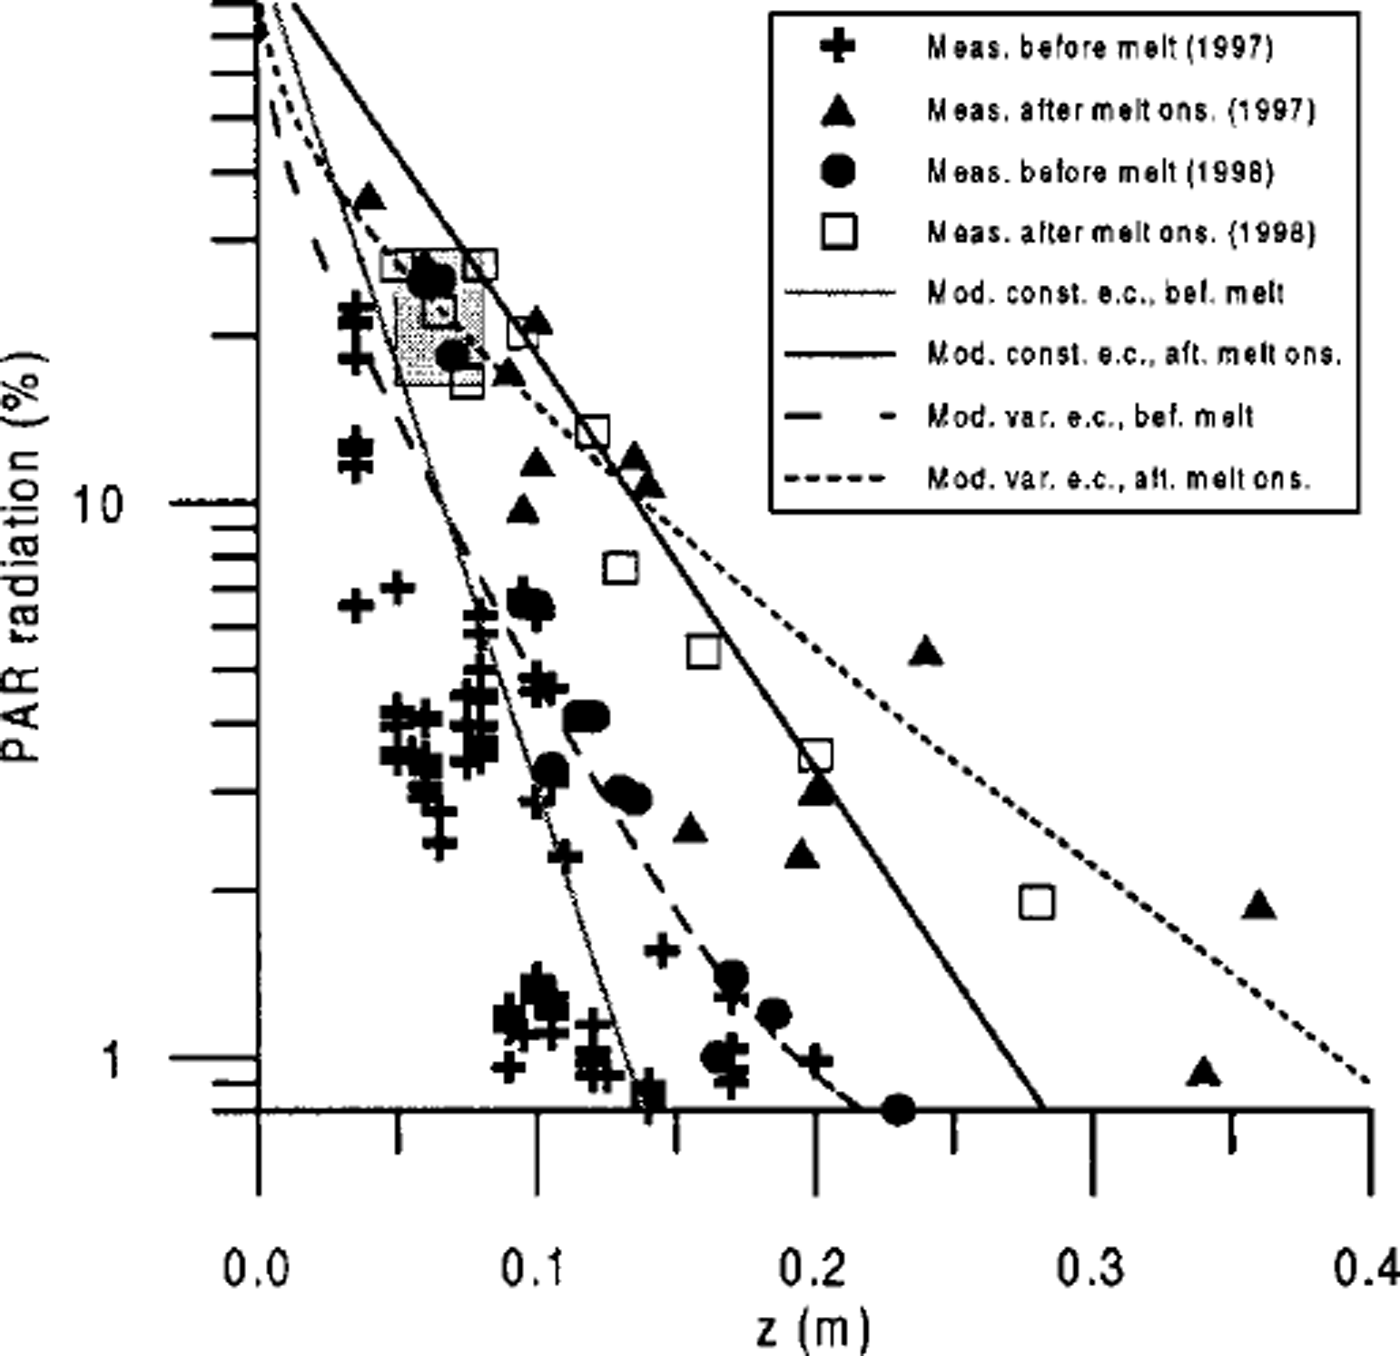
Average PAR data vs snow thickness above the sensor were obtained in 1997 (see also Reference GerlandGerland and others, 1999) and 1998 at sites A and B (Fig. 2). Model curves (Fig. 2) were calculated, using the model as described above. According to observations made in spring 1997, the input model parameters were chosen to be: total snow depth 0.5 m; average soil albedo 0.05; average surface albedo 0.95 and 0.6 (before and after the onset of melt, respectively); and average snow density 400 and 500 kg m–3(before and after the onset of melt, respectively). Trying to find input parameters that fit to our observations, for case (i) extinction coefficients of 77 = 35 m–1 (snow conditions before the onset of melt) and η = 17 m–1 (snow conditions after the onset of melt) were found (black and gray lines in Fig. 2). Model curves calculated by using a variable extinction coefficient (case (ii), long- and short-dashed curves in Fig. 2) fit even better to the field data in the deeper part of the snowpack, especially for conditions after the onset of melt. In this case, however, using snow-grain diameters as observed in the field, the under-snow radiation data and model curves showed a significant discrepancy. In order to obtain acceptable fits, average snow-grain diameters as model input data (0.02 mm for before the onset of melt, 0.1mm after) had to be chosen about 20 times lower than observed sizes.

Fig. 2. Average PAR data and model curves. Data from various snow pits and days at sites A and B are shown for measurements before (5–23 May 1997, crosses; 3–8 June 1998, filled circles) and after (7–20 June 1997, filled triangles; 10–19 June 1998, oPen squares) the onset of melting. The relative instrument reading l(z)/l(surface) is plotted at logarithmic scale vs snow thickness z above sensor. Model curves are displayed for runs using constant (gray solid line for before melt; black solid line for after the onset of melt) and variable (long-dashed curve for before onset of melt; short-dashed curve for after onset of melt) extinction coefficients. In 1998, the data indicated ˚before melt" (filled circles) were actually obtained when melting had already begun near the surface ( see filled-circle markers within the shaded area). The lower snow layers were not affected. This explains the different characteristics of data from near-surface and from deeper snow. Open squares (after onset of melt) indicate values measured when the entire snowPack where PAR measurements were obtained was isothermal 0˚C).
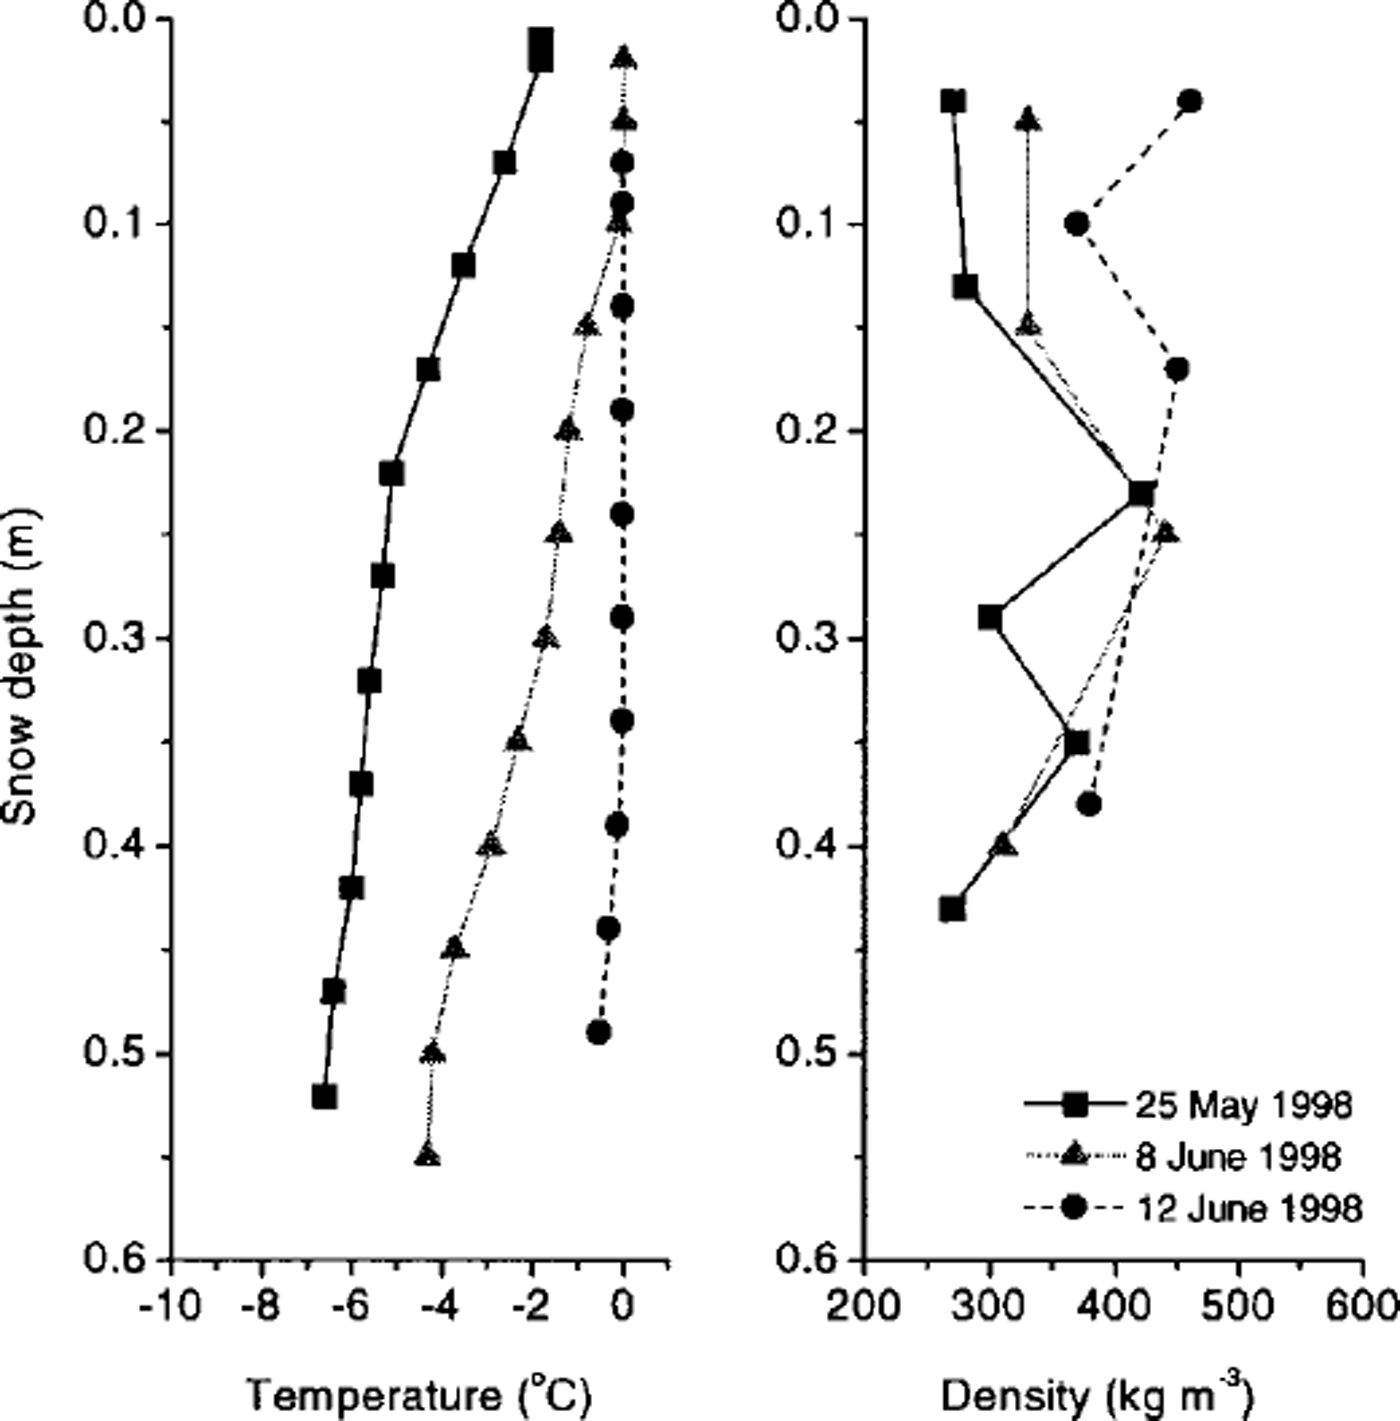
Some results from physical property measurements near Ny-Alesund in 1997 have been published (Reference GerlandGerland and others, 1999). Physical property data (density and temperature) from 1998, obtained from snow pits parallel to radiation measurements, are shown in Figure 3. They give a view of the snow condition shortly before the onset of melt (25 May), a few days after melting began (8 June) and when melting affected the entire snowpack (12 June). The temperature profiles visualize how the relatively warm air above the snow surface affects the snowpack and how the thickness of the isothermal (0°C) snow increases with time. The density data show an increase in density, first in the upper part of the snowpack (change from 25 May to 8 June), then also in the lower sections (change from 8 June to 12 June).

Fig. 3. Temperature and density of snow vs depth from snow pits at site B, measured on 25 May, 8 June and 12 June 1998 The temperature curves illustrate the change from "before onset of melt" conditions (25May 1998) to continuous decrease of temperature with depth over partly isothermal (0°C) conditions (8 June 1998, to an almost fully isothermal (0 ˚C) snowpack (12 June 1998). The three density curves show an increase with time, with largest gradients near the surface. According to the warming of the snowpack, the density changes first in the upper part and later in the lower part of the snowpack.
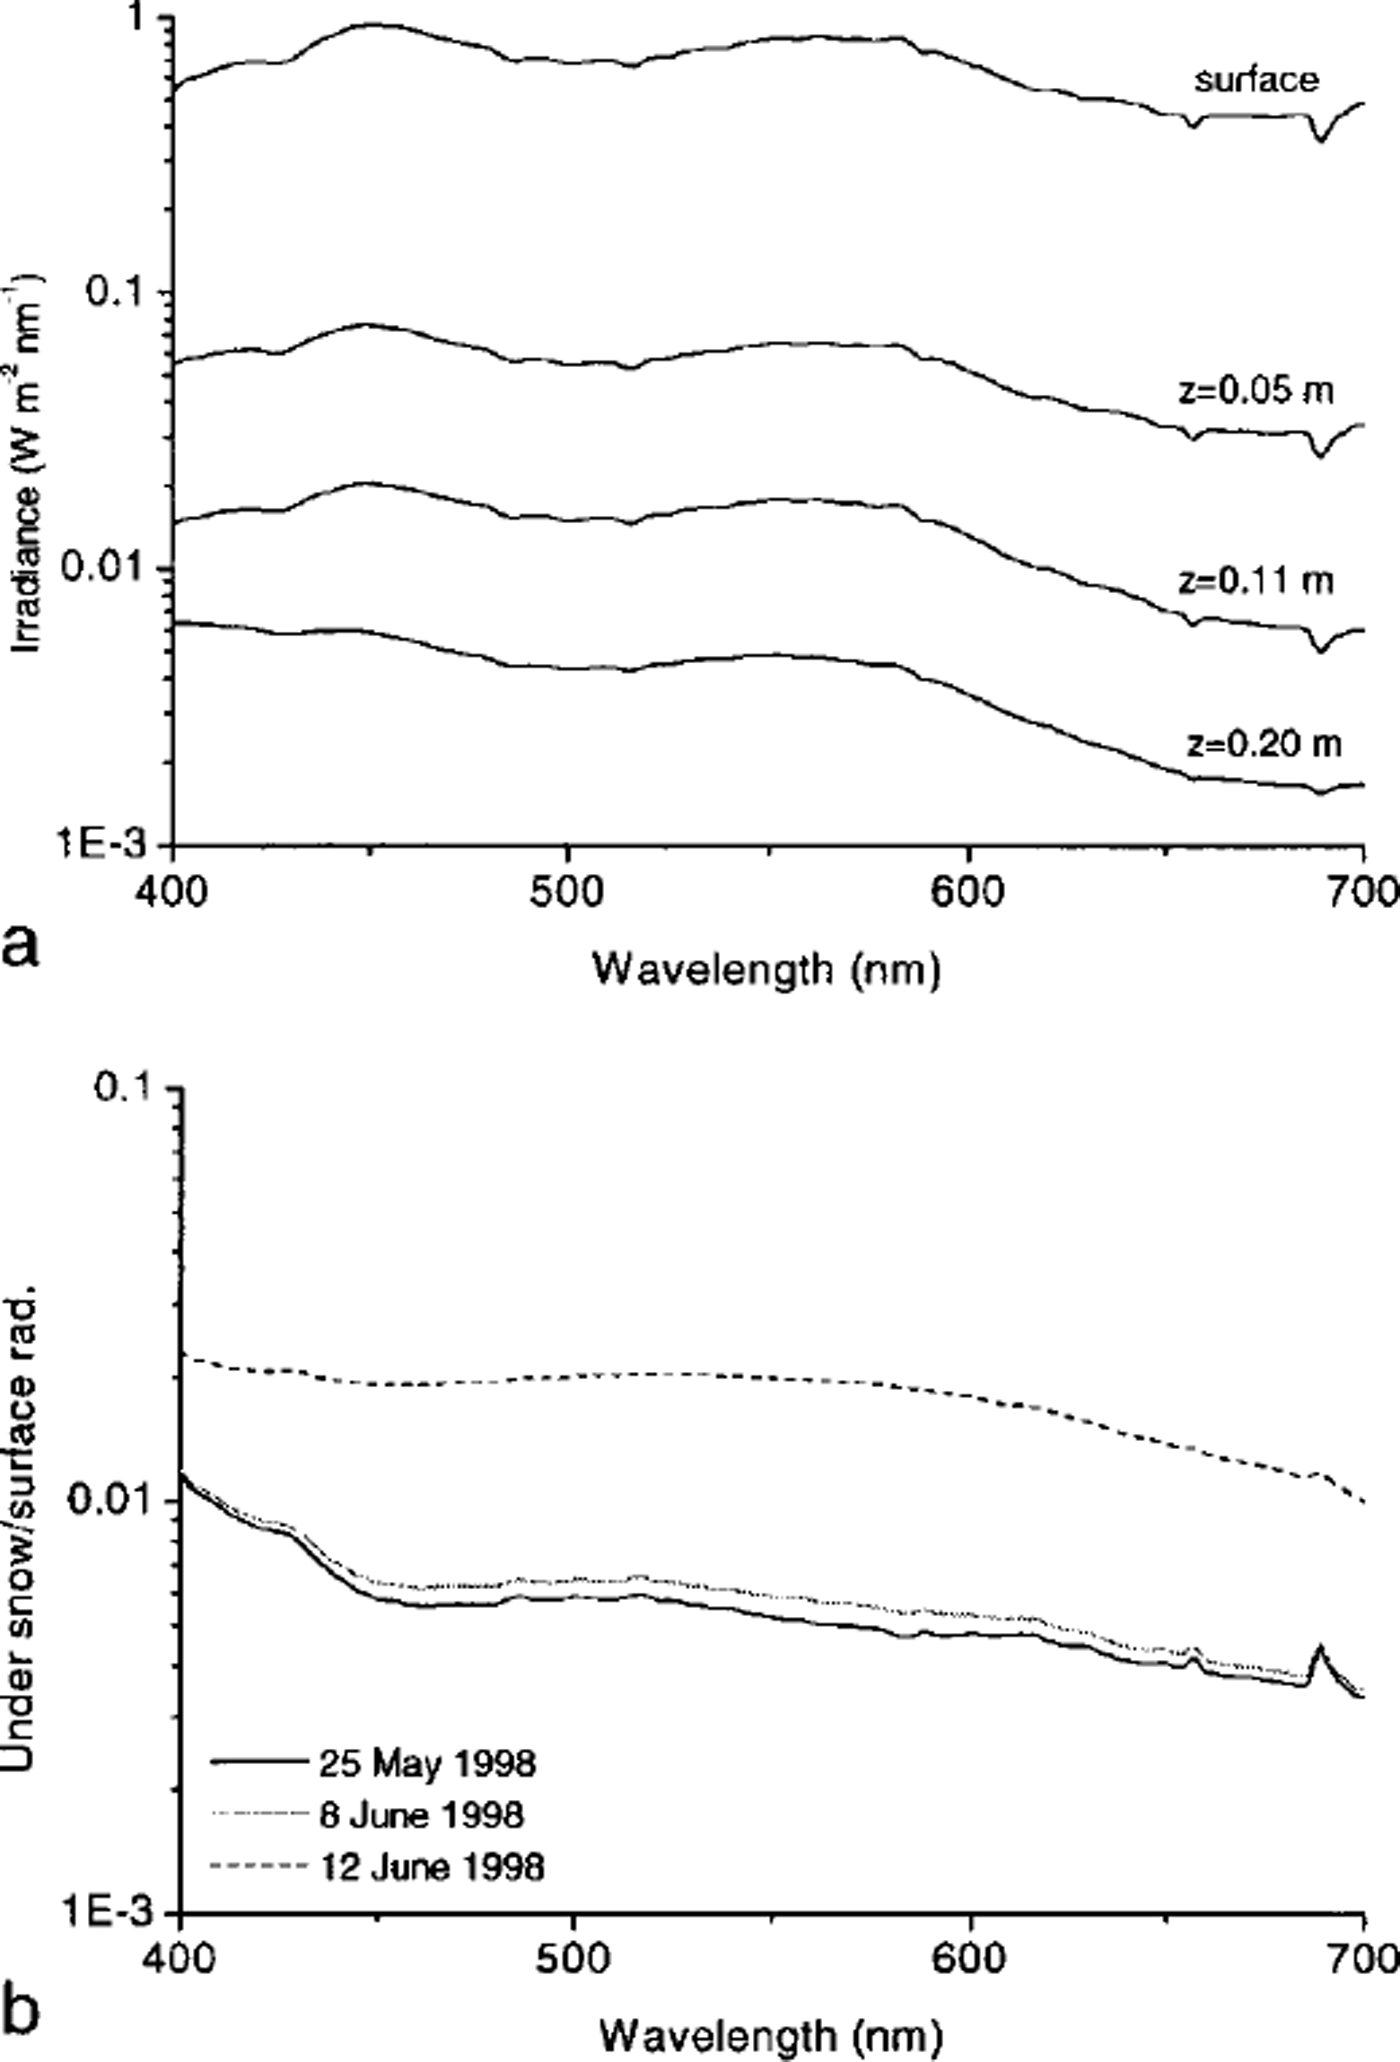
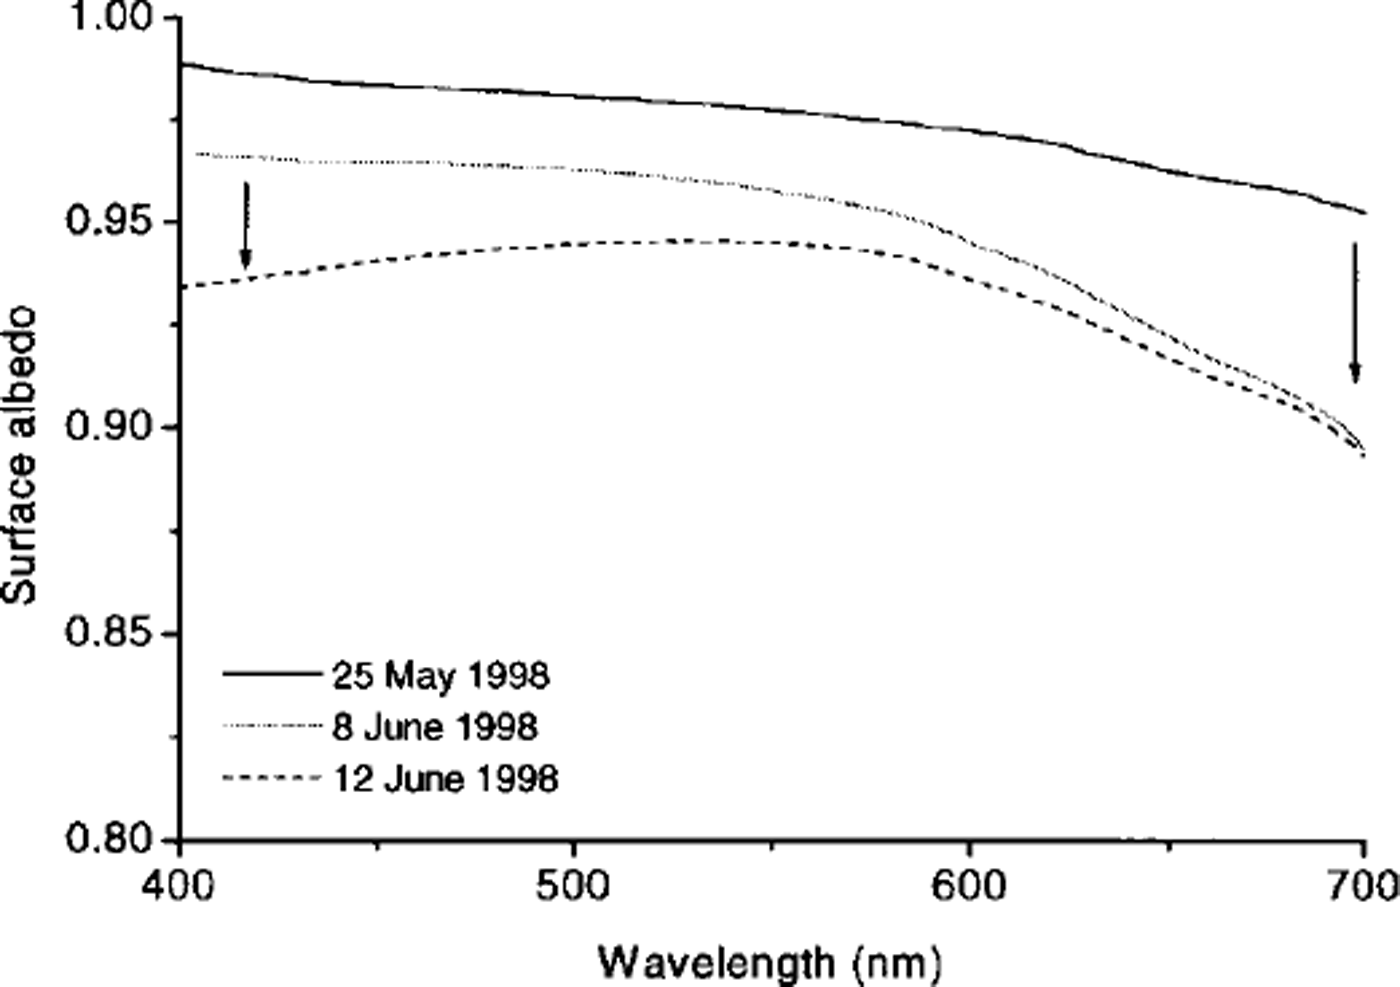
The total snow thickness at site B on 25 May was 0.54 m, and on 8 and 12 June it was 0.55 and 0.44 m, respectively. The last value indicates the effect of melt at that time. At the snow/soil interface, we met a patchy basal-ice layer with thicknesses of 0.02 m (25 May), 0.07 m (8 June) and 0.11 m (12 June). The predominant snow types on 25 May were II-B-l/2 (snow that had undergone equitemperature, destructive metamorphism, and was fine-grained (-1) or rounded (-2)) in the upper part of the snowpack, and III-A-1/2 (snow that had undergone temperature-gradient metamorphism, and had angular crystals (-1) and crystals with some layering (-2)) in the lower part. On 8 June there was already some higher metamorphosed snow (type IV-A) near the surface, indicating melt-freeze metamorphism. Maximum snow grain-sizes in thicker snow layers increased within that time from about 1 mm to 1.5 mm. Larger III-A grains, observed in the deeper layers on 25 May, were also observed on 8 June. On both dates, some ice layers a few centimeters thick were found, especially in the lowest 0.20 m of the snowpack. By 12 June, some of these ice layers vanished and snow grains as big as 3 mm were observed in a 60 mm thick layer about 0.1 m below the surface. Spectral measurements under snow give more information on how the radiation in the PAR range is attenuated according to certain wavelength bands (Fig. 4a and b). Measurements at different levels on 8 June (Fig. 4a) show that, more or less independent of depth and snow type, all bands in the PAR range are attenuated by a similar amount. Focusing on attenuation at a fixed depth vs time (Fig. 4b) shows that the first days of melting (measurement at 8 June) did not significantly affect the transparency of snow. Later on (12 June), the snow is much more transparent than before, as it was also visible in the integrated PAR data from quantum-meter measurements. The spectral measurements resolve, in addition, that this change is less in the low-wavelength range (400–500 nm). Surface albedo measurements on the same days as the spectral under-snow observations in 1998 (Fig. 5) document the decrease in albedo with time. First, the biggest change occurred in the higher bands of ≥ 550 nm, then the lower wavelengths of ≤ 500 nm dropped significantly. Comparison with published results (e.g. Reference Warren and WiscombeWarren and Wiscombe, 1980) indicates that this change is likely to be due to impurities, such as dust, whereas the first change can be connected with changes in snow-crystal size (e.g. Reference Wiscombe and WarrenWiscombe and Warren, 1980). In general, the observed decrease in albedo due to snow changes in spring 1998 was less than in 1997 (see Reference GerlandGerland and others, 1999). In 1998, more precipitation events with fresh snowfall in early June increased the surface albedo, countering the effect of metamorphosis and aging. All three days when spectral measurements were taken were overcast, with diffuse light conditions.

Fig. 4. Measurements of spectral incoming radiation under snow in the PAR wavelength range, measured at site B. For all measurements the sky was 8/8cloud-covered (overcast conditions). (a) Spectra at the surface, and at three different depth levels under snow (0.05, 0.11 and 0.20 m), measured on 8 June 1998 The curves show that the spectral composition is little changed within the PAR range under these conditions. (b) Spectra of attenuated radiation under snow in the PAR wavelength range, measured on 25 May, 8 June and 12 June 1998 The measurement depth on the first two dates was 0.20 m, and on 12 June it was 0.19 m. This last curve was corrected so as to be comparable with the first two curves. The 12 June measurement shows more attenuation at wavelengths of <500nm, compared with the spectra measured earlier. This may be due to impurities in the surface snow layer. The glitch at 690 nm is probably a spectrometer-specific error.

Fig. 5. Spectral surface albedo for 25 May,8 June and 12 June 1998 measured at site B. The PAR wavelength range is shown. From 25 May to 8 June the largest decrease in albedo occurred at wavelengths above 550 nm (indicated by the arrow on the right side), whereas from 8 to 12 June albedo decreased most at wavelengths of <500nm (indicated by the arrow on the left side). The first change can be explained by increase of snow grain-sizes. The second change is probably due to impurities, blown in from already snow free tundra patches in the vicinity of the observation site. Spectral surface albedo in mid-June 1997 was significantly lower because melting started earlier and there was less snowfall in spring.
Discussion
Average PAR data measured under snow in 1998 confirm the 1997 data (Fig. 2). In addition, the 1998 data show the radiation attenuation shortly after the onset of melting: data measured between 3 and 8 June reflect ˚after-melt onset-conditions in the near-surface part of the snow (z < 0.1 m) and before-melt conditions in the deeper layers. Our recordings of snow temperature and density (Fig. 3) show that the significant changes connected to melting start in the upper part of the snowpack, because this part is more exposed to radiation and warm air masses than the deeper parts. On 10 June and afterwards, almost the entire snowpack where PAR measurements were obtained was isothermal (0°C) and the data are in good agreement with the model curve using a variable extinction coefficient (and smaller model input snow grain-sizes than observed; see results section above). The shift between 1997 and 1998 average PAR data before the onset of melt is likely to be due to the different time window when measurements were obtained. In 1997 most of the data were obtained further ahead of the onset of melting, whereas the 1998 data were measured just on the edge between cold and warm conditions (i.e. onset of melt). The overall scatter in the average PAR data can be explained by the fact that here data from both sites A and B are summarized. Furthermore, no distinction was applied regarding atmospheric conditions (overcast/clear skies). Since these determine whether the incoming direction of solar radiation is diffuse or directed, they also affect the ˚source signal". Treating the snowpack as an optical anisotropic medium, this may have consequences for the amount of radiation that penetrates the snowpack. Comparison between under-snow radiation measurements carried out under clear skies and under overcast conditions showed that diffuse light usually penetrates deeper into snow than direct solar radiation with relatively large zenith angles (60–70°). However, this effect is not as large and not in the same range as the effects due to changes occurring when going from a dry to a melting snowpack, and during the snowmelt period.
The extinction coefficients found for the model using a constant extinction coefficient are generally in good agreement with published values for extinction coefficients in snow (see, e.g., Reference MellorMellor, 1977). The discrepancy between observed snow grain-size and the (smaller) size that gave the best fit of the model curves using a variable extinction coefficient may indicate that geometric measures of subgrain-size structures within a snow grain and non-spherical forms are important for radiation attenuation in snow. Non-spherical shape and internal ˚arms" or ˚branches", being much smaller than the bulk dimensions of the grain, could contribute significantly to the scattering and attenuation of solar radiation (Reference Leroux, Lenoble, Brogniez, Hovenier and de HaanLeroux and others, 1998; Reference Grenfell and WarrenGrenfell and Warren, 1999). Reference Brandt and WarrenBrandt and Warren (1993) mention further that measurements with non-selective pyranometers, similar to the quantum meter that was used to measure the average PAR data discussed here, exaggerate the depth in snow at which radiation is absorbed.
As the spectral measurements showed, inclusions like dust or soil particles from surrounding, already snow-free tundra patches may work against the increase in snow transparency due to the melt-related increases in grain-size. The albedo measurements carried out on the same days as the spectral under-snow observations indicate the presence of dust or other particles on the snow surface. Thus, they support the assumption that particle inclusions are responsible for a smaller increase with time in lower bands than in higher bands of the PAR range (Fig. 4b). Usingjust average PAR data as shown in Figure 2, this may lead to misinterpretation of the factors that influence the penetration of PAR into the snow. The effect of grain-size increase might be underestimated, and the effect of particles in or on top of the snow might not be detected at all.
Conclusions
High-resolution monitoring of PAR under snow during spring in Svalbard resolved the changes of snow radiation properties as a function of depth and time. The applied two-stream model was able to produce attenuation-vs-depth curves showing both reasonable agreement and obvious discrepancy with average PAR radiation measurements. For the fixed-extinction coefficient case, the coefficients found were in good agreement with published results from others. Using a variable extinction coefficient, much smaller model-input grain diameters than observed had to be chosen in order to obtain satisfactory results. This can be explained by the presence of sub-grain-sized structures that are not accounted for by the model. Spectral under-snow measurements indicate that using only average PAR observation may lead to misinterpretation of the reasons for the changes in attenuation of solar radiation. To gain complete understanding of the key energy exchanges and processes occurring at the atmosphere-snow-soil interfaces, it is important to combine advanced high-resolution (in time and space) spectral measurements with an advanced radiation-snowpack model. Such a model would need to take into account non-spherical grain shapes, different angular distribution of solar radiation and the possibility of impurities in the snow.
Acknowledgements
We are grateful for fieldwork assistance from A. Blanco (University of Oulu, Finland) and O. G. Stoen (Norwegian Polar Institute). J. Boike (Alfred Wegener Institute, Potsdam, Germany), K. Sand (the University Courses on Svalbard (UNIS), Longyearbyen, Norway) and personnel from the Norwegian Polar Institute’s research station in Ny-Ålesund also supported the fieldwork. Constructive criticism by the reviewers J. Box and S. G. Warren helped to improve the paper. This work was performed under the project ˚Spectral Reflective Characteristics of Snow and Sea Ice" within the Arctic Light and Heat (ALV) Program, funded by the Norwegian Research Council and the Norwegian Polar Institute. This is Norwegian Polar Institute publication No. 349.


