The above paper was published with an incorrect image displayed for figure 5. The correct figure 5 is shown below.
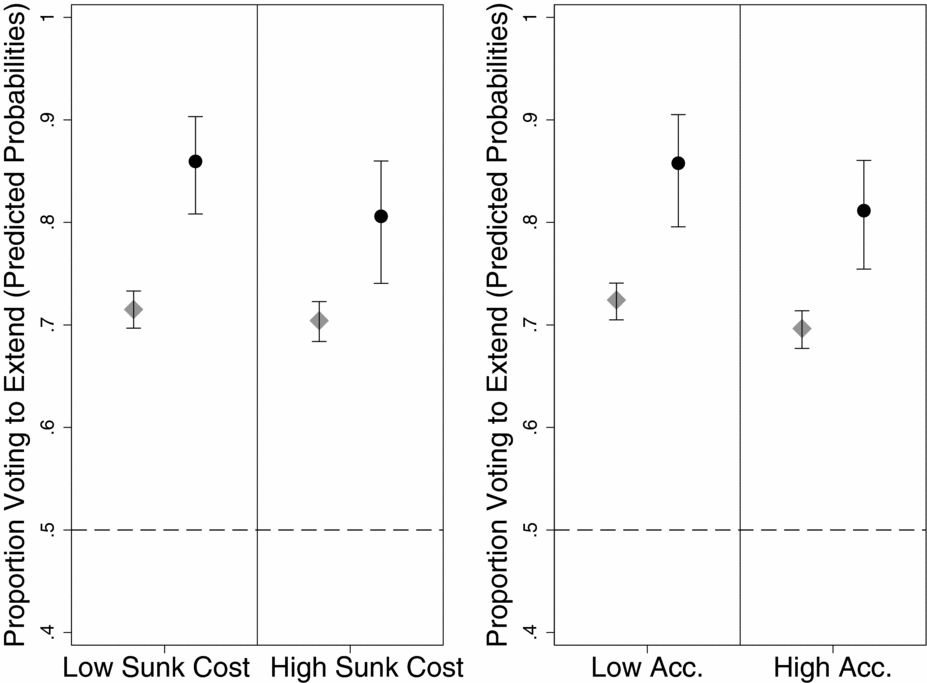
Notes: Left panel displays results by size of sunk cost. Low sunk cost—investment is short $50 million. High sunk cost—$200 million. Right panel displays results by low or high accountability condition. Circles denote politicians; diamonds, citizens. Values are predicted probabilities, obtained using Clarify. Bars are 95% confidence intervals. Citizens N = 4415, politicians N = 382.
FIGURE 5. Proportion of politicians and citizens voting to extend a small loan program in the sunk cost experiment, by experimental treatment.
The authors apologize for this error.


Comments
No Comments have been published for this article.