As animal production facilities decrease in number and expand in size, the potential for environmental and social externalities increases (Centner Reference Centner2003). Anaerobic digestion could reduce environmental and resource concerns regarding confined animal agriculture. An anaerobic digester processes manure under anaerobic conditions (without oxygen). Under anaerobic conditions, decomposition of organic waste by bacteria results primarily in carbon dioxide and methane, which can be burned to generate electricity (Tchobanoglous et al. Reference Tchobanoglous, Stensel, Tsuchihashi, Burton, Abu-Orf, Bowden and Pfrang2014). Recognizing the growing environmental concern surrounding large-scale, confined livestock production, the United States Department of Agriculture (USDA) in 2015 included anaerobic digesters in one of 10 building blocks for reducing greenhouse gas emissions and generating clean renewable energy. Through the “Livestock Partnerships” building block, the USDA planned to “support 500 new digesters over the next 10 years, as well as expand the use of covers on 10 percent of anaerobic lagoons used in dairy cattle and hog operations” (USDA 2015, p. 5).
Although digesters can reduce greenhouse gas (GHG) emissions, produce renewable electricity, and generate other value-added products such as pathogen-free animal bedding, large capital costs have typically made these systems economically infeasible (Kruger et al. Reference Kruger, Chen, MacConnell, Harrison, Shumway, Zhang, Oakley, Bishop, Frear, Davidson and Bowers2008, Lazarus and Rudstrom Reference Lazarus and Rudstrom2007, Stokes, Rajagopalan, and Stefanou Reference Stokes, Rajagopalan and Stefanou2008, Bishop and Shumway Reference Bishop and Shumway2009, Wang et al. Reference Wang, Thompson, Parsons, Rogers and Dunn2011, DeVuyst et al. Reference DeVuyst, Pryor, Lardy, Eide and Wiederholt2011). However, along with the approximately 238 digesters operating in the United States at the time of this survey, 31 digesters were under construction on commercial livestock farms in 2013, and 17 new projects were underway in 2014 (U.S. Environmental Protection Agency (USEPA) 2014b). Because previous studies have found that digesters are not economically feasible for most animal feeding operations, why do some operations continue to adopt this technology?
Previous case studies of operational digesters show renewable energy policies and government grants contribute to the economic feasibility of anaerobic digestion systems (Lazarus and Rudstrom Reference Lazarus and Rudstrom2007, Stokes, Rajagopalan, and Stefanou Reference Stokes, Rajagopalan and Stefanou2008, Bishop and Shumway Reference Bishop and Shumway2009, Gloy and Dressler Reference Gloy and Dressler2010, Wang et al. Reference Wang, Thompson, Parsons, Rogers and Dunn2011, DeVuyst et al. Reference DeVuyst, Pryor, Lardy, Eide and Wiederholt2011). These policies are often adopted by states to support greater investment in and adoption of renewable energy technologies (USEPA 2014c). If the policy goal is greater adoption via voluntary programs and initiatives, then a better understanding of anaerobic digester adopter motivation and behavior is important.
Along with government policies, one hypothesis for why anaerobic digesters are adopted is that the decision to adopt is not purely financial. As Rogers (Reference Rogers2003) describes, explaining the diffusion of innovations, differences in adoption are described by differences in the agents’ “character,” or beliefs, rather than by differences in their circumstances. Thus, adoption of an anaerobic digester could be driven by aspects of a producer's worldview, such as environmental beliefs (e.g., Bishop, Shumway, and Wandschneider 2010). Other behavioral drivers, such as peer-group influence, could also affect anaerobic digester adoption rates (Baerenklau Reference Baerenklau2005).
The objective of this study is to determine the effect of government policies, co-product prices, peer group influence, farm characteristics, and farmer demographics and beliefs on producers’ decisions to adopt anaerobic digestion technology on animal feeding operations (AFOs). The objective was accomplished using a unique dataset from a nationwide survey of dairy and hog producers. Producers were asked a series of questions about their farms, their opinions of and experiences with different policies, and their willingness to accept an anaerobic digester based on policy scenarios that were developed following contingent valuation methodology. Following data collection, separate models were estimated for adopters (probit) and nonadopters (bivariate probit with sample selection).
Most previous research analyzed the economic feasibility of one or several anaerobic digesters using economic budgeting or real option analysis. Few studies exist that contribute to the understanding of anaerobic digestion (or other manure management) technology adoption, and the available studies only cover one state or region, and focus on the dairy industry (e.g., Poe et al. Reference Poe, Bills, Bellows, Crosscombe, Koelsch, Kreher and Wright2001, Bishop, Shumway, and Wandschneider Reference Bishop, Shumway and Wadschneider2010, Sanders et al. Reference Sanders, Roberts, Ernst and Thraen2010).
This study expands on previous research by surveying all USDA National Agricultural Statistics Service (NASS) dairy and swine estimation states (see Figure 1 for reference). Previous research has reported on the technical feasibility of anaerobic digesters on hog farms, but little is known about the economic considerations involved with adopting this technology or about the opinions of swine producers concerning anaerobic digestion (e.g., Ndegwa et al. Reference Ndegwa, Hamilton, Lalman and Cumba2008, Massé, Rajagopal, and Singh Reference Massé, Rajagopal and Singh2014). Unlike the other cited studies, we use a discrete choice nonmarket valuation method to estimate producer willingness-to-accept an anaerobic digester under different policy conditions. It is also the first study using data on perceptions of anaerobic digestion from dairy and hog producers on a nationwide scale. Further, this study is unique in that it presents results from a survey given to producers who currently operate or previously operated anaerobic digesters and to producers who do not use anaerobic digestion systems for manure management.
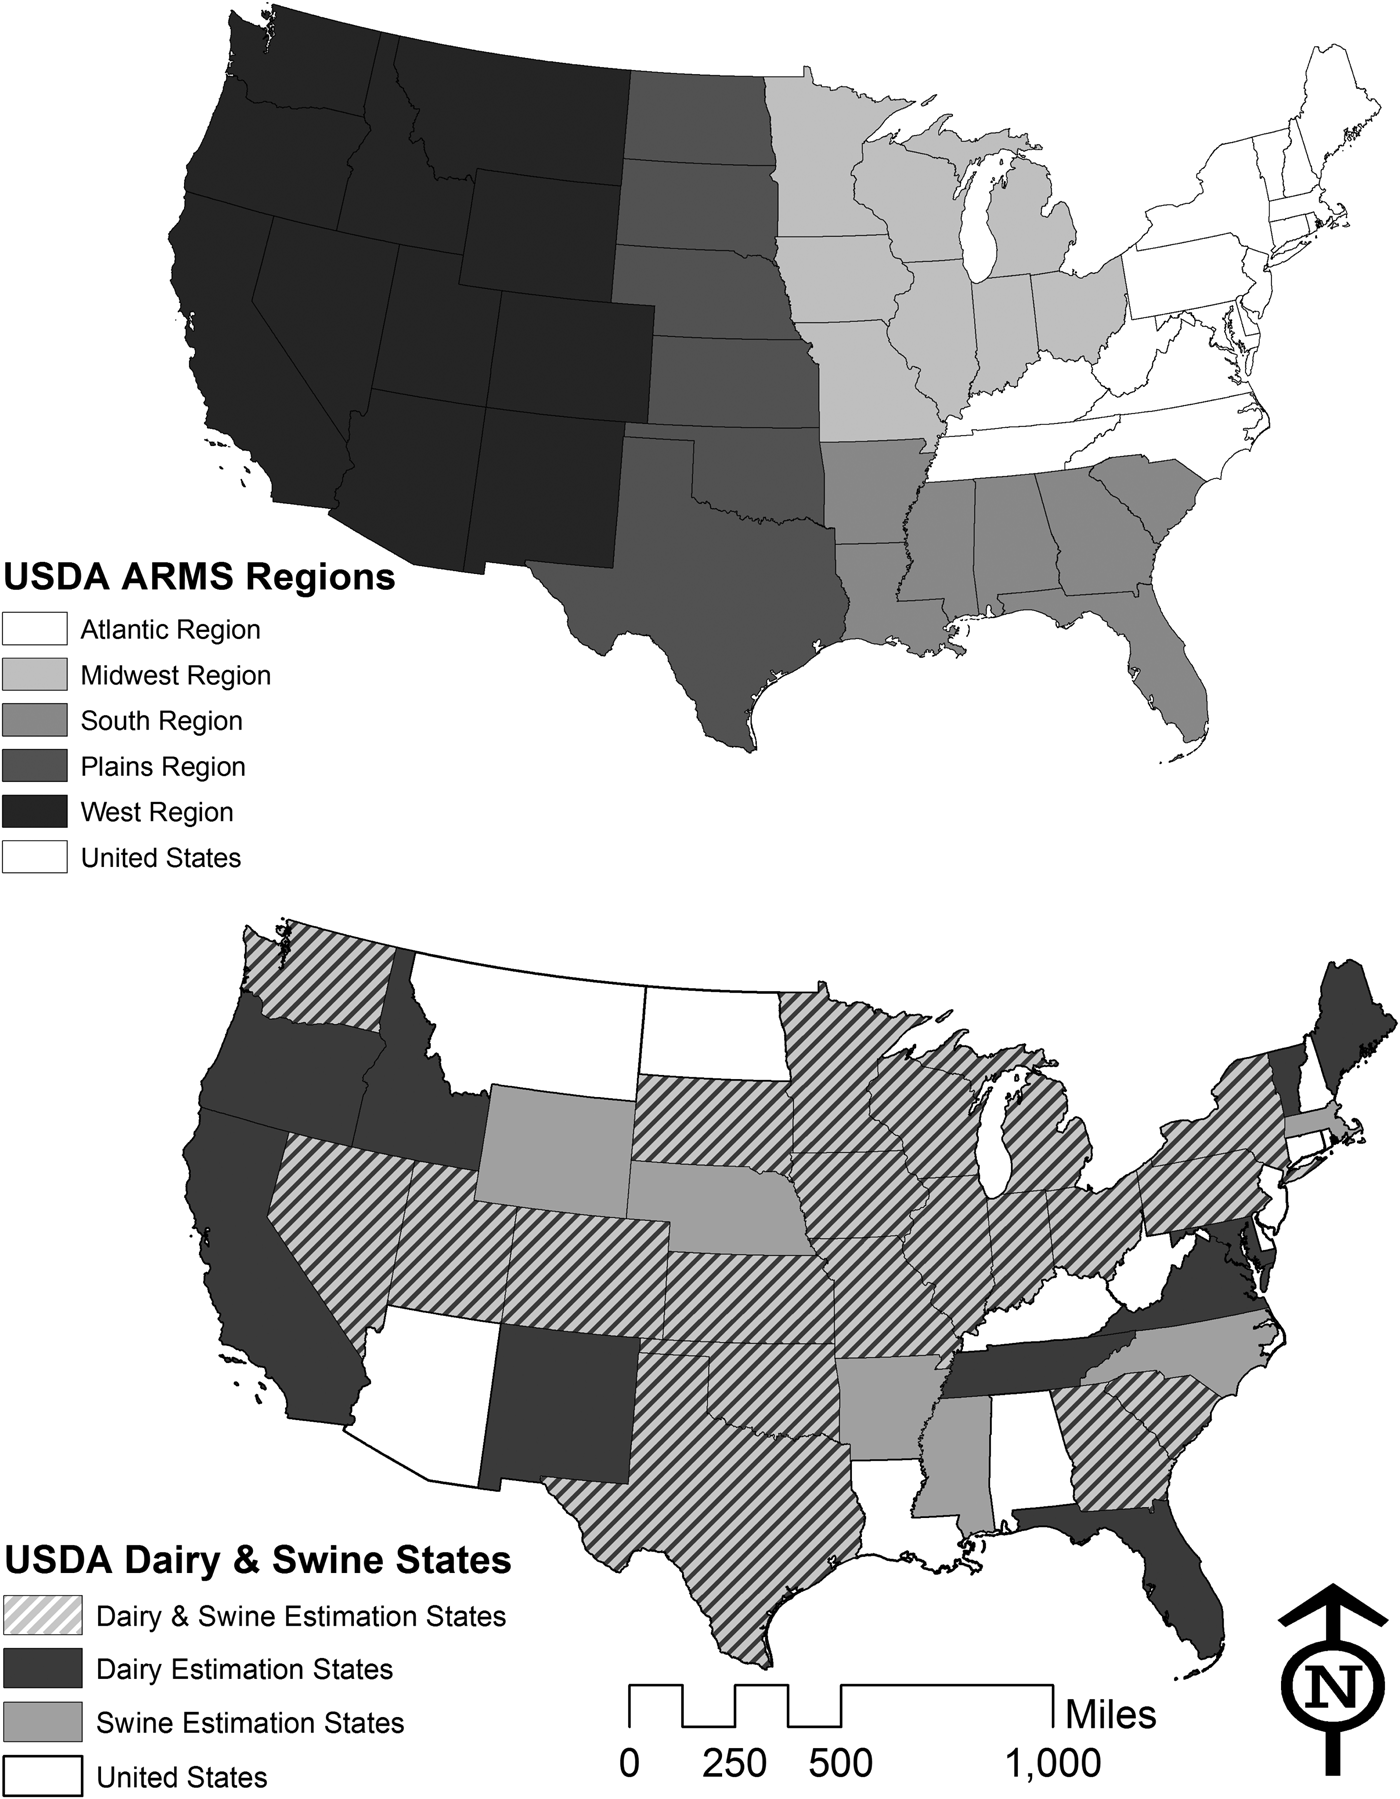
Figure 1. Schematic of states included in this study and their respective regions
Theory
From the assumptions of random utility theory, a farmer maximizes expected utility of profit. A farmer is willing to accept $P to switch to a new production practice (e.g., adopting anaerobic digestion for manure management) if the farmer's utility with the new practice and incentive payment is at least as great as it was before the offer was made. Let U A(π) represent the expected utility of profit from adopting an anaerobic digester and U B(π) represent the expected utility from not adopting. If we define U*(π) = U A(π) − U B(π), the observed choice equals 1 if U*(π) >0 and 0 if U*(π) ≤ 0. Therefore, the choice selection reveals which one provides the greater utility but does not disclose the unobservable utilities. A common specification of the random utility model is
where x is the observable vector of exogenous explanatory variables, and ![]() $ \varepsilon \sim N\left({\mu_\varepsilon, \sigma_\varepsilon} \right) $ is a random error term that represents the stochastic elements that are specific to and known only by the individual, but not by the observer (Greene Reference Greene2012). If the producer's choice of adopting a digester (alternative A) is denoted by Y = 1, then we infer that U*(π) >0 and can complete the model because the observed outcome is determined by variables in the utility functions.
$ \varepsilon \sim N\left({\mu_\varepsilon, \sigma_\varepsilon} \right) $ is a random error term that represents the stochastic elements that are specific to and known only by the individual, but not by the observer (Greene Reference Greene2012). If the producer's choice of adopting a digester (alternative A) is denoted by Y = 1, then we infer that U*(π) >0 and can complete the model because the observed outcome is determined by variables in the utility functions.
Previous studies on the economics of anaerobic digesters indicate that anaerobic digesters are typically not profitable even with subsides (Lazarus and Rudstrom Reference Lazarus and Rudstrom2007, Kruger et al. Reference Kruger, Chen, MacConnell, Harrison, Shumway, Zhang, Oakley, Bishop, Frear, Davidson and Bowers2008, Stokes, Rajagopalan, and Stefanou Reference Stokes, Rajagopalan and Stefanou2008, Bishop and Shumway Reference Bishop and Shumway2009, Wang et al. Reference Wang, Thompson, Parsons, Rogers and Dunn2011, DeVuyst et al. Reference DeVuyst, Pryor, Lardy, Eide and Wiederholt2011). Yet, at least 48 anaerobic digesters were adopted on commercial livestock farms over 2012–2013 (USEPA 2014b). According to Nowak (Reference Nowak1987) and Bishop, Shumway, and Wandschneider (Reference Bishop, Shumway and Wadschneider2010), economic models do not always explain nonadoption of profitable technologies or adoption of unprofitable technologies. Chouinard et al. (Reference Chouinard, Paterson, Wandschneider and Ohler2008, p. 79) found support for the hypothesis that some producers make decisions based in part on “unobservable characteristics of the land stewardship process” and are willing to pay (or forgo profit) for conservation.
Other than potential revenues, producers may be interested in adopting anaerobic digesters because of the environmental and social benefits. Within the anaerobic digestion process, microbial processes produce heat that reduces pathogens in the waste stream, which allows the separated solids to be used as value-added co-products such as animal bedding. Anaerobic digesters can be equipped to remove and concentrate nutrients. This prevents nutrients from entering water bodies and provides a more concentrated fertilizer. Anaerobic digesters also reduce odor by stabilizing the volatile organic acids in the manure so that they do not volatilize as odors during land application. According to Kramer (2004), a majority of anaerobic digester owners in the Great Lakes states mentioned odor reduction as an important benefit of their digestion system. Although difficult to quantify, odor reduction from an anaerobic digester could benefit livestock operations in a number of ways, including improved quality of life, reduced likelihood of nuisance lawsuits or complaints, and more flexibility when field-applying manure.
USEPA (2014a) argues the agriculture sector is responsible for 8.1 percent of all greenhouse gas emissions, and enteric fermentation and manure management account for 25 percent and 9.4 percent of agricultural methane emissions, respectively. Anaerobic digestion of livestock manure reduces greenhouse gas emissions by collecting and combusting methane. Methane is 21 times more potent as a greenhouse gas than carbon dioxide (IPCC 1996). Combusting methane can generate heat and electricity for an agricultural operation while emitting only carbon dioxide and water vapor. Some environmental effects could enter the profit function as private costs or revenues (e.g., carbon trading), while others do not (e.g., reduced odor).
Bishop, Shumway, and Wandschneider (Reference Bishop, Shumway and Wadschneider2010, p. 588) provide an example where an agent's utility is expanded to include “direct well-being effects from nonmarket goods and services” resulting from the environmental consequences of anaerobic digestion. A version of this utility function can be written as
where e is an environmental effect. Including an environmental effect in (2) assumes that producers’ indifference curves reflect a “profit-environment trade-off” and that their decisions could be based on differences in beliefs or motives rather than just differences in profit (Bishop, Shumway, and Wandschneider Reference Bishop, Shumway and Wadschneider2010, p. 588).
While environmental beliefs give one explanation of why anaerobic digesters are adopted, the literature on technology adoption provides additional explanation. Baerenklau (Reference Baerenklau2005) found that subjective beliefs, such as those attributed to peer-group influence or neighborhood effects, are important in the adoption decision. Anaerobic digestion technology is not reversible or transportable, so producers interested in this technology learn from others who have already adopted it. Baerenklau (Reference Baerenklau2005) describes this tendency to become more willing to adopt a technology after learning more about it from peers as a neighborhood effect. For example, the adoption of anaerobic digesters is more prevalent in some states than in others (Figure 2). Although spatial patterns of adoption could be due to the neighborhood effect, it could also be attributed to some states having more renewable energy financial incentives and regulatory policies than others, as shown in Figure 3.
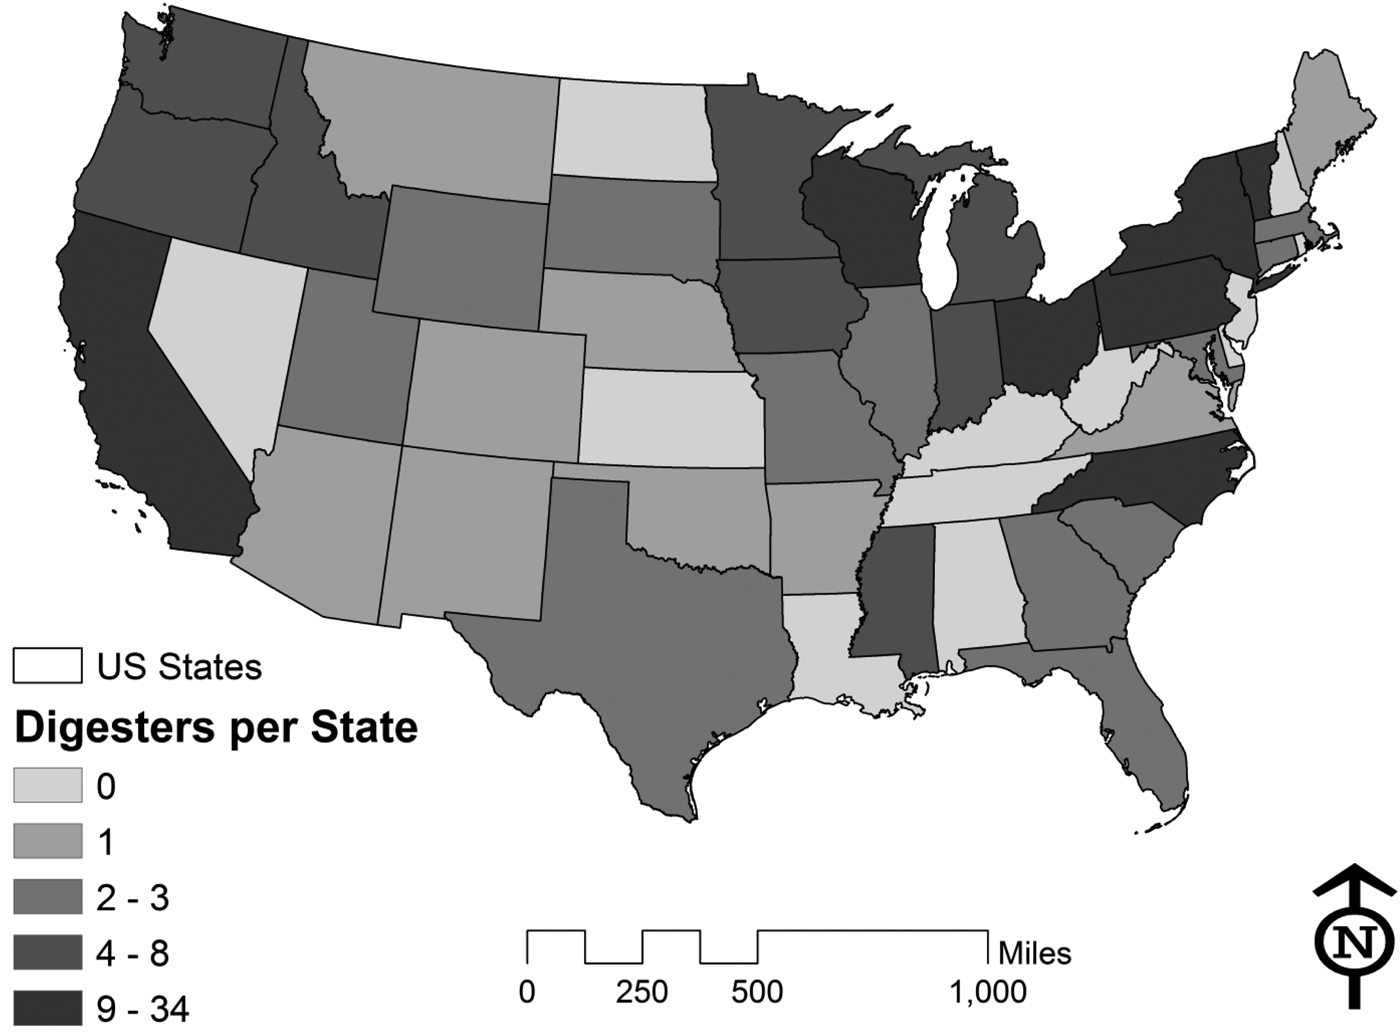
Figure 2. Number of digesters (on dairy or hog farms) in each state
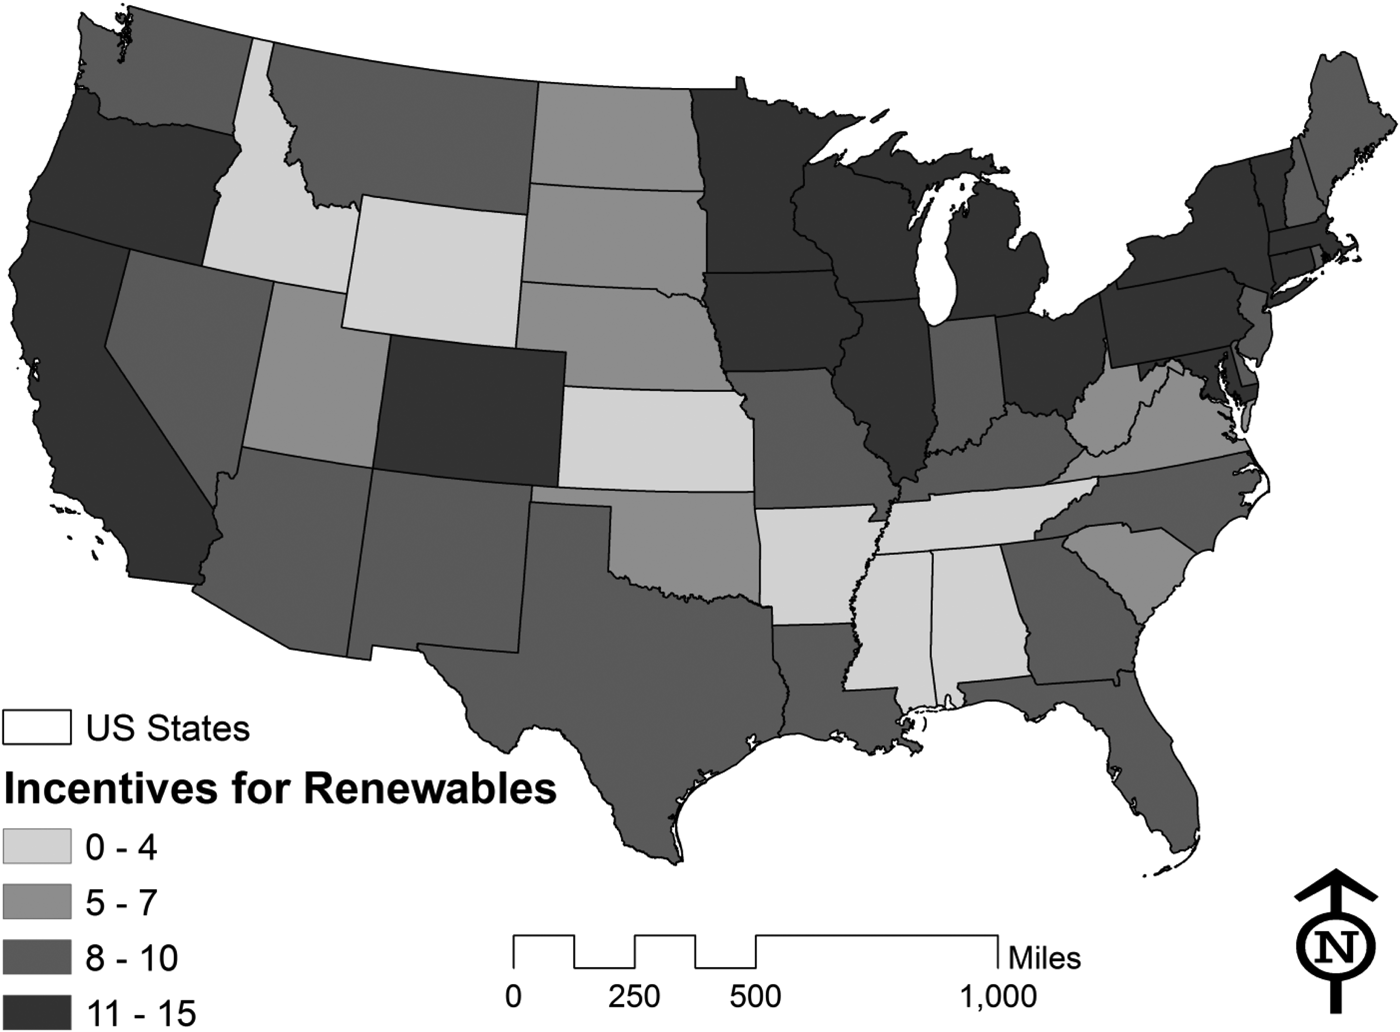
Figure 3. Number of financial incentives and regulatory policies that promote renewable energy in each U.S. state (USDOE 2014)
Farmers, policy makers, and researchers are interested in policies that affect the prices of renewable electricity and carbon credits, and previous research has shown that government grants are particularly important for anaerobic digester profitability (e.g., Lazarus and Rudstrom Reference Lazarus and Rudstrom2007, Stokes, Rajagopalan, and Stefanou Reference Stokes, Rajagopalan and Stefanou2008, Bishop and Shumway Reference Bishop and Shumway2009, Gloy and Dressler Reference Gloy and Dressler2010). Selling renewable electricity and carbon credits and receiving government grants contribute to a producer's income. However, the source of the income could matter because an individual's utility could differ depending on the policy scenario that he or she faces.
Hawkins and Wallace (Reference Hawkins and Wallace2006) describe how types of income affect demand because individuals attach psychic and transaction costs to goods. According to Moore (Reference Moore1945), industry stakeholders are not only concerned about a company's income. Stakeholders also want to know the source of the income. In the context of this study, one producer may adopt an anaerobic digester if given government grants, while another might refuse government grants and only consider adoption if the digester can pay for itself.
Background: Policies for Renewable Energy Technology Adoption
Several state policies support renewable energy generation, including renewable portfolio standards (RPS), interconnection standards, net metering, feed-in tariffs, and other financial incentives such as grants, loans, rebates, and tax credits (USEPA 2014c). According to the Database of State Incentives for Renewables & Efficiency (DESIRE), 29 states, Washington DC, and two U.S. territories have an RPS in place. An additional eight states and two territories have renewable portfolio goals (RPGs) (USDOE 2014). Renewable portfolio standards aim to jump-start markets for renewable energy technologies by requiring electric utilities to provide a certain percentage of electricity from renewable resources.
Interconnection standards establish uniform processes and technical requirements for connecting renewable energy sources to the electric grid. As of February 2013, 43 states and Washington DC had an interconnection policy (USDOE 2014). Net metering and feed-in tariffs ensure renewable energy producers are compensated. With net metering, when electricity produced exceeds the producer's needs, a credit is given that can be used later.
Feed-in tariffs are pre-established premium rates for renewable power fed into the grid. Approximately 22 states and two territories offer grant programs for renewable energy infrastructure. These grants can be offered by states, local governments, local utilities, private programs, or can be made up of a combination of sources.
Carbon credits are another potential income source of anaerobic digesters. From 2003 to 2010, the Chicago Climate Exchange (CCX) provided trading of carbon credits. The final average settlement price was $0.05/MT, and the highest average settlement price in the existence of the CCX was $7.40/MT in June 2008. On the world market, countries that signed and ratified the Kyoto Protocol have access to world carbon trading markets, such as the European Climate Exchange (ECX). As of May 2014, carbon was trading on the ECX for $5.12/MT.
In 2006 the State of California passed the Global Warming Solutions Act (AB 32), which requires the state board to “adopt a statewide greenhouse gas emissions limit equivalent to the statewide greenhouse gas emissions levels in 1990 to be achieved by 2020” (California State Assembly 2006). The state's cap-and-trade program is the primary mechanism used to achieve this reduction. Supply-and-demand models of the carbon offset market forecast trading at around $10 to $15/MT (Borenstein et al. Reference Borenstein, Bushnell, Wolak and Zaragoza-Watkins2014).
In 2010 the Obama administration issued Executive Order 12866, which proposed a new “social cost of carbon.” The U.S. Government (2013, 2016) used three integrated assessment models that included changes in agricultural productivity, human health, property damages from increased flood risk, and the value of ecosystem services due to climate change to estimate an average SCC. In May 2013, the SCC was set at $36/MT, up from the $24/MT SCC in 2010.
Data
The population sampled comprised commercial dairy operations and breeding and market hog operations in the United States. The survey population was split into four categories: 1) dairy and hog animal feeding operations (AFOs) with operational anaerobic digestion systems, 2) dairy and hog AFOs with decommissioned (or shutdown) anaerobic digestion systems, 3) dairy and hog AFOs that do not have anaerobic digestion systems, and 4) third-party operators of anaerobic digestion systems that process manure generated at dairy and hog operations.
According to the USEPA AgSTAR program, there were 238 operational digesters (on 193 dairy, 31 hog, and 14 other) and 45 decommissioned digesters (31 dairy, seven hog, and seven other) in the United States when the survey was conducted (USEPA 2014b). Random samples of dairy and swine AFOs with no anaerobic digestion system were pulled from the NASS Estimation Program for dairy and swine. States that did not have a single hog or dairy farm that operated an anaerobic digester were excluded. Figure 1 shows the states included. Each of these states was in the NASS Estimation Program for the commodities of interest and contained at least one anaerobic digester. For data analysis, the states were aggregated into regions from the USDA NASS Agricultural Resource Management Survey (ARMS).
Data were from a nationwide survey of dairy and swine producers between December 2013 and May 2014. Prior to survey launch, a pretest with two anaerobic digester operators (one agricultural/professional engineer and one environmental health and safety manager for a hog farm) and one USDA NASS official indicated slight modifications to the survey instrument.
Because the population of farms with operational or shutdown digesters was small, the goal was to survey the entire population. However, some operations were on a “do not contact” list with USDA NASS. Therefore, the sample of operations with digesters was slightly smaller than the actual population. Of the surveys mailed to current and previous digester operators, only one was returned as out-of-scope due to retirement, death, sale, or restructuring, and three were incomplete. The resulting response rate for digester operators was almost 30 percent. Because only six viable surveys were returned from operations with shutdown digesters, these responses were grouped together with the operational digester responses. This aggregated group represents farms with experience operating anaerobic digesters.
Animal feeding operations that do not have anaerobic digesters were randomly selected by USDA NASS. Digesters are typically on large operations, so the sample of operations with no digester was restricted to dairy operations with 100 head or greater and hog operations with 1,000 head or greater. The Oklahoma NASS office sorted the sampling population by size and selected a systematic random sample. The sample of operations with no digester covered the full range of farm size that was similar to the sample of operations that operated digesters.
According to USDA NASS representatives, most agricultural surveys of this nature can anticipate a response rate of about 10 percent to 20 percent. In order to net the desired number of responses from operations that do not operate digesters, a sample size of 2,500 was set. Of the 2,500 surveys distributed for farms with no digester, 62 were returned as undeliverable or out-of-scope (i.e., the respondent was retired, deceased, or no longer raising livestock). The resulting overall sample size for operations with no digester is shown in Table 1, with a response rate of just over 10 percent.
Table 1. Sampling Statistics
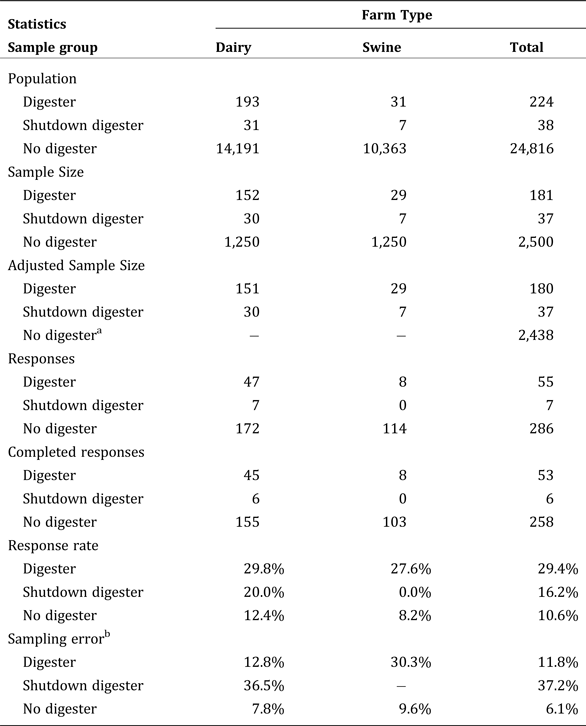
a Out-of-scope responses did not provide sequencing numbers
b Computed at 95% confidence level
Methods
Producers were asked three contingent valuation questions about adopting anaerobic digesters under various prices of electricity, prices of carbon credits, and percentages of capital costs covered by grants. Alternative nonmarket valuation strategies such as conjoint choice analysis and best-worst scaling would have required more than three questions, which would have decreased the response rate. The contingent valuation questions along with the farmer demographic and farm characteristic questions were deemed sufficient to accomplish the research objectives.
Contingent valuation has been widely used to determine consumer willingness-to-pay for agricultural products, but it has also been useful in eliciting producer utility under certain economic, political, and/or technological scenarios. Most previous studies sought to determine how policy incentives and/or farm characteristics influence a producer's decision to adopt a new technology or conservation practice. For example, Poe et al. (Reference Poe, Bills, Bellows, Crosscombe, Koelsch, Kreher and Wright2001) used contingent valuation to predict participation in comprehensive nutrient management plans (CNMPs) on New York dairy farms. Cooper and Keim (Reference Cooper and Keim1996) used contingent valuation data to estimate a bivariate probit model with sample selection and a double hurdle model to predict farmer adoption of water quality protection practices as a function of Water Quality Incentive Program (WQIP) payments. More recent studies used contingent valuation to determine willingness to pay or accept agricultural technologies such as precision agriculture, biotechnology crops, disease prevention in livestock, best management practices (BMPs), and greenhouse gas (GHG) reduction mechanisms (e.g., Thompson Reference Thompson2012, Holt Reference Holt2013, Taneja et al. Reference Taneja, Pal, Joshi, Aggarwal and Tyagi2014).
Two contingent valuation questions were constructed to elicit the price of electricity and the percent of the capital costs covered by government grants that would result in adopting an anaerobic digester. In addition, farmers typically find it difficult to capture any real economic benefit from emissions reduction. However, the Obama Administration's development of the “social cost of carbon” and the implementation of GHG trading markets in states such as California and Michigan have renewed interest in the possibility of trading carbon credits. Therefore, the third set of contingent valuation questions sought to determine the price of carbon at which the average producer in this study would be willing to accept an anaerobic digestion system.
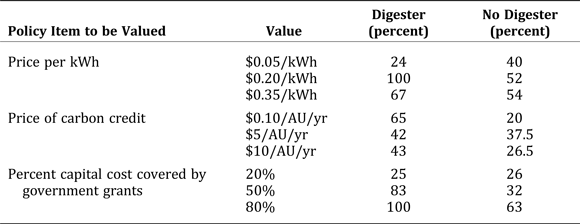
Using the contingent valuation method, producers were asked one question for each policy scenario. Three different contingent valuation questions were asked because it was assumed that a producer's utility could differ depending on the policy scenario. Producers could be concerned about the sources of income instead of just accepting that income will increase in all three scenarios. A dichotomous choice response format was selected. For each question, producers were asked to answer ‘Yes’ or ‘No’. Table 2 shows an example contingent valuation question. The underlined values for each question could be any of the values included in Table 3 and were randomly assigned with equal probability. Table 3 shows the policy variables of interest and levels included in the contingent valuation questions. Variable levels were chosen to cover likely ranges of WTA. Carbon credit prices are typically reported in $/megaton. However, because carbon trading is not common in the United States, carbon credit prices provided in the contingent valuation framework were given in $/animal unit/year.
Table 2. Example Set of Contingent Valuation Questions
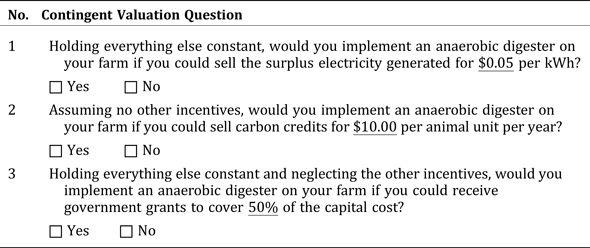
Table 3. Contingent Valuation Question Attributes, Levels, and Percent Willing to Accept at Each Level
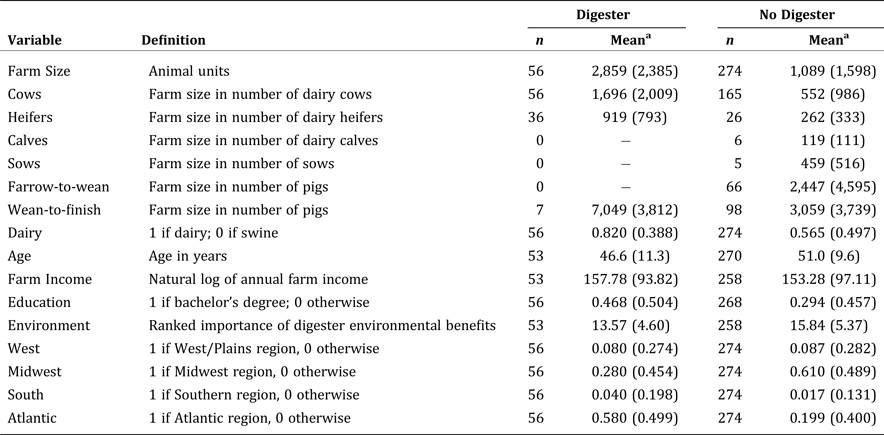
Along with the contingent valuation questions, producers were asked about personal demographics and farm characteristics. These explanatory variables, along with their sample mean and standard deviations are in Table 4. On average, farmers with operational or decommissioned digesters were younger, had slightly higher farm incomes, and were more highly educated than farmers without digesters. For both sample groups, respondents were primarily in the Midwest and Atlantic regions of the United States (see Figure 1 for reference).
Table 4. Characteristic Variables of Survey Respondents Used in Probit Models
a Standard deviation in parenthesis.
Respondents were asked to report farm size, or capacity, in terms of number of animals. Reported capacities in number of animals were converted to animal units (AU). An animal unit represents 1,000 pounds of live animal weight and serves as a common unit for combining different species of livestock. Animal unit conversions are based on the average mature animal weight of each livestock category. The conversion factor for milk cows was 1.4. The animal unit conversion for dairy heifers was 1.1, and the conversion factor for market or breeding hogs weighing more than 55 pounds was 0.4.
Producers who had never operated anaerobic digesters were asked the main factors that would influence their decision to adopt an anaerobic digester on their farm, while producers who currently or have operated anaerobic digesters were asked the main factors that influenced their decision to adopt an anaerobic digestion system. Three items that the producers were asked to rank were environmental stewardship and ecological sustainability, reduction of greenhouse gas (GHG) emissions, and odor reduction. The ranks of these three items were aggregated to generate a variable for relative importance of environmental benefits associated with an anaerobic digester. Table 4 shows that environmental benefits were ranked more important, on average, for producers who have operated anaerobic digesters than for producers who have not.
Probit models were estimated separately for each of the three contingent valuation questions. The probit model was specified as
 $$ \eqalign{& {\rm Prob}\left( {Y_{ij} = 1} \right) = {\rm \Phi }\left( {V_{ij}} \right) \cr & {\rm s}.{\rm t}.{\rm \; }V_{ij} = \beta _{0j} + \beta _{1j}P_{ij} + \beta _{2j}T_{ij} + \beta _{3j}N_{ij} + \beta _{4j}A_{ij} + \beta _{5j}I_{ij} \cr &\; + \beta _{6j}E_{ij} + \beta _{7j}ENV_{ij} + \beta _{8j}ATL_{ij} + \beta _{9j}MW_{ij} + \beta _{10j}W_{ij}} $$
where V ij is the ith owner/operator's indirect utility for adopting or not adopting an anaerobic digester, given the jth contingent valuation scenario, Y ij is a dichotomous choice dependent variable that equals 1 if the producer replied ‘yes’ to the anaerobic digester contingent valuation scenario and 0 otherwise, Φ is the standard normal cumulative distribution function (cdf), P ij is the price or percent embedded in the three contingent valuation questions (table 3), T ij is an indicator variable for dairy farms, N ij is the natural log of the size of the operation in animal units, A ij is the producer's age in years, I ij is the natural log of income generated by the farming operation, E ij is an indicator variable for whether the respondent had a college bachelor's degree or higher, ENV ij represents the relative importance of the environmental benefits associated with the digester, and ATL ij, MW ij, and W ij are indicator variables for the respondent's region (the ARMS Southern region was dropped).
After producers answered ‘No’ about whether their farm currently or previously operated an anaerobic digester, they were asked if they ever considered adopting an anaerobic digester? The variables affecting the likelihood that a producer will consider anaerobic digestion may differ from those affecting whether a producer actually adopts a digester. Variations of double hurdle models have been used in previous adoption studies such as Lambert et al. (Reference Lambert, English, Harper, Larkin, Larson, Mooney, Roberts, Velandia and Reeves2014) and Boyer et al. (Reference Boyer, Lambert, Velandia, English, Roberts, Larson, Larkin, Paudel and Reeves2016).
Therefore, a bivariate probit model with sample selection was specified as
 $$\eqalign{& {\rm Prob}\left( {z_{ij} = 1} \right) = {\rm \Phi }\left( {Z_{ij}} \right) \cr & Z_{ij} = \beta _{0j} + \beta _{1j}P_{ij} + \beta _{2j}T_{ij} + \beta _{3j}N_{ij} + \beta _{4j}A_{ij} \cr &\, + \beta _{5j}E_{ij} + \beta _{6j}ENV_{ij} + \beta _{7j}ATL_{ij} + \beta _{8j}MW_{ij},\; {\rm if}\; w_{ij} = 1,} $$
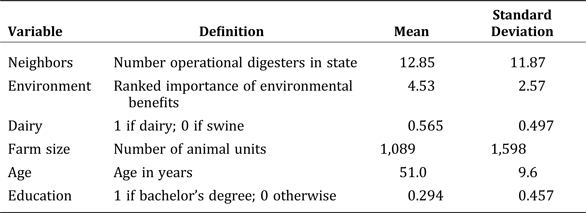
where W ij is the ith owner/operator's indirect utility for considering the adoption of an anaerobic digester, given the jth contingent valuation scenario, W ij is a dichotomous choice dependent variable and indicates whether the producer with no digester has ever considered an anaerobic digester, PEER ij is the natural log of the number of “neighbors” with operational digesters in the state where the producer resides and is used to estimate peer group influence, Z ij is the indirect utility of adopting or not adopting an anaerobic digestion system for the i th owner/operator who has considered anaerobic digestion for manure management, Z ij is a dichotomous choice dependent variable that is only observed when w ij = 1 and equals 1 if the producer replied ‘yes’ to the anaerobic digester contingent valuation scenario and 0 otherwise, and all other variables are as defined above. Variable means and standard deviations are provided in Table 5.
Table 5. Characteristic Variables of Survey Respondents Used in Bivariate Probit Models
For the first stage of the bivariate probit model with sample selection, the variable PEER ij is assumed to affect whether or not a producer will consider adopting an anaerobic digester. The larger the population of operational digesters (or number of neighbors) in a state, the more likely other producers are to have seen, heard about, or read something about the technology. This “tendency for an individual's behavior to be influenced by exposure to the behavior of his or her peers” is called the neighborhood effect (Baerenklau Reference Baerenklau2005, p. 1).
Willingness-to-accept was calculated as
 $$\overline {WTA_j} = - \bar P_j = - \displaystyle{\matrix{{\hat \beta }_{0j} + {\hat \beta }_{2j}{\bar T}_j + {\hat \beta }_{3j}{\bar N}_j + {\hat \beta }_{4j}{\bar A}_j + {\hat \beta }_{5j}{\bar I}_j + {\hat \beta }_{6j}{\bar E}_j \hfill \cr +\; {\hat \beta }_{7j}ENV_{ij} + {\hat \beta }_{8j}\overline {ATL} _j + {\hat \beta }_{9j}\overline {MW} _j + {\hat \beta }_{10j}{\bar W}_j \hfill} \over {{\hat \beta }_{1j}}} $$
where ![]() $ \overline {WTA_j} $ is the average policy payment the sample of producers is willing to accept for an anaerobic digester. Average WTA is calculated by setting (3) equal to zero and inserting sample means for the explanatory variables. We then solve for the average policy payment variable, the negative of which is equal to the average WTA.
$ \overline {WTA_j} $ is the average policy payment the sample of producers is willing to accept for an anaerobic digester. Average WTA is calculated by setting (3) equal to zero and inserting sample means for the explanatory variables. We then solve for the average policy payment variable, the negative of which is equal to the average WTA.
Results and Discussion
At the end of each survey, producers were asked an open-ended question regarding the one most important thing that would have to be done to encourage more widespread adoption of anaerobic digestion systems. Producers who currently operate anaerobic digesters had three main criteria: lower cost of construction, improved or continued support through government grants, and higher prices for co-products, especially electricity. Approximately 58 percent of respondents mentioned lower construction costs or increased government support through grants (which are typically tied to capital costs). Two of the main reasons producers adopted anaerobic digesters were to sell co-products and because they received government payments, grants, or tax credits for renewable energy.
Producers who do not currently operate anaerobic digesters were asked to rank the main reasons they do not have an anaerobic digestion system. The most common reason for not wanting to adopt a digester was that the producer believed the costs exceeded the benefits. The second most important reason for not wanting to adopt a digester was that the producer believed his or her operation was too small. Several respondents mentioned that one thing that would have to be done to encourage more widespread adoption of anaerobic digestion systems is to design systems for small farms, which work well and are economically feasible. We next address these issues more formally using the contingent valuation results.
Probit Models for Anaerobic Digester Adopters
Probit models of hypothetical adoption were estimated separately for producers who already operate digesters. Producers who had operated a digester were asked whether they thought other producers would adopt a digester under alternative scenarios. The parameter estimates of the probit models are presented in Table 6. The coefficient for percent capital cost covered by a government grant is statistically significant and positive, which indicates that an increase in grant funding increases the probability of adoption.
Table 6. Probit Estimates for Dairy and Hog Producers that Have Adopted a Digester
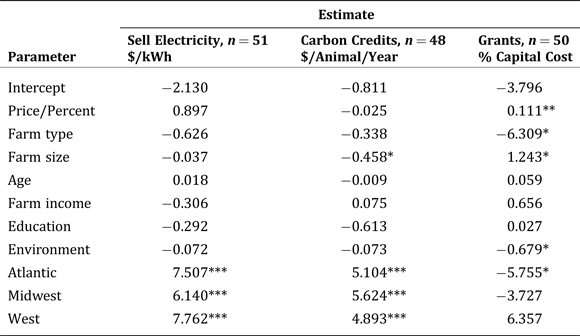
Note: Each equation includes a binary choice dependent variable, which equals 1 for ‘Yes’ and 0 for ‘No’ when producers were asked if other producers would adopt an anaerobic digester based on electricity price, carbon credit price, and percent capital cost covered by government grants (see Tables 2 and 3 for reference). For each parameter estimate, a positive number indicates greater likelihood of adoption, and vice versa.
***Significant at the α = 0.01 level
**Significant at the α = 0.05 level
*Significant at the α = 0.1 level
The positive and significant coefficient for percent government grants corresponds with previous literature that points to high capital costs as the reason anaerobic digesters are often economically infeasible and not more readily adopted (Lazarus and Rudstrom Reference Lazarus and Rudstrom2007, Kruger et al. Reference Kruger, Chen, MacConnell, Harrison, Shumway, Zhang, Oakley, Bishop, Frear, Davidson and Bowers2008, Stokes, Rajagopalan and Stefanou Reference Stokes, Rajagopalan and Stefanou2008, Bishop and Shumway Reference Bishop and Shumway2009, Wang et al. Reference Wang, Thompson, Parsons, Rogers and Dunn2011; DeVuyst et al. Reference DeVuyst, Pryor, Lardy, Eide and Wiederholt2011). Producers who have experience with anaerobic digesters may understand the challenges associated with the high capital costs of this technology.
The parameter estimates of electricity price and of carbon credits were not significant. These two questions may have generated less precise answers because producers likely have less experience with electricity prices and carbon credits. Producers may also prefer government grants, because they are assuming less risk under that scenario.
The coefficient estimate for the dairy farm indicator variable was negative and significant in the government grants scenario. The negative sign attached to the variable for dairy farm indicates that swine producers may be more likely to adopt an anaerobic digester or think that other producers will adopt an anaerobic digester when government grants are considered.
Parameter estimates for farm size were positive and significant in probit models for government grants (Table 6). This suggests that as farm size increases, the likelihood of a producer adopting an anaerobic digester under a government grant scenario also increases. However, under carbon credits, the probability of adoption declines with farm size, highlighting the importance of additional revenue streams (outside of direct government subsidies) for small farms when considering adoption of an anaerobic digester.
Coefficients of the variable for ranked relative importance of environmental benefits associated with an anaerobic digester were negative for all models, but only statistically significant in the government grants scenario. The negative sign on the parameter estimate for environmental benefits infers that producers who gave a higher rank, therefore a higher importance, to environmental factors are more likely to think that other producers will adopt the technology. These results support the theory that environmental effects contribute to the heterogeneity of producers’ motives for adopting anaerobic digesters (Bishop, Shumway, and Wandschneider Reference Bishop, Shumway and Wadschneider2010). Producers’ decisions could be based on differences in environmental beliefs rather than just differences in profit.
Under scenarios for selling electricity and carbon credits, producers who operate digesters in the Atlantic, Midwest, and Western regions are more likely to think other producers will adopt digesters than their counterparts in the Southern region. This could be partially due to the number and type of renewable energy policies available in each of these regions. The U.S. Department of Energy maintains a Database of State Incentives for Renewables & Efficiency (DSIRE), which lists 14 different financial incentives and regulatory policies that promote renewable energy. Some of the incentives and regulations are listed at the state and/or local level.
Data from DSIRE was aggregated to create Figure 3. A state received one point for a statewide policy and one point for each additional local policy. Only policies dealing with renewable electricity production, GHG emission offsets, and grants were considered. These policies are more prevalent in the upper Atlantic, Midwest, and West regions. Producers who currently operate anaerobic digesters are likely aware of any renewable energy incentives in their states. Producers residing in states with a higher saturation of renewable energy incentives and regulations could be more likely to think that other producers will adopt anaerobic digesters.
Bivariate Probit Models with Sample Selection for Nonadopters
Producers not currently operating a digester were asked about whether or not they would adopt a digester under the alternative scenarios. Results from the estimation of the bivariate probit models with sample selection are provided in Table 7. In the first-stage models, which estimated the probability of whether or not a producer would consider adopting an anaerobic digester, variables for peer influence, farm type, and farm size were positive and significant. Larger dairy farms are more likely to consider adopting anaerobic digestion systems. As expected, some producers thought that their farms were too small to consider an anaerobic digester, and this was reflected in the estimates of the first stage of the bivariate probit model.
Table 7. Bivariate Probit with Sample Selection Estimates for Nonadopters
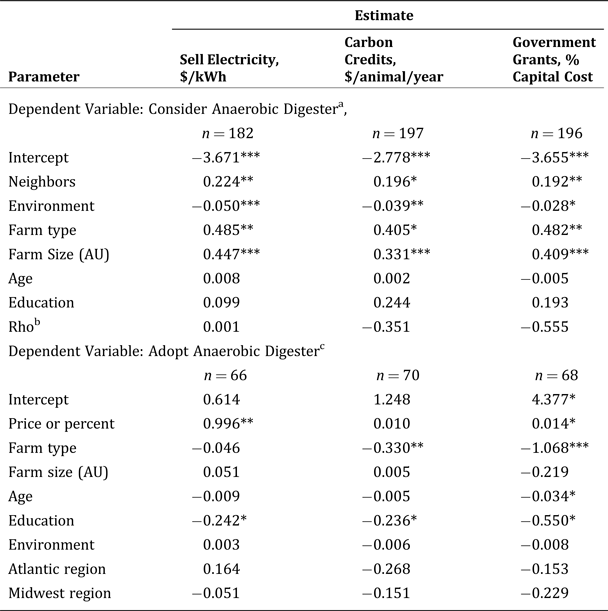
Note: For this model, it is assumed that we observe whether a producer will adopt an anaerobic digester only after they have considered implementing an anaerobic digester on his or her farm.
a Binary dependent variable, which equals 1 if the producer answered ‘Yes’ and 0 if the producer answered ‘No’ to the question: “Have you ever considered implementing an anaerobic digester on your farm?”
b Rho is ρ = corr(μ ij, εij), and for these models Rho is insignificant. Therefore, selection bias is not present in the estimation of the anaerobic digester adoption equations.
c Binary dependent variable, which equals 1 for ‘Yes’ and 0 for ‘No’ when producers were asked if they would implement an anaerobic digester based on electricity price, carbon credit price, and percent capital cost covered by government grants (see Tables 2 and 3).
***Significant at the α = 0.01 level
**Significant at the α = 0.05 level
*Significant at the α = 0.1 level
The variable for environmental stewardship rank was negative and significant, which is expected because farmers who place a high value on the environmental benefits of anaerobic digesters should be more likely to consider adopting them. The higher the importance given to the environmental benefits of anaerobic digestion, the more likely a producer is to consider adopting an anaerobic digester.
As hypothesized, as the number of operational anaerobic digesters in a state (or number of neighbors) increases, the more likely a producer is to consider implementing an anaerobic digester. This corresponds with previous research on neighborhood effects and technology adoption (Baerenklau Reference Baerenklau2005). Overall, peer group influence, farm characteristics, and producers’ beliefs seemed to be more important in determining whether or not they had considered anaerobic digestion than their demographics (i.e., age, education), which were not significant.
The second-stage model included only producers who have considered adopting an anaerobic digester. Once the producers responded that they have considered adopting an anaerobic digester, they were asked if they would implement a digester based on a set of contingent valuation scenarios. As the percentage of digester capital cost covered by government grants increases, the likelihood of adopting a digester also increases (Table 7). Government grants could be important because, on average, the number one reason nonadopters do not want an anaerobic digester on their farm is because the costs often exceed the benefits.
Anaerobic digester adopters and nonadopters agree that system profitability is difficult because capital costs are high. However, producers who have operated anaerobic digestion systems seem more likely to support government intervention to help reduce costs. There is evidence to suggest that, while producers who have not operated anaerobic digesters agree that costs are too high, they would prefer lower costs be achieved without government support. This lends support to the theory that the source of income matters for some producers.
Unlike producers who have operated anaerobic digesters, the parameter estimate for carbon credit price was positive for nonadopters (Table 7). Although not significant, the overall average importance of government subsidies for reducing GHG emissions and carbon trading was lower for producers who do not have an anaerobic digester than for producers who do. Because producers with no digester may be less inclined to accept government support, additional market options such as carbon trading may be more appealing.
When considering electricity sales, the variable for price was significant. This seems to indicate that once producers have crossed the hurdle of considering adoption, they are primarily interested in the price they could receive for electricity that they produce. The variable for ranked relative importance of environmental benefits was positive and insignificant in the scenario involving selling electricity. Producers who have considered adopting an anaerobic digester and who would deem the price of electricity as an important factor for adoption are likely to rank the digester's market benefits as more important than nonmarket, environmental benefits.
All variables for farm type were negative, indicating that hog producers who have considered anaerobic digestion may be more likely to actually adopt an anaerobic digester. This could be because most hog farms already use lagoons for manure management. These lagoons could be covered with an impermeable membrane to capture and collect methane that could be used to produce electricity or generate carbon credits. While some dairy farms also use lagoons, the composition of dairy manure allows for more diverse methods of manure management, such as compost and storage. After considering anaerobic digestion, younger farmers and those with less education were more likely to adopt a digester.
After sample selection for those who have considered adoption, no farmers from the Southern region remained in the sample. Therefore, the indicator variable for the Western region was dropped in the anaerobic digester adoption equation. It was expected that producers in the Atlantic and Midwest regions would be more likely to adopt anaerobic digesters after considering them because of neighborhood effects and the larger number of incentives for renewables in these regions (see Figures 2 and 3). However, no regional indicator variables were significant, so no such conclusions could be drawn.
Willingness-to-Accept (WTA)
Average willingness-to-accept (WTA) values were calculated for each probit model within each sample group, and these results are in Table 8. The average willingness-to-adopt for producers who have operated a digester was $0.18/kWh. Producers with no anaerobic digester required an electricity price of $0.51/kWh in order to adopt. Producers were asked how much they currently pay for electricity on their farms, and the means for both samples are included in Table 8. For comparison, producers in this study pay, on average, about $0.092 – $0.096/kWh.
Table 8. Producer Willingness-to-accept (WTA) a Digester with Reference Values

a Mean values, as reported by survey respondents
b European Climate Exchange (ECX 2014)
c Social cost of carbon, for regulatory analysis under Executive Order 12866, ![]() $ r = 3 \percnt $ (U.S. Government 2013)
$ r = 3 \percnt $ (U.S. Government 2013)
The WTA values for carbon credit price were both outside the range of values used in the contingent valuation questions. We cannot extrapolate outside this range, and the negative value for producers who have operated anaerobic digesters is unexpected. However, estimating a WTA value outside of the range provided in the contingent valuation (CV) framework does tell us that it is highly unlikely that producers will adopt anaerobic digesters based on carbon credits. Table 8 lists the current market price of carbon credits on the European Climate Exchange (ECX) and the social cost of carbon (SCC), both converted from $/MT to $/animal/year (based on the amount of carbon produced per animal per year). Both values are below the WTA value estimated for producers who have not operated anaerobic digesters. Although the SCC is used for regulatory cost-benefit analysis and is not a market price, if the government were to subsidize carbon emissions reductions at this SCC amount, it would be very close to the estimated WTA for the average producer considering adoption.
Average WTA values for a digester based on the percent of the capital cost covered by government grants vary between sample groups. Producers who have operated anaerobic digesters suggested that other agricultural producers would be willing to accept a digester if they could receive government grants to cover 22 percent of the capital cost (Table 8). However, the average producer who has never operated an anaerobic digester would require that 62 percent of the digester's capital costs be covered by government grants. One reason for this may be that producers who have experience with anaerobic digesters feel more obligated to answer ‘yes’ in a survey about anaerobic digestion—a problem known as “yea-saying” (Blamey, Bennett, and Morrison Reference Blamey, Bennett and Morrison1999).
According to survey responses, producers who have operated anaerobic digesters and received government grants were awarded funds that covered almost 50 percent of the capital cost (Table 8). The WTA estimate for producers who have not operated anaerobic digesters exceeded the average value obtained for digesters included in this study, and this phenomenon may have occurred for a couple of reasons. First, although some producers believe that digesters should be economically feasible without government assistance, they are still concerned about the capital costs of the system. Second, producers who have never operated digesters may have limited knowledge about the technology and the associated costs. Thirty-two percent of swine producers and 11 percent of dairy producers listed education as the one most important thing for encouraging future adoption. Without having a complete understanding of the costs and benefits associated with anaerobic digesters, producers who have never operated them could be more likely to reject a CV question on adoption unless the majority of the costs are covered by government grants.
The three CV questions generate varying WTA results, which could be due to several reasons. First, the source of income matters to producers. While some producers desire government grants, others prefer an economically feasible digester, without government assistance. Reducing construction costs, selling electricity at retail price, or selling carbon credits could make a digester more economically feasible. While policies may be necessary to set up markets for renewable electricity and carbon credits, the social, psychological, and/or transaction costs associated with these policies may differ from those associated with government grants.
In addition, using CV methodology to study anaerobic digester technology adoption can be difficult when producers have limited knowledge of the technology and associated costs. The capital costs of anaerobic digesters are significant, and these CV questions only deal with potential revenues. Therefore, producers who have never operated or considered operating an anaerobic digester may not have enough information to make a decision for or against adoption.
Conclusions
This study estimated the effect of government policies and farm and producer characteristics on the potential adoption of anaerobic digesters on dairy and swine operations. Producers were concerned about the capital costs of anaerobic digesters. Results for producers who have operated anaerobic digesters and producers who have never operated anaerobic digesters indicate the percent capital cost that is covered by government grants is important and positively related to the likelihood of adoption.
When looking at the roles of farm characteristics and producer demographics in anaerobic digester adoption, farm characteristics dominated. Farm size, type, and location were consistently influential in the adoption decision. Larger farms were more likely to consider adoption and adopt anaerobic digesters, and producers commonly cited that their farm was too small for an anaerobic digester. Dairy producers were more likely to consider adopting an anaerobic digester, and this is possibly because more information is available on the application of anaerobic digesters on dairy farms. However, hog producers were more likely to adopt once they had considered anaerobic digestion for manure management, which could be due to their operations being more easily adaptable to anaerobic digestion technology.
As the number of in-state neighbors with anaerobic digesters increased, so did the likelihood that producers with no digester would consider adoption. In two CV scenarios, regional indicator variables for producers with digesters were also positive and significant. A farm's location may affect anaerobic digester adoption for several reasons. Climate is an important factor for digester operation and productivity. Location also affects the renewable energy policies and the exposure to operational anaerobic digesters. Overall, younger farmers with less than a college bachelor's degree are more likely to adopt anaerobic digesters.
The bivariate probit model with sample selection that was estimated for nonadopters revealed that neighborhood effects, environmental considerations, and farm characteristics are associated with whether or not a producer will consider adopting an anaerobic digester for manure management. However, as shown in the electricity marketing scenario, after considering anaerobic digestion, producers are more concerned with the price they will receive for the electricity they generate. Motivations and influences such as neighborhood effects and environmental beliefs may be enough for producers to consider anaerobic digestion, but may not be enough to encourage a producer to adopt a digester. Once a producer has considered anaerobic digestion, the decision to adopt could be more heavily tied to profit maximization.
Results could have implications in renewable energy policy formulation. Along with the variables described above, the decision to adopt a digester was influenced by the type of policy that was presented in the CV question. Most renewable energy policies are designed to increase income to a level that encourages adoption (USEPA 2014c). However, producers may attach different psychic, social, and/or transaction costs to different types of policies. If the source of income matters to producers, some policies may be more effective at encouraging adoption than others. Results indicate that government grants to cover a portion of the capital costs may be most effective. Examining anaerobic digester design regulations and standards to determine if changes could be made to reduce capital costs could also be beneficial.
Supplementary Material
To view supplementary material for this article, please visit https://doi.org/10.1017/age.2017.13.


