Stakeholders in the cow-calf industry are under ongoing financial and regulatory pressure to revise production methods to improve their economic and environmental efficiency. Several studies estimated that cow-calf production practices commonly used in North America are the greatest source of greenhouse gas (GHG) emissions of all beef-cattle enterprises (Lupo et al. Reference Lupo, Clay, Benning and Stone2013, Beauchemin et al. Reference Beauchemin, Janzen, Little, McAllister and McGinn2011, Pelletier, Pirog, and Rasmussen Reference Pelletier, Pirog and Rasmussen2010). While methods for mitigating GHG emissions from cow-calf operations are needed (Beauchemin et al. Reference Beauchemin, Janzen, Little, McAllister and McGinn2011), such measures can reduce productivity and hence decrease profitability (Zilverberg et al. Reference Zilverberg, Johnson, Weinheimer and Allen2011). Furthermore, a combination of volatile input and commodity prices and increasing environmental regulation has created a need for tools by which producers can better evaluate various inputs and production methods when making decisions at the farm level. University of Arkansas created decision-support software, Forage and Cattle Planner (FORCAP), that producers, extension agents, and researchers can use to estimate net returns and changes in GHG emissions for different cow-calf and forage-management strategies and inputs (Popp et al. Reference Popp, Smith, Keeton and Maples2014). The FORCAP spreadsheet allows users to enter operation-specific parameters, inputs, and production methods to compare estimated net returns and GHG emissions in Excel®. The software and accompanying reference and user manuals are available online (Keeton et al. Reference Keeton, Popp, Smith and Maples2014, Smith, Popp, and Keeton Reference Smith, Popp and Keeton2013).
In this analysis, we used FORCAP and an Excel® add-in, Risk Solver Platform v12.5 (Frontline Systems Inc.), to simulate profit-maximizing forage and cattle management decisions for medium and large size operations in a steady-state environment with no growth in herd size. The profit-maximizing model modified the species composition of pasture forage, the stocking rate, and weaning age for three calving distributions—spring, fall, and year-round—using three pasture-fertilization scenarios—none, low, and high—for each operation size, resulting in eighteen scenarios in all. This analysis examined the potential net returns and GHG emission tradeoffs between different input selections and production decisions. For example, increasing pasture fertilization may be more profitable by allowing for a greater stocking rate but may lead to a higher environmental cost by way of both the increased number of animals and greater fertilizer emissions per acre. Conversely, it may be more profitable not to fertilize given the high cost of fertilizing, thus reducing GHG emissions from fertilizer and potentially reducing beef production and thereby animal emissions per acre. This analysis provides practical information about likely changes in beef production, profitability, and GHG emissions in response to modifications to pasture fertilization, calving distributions, pasture species composition, weaning age, and stocking rates.
Background
Changes in the composition of pasture forage species can lead to seasonal forage growth that more closely matches the monthly nutritional requirements of the animals for a given calving season and weaning age. Further, inclusion of nitrogen-fixing species can reduce commercial nitrogen fertilizer requirements (West and Waller Reference West, Waller and Barnes2007) and hence reduce GHG emissions from upstream fertilizer production and nitrous oxide emissions from nitrogen that volatizes when such fertilizers are applied. However, inclusion of these nitrogen-fixing species may require additional production costs (Zilverberg et al. Reference Zilverberg, Johnson, Weinheimer and Allen2011).
In Arkansas, pasture-forage species can be broadly categorized as warm-season grasses, cool-season grasses, and legumes. Warm-season grasses actively grow from late spring to late summer (May to August). Cool-season grasses typically grow from early spring to early summer (March to June) and are dormant during periods of high temperatures in mid-summer (July and August). These grasses typically resume growing in the fall (September to November) as temperatures decrease. Legumes or clovers provide two primary benefits when included in pastures; they fix atmospheric nitrogen, making it usable by other forage species, and increase the forage's nutritional content (providing greater total digestible nutrients and crude protein than grasses) for grazing livestock. This analysis uses bermuda grass (Cynodon dactylon (L.) Pers.), tall fescue (Lolium arundinaceum (Schreb.) Darbysh.), and white clover (Trifolium repens L.), all of which are common in pastures in the region.Footnote 1
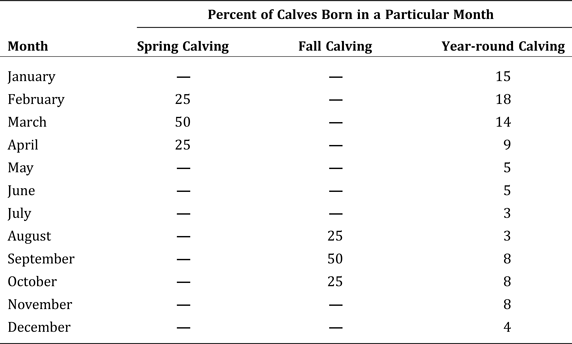
In Arkansas, cow-calf operators implement a range of calving distributions. The most common are spring (February through April), fall (August through October), and year-round (no defined calving period). In 2008, more than 55 percent of the cow-calf operations in the southeastern United States used a year-round distribution (U.S. Department of Agriculture 2009). Table 1 shows the estimated percentage of calves born each month for operations that used a year-round distribution as reported by Doye, Popp, and West (Reference Doye, Popp and West2008). Year-round calving requires less active management, typically at the expense of increased calving intervals (time between calvings) and reduced uniformity in calf crop. By contrast, a defined calving season (spring or fall) has been shown to improve uniformity of cattle for marketing, provide shorter calving intervals, and reduce labor requirements at specific times of the year, which allows the farmer to focus on alternative enterprises such as crop and forage production. Doye, Popp, and West (Reference Doye, Popp and West2008) found that year-round calving reduced returns to producers relative to spring and fall calving. The authors hypothesized, however, that small-sized operations sacrificed returns to calving-season control for ease of management and the ability to avoid investment in facilities that would separate herd sires from the remaining breeding stock. Smith et al. (Reference Smith, Caldwell, Popp, Coffey, Jennings, Savin and Rosenkrans2012) and Caldwell et al. (Reference Caldwell, Coffey, Jennings, Philipp, Young, Tucker, Hubbell, Hess, Looper, West, Savin, Popp, Kreider, Halfor and Rosenkrans2013) also found large differences in the reproductive performance of different calving distributions due primarily to fescue toxicosis. The studies found that more beef was weaned per cow when cows were bred to calve in early fall. Implications are that nutrition for cows and calves, potentially weaned at an older age, would need to be available in the summer (warm-season grass) of the following year with an attendant need for additional fertilizer.
Table 1. Seasonal Calving Distributions for Optimizations in Forage and Cattle Planner

Note: The year-round percentages are from Doye, Popp, and West (Reference Doye, Popp and West2008).
FORCAP's ability to simultaneously modify pasture forage species, weaning age, and stocking rate (via number of cows) for alternative calving distributions and pasture fertilization strategies allows cow-calf producers to more closely match a herd's nutritional requirements with seasonal forage production, reducing the need for hay and other supplemental feed and potentially increasing their net returns and/or reducing GHG emissions. From an economic perspective, relative prices of feed, beef outputs, and fertilizers thus play a role in selection of stocking rate, weaning age, forage species composition, calving distribution, and pasture fertilization since all factors drive GHG emissions and profitability.
Materials and Methods
The Forage and Cattle Planner Model
FORCAP was developed at University of Arkansas to allow users to estimate GHG emissions and producer net returns for cow-calf and forage operations in Arkansas (Popp et al. Reference Popp, Smith, Keeton and Maples2014). As in Keeton, Popp, and Smith (Reference Keeton, Popp and Smith2014), which tested the implications of the FORCAP model's performance on herd sire genetics, FORCAP can be used to estimate changes in net returns and GHG emissions from different input, management, agronomic, and economic variables. The emission estimates track the implications of use of fuels, fertilizer, and twine in on-farm production of hay and forages, fuel use for transport to market, and emissions by the animals. This farm-gate analysis does not track GHG emissions for purchased hay and supplements because those net emissions occur off-farm and would be counted as net emissions for those crop and hay farms.
The FORCAP model uses three benchmark farm sizes—small, medium, and large—so users can compare their operations with ones of similar size. In this analysis, small operations are not discussed because benchmark small farms in FORCAP assume that all hay fed is purchased off-farm, and as such, GHG emissions from purchased hay production would be assigned to off-farm hay producers. In addition, since such operations are small in scale, management options for changing forage species, for example, are often relatively limited since fewer pasture paddocks exist to limit cattle access to pastures in which new forage species are being established. As such, the implications of changes in net returns for small operations are often quite small, leading to profit-satisficing behavior as indicated by Doye, Popp, and West (Reference Doye, Popp and West2008). Therefore, it is difficult to compare small farms to larger operations. Thus, in this analysis, only the benchmark medium and large farm sizes with default FORCAP settings for operating parameters are estimated for profit-maximization using nonlinear programming techniques.
Maximization of Net Return
Net returns are calculated as cattle and excess hayFootnote 2 sales less variable expenses for feed, supplements, veterinary services, hauling, fuel, twine, chemical expenses, operating interest, and ownership charges for buildings, equipment, fencing, and breeding stock. Net-return-maximizing scenarios are estimated for two operation sizes (S) using three calving distributions (D) and three pasture-fertilization strategies (F). Large operations are defined as dedicating 150 acres to hay production and 450 acres to pasture; medium operations dedicate 60 acres to hay production and 180 acres to pasture. Hence, the ratio of hay acres to pasture acresFootnote 3 is held constant to avoid capturing efficiency changes in hay production. The calving distributions are spring, fall, and year-round; see Table 1 for corresponding percentages of calves born per month for each distribution. Annual pasture-fertilizer applications are defined as none, low (lime at 1 ton per acre every four years and poultry litter (3–2–3) at 0.5 tons per acre), and high (the low amount plus 100 pounds of ammonium nitrate (34–0–0) and an additional 1.5 tons of poultry litter per acre). Hay acres are fertilized using 3 tons of poultry litter per acre, 300 pounds of ammonium nitrate per acre, and lime at the pasture rate. In this analysis, only the pasture fertilizer applications are modified; the application of fertilizer to hay acres is held constant. Poultry litter is used extensively by Arkansas cattle operations. It provides a slow release of nitrogen at a low cost compared to commercial fertilizers. However, the rate of application typically is restricted to avoid applying an excess of phosphorus (DeLaune et al. Reference DeLaune, Moore, Carman, Sharpley, Haggard and Daniel2004). Furthermore, commercial nitrogen fertilizers provide a quick release of nitrogen to meet the time-sensitive nutrient needs of forage plants.
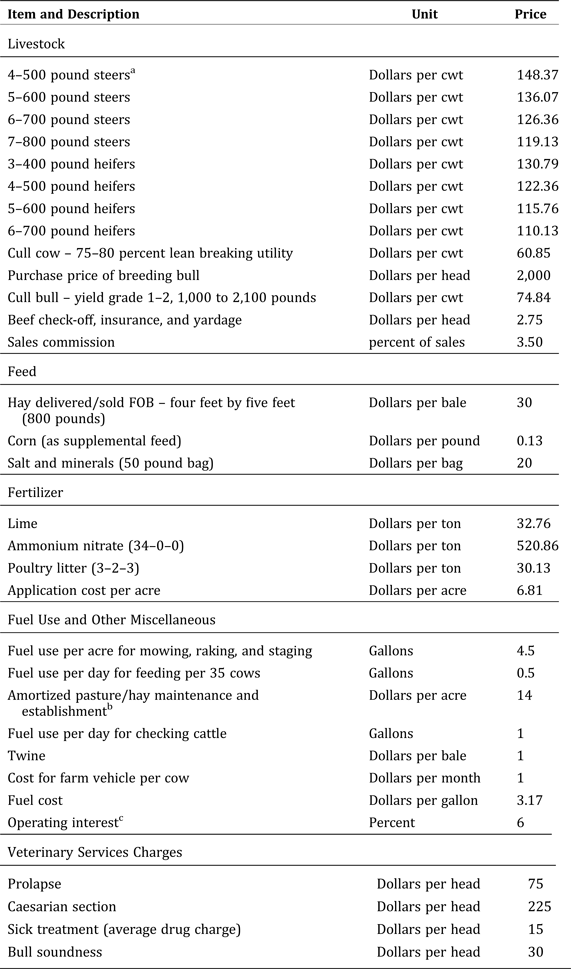
To avoid selecting cyclically high or low prices, 2004–2013 deflated ten-year average prices of cattle, supplemental feed, and fertilizers are used in conjunction with 2013 input prices for the other inputs as shown in Tables 2 and 3.
Table 2. Prices and Costs Used by Forage and Cattle Planner

a State-average medium and large frame no. 1 prices as reported by the USDA Agricultural Marketing Service. The average of all monthly prices was used for sale months that were split across several marketing months with a year-round calving distribution and depended on weaning age. Selecting spring or fall calving and different weaning ages will result in different prices. Shown are the sale prices for cattle when selecting a year-round calving distribution as shown in Table 1 together with an eight-month weaning or selling age for calves. Prices were deflated using a consumer price index.
b Based on a ten-year life of stand and standard seedbed preparation and weed control expenses.
c Charged on half the cash operating expenses incurred per year to reflect the likely operating credit line expense.
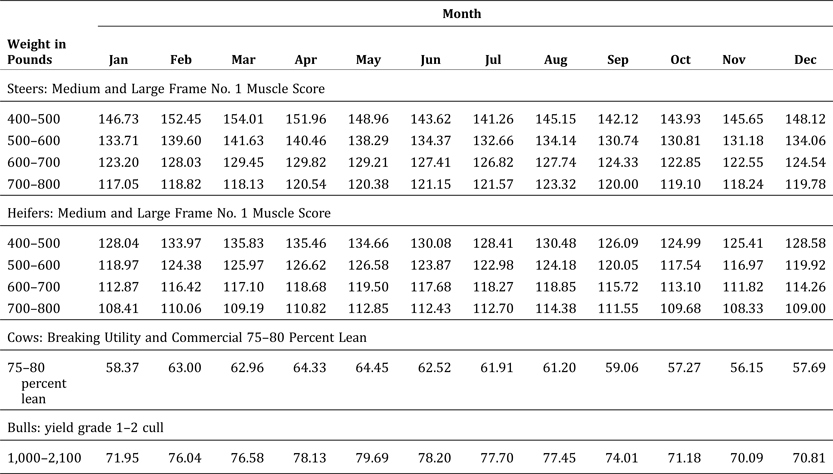
Table 3. 2013 CPI-deflated Ten-year Average Monthly Cattle Prices for Arkansas by Animal Category

Source: Agricultural Marketing Service, USDA, Little Rock, Arkansas.
The sale prices for calves are calculated based on average monthly prices by weight category. The average monthly price varies depending on the time of year of the calving distribution (Table 3).
Weaning weight, which is a function of weaning age, is calculated using base weights of 400 pounds for heifer calves and 425 pounds for steer calves at five months of age. Heifers subsequently gain 60 pounds per month and steers gain 65 pounds.
The prices for calves by weight category are linearly interpolated based on the closest hundredweight (cwt) category as reported in Table 3. The prices for cull animals are also seasonally adjusted.
Data on fertilizer prices were obtained from the U.S. Department of Agriculture (USDA) Economic Research Service (ERS) (2012) and deflated using the National Agricultural Statistics Service's (NASS's) fertilizer price index (NASS 2014). Prices for poultry litter are based on recent price expectations of $20 to $25 per ton and deflated using the NASS fertilizer price index. The data on feed prices were obtained from weekly feedstuffs reports by the USDA Agricultural Marketing Service (AMS). Those data are averaged for 2009 through 2013 and deflated using NASS's feed cost index (NASS 2014). The prices for additional inputs are estimated from 2013 retail prices for Northwest Arkansas and opinions of experts (Table 2).
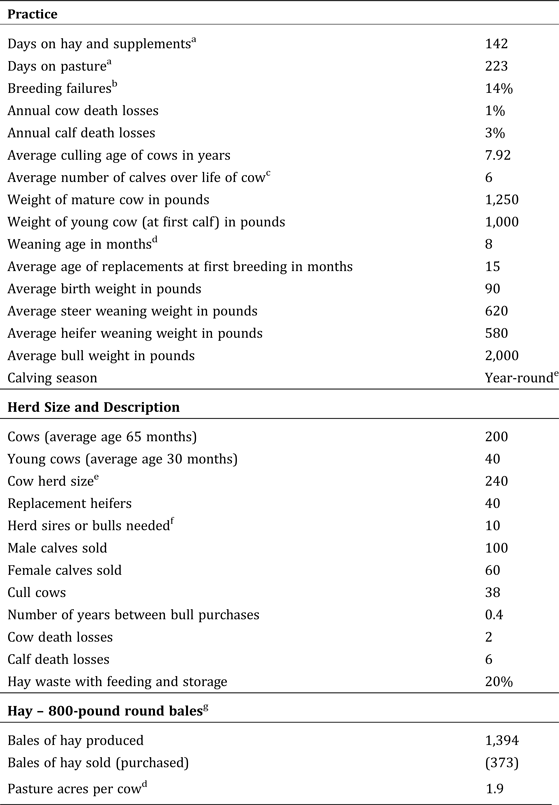
Five streams of revenue (Y i) are included in the analysis: sales of steer calves, heifer calves, culled cows, culled herd sires, and excess hay. The quantities produced for each scenario are estimated using the default input quantities and production methods shown in Table 4. The costs (C) are based on default parameters and vary in each scenario. As a result, the net-return-maximizing equation for each operating scenario combination (S, D, and F) is the following.
Table 4. Sample Summary of Cattle and Hay Management Practices

a Varies by calving season, forage species mix, and farm size. Days on hay and supplements do not solely rely on hay. Some pasture forage is part of the diet if available.
b Defined as the percentage of cows open at the end of a breeding season; it varies by calving season due to the expected impact of fescue toxicosis as reported in Caldwell et al. (Reference Caldwell, Coffey, Jennings, Philipp, Young, Tucker, Hubbell, Hess, Looper, West, Savin, Popp, Kreider, Halfor and Rosenkrans2013): spring (20 percent), fall (6 percent), and year-round (14 percent). Breeding failures are determined by the number of replacement cows needed as well as the by the number of calves sold.
c Determines the culling age for cows and hence the number of replacement cows needed in conjunction with breeding failures.
d Calving season is a decision variable for various optimization runs and affects sale prices, seasonal nutrient needs, and breeding failures.
e Was a decision variable for optimization. Cow herd makeup is described for first-bred young cows and older cows in the rows above. The cow herd size is the number of animals bred per year. Cow herd size also drives the stocking rate shown in pasture acres per cow.
f The number of herd sires is determined by the total number of first-bred young cows and older cows in the herd. This analysis assumes that one bull can service a maximum of 25 cows. Bulls are assumed to be replaced every four years.
g A negative number implies greater hay needs than available from farm production and hence hay purchases.
Notes: The table presents results from a large cow-calf operation with year-round calving and a high fertilization strategy.
 $${\rm Maximize\; } N{R_{SDF}} = \mathop \sum \limits_{i = 1}^5 Pi \cdot Yi{\rm \; -\; } {C_{SDF}}\; {\rm for\; all}\; S\comma \; \; D\comma \; {\rm and\; } F$$
Subject to:

In this equation, NR SDF represents net returns by operation size (S), calving distribution (D), and fertilizer strategy (F) and includes all five revenue sources less operating costs for hay, corn, fertilizer, veterinary drugs, salt and minerals, veterinary charges, sales commissions, yardage, insurance, beef check-off fees, fuel, twine, herd sire replacement, farm vehicles, prorated pasture-establishment charges, and repairs and maintenance. Additional charges include operating interest on one-half of the annual operating costs and ownership charges on the breeding stock, equipment, fencing, cattle facilities, and buildings in dollars per farm.
P i represents the deflated 2004–2013 average price for revenue source i (cattle sales adjusted by weight, sale month, and type of animal as well as sale of excess hay, if any) in dollars per pound. Y i represents the quantity (pounds) produced for sale for each type of revenue i, and C SDF represents the total cost incurred in dollars per farm for each scenario.
The forage species composition is limited to a maximum of 70 percent fescue or bermuda grass and 30 percent clover because higher percentages were deemed unrealistic for a typical operation by experts. Changes in the forage composition are limited to 5 percent increments since smaller increments would be difficult to manage practically.
Weaning age is restricted to five to eight months to allow for a twelve-month calving interval, and the stocking rate is restricted to no fewer than 1.5 acres per cow or two-thirds of a cow per acre to limit excessive purchases of hay (with GHG emissions accounting going to off-farm hay growers) to supplement on-farm hay and pasture production. A greater number of animals also typically requires increased use of fertilizer for forage and hay production (Zilverberg et al. Reference Zilverberg, Johnson, Weinheimer and Allen2011). Integer constraints for weaning age and number of cows are added to eliminate solutions that contain fractions for months and animals. Inputs and production decisions not related to the choice variables of forage species composition, weaning age, and stocking rate are held constant for all SDF combinations.
Risk Solver Platform v12.5 uses a hybrid evolutionary solver with a combination of methods from genetic and evolutionary algorithms and classical optimization methods for this non-smooth optimization problem (a mixed nonlinear integer problem). Optimal solutions were also cross-checked by starting the solver from different initial variable starting points to determine if different final optimal solutions were obtained. This was not the case.
Comparisons of Greenhouse Gas Emissions
Emissions of methane (CH4), nitrous oxide (N2O), and carbon dioxide (CO2) produced from forage production, animals, and agricultural inputs are tracked in CO2 equivalents (CO2E). The CH4 and N2O emissions are estimated in CO2E using their 100-year global-warming potential of 25 and 250 times that of CO2, respectively (Intergovernmental Panel on Climate Change (IPCC) 2007). Sources of animal emissions (j) are enteric fermentation (CH4), respiration (CO2), urine, and manure (N2O). The N2O and CH4 emissions are estimated using 2007 IPCC Tier-II emission equations, and the CO2 emissions are estimated from Kirchgessner et al. (Reference Kirchgessner, Windisch, Müller and Kreuzer1991).
Calculations for each animal group (cows, herd sires, replacement heifers, steer calves, and heifer calves) are based on the animals’ weight and their intake of crude protein, dry matter, and energy by month. Emissions from forage production (k) on both pasture and hay acres are included. The emissions from agricultural inputs (m) are estimated from standard emission factors for fuel, fertilizer, and N2O emissions from nitrogen fertilizers (Lal Reference Lal2004). Emissions associated with twine are estimated at 6.1 pounds of carbon equivalent per pound of plastic twine used.
GHG emissions are estimated as
 $$GH{G_{SDF}} = \sum\limits_{\,j = 1}^3 G HG{A_{\,jSDF}}\; + \,\sum\limits_{k = 1}^2 G HG{F_{kSDF}}\, + \,\sum\limits_{m = 1}^4 G HG{I_{mSDF}}$$
where GHG SDF represents estimated CO2E emissions by farm size, calving distribution, and fertilizer strategy scenario; GHGA jSDF represents the CO2E emissions produced from animals from source j for each scenario; GHGF kSDF represents the CO2 uptake of forages with photosynthesis by source k (hay or pasture) for each scenario; and GHGI mSDF represents the CO2E emissions produced from input m for each scenario.
Again, purchased hay and feed are assumed to be fed at zero net GHG emissions since sequestration during growth and emissions from production and transport are assumed to be incurred by the operations that grow and deliver feed and occur off-farm and emissions from feed use by way of animal emissions are accounted for. Furthermore, direct emissions created during the manufacture and delivery of fertilizers and fuel are included since they can be large sources of emissions depending on the fertilizer strategy with approximately half of the fertilizer emissions from nitrogen and all of the fuel emissions occurring on-farm.
Results
Strategies for Maximizing Net Returns for Large and Medium Operations
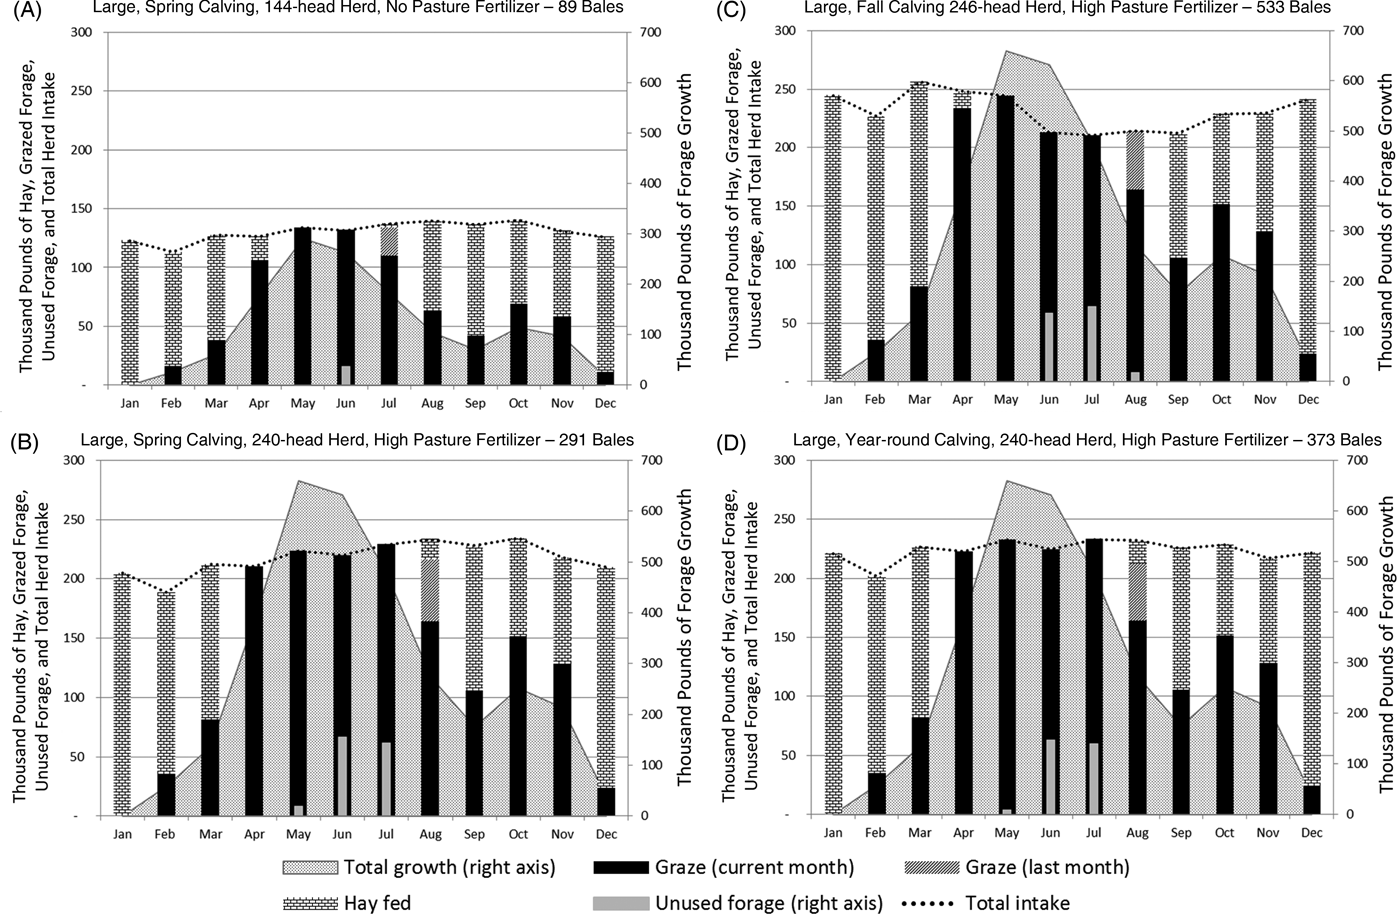
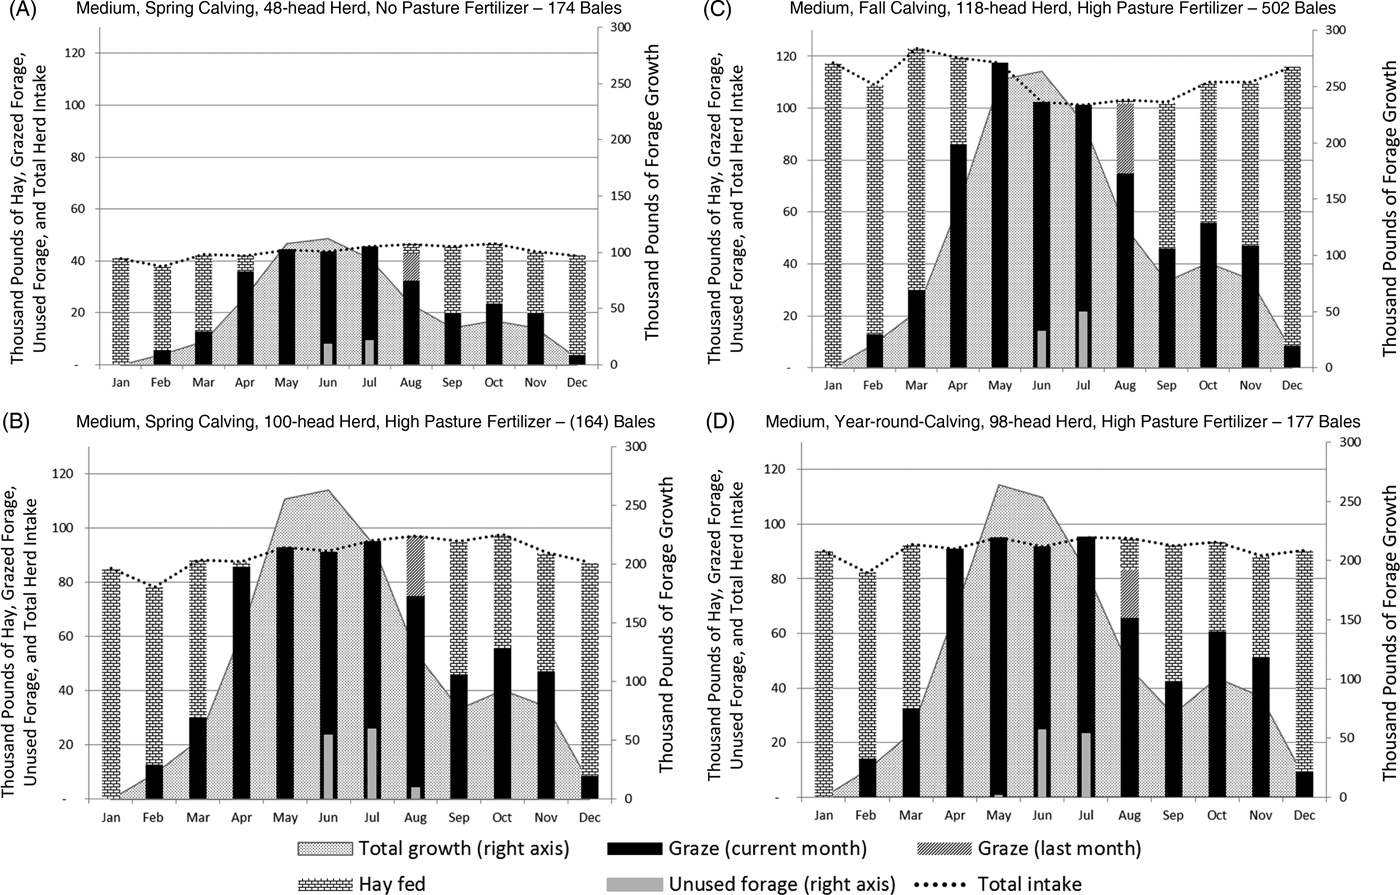
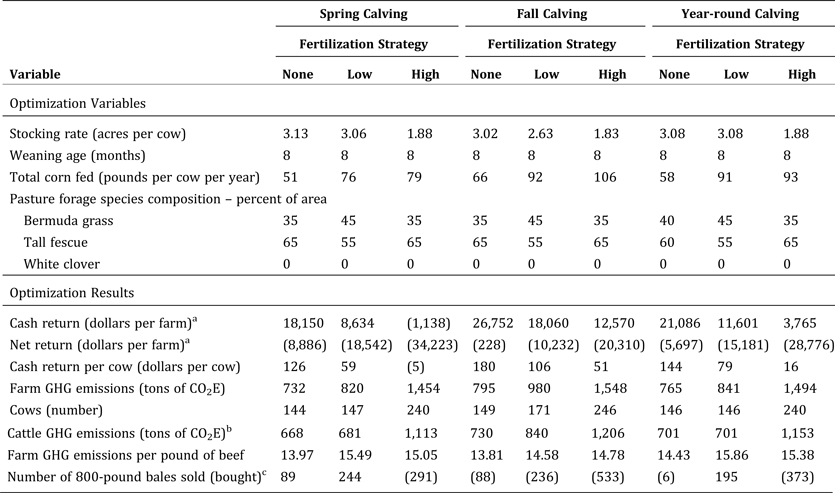
The results of the analysis of large operations are reported in Table 5. For all of the scenarios involving large operations, the species compositions that maximized net return did not include clover. The maximizing percent of each type of forage by area was 35–45 percent for bermuda grass and 55–65 percent for tall fescue. Regardless of the calving distribution used, a large operation that adopted the low-fertilization strategy used a relatively high percentage of bermuda grass (45 percent) and a relatively low percentage of tall fescue (55 percent) relative to a large operation that adopted the high-fertilization strategy (35 percent bermuda grass and 65 percent tall fescue). A greater percentage of tall fescue coincided with higher forage intake during March under fall calving and November under spring calving when calves are heaviest as they are weaned at eight months in all scenarios. In the months preceding weaning, cow-calf operations would benefit more from seasonal tall fescue growth than from bermuda grass, which would be dormant at those times (see the shaded areas in Figures 1 and 2).

Figure 1. Comparison of Pasture Use for Large-sized Farms across Select Calving Season and Fertilizer Strategies

Figure 2. Comparison of Pasture Use for Medium Farm Operations across Select Calving Season and Fertilizer Strategies
Table 5. Optimization-selected Variables and Results for a Large Operation for Three Calving Seasons and Three Fertilization Strategies

a Net returns are calculated by operation size (S), calving distribution (D), and fertilizer strategy (F). Included in net returns are the five revenue sources less operating costs consisting of purchased feed supplements of hay, corn, salt and minerals, fertilizer, veterinary services and medicine, sales commissions, yardage, insurance, beef checkoff fees, fuel, twine, herd sire replacement, a fee for farm vehicles assessed at $1 per bred cow per month for all-terrain vehicle and pickup truck use, prorated pasture establishment charges, repairs and maintenance as well as operating interest on half of the operating costs. Ownership charges include the opportunity cost of breeding stock, capital recovery, property taxes and insurance on equipment (excluding farm vehicles), fencing, cattle facilities, and buildings. Net returns are expressed in dollars per farm and do not include returns to land, owners’ equity, labor, and management. Cash returns are net returns less the aforementioned ownership charges.
b Cattle GHG emissions from respiration, enteric fermentation, urine, and manure in tons of CO2E.
c All large operations are assumed to have on-farm hay production of 1,394 bales of hay.
Notes: A large operation is defined as a cow-calf operation with a land base of 150 acres of hay and 450 acres of pasture. Capital investment for a large operation is shown in Table 7. Calving season is defined by the percentage of calves born each month shown in Table 1. Estimated breeding failures vary by calving season and are based on empirical results from a study conducted by Caldwell et al. (Reference Caldwell, Coffey, Jennings, Philipp, Young, Tucker, Hubbell, Hess, Looper, West, Savin, Popp, Kreider, Halfor and Rosenkrans2013). Breeding failures were 20 percent, 14 percent, and 6 percent for spring, year-round, and fall calving seasons, respectively. The pasture fertilization strategies are: None – No fertilizer applied; Low – 1 ton of lime per acre every four years and 0.5 tons of poultry litter per acre; and High – 1 ton of lime per acre every four years, 2 tons of poultry litter per acre, and 100 pounds of ammonium nitrate (34–0–0) per acre.
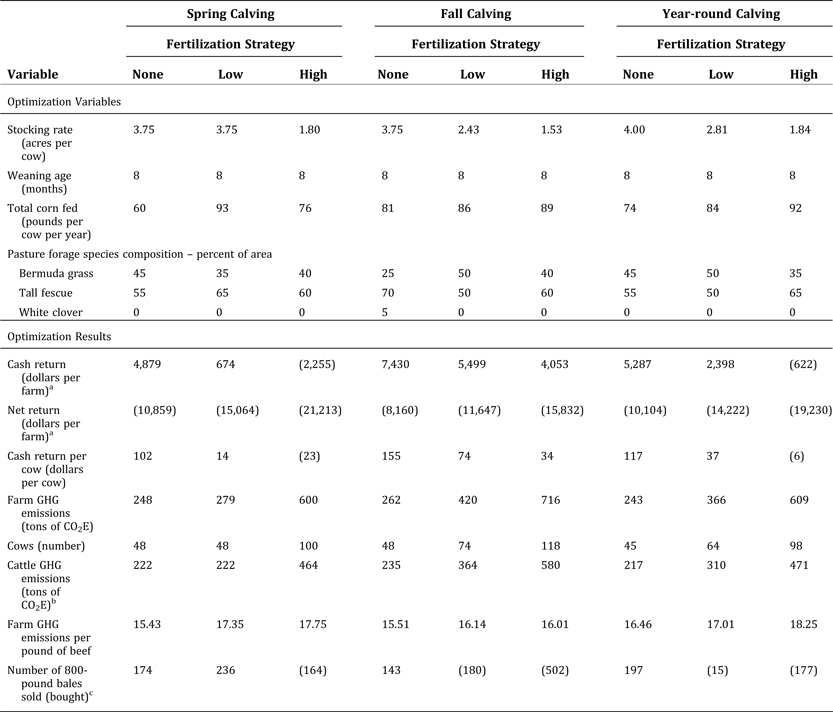
The results of the analysis of medium operations are reported in Table 6. For medium operations, the forage composition was 25–50 percent bermuda grass and 55–70 percent tall fescue. Clover was included only for a fall calving distribution and no fertilizer application. However, in this scenario the 70-percent pasture forage composition constraint for tall fescue was binding. When the binding constraint was relaxed, the optimum species composition was 75 percent tall fescue and 25 percent bermuda grass and no longer included clover. Hence, inclusion of clover for biological nitrogen fixation as a fertility source and as a more nutritious forage was not cost-effective. Medium operations also showed less consistency in species composition across fertilization strategies than large operations.
Table 6. Optimization-selected Variables and Results for a Medium Operation for Three Calving Seasons and Three Fertilization Strategies

a Net returns are calculated by operation size (S), calving distribution (D), and fertilizer strategy (F). Included in net returns are the five revenue sources less operating costs consisting of purchased feed supplements of hay, corn, salt and minerals, fertilizer, veterinary services and medicine, sales commissions, yardage, insurance, beef checkoff fees, fuel, twine, herd sire replacement, a fee for farm vehicles assessed at $1 per bred cow per month for all-terrain vehicle and pickup truck use, prorated pasture establishment charges, repairs and maintenance, and operating interest on half of the operating costs. Ownership charges include the opportunity cost on breeding stock, capital recovery, property taxes and insurance on equipment (excluding farm vehicles), fencing, cattle facilities, and buildings. Net returns are expressed in dollars per farm and do not include returns to land, owners’ equity, labor, and management. Cash returns are net returns less the aforementioned ownership charges.
b Cattle GHG emissions from respiration, enteric fermentation, urine, and manure in pounds of CO2E per pound of beef leaving the farm.
c All medium operations are assumed to have on-farm hay production of 557 bales of hay.
Notes: Medium operation is defined as a cow-calf operation with a land base of 60 acres of hay and 180 acres of pasture. Capital investment for a medium operation is shown in Table 7. Calving season is defined by the percentage of calves born each month shown in Table 1. Estimated breeding failures vary by calving season and are based on empirical results from a study conducted by Caldwell et al. (Reference Caldwell, Coffey, Jennings, Philipp, Young, Tucker, Hubbell, Hess, Looper, West, Savin, Popp, Kreider, Halfor and Rosenkrans2013). Breeding failures are 20 percent, 14 percent, and 6 percent for spring, year-round, and fall calving seasons, respectively. The pasture fertilization strategies are: None – No fertilizer applied; Low – 1 ton of lime per acre every four years and 0.5 tons of poultry litter per acre; and High – 1 ton of lime per acre every four years, 2 tons of poultry litter per acre, and 100 pounds of ammonium nitrate (34–0–0) per acre.
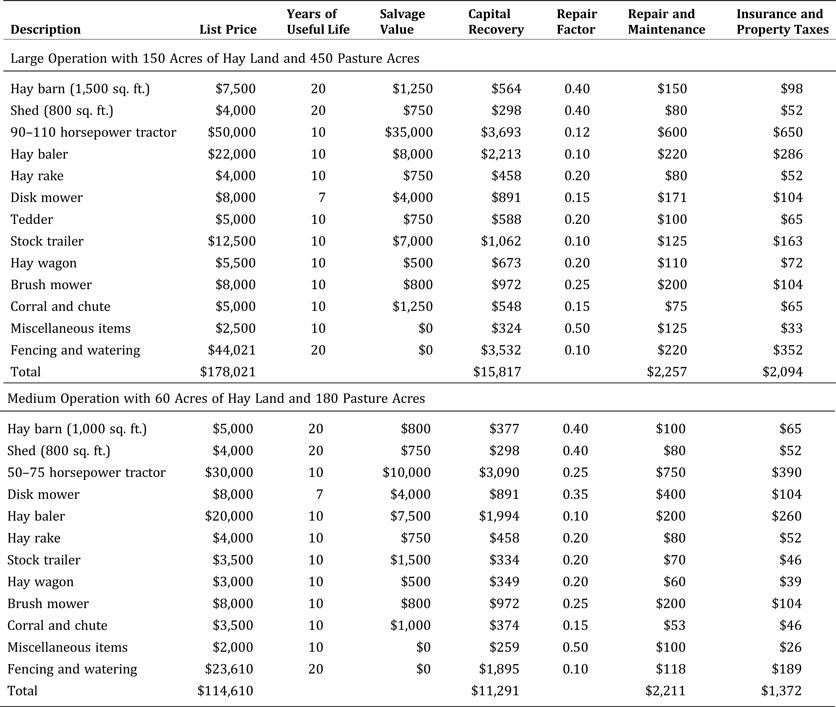
Table 7. Estimated Capital Requirements for Large and Medium Operations

Figures 1 and 2 compare select fertilizer and calving distribution strategies for large and medium operations. The analysis shows how nutrition needs of the herd (represented by dotted lines) were met by grazing of current growth (black bars), the preceding month's growth (diagonally striped bars), and hay (brick-patterned bars). The narrow gray bars depict unused forage, and the shaded areas in the background show the amount of total forage available.
Note that added pasture fertilizer for spring calving herds increased total forage production and the stocking rate but also increased the amount of unused forage. Panels B, C, and D in the figures demonstrate differences in forage use across calving seasons when pasture fertility was held constant at high fertilization. Nutrition needs during off-season forage growth months were met with corn, purchased hay (see Tables 5 and 6), and on-farm hay production (557 and 1,394 bales for medium and large operations, respectively). Panel D reflects the relatively stable monthly need for animal nutrition for year-round calving relative to spring and fall calving, which peaked in March, April, and May and in August, September, and October, respectively. For the high-fertilization strategies, spring calving relied least on purchased hay: 291 bales for large operations and 164 bales for medium operations (Tables 5 and 6). For large operations, use of corn per cow was greater for fall calving and coincided with greater (less) hay purchases (sales) when compared to spring or year-round calving when using the same fertilization strategy (Tables 5 and 6).
Stocking rates (acres per cow) decreased or remained the same as pasture fertilization increased. For each fertilization strategy, the stocking rate was lowest (fewest acres required per cow) for the fall calving distribution. However, this came at the added expense of increased (decreased) hay purchases (sales). Increasing fertilization from none to high allowed medium farms to double the number of cows and large farms to increase the number of cows 90 percent.
The weaning age for all operation sizes, fertilization strategies, and calving distributions was the maximum, eight months (Tables 5 and 6). Therefore, fall calving operations would market the calves in April, May, and June, a time when average prices historically have been highest for 600 to 700 pound steers and 500 to 600 pound heifers (Table 3). Spring calving operations would market the calves in October, November, and December, a period of relatively low average prices. The greater amount of hay purchased (smaller amount sold) by fall calving operations was more than offset by higher stocking rates and prices. It is important to note that the differential in stocking rates was driven not only by seasonal sale prices, forage availability, and capacity use but also by the higher rate of breeding failures in spring calving herds, which raises the cost of beef production. The model analyzed breeding failure rates of 20 percent for spring calving, 6 percent for fall calving, and 14 percent for year-round calving (Caldwell et al. Reference Caldwell, Coffey, Jennings, Philipp, Young, Tucker, Hubbell, Hess, Looper, West, Savin, Popp, Kreider, Halfor and Rosenkrans2013).
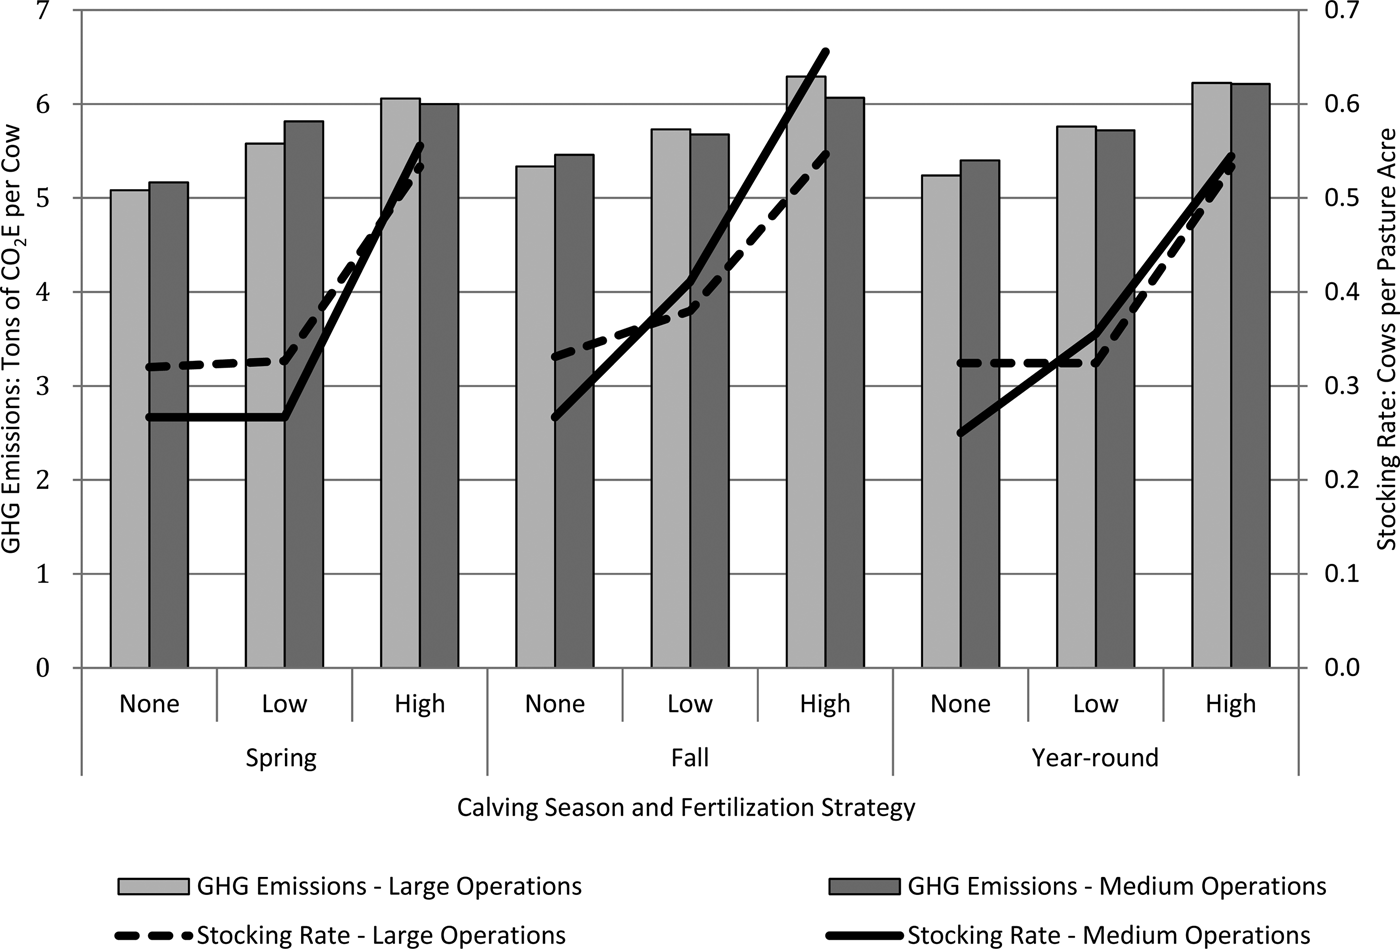
In terms of a farm's net returns and cash returns (net returns minus operating costs), which are expressed in dollars per farm,Footnote 4 unfertilized pasture was superior to fertilized pasture for both medium and large operations. Fall calving provided the greatest cash return under all of the fertilization strategies, and lower stocking rates, higher sale prices, and fewer breeding failures more than offset the additional (fewer) hay purchases (sales) needed for fall calving. In terms of cash return per cow, the no-fertilizer option was the dominant strategy under all of the calving distributions and regardless of the size of the operation (Tables 5 and 6). Overall, as in Zilverberg et al. (Reference Zilverberg, Johnson, Weinheimer and Allen2011), the results show that adding fertilizer to enhance the stocking rate was not profitable and led to greater GHG emissions (Figure 3 and Tables 5 and 6).

Figure 3. Estimated Stocking Rate and Total Farm GHG Emissions per Cow for Large and Medium Operations for Three Calving Seasons and Three Fertilization Strategies
Emission-reducing Strategies for Large and Medium Operations
Generally, total farm GHG emissions increased as the degree of fertilization increased. However, the largest source of emissions was livestock, which accounted for 76–91 percent of total farm emissions (Tables 5 and 6). Not accounted for in GHG emissions was hay purchased off-farm since those emissions were attributed to the hay producer. In the case of hay produced on-farm, those emissions were attributed to the operation. The no-fertilization strategy produced the least GHG emissions per pound of beef leaving the farm regardless of the calving distribution and operation size. Overall, the driving force behind GHG emission per pound of beef sold was the fertilization strategy and the breeding failure rate, which is determined by the calving season.
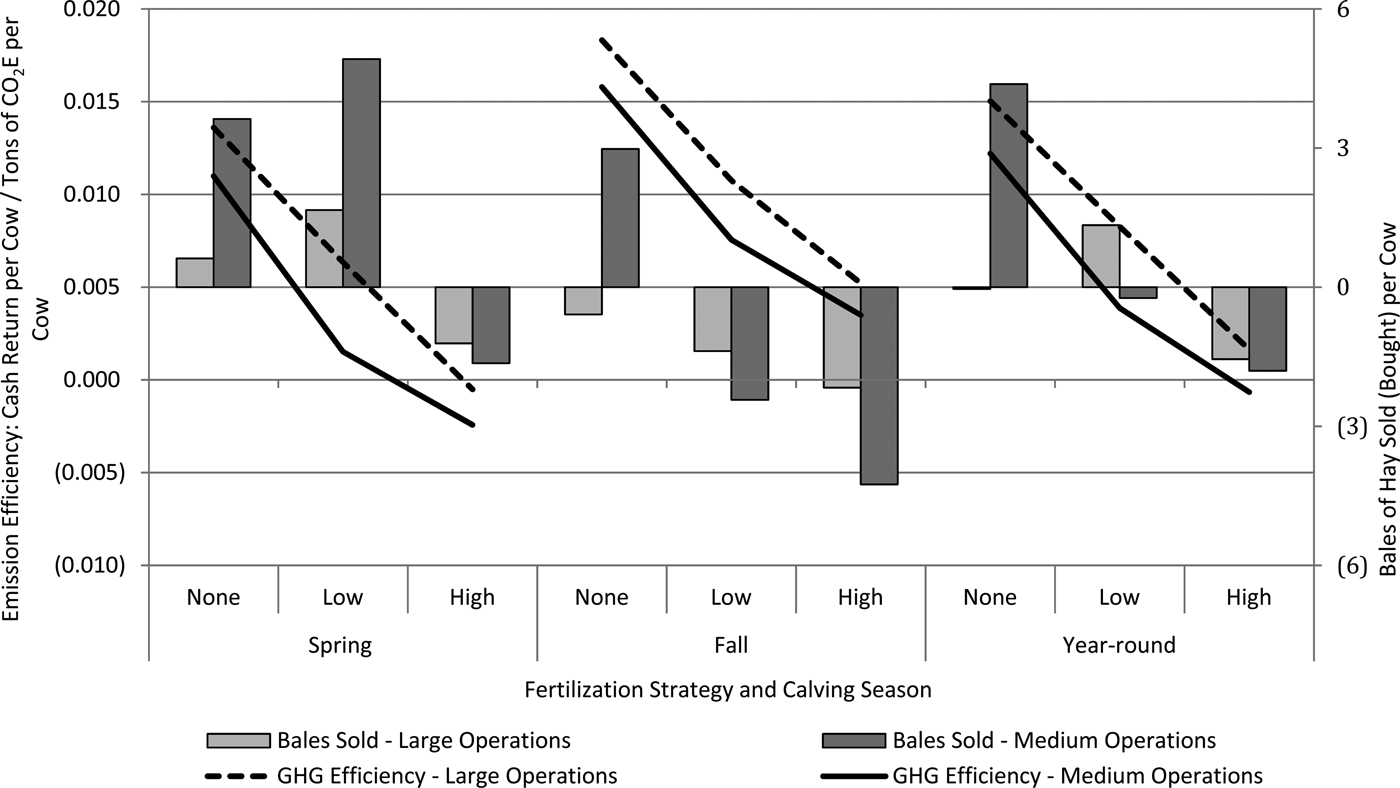
On a whole-farm basis, the lack of profitability of added fertilizer, which led to greater GHG emissions, also led to less GHG efficiency (cash return per cow per ton of emission per cow) as shown in Figure 4. As the degree of fertilization increased, GHG efficiency decreased from a high of $0.018 per ton of CO2E emissions for no fertilization to $0.005 for high fertilization with fall calving on large operations. Given the analysis of eighteen scenarios, the results for the overall relationship between GHG emissions and profitability suggest that the smallest level of emissions coincides with the highest returns.

Figure 4. Estimated Bales Sold per Cow and Emission Efficiency for Large and Medium Operations for Three Calving Seasons and Three Fertilization Strategies
Conclusions
This study compares net return-maximizing production strategies for both large and medium farm operations by monitoring changes in the forage species composition, stocking rate (acres per cow), and weaning age in response to three calving distributions and three fertilization strategies. As in Zilverberg et al. (Reference Zilverberg, Johnson, Weinheimer and Allen2011), this FORCAP analysis shows that relative market prices and full utilization of fixed resources (e.g., equipment, fencing, land, and breeding stock) play a large role in farmers’ decisions regarding the composition of pasture forage, stocking rate, and weaning age. In general, adding fertilizer increases stocking rates and therefore also increases a farm's GHG emissions. However, that practice was unprofitable in all eighteen scenarios analyzed. The stocking rate, forage utilization, herd sire utilization, and efficiencies associated with fewer breeding failures between calving distributions are important factors in both GHG emissions efficiency and cash returns.
A limitation of this research is that spring calving operations may introduce a cool-season forage other than fescue to ameliorate breeding failures from the effects of fescue toxicosis. Use of winter annuals and stockpiling of forage, which are not evaluated in this study, would likely affect the results but exceeded the scope of the analysis. The analysis also assumes a steady-state farm, holding herd size constant with labor supplied by the operator. Differences in hours of labor associated with the production methods included in the study are not tracked so the reader must determine whether the changes in net return are sufficient to warrant changing production strategies. Herd size in most cow-calf operations changes continuously as a function of the availability of forage and hay and of cattle prices. Nonetheless, the comparisons reported here showcase the ramifications of the stocking rate, pasture forage species composition, weaning age, and calving season on returns ceteris paribus.


