- Publisher:
- Cambridge University Press
- Online publication date:
- October 2024
- Print publication year:
- 2024
- Online ISBN:
- 9781009232258

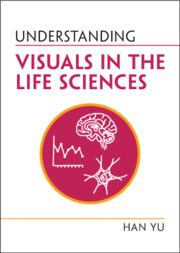
From photographs to micrographs, from the various types of graphs to fun, interactive visuals and games, there are many different forms in which science can be visualised. However, all of these forms of visualisation in the Life Sciences are susceptible to misunderstandings and misinformation. This accessible and concise book demonstrates the misconceptions surrounding the visuals used in popular life science communication. Richly illustrated in colour, this guide is packed with examples of commonly used visual types: photographs, micrographs, illustrations, graphs, interactive visuals, and infographics allowing visual creators to produce more effective visuals that aspire to being both attractive and informative for their target audience. It also encourages non-specialist readers to be more empowered and critical, to ask difficult questions, and to cultivate true engagement with science. This book is an invaluable resource for life scientists and science communicators, and anyone who creates visuals for public or non-specialist readers.
‘Yu’s ‘close reading’ of life science visualizations goes beyond ‘understanding’ by shining a critical lens on common forms: graphs, photographs, animations, video games, etc. She goes further than applying Tufte’s rules for Beautiful Evidence by dissecting authors’ intentions to purposely conceal, divert, deceive, misconstrue, and misrepresent, and she embraces practices of open science, transparency, and aesthetics that will help readers experience ‘the triumph of interpretation’ and empower readers to construct the meaning of heterogeneous, complex data. Her vision is an important counterpoint to the mindless proliferation of chart junk produced by misuse of common software and moves us to embrace communication practices that not only make for better science, but also serve to enhance our appreciation for the importance of maintaining a healthy skepticism of potentially spurious claims.’
John R. Jungck - Center for Bioinformatics and Computational Biology and DENIN Delaware Environmental Institute, USA
‘We humans have been using visuals - maps, charts, graphs, photographs, and other types - to see through the complexity of the world and help us reason better about it for ages. However, we tend to take visuals for granted, or to think that they are ‘objective’ representations of reality, showing it as it truly is. Understanding Visuals in the Life Sciences will disabuse you of those ideas. Visuals are intentional, rhetorical arguments and, as such, their quality may be affected by their creators’ knowledge, skill, or biases. This book shows how to acknowledge and embrace this notion; doing so may help us become better and more ethical designers.’
Alberto Cairo - Knight Chair in Infographics and Data Visualization, University of Miami; author of The Art of Insight
‘Dr. Han Yu crystallizes the current state of knowledge about visual communication in science through her new book, Understanding Visuals in the Life Sciences. Illustrated with key examples both historic and contemporary, she debunks stubborn myths about how publics interact with symbolic rhetoric, while gently urging experts to consider best practices when designing, editing, and producing all genres of visual science communication. This book is a wonderful addition to Dr. Yu’s scholarly contributions to multiple fields, expanding the intended audience to the public through her engaging, straightforward style.’
Kathryn Northcut - Missouri University of Science and Technology
‘Han Yu’s Understanding Visuals in the Life Sciences is comprehensive in its scope of visual communication, richly illustrated, and amazingly accessible and easy to read. Her insights into visualizing science are cogent, clear, and convincing, and they will greatly benefit scientists and their public audiences, as well as communication scholars and their students.’
Charles Kostelnick - Iowa State University
‘… Yu’s new book presents a thorough but concise overview of visuals (illustrations, graphs, charts, photographs, etc.) used in the communication of scientific information by focusing on misconceptions of how these are used in popular life science communication. By taking this approach, the reader is brought to understand not only what doesn’t work and why but also what is more effective. Not surprisingly, the book is rich in full-colour illustrations. It should also be noted that for those who practice the habit of always keeping a book ready-to-hand in a pocket or bag, the 7×5 inch size of all the Understanding Life series makes them very well suited for the purpose.’
John E. Riutta Source: The Well-read Naturalist
 Loading metrics...
* Views captured on Cambridge Core between #date#. This data will be updated every 24 hours.
Usage data cannot currently be displayed.