


1. Introduction
Flow-induced vibration (FIV) response of a non-circular bluff body is sensitive to its geometry (Modir et al. Reference Modir, Ahani, Mohammadkhani and Mousavisani2021; Chen et al. Reference Chen, Ji, Alam, Xu, An, Tong and Zhao2022; Sharma, Garg & Bhardwaj Reference Sharma, Garg and Bhardwaj2022). Flow around prisms with triangular cross-section have received considerable attention as a typical non-circular geometry, representing structures in applications such as ice-covered transmission lines or corroded offshore structures. Extensive investigations have explored flow dynamics past cylinders with triangular cross-sections that have mainly focused on the effects of flow direction as well as the cross-sectional geometry (Kumar De & Dalal Reference Kumar De and Dalal2006, Reference Kumar De and Dalal2007; Bao, Zhou & Zhao Reference Bao, Zhou and Zhao2010). In a numerical study by Tu et al. (Reference Tu, Zhou, Bao, Han and Li2014), the two-dimensional (2-D) flow around a stationary cylinder was investigated for the range of angles of attack of  $\alpha =0^{\circ }\unicode{x2013}60^{\circ }$ and Reynolds-number range of
  $Re=50\unicode{x2013}160$. The findings of their research indicated that the location of the separation point varied depending on the angle of attack. Specifically, for angles less than
  $30^{\circ }$, the separation point was found to shift with changes in the Reynolds number, whereas at higher angles, the separation point consistently resided at the rear corner, irrespective of the Reynolds number. Later comprehensive studies examined the dependency of the vortex shedding patterns on the Reynolds number and angles of attack in the wake of the triangular cylinder through numerical simulations (Chanthanasaro Reference Chanthanasaro2020; Chanthanasaro & Boonyasiriwat Reference Chanthanasaro and Boonyasiriwat2021). In addition, vortex shedding pattern around and in the wake of the triangular cylinder was analysed to understand the influence of the cylinder's orientation on the precise position of separation points, and the size of the recirculation region (Ng et al. Reference Ng, Vo, Hussam and Sheard2016; Ng, Vo & Sheard Reference Ng, Vo and Sheard2018).
It is well understood that the FIV response of a rigid triangle prism is significantly influenced by its orientation with respect to the incoming flow (angle of attack) that can also define the after-body geometry of the system (Seyed-Aghazadeh, Carlson & Modarres-Sadeghi Reference Seyed-Aghazadeh, Carlson and Modarres-Sadeghi2017; Chen et al. Reference Chen, Ji, Xu, Zhang and Wei2020; Liu et al. Reference Liu, Gui, Wu, Yang, Tu and Jiang2020). However, the available studies on the FIV of non-circular geometries have mainly been performed on rigid structures, and there is limited research on the FIV of flexible triangular cylinders. Therefore, the aim of this study is to investigate the FIV response of a flexible triangular cylinder and to provide a better understanding of the associated flow field characteristics. This knowledge can be further extended to facilitate the development of novel design strategies for FIV control in flexible triangular cylinder applications.
When a rigid triangular prism is flexibly mounted and allowed to oscillate in the cross-flow direction, its FIV response can be classified as either vortex-induced vibration (VIV) or galloping with a large amplitude and low oscillation frequency, depending on the angle of attack and flow velocity (Seyed-Aghazadeh et al. Reference Seyed-Aghazadeh, Carlson and Modarres-Sadeghi2017; Chen et al. Reference Chen, Ji, Xu, Zhang and Wei2020; Liu et al. Reference Liu, Gui, Wu, Yang, Tu and Jiang2020). Both experimental and numerical investigations have been conducted on such systems to highlight the effects of the angle of attack on the system's FIV response (Alonso, Meseguer & Pérez-Grande Reference Alonso, Meseguer and Pérez-Grande2005; Alonso & Meseguer Reference Alonso and Meseguer2006; Alonso, Meseguer & Pérez-Grande Reference Alonso, Meseguer and Pérez-Grande2007; Alonso, Sanz-Lobera & Meseguer Reference Alonso, Sanz-Lobera and Meseguer2012). In a numerical study on the FIV of an equilateral triangular prism (Chen et al. Reference Chen, Ji, Xu, Zhang and Wei2020), the effect of the angle of attack on the response type has been studied at the Reynolds number of  $Re=200$ and the mass ratio of
  $m^*=2$. The mass ratio was defined as the ratio between the mass of the oscillating body to the mass of the displaced fluid. The study showed that based on the prism's angle of attack, the FIV response type could be categorised into three regimes of VIV, galloping and the combined VIV and galloping. In another study, the FIV of a flexibly mounted triangular prism with the mass ratio of
  $m^*=9.24$ has been studied through a series of water tunnel experiments, covering the response in the Reynolds number range of
  $Re=490\unicode{x2013}2700$ (Seyed-Aghazadeh et al. Reference Seyed-Aghazadeh, Carlson and Modarres-Sadeghi2017). The effect of the angle of attack and flow velocity on the FIV response was studied through the structural response of the prism together with the vortex dynamics and shedding patterns in the wake of the prism. The results showed that for angles of attack smaller than
  $25^{\circ }$ no oscillation was observed. At the higher angles of attack in the range of
  $30^{\circ }\unicode{x2013}35^{\circ }$, the FIV response was of the VIV-type for the low flow velocity ranges and transitioned to galloping at higher flow velocities. Beyond the angle of attack of
  $35^{\circ }$, the FIV response observed was of the galloping type. In a numerical simulation of the flow past a triangular cylinder (Liu et al. Reference Liu, Gui, Wu, Yang, Tu and Jiang2020), the flow separation over the fixed triangular cylinder was categorised into three models according to the flow state based on the angle of attack: the separation bubble model, the edge separation model and the attached flow model. In this study, the effect of the angle of attack on the lift, drag and Strouhal number was also investigated.
While the available studies on the FIV of flexibly mounted prisms are helpful for our fundamental understanding of the FIV observed for such systems, most of the studies do not take into account any possible spanwise flexibility of the structure that can potentially affect the response of the system. FIV of flexible structures has been observed in many real-world applications, in ocean industries such as those in marine risers and mooring lines for floating offshore structures, and in engineering structures such as long-span cable-stayed bridges. Among FIV response studies that have taken into consideration the spanwise flexibility of the structure, a circular cross-section has been studied as a canonical geometry. In these studies, the flexible circular cylinder is placed in uniform flow, free to oscillate in the flow direction (inline [IL]) and perpendicular to the flow direction (cross-flow [CF]). The complex dynamic response of the flexible circular cylinder coupled with their surrounding flow has been investigated to characterise the fundamentals of fluid–structure interaction response for such systems. The general response of the flexible circular cylinder has been found to be of VIV type at which the vibration is induced by the vortices shed behind the cylinder (Bearman Reference Bearman1984; Sarpkaya Reference Sarpkaya1995; Khalak & Williamson Reference Khalak and Williamson1999; Govardhan & Williamson Reference Govardhan and Williamson2002; Jauvtis & Williamson Reference Jauvtis and Williamson2004; Sarpkaya Reference Sarpkaya2004; Dahl, Hover & Triantafyllou Reference Dahl, Hover and Triantafyllou2006; Dahl et al. Reference Dahl, Hover, Triantafyllou, Dong and Karniadakis2007; Raghavan & Bernitsas Reference Raghavan and Bernitsas2011). Although VIV studies of elastically mounted rigid cylinders with limited degrees of freedom in the CF and IL directions have facilitated our understanding of VIV occurring in a more complex case of flexible cylinders, the VIV response of a flexible cylinder can undergo complex large amplitude oscillations at higher vibrational modes due to the additional variables associated with the dynamics of flexible systems. Some of such complexities in the FIV response of a flexible structure cannot be understood or predicted by rigid flexibly mounted model studies. Through experimental (Chaplin et al. Reference Chaplin, Bearman, Huarte and Pattenden2005; Trim et al. Reference Trim, Braaten, Lie and Tognarelli2005; Vandiver et al. Reference Vandiver, Marcollo, Swithenbank and Jhingran2005; Lie & Kaasen Reference Lie and Kaasen2006; Huera-Huarte & Bearman Reference Huera-Huarte and Bearman2009; Seyed-Aghazadeh, Edraki & Modarres-Sadeghi Reference Seyed-Aghazadeh, Edraki and Modarres-Sadeghi2019; Seyed-Aghazadeh et al. Reference Seyed-Aghazadeh, Benner, Gjokollari and Modarres-Sadeghi2021b), and numerical studies (Evangelinos, Lucor & Karniadakis Reference Evangelinos, Lucor and Karniadakis2000; Bourguet, Karniadakis & Triantafyllou Reference Bourguet, Karniadakis and Triantafyllou2011a; Bourguet et al. Reference Bourguet, Modarres-Sadeghi, Karniadakis and Triantafyllou2011b; Bourguet, Karniadakis & Triantafyllou Reference Bourguet, Karniadakis and Triantafyllou2013; Zanganeh & Srinil Reference Zanganeh and Srinil2016), excitation of mono- and multi-frequency modes and transition from lower-mode to higher-mode excitation have been observed in the VIV response of such flexible cylinders. In addition, the traveling wave observed in the VIV response of flexible cylinders (Marcollo et al. Reference Marcollo, Eassom, Fontaine, Tognarelli, Beynet, Constantinides and Oakley2011; Bourguet, Lucor & Triantafyllou Reference Bourguet, Lucor and Triantafyllou2012; Seyed-Aghazadeh et al. Reference Seyed-Aghazadeh, Benner, Gjokollari and Modarres-Sadeghi2021b; Mousavisani, Castro & Seyed-Aghazadeh Reference Mousavisani, Castro and Seyed-Aghazadeh2022a) adds to the complexity of the response that cannot be characterised in simpler models of a flexible cylinder, i.e. flexibly mounted cylinder studies with one or two degrees of freedom.
While the FIV of flexibly mounted prismatic structures and flexible circular cylinders are relatively well studied, the FIV of a flexible cylinder with a triangular cross-section is not well understood. The dynamic response of a flexible triangular cylinder has been investigated in a few works in this area, mainly numerically. The response of a triangular flexible cylinder was analysed at fixed Reynolds numbers for low ( $Re=100$ and 200) (Zhu et al. Reference Zhu, Ping, Wang, Bao, Zhou and Han2019) and high (
 $Re=3900$) (Zhu et al. Reference Zhu, Ping, Wang, Bao, Zhou, Wei and Han2020) Reynolds numbers. For the angle of attack of
  $60^{\circ }$, the FIV response type was VIV for the Reynolds number of
  $Re=100$, while at the Reynolds number of
  $Re=200$, the response type was a combination of strong VIV and weak galloping (Zhu et al. Reference Zhu, Ping, Wang, Bao, Zhou and Han2019). It was also found that the energy transfer from the flow to the cylinder was higher for the flexible triangular cylinder compared with the flexible circular cylinder with the same system parameters (Zhu et al. Reference Zhu, Ping, Wang, Bao, Zhou and Han2019). In another study, the response of a flexible triangular cylinder was investigated numerically at a subcritical Reynolds number of
  $Re=3900$ (Zhu et al. Reference Zhu, Ping, Wang, Bao, Zhou, Wei and Han2020). The study showed that the amplitude of oscillation for the triangular cylinder was significantly larger than that of the circular cylinder with the same system parameters. The observed FIV response was divided into two independent types, where the low-frequency response was related to the galloping and the high-frequency response was related to the vortex shedding.
However, these studies have been limited to investigating the FIV at only limited angles of attack and have only studied the response in the CF direction, without addressing the oscillations occurring in the IL direction, as well as the cylinder's possible rotational response, as the flexible cylinder has a degree of freedom in the torsional direction. These additional degrees of freedom can potentially play important roles in the FIV response of the system, which are not well studied or understood at this point. Therefore, in this study, we aim to investigate the FIV response of a flexible triangular cylinder by analysing the structural response subjected to flow forces in the CF and IL directions, taking into account the effects of the flexible cylinder's capability to deform or oscillate in the IL and torsional degrees of freedom. The response is studied for three angles of attack of  $\alpha =0^{\circ }$,
  $30^{\circ }$ and
  $60^{\circ }$. Due to the capability of the flexible cylinder to deform or oscillate in the torsional degree of freedom, the ‘modified angle’ of attack during the oscillation can vary both spatially (i.e. along the cylinder's spanwise length at a specific time) and temporally (i.e. over time at a specific location along the spanwise length of the cylinder). This variation in the angle of attack throughout time and space can further complicate the system's FIV response. The fully coupled fluid–structure interaction response, that is the interaction between the structural response and the flow field in the wake of the structure, will be studied here through a series of water tunnel experiments. The results of this study are expected to provide insights into the FIV response of flexible triangular cylinders and the role of additional degrees of freedom such as torsional motion. These insights can help improve the design and performance of structures subject to FIV, such as offshore platforms, pipelines and wind turbines.
In what follows, we present the experimental set-up and methodology used to capture the structural response and conduct flow field measurements in § 2. Section 3 provides a detailed analysis of the structural response, with three subsections dedicated to discussing the observed behaviour for each angle of attack. In § 4, we present the qualitative and quantitative flow visualisation results obtained from the experiments. Finally, we draw our conclusions in § 5, which summarises our findings and discusses their implications for understanding the FIV of flexible triangular cylinders.
2. Experimental set-up and data collection
The experiments were conducted in a recirculating water tunnel, which had a test section of  $0.45~\mathrm{m} (\kern0.7pt y)\times 0.45\ \mathrm {m}(z)\times 1.5\ \mathrm {m}(x)$ and a turbulence intensity of less than 1 % for up to a velocity of
  $1\ \mathrm {m}\ \mathrm {s}^{-1}$. A flexible cylinder with an equilateral triangular cross-section and a side length of
  $D = 0.01\ \mathrm {m}$ was tested. The cylinder had an aspect ratio of
  $L/D = 30$, where
  $L$ is the cylinder's length. The cylinder was fully submerged and horizontally placed in the test section of the water tunnel (figure 1). The cylinder was cast in-house using flexible silicone rubber material (OOMOOTM 30, Smooth-on, Inc.), and the resulting low flexural rigidity of the cylinder made it possible for high structural modes of oscillations to be excited along the short spanwise length of the cylinder. The elasticity modulus of the cast cylinder was
  $E=300\ \mathrm {kPa}$, which was obtained experimentally following the technique by Paidoussis (Reference Paidoussis2014). The cylinder's mass ratio was calculated as
  $m^*= 4m/{\sqrt {3} \rho D^{2} L} = 1.5$, where
  $m$ is the mass of the cylinder and
  $\rho$ is the fluid density.

Figure 1. Schematic of the (a) experimental set-up and (b) triangular cylinder indicating the angles of attack ( $\alpha$) tested in this study.
The cylinder was fixed at one end and connected to the force sensor, to adjust the initial tension through a pulley, at the other end. At each end, there is an endplate featuring a smoothly curved profile designed to minimise the flow's three-dimensionality, resulting in a blockage ratio of 4 %. The system's bending and torsional natural frequencies and damping ratio were measured using free decay tests, employing a technique established previously and discussed in the literature (Cen Reference Cen2015; Seyed-Aghazadeh et al. Reference Seyed-Aghazadeh, Benner, Gjokollari and Modarres-Sadeghi2021b). The damping ratio of the system in the air, obtained using free decay tests, was calculated to be  $\zeta =0.003$. The non-dimensional flow velocity, known as the reduced velocity of the incoming flow, is introduced to provide a normalised value that incorporates both structural and fluid properties, enabling a unified parameter for analysing interactions between flow and structural dynamics of the system. The reduced velocity is calculated as
  $U^* = U / (D \times f_0)$, where
  $U$ is the flow velocity and
  $f_0$ is the system's first bending natural frequency in water. The natural frequency of the flexible cylinder placed in flow can be calculated as (Obasaju, Ermshaus & Naudascher Reference Obasaju, Ermshaus and Naudascher1990)
 \begin{equation} f_n = \sqrt{\frac{Tn^2}{4ML^2} + \frac{EI{\rm \pi}^2n^4}{4ML^4}}. \end{equation}
 In this equation,  $T$ represents the tension acting along the length of the cylinder, whereas
  $M$ denotes the combined mass of the cylinder (
 $m$) and the added mass (
 $m_a$) per unit length, where
  $M = m + m_{a}$. The variable
  $f_{n}$ represents the natural frequencies corresponding to various modes of the system. In the context of the current experimental configuration, where a pre-tension of
  $T=0.2$ N is applied to the cylinder, the calculated values for the first and second terms in (2.1) for the first mode yielded a ratio of 57. This ratio highlights a predominant influence of the first term, associated with tension, over the second term, associated with flexural rigidity. Consequently, the second term can be considered negligible, affirming that the cylinder operates primarily in a tension-dominated regime.
To measure the dynamic spanwise structural response of the flexible cylinder, the cylinder was marked with uniformly distributed black dots at its two sides along the length with  $0.04 \pm 0.001$ m intervals. A total of seven points were marked along the length of each side of the cylinder. These dots’ oscillations were captured in the CF and IL directions using two synchronised high-speed cameras (Victorem 32B216MCX). The captured videos were input to a dynamic tracking software (Cabrillo Tracker) that created synchronised displacement time histories in the CF and IL directions at these discrete points. With calculations based on the dimensions of black marked feature pixels, the motion tracking software maintains an error margin of under 2 % in both the IL and CF directions by utilising cross-correlation between consecutive images recorded by high-speed cameras to precisely trace the positions of the cylinder markings. The time-resolved displacements of these discrete data points were used to reconstruct the cylinder's spanwise continuous response. The reconstruction method used here was based on the modal analysis technique by implementing the modal assurance criterion (MAC). Determining the mode shapes through the finite-element analysis (Solidworks frequency analysis) for the excited modes yields an approximate response reconstruction of the cylinder's oscillation. This response reconstruction technique can be defined in matrix form as a linear combination of the cylinder's mode shapes. For instance, the CF response can be written in matrix form as
 \begin{equation} \boldsymbol{Y}(z,t)=\boldsymbol{\phi}(z)\boldsymbol{Y}_{{M}}(t), \end{equation}
where  $\boldsymbol {Y}(z,t)=[\boldsymbol {y}(z_{1},t), \boldsymbol {y}(z_{2},t),\ldots ]$ is the matrix of measured displacements in the CF direction at each point along the cylinder's length.
  $\boldsymbol {\phi }(z)=[\boldsymbol {\phi }_{1}, \boldsymbol {\phi }_{2},\ldots ]$ is the displacement modal shape matrix at which each column represent the mode shapes at each point along the cylinder's length. Here
  $\boldsymbol {Y}_{M}=[\boldsymbol {y}_{M1}, \boldsymbol {y}_{M2},\ldots ]$ is the modal contribution matrix, in which each row shows the contribution of each mode to the overall response. At this step, the MAC is applied to identify the dominant structural modes that contribute to the response reconstruction using localised measurement points. The modal expansion theorem is then employed in conjunction with MAC to obtain the response of the system at any arbitrary point along the cylinder. This response reconstruction technique was recently introduced in Seyed-Aghazadeh & Modarres-Sadeghi (Reference Seyed-Aghazadeh and Modarres-Sadeghi2016) and has been demonstrated to accurately reconstruct the FIV response of flexible circular cylinders. Further details of this technique can be found in previous publications (Seyed-Aghazadeh & Modarres-Sadeghi Reference Seyed-Aghazadeh and Modarres-Sadeghi2016, Reference Seyed-Aghazadeh and Modarres-Sadeghi2018; Seyed-Aghazadeh et al. Reference Seyed-Aghazadeh, Edraki and Modarres-Sadeghi2019; Seyed-Aghazadeh, Anderson & Dulac Reference Seyed-Aghazadeh, Anderson and Dulac2021a; Mousavisani et al. Reference Mousavisani, Castro and Seyed-Aghazadeh2022a). It is essential to highlight that the structural response, denoted as the oscillation in the CF direction, results from a combination of two distinct phenomena: first, the displacement of the cylinder along the
  $y$-axis (resulting in bending within the
  $yz$ plane) and, second, the torsion of the cylinder around its central axis, projected onto the
  $yz$ plane. In cases characterised by multi-frequency responses, where both bending and torsional frequencies contribute to the CF oscillation, their distinction can be established by examining their frequency components and comparing them to the bending and torsional natural frequencies acquired through free decay tests.
Figure 2 shows the temporal evolution and corresponding frequency spectrum of each mode that contributes to the system's response in a sample case at  $U^*=11.88$ for the angle of attack of
  $\alpha =60^{\circ }$. These modal contributions are the row vectors,
  $y_{M}$, as introduced in (2.2). The first dominant mode, that is the cylinder's first bending mode and its frequency content, is shown in figure 2(a,b). The second and third row shows the very small contribution of the second and third bending modes of the cylinder, respectively. The fourth row shows the contributions from the first torsional mode to the response of the system, as shown in figure 2(g,h). The analysis shows that the first bending mode is the dominant mode contributing to the response of the system in comparison with the other modes. In addition, the torsional mode exhibits a contribution to the response that is comparable in magnitude to the first bending mode's contribution, while the contributions of the second and third bending modes are notably weaker. These observations are consistent with the findings derived from the analysis of spanwise frequency and displacement for the cylinder within this specific sample case, as discussed later in § 3.4 (figure 9b i–iii).

Figure 2. Contribution of the first bending (a,b), second bending (c,d), third bending (e,f) and torsional (g,h) modes to the system's response for  $U^*=11.88$ at the angle of attack of
  $\alpha =60^{\circ }$, along with their corresponding frequency contents.
The FIV response of the triangular cylinder in both the CF and IL directions was measured over a reduced velocity range of  $U^*=0.9\unicode{x2013}16.27$, corresponding to a Reynolds number range of
  $Re=364\unicode{x2013}3600$. The effect of three different angles of attack (
 $\alpha =0^{\circ }$,
  $30^{\circ }$ and
  $60^{\circ }$) on the FIV response of the cylinder was studied. In addition to the structural measurements of the cylinder, the flow field around the cylinder was captured, synchronised with the dynamic response of the structure's oscillation, using qualitative and quantitative flow visualisation techniques to study vortex dynamics in the wake of the structure.
For qualitative flow visualisation, hydrogen bubbles (HB) were generated through the electrolysis of water using a platinum wire with a diameter of  $0.0508\ \mathrm {mm}$ strung across the test section in the direction of the flow and perpendicular to the spanwise length of the cylinder. The wire served as an anode, whereas a
  $50\unicode{x2013}100\ \mathrm {V}$, 2 A power supply positively charged a graphite plate to serve as a cathode. The potential between the two caused a build-up of HB on the platinum wire, which separated from the wire once their diameter exceeded the wire diameter to create a bubble film. The bubble film was used to view the wake structure, which was recorded using a high-speed camera (Victorem 32B216MCX) at a rate of 200 frames per second at a 2-D plane along the span of the cylinder. The bubble sheet was illuminated using LED lighting mounted on each side of the test-section at an angle to ensure uniform lighting conditions.
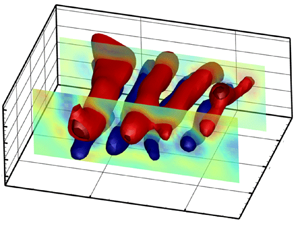
For quantitative flow measurement, volumetric particle tracking velocimetry (PTV) was used to measure the flow field dynamics in the wake of the cylinder at sample reduced velocities. The flow field dynamics were measured using a state-of-the-art three-dimensional (3-D) Lagrangian PTV system (Shake-the-Box, LaVision Inc., Ypsilanti, MI, USA) in a time-resolved fashion. Seeding particles, which were polyamide high-quality hollow glass spheres of  $60\ \mathrm {\mu }{\rm m}$ nominal diameter, were used with a concentration of approximately
  $0.02\ \mathrm {g}\ \mathrm {L}^{-1}$. The particles were illuminated by a
  $300 \times 100\ \mathrm {mm}^2$ LED (FLASHLIGHT
  $300$ array, LaVision) with 72 high-power LEDs operated above the nominal LED current to generate short pulses at very high light intensities. The recording system included four pre-aligned digital cameras in the Minishaker box equipped with
  $16\ \mathrm {mm}$ lenses, which were used to capture images at a
  $120$ Hz trigger rate at full resolution (
 $1984\times 1264$ pixels).
The captured volume had a dimension of  $0.26\ \mathrm {m} \times 0.17\ \mathrm {m} \times 0.1\ \mathrm {m}$ (
 $x,y,z$), translating to a volume of
  $26D \times 17D \times 10D$, where
  $D$ is the side length of the cylinder. Multiple separate subsets of 1500 images, corresponding to approximately 12 s of measurement (which cover the minimum of four cycles of cylinder oscillation), were acquired for each sample reduced velocity. A LaVision programmable timing unit (PTU) controlled by DaVis 10 acquisition software was used to trigger the flashlight and cameras simultaneously. Further details regarding the calibration and the ‘shake the box’ algorithm for the 3-D Lagrangian PTV can be found in Schanz, Gesemann & Schröder (Reference Schanz, Gesemann and Schröder2016), Chen, Wu & Cheng (Reference Chen, Wu and Cheng2019) and Mousavisani et al. (Reference Mousavisani, Chowdhury, Samsam-Khayani, Samandari and Seyed-Aghazadeh2022b).
3. Structural response of the system
3.1. Overview of the cylinder's vibration response
This section investigates the FIV response of the triangular cylinder in terms of the amplitude and frequency of oscillations. The spanwise displacements of the flexible triangular cylinder were measured in the CF and IL directions at three different angles of attack of  $\alpha = 0^{\circ }$,
  $30^{\circ }$, and
  $60^{\circ }$. At each angle of attack, the flow velocity was increased from zero in small steps to cover the FIV response of the system in the reduced velocity range of
  $U^*=0.9\unicode{x2013}16.27$. The spanwise oscillations of the cylinder in the CF and IL directions were obtained using the method discussed in § 2.
Figure 3 compares the overall non-dimensional amplitude of oscillations in both the CF (figure 3a) and IL (figure 3b) directions for each angle of attack of the cylinder. The non-dimensional amplitude of oscillation is obtained by considering the root mean square (r.m.s.) of the reconstructed data along the span, which is then normalised by the cylinder's side length. The results show that the non-dimensional amplitude of oscillation in the CF direction for the cylinder at an angle of attack of  $\alpha = 0^{\circ }$, in which the sharp edge of the cylinder faces the flow, is relatively smaller than those observed for higher angles of attack of
  $\alpha = 30^{\circ }$ and
  $\alpha = 60^{\circ }$ over the entire range of the reduced velocities tested. This behaviour can be attributed to the lack of vortex–after-body interaction when compared with other angles of attack. While geometric symmetry and fixed separation points are observed at both
  $\alpha = 0^{\circ }$ and
  $\alpha = 60^{\circ }$, the likelihood of vortex–after-body interaction significantly increases at
  $\alpha = 60^{\circ }$ due to the presence of a triangular side length extending beyond the separation point. This phenomenon has been documented in prior studies on FIV in prismatic structures, as noted in works such as Nemes et al. (Reference Nemes, Zhao, Lo Jacono and Sheridan2012) and Massai et al. (Reference Massai, Zhao, Jacono, Bartoli and Sheridan2018). The amplitude of oscillation of the cylinder at the angles of attack of
  $\alpha = 30^{\circ }$ and
  $60^{\circ }$ shows that the amplitudes increase and reach a peak value at reduced velocity before
  $U^* < 10$ and then decrease. The amplitude of oscillation in the IL direction shows that it increases by increasing the reduced velocity for all three angles of attack. At each angle of attack, the amplitude of oscillations in the IL direction is smaller compared with those in the CF direction, particularly at lower reduced velocity ranges, prior to the response reaching its peak value in CF oscillations.

Figure 3. Non-dimensional amplitude (r.m.s.) of oscillation plotted against reduced velocity for different angles of attack ( $\alpha = 0^{\circ }, 30^{\circ }, 60^{\circ }$) in the CF (a) and IL (b) directions.
However, the overall trend in the amplitude of oscillation is very different from those observed in the FIV studies of a rigid triangular cylinder, which is free to oscillate in the CF direction (Seyed-Aghazadeh et al. Reference Seyed-Aghazadeh, Carlson and Modarres-Sadeghi2017). For example, at the high angle of attack of  $\alpha = 60^{\circ }$, while it has been shown that the rigid cylinder undergoes unbounded large-amplitude galloping-type oscillations, here in our study of the flexible triangular cylinder, the amplitude of oscillations is limited and does not exceed values larger than approximately 0.7 times the side length of the triangular cross-section. Similarly, at the low angle of attack of
  $\alpha = 0^{\circ }$, while the rigid triangular cylinder results have shown that the cylinder remains stable and no oscillation has been observed in the CF direction for a flexibly mounted rigid cylinder, here in our study, the cylinder undergoes relatively large amplitudes of oscillations at higher reduced velocities. Our understanding is that such differences can be attributed to multiple factors, such as the spanwise flexibility of the cylinder, the flexible cylinder's boundary conditions, the mean displacement in the CF and IL directions, and the multi-frequency nature of the FIV response that promotes the excitation of higher modes of oscillations that are all unique and different from those of previous studies.
For example, the fixed boundary conditions and the potential large spanwise bending of the cylinder, due to the mean displacement in the CF and IL directions, can cause a breaking of the system's symmetry and the flow around it. As a result, the modified angle of attack of the cylinder and the after-body geometry can be altered, leading to oscillations in the torsional degree of freedom, even for initially symmetric angles of attack, such as  $\alpha = 0^{\circ }$ and
  $\alpha = 60^{\circ }$. When the angle of attack is changed from its initial state, the wake of the cylinder can display new forms of vortex shedding patterns, which may affect the system's response differently. Our study observes and discusses these effects in the following sections. The excitation of higher modes and fixed boundary conditions at both ends presumably is the reason for the smaller amplitude of oscillation, distinguishing the FIV response of the flexible and rigid triangular cylinder from the unbounded increase in amplitude previously observed in the galloping response of rigid, flexibly mounted triangular prisms (Seyed-Aghazadeh et al. Reference Seyed-Aghazadeh, Carlson and Modarres-Sadeghi2017).
In the following sections, we examine the FIV response of the flexible triangular cylinder in more detail at each angle of attack over the tested reduced velocity range. In addition, we select three response samples at different reduced velocities for each angle of attack to analyse and highlight the characteristics of each response region in greater detail.
3.2. Response characteristics for the angle of attack of  $\alpha =0^{\circ }$

This section investigates the CF and IL amplitude and frequency of the cylinder's oscillations at an angle of attack of  $\alpha =0^{\circ }$. Figure 4 displays the FIV response of the system at this angle of attack. The first row plots show the non-dimensional amplitude of oscillations, the second row plots show the contour plot of the spanwise non-dimensional frequency of oscillations and the third row plots show the non-dimensional mean displacement vs the reduced velocity in the CF (left column) and IL (right column) directions. To calculate the non-dimensional amplitude of oscillation, the r.m.s. of the reconstructed data along the span is normalised by the cylinder's side length. The frequency of oscillation is obtained by applying the fast Fourier transform (FFT) to the cylinder's spanwise displacement and is normalised by the cylinder's first bending frequency in water. The frequency content of the response at each reduced velocity is plotted for the modes contributing to at least 10 % of the maximum amplitude of oscillations. The non-dimensional mean displacement is calculated by taking the r.m.s. of the spanwise mean displacement of the cylinder at each reduced velocity, measured from the neutral position of the cylinder when placed at still water, and is then normalised by the cylinder's side length.

Figure 4. Non-dimensional amplitude (r.m.s.), frequency and mean value of oscillation at the angle of attack of  $\alpha =$ 0
 $^{\circ }$ plotted vs the reduced velocity in the CF direction (a–c) and IL direction (d–f).
Figure 4(a) demonstrates that the FIV response of the triangular cylinder at this angle of attack can be categorised into two different types. In the first region, with a limited reduced velocity range of  $U^* = 4.73\unicode{x2013}10.77$, small-amplitude oscillations occur. The cylinder starts to oscillate in the CF direction at a reduced velocity of
  $U^* = 4.73$ with very low amplitudes, and the non-dimensional amplitude of oscillations increases with an increasing reduced velocity. It reaches its maximum value of
  $y^* = 0.05$ at a reduced velocity of
  $U^*=9.60$, then decreases to around
  $y^*=0.02$ at a reduced velocity of
  $U^*=10.77$. These oscillations over a limited range of reduced velocities resemble those of a VIV-type response. The FIV response observed in the second region resembles those of a galloping-type response, where the amplitude of oscillations of the cylinder increases as the reduced velocity values increase. In this region, the maximum non-dimensional amplitude of oscillations reaches values of about
  $y^* = 0.22$ at the maximum reduced velocity tested of
  $U^* = 16.27$.
The frequency content plot for the CF oscillations presented in figure 4(b) reveals that when the oscillations begin at the reduced velocity of  $U^*=4.73$, the frequency of oscillations is close to the natural frequency of the cylinder's first bending mode. As the amplitude of oscillations increases and reaches its maximum value at the reduced velocity of
  $U^*=9.68$, the oscillation frequency takes values close to the natural frequency of the cylinder's second bending mode. In the entire range of reduced velocity for which the FIV response follows a VIV-type response (
 $U^*=4.73\unicode{x2013}10.77$), the frequency content of the response shows a mono-frequency oscillation. The frequency of oscillations follows the Strouhal line, which was measured for a rigid stationary triangular cylinder at this angle of attack (Seyed-Aghazadeh et al. Reference Seyed-Aghazadeh, Carlson and Modarres-Sadeghi2017) and is shown with a dashed line in this figure. Unlike the VIV response of a flexible circular cylinder, in which the non-dimensional frequency of the oscillation locks into a specific frequency at each mode of oscillation (Mousavisani et al. Reference Mousavisani, Castro and Seyed-Aghazadeh2022a), the oscillation frequency of the triangular cylinder at
  $\alpha =0^\circ$ follows the Strouhal line within the VIV-type response region. However, it might be expected that no oscillations would occur at this angle of attack for a triangular cylinder, which has two fixed separation points and a flat surface after-body in the downstream (figure 1b), because of the lack of interaction between the after-body and vortex/shear layers in the downstream of the cylinder. This expectation is consistent with the FIV response of rigid triangular cylinders studied at high Reynolds numbers and mass ratios of
  $m^*=9.24$ and
  $2.7$, respectively (Seyed-Aghazadeh et al. Reference Seyed-Aghazadeh, Carlson and Modarres-Sadeghi2017; Tamimi et al. Reference Tamimi, Naeeni, Zeinoddini, Seif and Pirooz2019). However, VIV-type responses with amplitude of oscillation and a linear increase in oscillation frequency, similar to those observed in the present study, have been reported in recent FIV studies (Chen et al. Reference Chen, Ji, Xu, Zhang and Wei2020, Reference Chen, Ji, Alam, Xu, An, Tong and Zhao2022) of prisms with fixed separation points but without an after-body. For instance, rigid triangular cylinders exhibit this type of response when the sharp edge faces the incoming flow. It has been shown that the fixed separation points for the flow around the cylinder at this angle of attack (
 $\alpha =0^{\circ }$) result in a constant location of the separation point, even during cylinder oscillation. Thus, the shedding frequency during oscillation (the same as the oscillation frequency in this VIV-type response) remains the same as the Strouhal number at each reduced velocity, and linearly increases with the reduced velocity. Similarly, studies on D-section prisms show this behaviour when the curve side faces the incoming flow with a mass ratio of
  $m^*=2$ and
  $4$, and Reynolds numbers of
  $Re=200$ and
  $100$, respectively (Chen et al. Reference Chen, Ji, Alam, Xu, An, Tong and Zhao2022). In this study, the oscillation frequency follows the Strouhal line, indicating that the frequency of oscillation is the same as the shedding frequency of the rigid fixed cylinder at each reduced velocity. In § 4.2, we present a sample case in this range of reduced velocity, where the vortex shedding frequency is the same as the oscillation frequency, which follows the Strouhal line. This observation confirms that the response type is VIV.
The present study and others (Chen et al. Reference Chen, Ji, Xu, Zhang and Wei2020, Reference Chen, Ji, Alam, Xu, An, Tong and Zhao2022) demonstrated that an after-body is unnecessary for initiating the oscillation, which is also confirmed by Zhao, Hourigan & Thompson (Reference Zhao, Hourigan and Thompson2018). Instead, similar to observations in Chen et al. (Reference Chen, Ji, Alam, Xu, An, Tong and Zhao2022) for FIV of a D-section prism at the angle of  $0^{\circ }$, where the curved side faces the flow with no after-body in the downstream, for a triangular cylinder, the oscillation is likely initiated by viscous lift on the fore-body. In the D-section prism study (Chen et al. Reference Chen, Ji, Alam, Xu, An, Tong and Zhao2022), the authors showed that large-amplitude vibrations of the prism in low-
 $Re$ flow are not related to the interaction of the shear layer/vortex and after-body. They decomposed the lift in phase with the prism velocity, which energises the VIV of the D-section prism into the pressure and viscous components. They showed that, in each cycle, the viscous component promotes while the pressure component dampens the prism vibration. They mentioned that the viscous lift, which integrates the viscous shear stress on the prism surface induced by the vortical flow, is the reason for the sustenance of the vibration. This finding is consistent with that of Menon & Mittal (Reference Menon and Mittal2021), which suggests that the vibration for a single cylinder is sustained by the vorticity associated with the boundary layer over the surface. Thus, the viscous lift on the fore-body is equally significant in exciting the vibrations of a D-section prism in low-Re flow (Chen et al. Reference Chen, Ji, Alam, Xu, An, Tong and Zhao2022).
In the second reduced velocity region ( $U^*=11.33\unicode{x2013}16.27$), the oscillations start from the reduced velocity of
  $U^*=11.33$ and the amplitude of oscillation increases as the flow velocity increases which resembles those of galloping-type oscillations. In addition, figure 4(c) shows that right after the VIV-type response ends, at the reduced velocity of
  $U^*=11.33$ the mean displacement of the cylinder also starts to increase. Our observations have shown that at the reduced velocity range of
  $U^*=11.33\unicode{x2013}13.52$, the cylinder starts to rotate along its central axis, so the angle of attack changes over time. This rotation breaks the symmetry and increases the mean displacement. In the galloping-type response region for a subrange of
  $U^*=11.33\unicode{x2013}13.52$, the cylinder experiences dominant torsional oscillations at its first torsional mode. The frequency of oscillation increases linearly and remains below the Strouhal line at this range. At a high reduced velocity range of
  $U^*=14.07\unicode{x2013}16.27$ the frequency content of the cylinder's FIV response includes contributions from both the first torsional mode frequency as well as the first and second bending mode frequencies. The mean displacement in the CF direction remains constant for this range of reduced velocity.
The observation of an unprecedented galloping-type response when the triangular cylinder is at the angle of attack of  $\alpha =0^{\circ }$ might raise the question of why it occurs. We believe that the large-amplitude oscillation is likely due to the torsional oscillations of the cylinder, which break the symmetry of the system and change the modified angle of attack. The torsional mode of oscillation is excited when the linearly increasing frequency of oscillation approaches the first torsional natural frequency (also shown with dashed lines in figure 4b) at the reduced velocity close to
  $U^*=11.33$. Once the cylinder undergoes the torsional oscillation, the modified angle of attack varies over time and is no longer the same as the initially set value of
  $\alpha =0^{\circ }$. As a result, the location of the separation point changes from the fixed separation points at
  $\alpha =0^{\circ }$ to moving separation points at each modified angle of attack, which provides the after-body downstream of the separation points. The moving separation points and the vortex–after-body interaction are likely responsible for the increase in the amplitude of oscillation observed at the high reduced velocity ranges (figure 4a,d). The variation in the modified angle of attack also increases the mean displacement in both IL and CF directions (figure 4c,f), which amplifies the asymmetry of the system, leading to higher amplitudes of oscillation that resemble the galloping-type behaviour.
The amplitude of oscillation in the IL direction exhibits a similar trend as those observed in the CF direction, with values comparable to those observed in the CF direction (figure 4d). The frequency content of oscillations exhibits low-frequency oscillations at values close to the system's first bending mode frequency at the VIV region ( $U^*=4.73\unicode{x2013}10.77$). As the response enters the galloping region, beyond the reduced velocity of
  $U^*=10.77$, multi-frequency FIV response is observed (figure 4e). The mean displacement in the IL direction increases monotonically at reduced velocities as low as
  $U^*=4.73$, which is the onset of oscillations (figure 4f). The mean displacements in both the IL and CF directions reach large values close to twice the cylinder's side length.
To gain further insight into the system's behaviour, we studied three sample responses at reduced velocities selected to cover both the VIV and galloping-type regions, as shown in figure 5. The first sample reduced velocity is selected at the onset of the VIV-type oscillation region at the reduced velocity of  $U^*=4.73$. The second sample is selected at a reduced velocity of
  $U^*=8.58$, at which the amplitude of oscillations reaches its maximum value at the VIV region. The third sample is selected at a reduced velocity of
  $U^*=14.07$, at which the FIV response is of galloping type. In figure 5, the plots in the first column from the left show the normalised r.m.s. of the amplitude of oscillations (
 $A^*_y$) along the non-dimensional spanwise length (
 $z$) in the CF direction. The r.m.s. values of oscillation amplitudes measured from the experiments at discrete points are also plotted as solid black circles on top of the reconstructed response (dashed lines), showing how the experimentally measured data matches the reconstructed spanwise continuous response of the system. The plots in the second column show the time histories of the non-dimensional amplitude of oscillations along the non-dimensional spanwise length of the cylinder. The plots in the third column show the frequency content of the structural response along the cylinder's length, which is normalised by the first bending mode natural frequency of the system.

Figure 5. Comparison of the non-dimensional r.m.s. of amplitudes of oscillations (dashed line, reconstructed response; circles, experimental measurements) in the first column, time histories of the amplitudes of oscillations in the second column and the frequency contents of the structural response normalised by the fundamental natural frequency in the third column. The results are shown for reduced velocities of  $U^*=4.73$ (a i–a iii),
  $U^*=8.58$ (b i–b iii) and
  $U^*=14.07$ (c i–c iii) at an angle of attack of
  $\alpha =0^{\circ }$.
In the first row of figure 5, we see the results at a reduced velocity of  $U^*=4.73$ where the amplitude of oscillation is very small. The spanwise r.m.s. plot shows that the maximum r.m.s. value of the cylinder's spanwise oscillation reaches a value of about
  $y^*=0.01$ at a spanwise location close to the centre of the cylinder at
  $z =0.53$ (figure 5a i). At this reduced velocity, the cylinder is excited at its first structural bending mode, and there is no zero-amplitude node of oscillation along the cylinder's length other than the two fixed boundaries. This low-amplitude, mono-frequency oscillation at the first bending mode can also be seen in the spanwise time history contour plot in figure 5(a ii). The frequency analysis shows that the system oscillates at the normalised frequency of
  $f^*=1.1$ (figure 5a iii), which is close to the system's first bending mode natural frequency.
Moving on to the second row plots in figure 5, we see the results at a reduced velocity of  $U^*=8.58$. The maximum r.m.s. value of the cylinder's oscillations reaches a value close to
  $y^*=0.066$ at the spanwise location of
  $z=0.53$ (figure 5b i). Figure 5(b ii) shows the spanwise time histories of the amplitude of oscillations at this reduced velocity. The corresponding time history shows a single harmonic oscillation at this sample reduced velocity selected at the VIV-type region response, where the frequency of oscillation of
  $f^*=2.1$ is close to the system's second bending mode natural frequency. While the frequency of oscillation is close to the second bending mode natural frequency, the excited structural mode shape follows the first bending mode shape, where there is no spanwise zero amplitude node of oscillation other than the two fixed boundaries.
In the third row plots of figure 5, we see the response of the cylinder in the galloping region at the reduced velocity of  $U^*=14.07$. The amplitude of oscillations is distinctly increased from previous sample cases, and the maximum r.m.s. value reaches
  $y^*=0.35$ at the spanwise location of
  $z=0.52$ (figure 5c i, ii). The frequency analysis shows that the oscillation is dominated by a multi-frequency response at frequencies of
  $f^*=1.1$ and
  $f^*=2.9$, which are the contributions from the first bending and first torsional frequencies, respectively. The first bending mode and the first torsional mode have similar mode shapes projected in the CF direction, where there is no spanwise zero-amplitude node of oscillation other than the two fixed boundaries.
3.3. Response characteristics for the angle of attack of $\alpha =30^{\circ }$

In this section, we discuss the FIV response of the triangular cylinder at an angle of attack of  $\alpha = 30^{\circ }$, focusing on the amplitude and frequency of oscillations. Figure 6 presents the same plots as figure 4, but for the angle of attack of
  $\alpha = 30^{\circ }$. The amplitude of oscillations in the CF direction starts at very low levels for a reduced velocity of
  $U^*=1.44$ and gradually increases until reaching a maximum amplitude of
  $y^*=0.74$ at a reduced velocity of
  $U^*=10.77$, beyond which the amplitude of oscillations decreases (figure 6a). The amplitude of oscillations in the IL direction increases almost monotonically with increasing flow velocity (figure 6d).

Figure 6. Non-dimensional amplitude (r.m.s.), frequency, and mean value of oscillation at the angle of attack of  $\alpha =30^{\circ }$ plotted vs the reduced velocity in the CF direction (a–c) and IL direction (d–f).
The frequency analysis of the response indicates a multi-frequency behaviour for the reduced velocity range higher than  $U^*=9.13$ in both the IL and CF directions (figure 6b,e). While the time-averaged amplitudes of oscillation in the CF direction remain relatively small (figure 6c), there is a considerable mean displacement in the IL direction, with values increasing as the flow velocity increases, reaching amplitudes as high as four times the cylinder's side length (figure 6f).
Figure 6(a) demonstrates that oscillations of the triangular cylinder in the CF direction begin at a reduced velocity of  $U^*=1.44$, and remain at low amplitudes (less than
  $y^*=0.1$) until a reduced velocity of
  $U^*=4.19$ is reached. The frequency analysis in this reduced velocity range (figure 6b) reveals that the dominant oscillation frequency is close to the cylinder's first bending mode frequency, and that the second bending mode frequency contributes to the reduced velocity range of
  $U^*=3.64\unicode{x2013}4.19$. Frequencies that correspond to oscillations with the second structural bending mode shape are marked with a red circle around them, along with the number
  $2$ in figure 6(b).
Between the reduced velocity range of  $U^*=4.73\unicode{x2013}7.48$, there is a sharp increase in the amplitude of oscillations, reaching a maximum amplitude of
  $y^*=0.46$ at a reduced velocity of
  $U^*=7.48$. At this reduced velocity range, the oscillation frequency is locked to values close to
  $f^*=0.5$. There is a transitional reduced velocity range of
  $U^*=8\unicode{x2013}8.58$ that corresponds to a wide-banded frequency of oscillations before the response switches to multi-frequency oscillations at a reduced velocity of
  $U^*=9.13$. A kink in the amplitude of oscillations is observed at the beginning of this transitional range at the reduced velocity of
  $U^*=8$. At this point, the mean displacement in the CF direction also reaches its maximum value (figure 6c).
As the reduced velocity is further increased, in the range of  $U^*=9.13\unicode{x2013}10.77$, the amplitude of oscillations increases. Starting from this reduced velocity range, the cylinder experiences a multi-frequency response that includes torsional oscillations at the frequency of
  $f^*=3$, which is close to the cylinder's first torsional natural frequency (shown with the dashed line in figure 6b). These torsional oscillations are combined with contributions from the first and second bending mode frequencies. Similar to the angle of attack of
  $\alpha =0^{\circ }$, once the torsional mode of the system is excited, the oscillation of the cylinder leads to a dynamic change in the modified angle of attack. This variation in the modified angle of attack occurs on a temporal and spatial scale, meaning that the angle of attack changes over time at a specific point/plane along the cylinder's length (temporal scale), and at a specific instance of time, the variation of the angle of attack is not the same along the span of the cylinder due to fixed boundary conditions (spatial scale). In addition, multi-modal oscillation and excitation of mode shapes of the vibration other than the torsional mode give rise to the variation of the modified angle of attack. These temporal and spatial variations of the angle of attack lead to a complex multi-frequency response with contributions from both the bending and torsional modes as observed at higher reduced velocity ranges. Previous studies on flow-induced forces of the rotating triangular cylinder have also mentioned similar variation of the angle of attack, leading to changes in the separation points and pressure distribution on the windward and leeward surfaces of the cylinder (Tu et al. Reference Tu, Zhou, Bao, Han and Li2014). Owing to the force of the fluid, the cylinder tends to rotate to a configuration that balances the flow forces on both sides of the triangular cylinder (Liu et al. Reference Liu, Gui, Wu, Yang, Tu and Jiang2020).
On this basis, the aforementioned changes result in an increase in the angle of attack from  $\alpha =30^{\circ }$ to
  $\alpha =60^{\circ }$, leading to an increased vortex–after-body interaction. Consequently, the amplitude of oscillations increased in both the CF and IL directions at the reduced velocity range of
  $U^*=9.13\unicode{x2013}10.77$, as shown in figure 6(a,d). However, beyond the reduced velocity of
  $U^*=10.77$, although the cylinder still oscillates with contributions from both torsional and bending modes, the amplitude of oscillation decreases. The reduction in the amplitude of oscillations can be attributed to the contributions from the second bending mode in the FIV response of the system. The contributions from the second bending mode shape begin as the oscillation frequency gets close to the second bending mode natural frequency of the system (as shown by the dashed lines in figure 6b) at the reduced velocity of
  $U^*=11.32$, and become more dominant when the frequency of oscillation surpasses the cylinder's second bending mode natural frequency at the reduced velocity of
  $U^*=12.97$. Contributions from the second bending mode persist throughout the rest of the reduced velocity range tested here (
 $U^*=16.27$). It is noteworthy that the modified angle of attack, which varies between
  $\alpha =30^{\circ }$ and
  $\alpha =60^{\circ }$ in this configuration, can lead to an increase in the mean drag. The flat side of the triangular cylinder facing the flow results in an increase in the mean displacement of the cylinder in the IL direction, as shown in figure 6(f). Similar behaviour has been reported in the study of flow-induced forces on the rotating triangular cylinder, where the mean drag increases when the angle of attack changes to configurations at which the flat side of the triangular cylinder faces the flow (Tu et al. Reference Tu, Zhou, Bao, Han and Li2014).
Figure 7 shows the same plots as figure 5, but for a different set of sample reduced velocities selected at an angle of attack of  $\alpha = 30^{\circ }$. The three sample reduced velocities cover three different regions in the FIV response of the system. The first sample reduced velocity is selected at
  $U^*=6.38$, at which the cylinder oscillates at its first bending mode. The second sample reduced velocity is selected at
  $U^*=10.77$, where the first bending and first torsional modes contribute to the response of the system, and the amplitude of oscillations has reached its maximum. The third sample reduced velocity is selected at
  $U^*=14.07$, at which the FIV response is a multi-frequency oscillation with contributions from both the second bending and torsional modes.

Figure 7. (First column) Non-dimensional r.m.s. amplitudes of oscillations (dashed line, reconstructed response; circles, experimental measurements). (Second column) Time histories of the amplitudes of oscillations. (Third column) Frequency contents of the structural response, normalised by the fundamental natural frequency. Results are shown for reduced velocities of  $U^*=6.38$ (a i–a iii),
  $U^*=10.77$ (b i–b iii) and
  $U^*=14.07$ (c i–c iii) at
  $\alpha =30^{\circ }$.
The first-row plots show the results for the sample reduced velocity of  $U^*=6.38$ (figure 7a i–iii). The spanwise r.m.s. values of the amplitudes of oscillation (first column plot) show that the maximum amplitude of oscillations reaches
  $y^*=0.5$ at the spanwise location of
  $z=0.44$ (figure 7a i). At this sample reduced velocity, the cylinder is excited at its first structural mode, i.e. there is no zero-amplitude node of oscillation along the cylinder's length other than the two fixed boundaries. Figure 7(a ii) shows the spanwise time history of the amplitude of oscillations, which also represents the single-mode oscillatory response. The frequency content of the response shows a broad-banded frequency of oscillations in the range of
  $f^*=0.5\unicode{x2013}1.1$ along the length of the cylinder (figure 7a iii).
The second-row plots show the results for the sample reduced velocity of  $U^*=10.77$. At this sample velocity, the cylinder is excited at its first structural bending mode, and the maximum amplitude of oscillations reaches
  $y^*=0.77$ at the spanwise location of
  $z=0.52$ (figure 7b i). The spanwise time history and frequency content of the FIV response also show the system oscillates with contributions from the first structural bending mode shape at the frequency of
  $f^*=1.3$ together with small contributions from the torsional mode at the frequency of
  $f^*=3$ (figure 7b ii, iii).
The third-row plots show the results for the sample reduced velocity of  $U^*=14.07$. The maximum amplitude of oscillation reaches
  $y^*=0.55$ at the spanwise location of
  $z=0.26$. The amplitude of oscillation at the middle of the cylinder span (
 $z=0.5$) is low (figure 7c i, ii), which represents the dominance of the second structural bending mode shape in the response of the system. The frequency contour plot at this reduced velocity shows the dominant frequency of oscillation at
  $f^*=2.2$, which has a node at the spanwise location of
  $z=0.5$, confirming that this excited frequency has the second structural bending mode shape. Nominal contributions from other frequencies, such as the first bending frequency at
  $f^*=1$ and the first torsional frequency at
  $f^*=3.2$, are also observed in the multi-frequency response of the system. The general response type observed over the entire range of tested reduced velocities (
 $U^*=0.9\unicode{x2013}16.27$) for the angle of attack of
  $\alpha =30^{\circ }$ is the galloping-type response, which is further discussed in § 4.2.
3.4. Response characteristics for the angle of attack of $\alpha =60^{\circ }$

In this subsection, we investigate the amplitude and frequency of oscillations of the flexible triangular cylinder in the CF and IL directions at an angle of attack of  $\alpha =60^{\circ }$ over the range of reduced velocity of
  $U^*=0.9\unicode{x2013}16.27$. Figure 8(a) shows that oscillations in the CF direction start at a reduced velocity of
  $U^*=2.54$. As the flow velocity increases, the amplitude of oscillations also increases until reaching a maximum value at a reduced velocity of
  $U^*=9.13$. Beyond this point, the amplitude of oscillations attenuates. On the other hand, the cylinder's oscillation in the IL direction monotonically increases with increasing reduced velocity, except for some fluctuations at
  $U^*=8.58$ and
  $U^*=12.97$ (figure 8d).

Figure 8. Non-dimensional amplitude (r.m.s.), frequency, and mean value of oscillation at the angle of attack of  $\alpha =60^{\circ }$ plotted vs the reduced velocity in the CF direction (a–c) and IL direction (d–f).
The frequency content of the oscillations in both the CF and IL directions are shown in figure 8(b,e) and exhibit a dominant multi-frequency response. Figure 8(c) shows that the mean displacement in the CF direction is non-zero for reduced velocities higher than  $U^*=3$. The mean displacement reaches its maximum value of
  $0.35$ at a reduced velocity of
  $U^*=11.87$, beyond which the mean displacement decreases and plateaus (figure 8c). In contrast, the mean displacement in the IL direction monotonically increases with increasing reduced velocity and reaches its maximum value of
  $3.6$ at a reduced velocity of
  $U^*=16.27$ (figure 8f).
Oscillations in the CF direction begin at a reduced velocity of  $U^*=2.54$ (figure 8a), with a low amplitude of around
  $y^*=0.05$ that persists up to
  $U^*=3.64$. Beyond this point, there is a sudden increase in the amplitude of oscillation at
  $U^*=4.19$, and the amplitude reaches as high as
  $y^*=0.28$. As the reduced velocity is further increased, the amplitude of oscillations continues to increase and reaches a maximum amplitude of
  $y^*=0.68$ at
  $U^*=9.13$. The frequency content of the response in the CF direction (figure 8b) reveals the dominant oscillation frequency to be the first bending mode in the reduced velocity range of
  $U^*=0.9\unicode{x2013}9.13$. While the frequency content of the CF response exhibits a multi-frequency response at some reduced velocities in this range with contributions from both torsional and bending modes, the dominant oscillation frequency follows the Strouhal line in the reduced velocity range of
  $U^*=0.9\unicode{x2013}9.13$. Similar to the response observed for the triangular cylinder at an angle of attack of
  $\alpha =0^{\circ }$ (discussed in § 3.2), the match between the Strouhal frequency and oscillation frequency can be attributed to the fixed separation points in the symmetric cross-section of the triangular cylinder at an angle of attack of
  $\alpha =60^{\circ }$. Although contributions from torsional oscillations were observed in the reduced velocity range of
  $U^*=6.93\unicode{x2013}9.13$, their contribution was not strong enough to cause significant spanwise rotation and change the modified angle of attack and separation points.
In the reduced velocity range of  $U^*=9.13\unicode{x2013}10.78$, the cylinder experiences a multi-frequency response in which the dominant frequency increases from the first towards the second bending mode natural frequency, together with contributions from the first torsional frequency. The amplitude of oscillations decreases in this range and reaches a minimum of
  $y^*=0.47$ at
  $U^*=10.78$. This decrease in the amplitude of oscillations can be attributed to the change in the modified angle of attack as contributions from torsional oscillations increase. In contrast to what was observed for the angle of attack of
  $\alpha =0^{\circ }$, the increase in torsional oscillations at this configuration can cause a decrease in the modified angle of attack, leading to attenuation of vortex–after-body interactions and a decrease in the amplitude of oscillations.
Another sudden decrease in the CF amplitude of oscillations is observed in the reduced velocity range of  $U^*=11.33\unicode{x2013}12.43$. In this range, the bending and torsional modes merge, and the cylinder oscillates at a merged frequency that is twice the system's first bending natural frequency. The decrease in the amplitude of oscillations in this range can be attributed to the excitation of the second bending mode shape. Beyond this range, the amplitude of oscillations stays around
  $y^*=0.2$ for the reduced velocity range of
  $U^*=12.98\unicode{x2013}16.27$. The system experiences a multi-frequency oscillation response at this range, where the dominant frequency of oscillations (i.e. the merged bending–torsional frequency) decreases from 2 to 1.7 times the system's first bending natural frequency. In addition, there is a small contribution from a low-frequency oscillation close to the system's first bending mode natural frequency.
The amplitude and frequency analysis of the oscillations in the IL direction reveal that the amplitude of oscillation increases with increasing reduced velocity, as shown in figure 8(b). In addition, the frequency analysis of the IL oscillation shows a multi-modal oscillation pattern, similar to that of the CF oscillation. However, higher-frequency contributions are observed in the IL oscillation, as shown in figure 8(c).
Figure 9 shows sample responses at three selected reduced velocities that cover three different regions of the response. The first row shows the mono-frequency response of the system at the reduced velocity of  $U^*=4.73$. At this reduced velocity, the maximum amplitude of oscillation reaches the value of
  $y^*=0.5$ at the spanwise location of
  $z=0.47$ (figure 9a i). The oscillation time history along the cylinder's length shows the single harmonic oscillations with non-dimensional frequency content at a frequency of
  $f^*=0.7$ (figure 9a ii, iii).

Figure 9. (First column) Non-dimensional r.m.s. of amplitudes of oscillations (dashed line, reconstructed response; circles, experimental measurements). (Second column) Time histories of the amplitudes of oscillations. (Third column) Frequency contents of the structural response, normalised by the fundamental natural frequency for reduced velocity of  $U^*=4.73$ (a i–a iii),
  $U^*=11.88$ (b i–b iii) and
  $U^*=14.07$ (c i–c iii) at
  $\alpha =60^{\circ }$.
The second sample reduced velocity at  $U^*=8.58$ is selected at a point where the maximum amplitude of oscillations occurs across the range of reduced velocities tested. The maximum amplitude of oscillations at this reduced velocity reaches the value of
  $y^*=0.88$ at the spanwise location of
  $z=0.47$ (figure 9b i). Figure 9(b ii, iii) shows a multi-frequency oscillation where the first bending mode is dominant with the frequency of
  $f^*=1.2$, and there is a small contribution from the torsional frequency at the frequency of
  $f^*=2.4$.
The third row shows the results at the reduced velocity of  $U^*=13.52$, at which the amplitude of oscillations decreases, and the maximum amplitude reaches the value of
  $y^*=0.25$ at the spanwise location of
  $z=0.47$ (figure 9c i). This sample reduced velocity is selected from the reduced velocity region at which the bending frequency and torsional frequency are merged towards each other. Due to the effect of the torsional oscillations, there is no node at the midpoint of the cylinder, and the first bending mode shape is the dominant structural mode shape excited in the system. The response for the entire range of the tested reduced velocity at this angle of attack is of galloping type. The details of the response type are discussed in § 4.2.
In this section, the structural response of the triangular cylinder was investigated at three different angles of attack, and the results indicate that the response is highly sensitive to the initial angle of attack. In addition, the cylinder's rotation at certain reduced velocities, which causes a change in the angle of attack, is shown to play a significant role in the system response. For each angle of attack, three sample reduced velocities were chosen to showcase various features of the response, which vary with increasing reduced velocity. The samples were chosen to cover a range of responses observed at different reduced velocities. To better comprehend the FIV response of the triangular cylinder, we also examine the corresponding flow field and wake of the structure in § 4.
3.5. Flow forces
In this section, flow forces acting along the length of the cylinder in the CF direction were calculated using the equation of motion of a continuous beam in tension:
 \begin{equation} m \ddot{y}-(T y^{\prime})^{\prime}+(E I y^{\prime \prime})^{\prime \prime}=f_{y}(z, t) \end{equation}
in which  $m$ is the mass per unit length of the cylinder,
  $EI$ is the flexural rigidity,
  $T$ is the applied tension along the length,
  $y$ is the measured displacement of the cylinder in the CF direction and
  $f_y(z,t)$ represents all the flow forces that act on the cylinder. The dots and primes represent derivatives with respect to time and space, respectively. A similar technique has been used previously to obtain the flow forces acting on a flexibly mounted cylinder undergoing VIV in water tunnel experiments (Seyed-Aghazadeh et al. Reference Seyed-Aghazadeh, Carlson and Modarres-Sadeghi2017) and for FIV of flexible cylinders in tandem arrangements (Seyed-Aghazadeh et al. Reference Seyed-Aghazadeh, Anderson and Dulac2021a). In addition, CF force coefficient, and its component in phase with the cylinder's velocity (
 $C_{yv}$) in the CF direction were calculated in accordance with the methodology outlined in Fan et al. (Reference Fan, Wang, Triantafyllou and Karniadakis2019) as
 \begin{equation} {C}_{y v}=\frac{2}{T_s} \cdot \frac{\displaystyle\int\nolimits_{T_s}(C_y(z,t) \dot{y}(z,t)) \, {\rm d} t}{\sqrt{\dfrac{2}{T_s} \displaystyle\int\nolimits_{T_s}(\dot{y}^2(z,t)) \,{\rm d} t}}, \end{equation}
where  $C_y$ is the instantaneous CF force coefficient and
  $T_s$ is one vibration cycle.
Figure 10 shows the CF force coefficients plotted against the spanwise length of the cylinder. In order to correlate the cylinder response and the forces coefficients, the dimensionless r.m.s. of amplitudes of oscillation in the CF and IL directions are also plotted in this figure. These force coefficients are plotted for the three sample cases at three different angles of attack as those sample cases discussed in § 3. The spanwise distribution of the CF force coefficient ( $C_y$) and the CF force coefficient in-phase with velocity (
 $C_{yv}$) across all nine samples (figure 10(a iv–a vi), (b iv–b vi) and (c iv–c vi)) shows a consistent variation such that when the CF amplitude is smaller, these force coefficients obtain small values too. For instance, at an angle of attack
  $\alpha =$ 0
 $^{\circ }$ and a reduced velocity of
  $U^*=4.17$, corresponding to a low amplitude of oscillation (figure 10a i), the
  $C_y$ and
  $C_{yv}$ magnitude is observed to be low across the span of the cylinder (figure 10a iv). By contrast, when the reduced velocity and amplitude of oscillation are increased at an angle of attack of
  $\alpha =0^{\circ }$ (figure 10a v, a vi), the magnitude of
  $C_y$ and
  $C_{yv}$ increases (figure 10a ii, a iii). This observed trend persists across a range of angles of attack, including
  $\alpha =30^{\circ }$ and
  $\alpha =60^{\circ }$ (figure 10b,c). The dependency of
  $C_{yv}$ magnitude on the amplitude of oscillation is consistent with findings reported in the study of VIV of a flexible cylinder (Fan et al. Reference Fan, Wang, Triantafyllou and Karniadakis2019; Seyed-Aghazadeh et al. Reference Seyed-Aghazadeh, Anderson and Dulac2021a).

Figure 10. Spanwise non-dimensional displacement ( ${A^*}$) in the CF and IL directions, CF force coefficients of
  $C_y$ and
  $C_{yv}$ along the cylinder span at three sample cases at three angles of attack. First box:
  $\alpha =0^{\circ }$,
  $U^*=4.73$ (a i, a iv),
  $U^*=8.58$ (a ii, a v),
  $U^*=14.07$ (a iii, a vi), second box:
  $\alpha =\,$30
 $^{\circ }$,
  $U^*=6.38$ (b i, b iv),
  $U^*=10.77$ (b ii, b v),
  $U^*=14.07$ (b iii, b vi), and third box:
  $\alpha =60^{\circ }$,
  $U^*=4.73$ (c i, c iv),
  $U^*=8.58$ (c ii, c v),
  $U^*=13.52$ (c iii, c vi).
Furthermore, it is evident that when  $C_y$ reaches its maximum/minimum values along the cylinder length, the CF force in-phase with the velocity (
 $C_{yv}$) reaches zero value. This behaviour aligns with previous observations in the context of VIV involving flexible cylinders. Existing literature has consistently reported a strong correlation between regions exhibiting an almost zero phase difference between the cylinder's displacement and the CF force and the occurrence of maximum amplitudes in the CF force coefficient (Evangelinos & Karniadakis Reference Evangelinos and Karniadakis1999). It should be noted that the
  $C_{yv}$ can take both positive and negative values. Positive values of
  $C_{yv}$ represent regions where the energy is transferred from the flow to the cylinder and the structure is excited by the surrounding flow. Conversely, negative
  $C_{yv}$ values represents scenarios where the fluid contributes to the dissipation of energy from the structure. For all the sample cases studied here, we observe that when the IL amplitudes of oscillations are relatively in the same order as those observed in the CF direction, both positive and negative
  $C_{Lv}$ values are observed along the length of the cylinder. This observation is also inline with those reported for FIV of flexible cylinders in tandem arrangements (Seyed-Aghazadeh et al. Reference Seyed-Aghazadeh, Anderson and Dulac2021a).
Finally it is important to acknowledge that our CF force reconstruction method is based solely on the projected response of the system in the CF direction. This approach does not account for the influence of mean IL displacement or any torsional oscillations, which may not reflect the complete system behaviour in a realistic sense. However, despite this simplification, the general trends observed in our study, along with the corresponding distribution of flow force coefficients across the spanwise length of the cylinder, appear reasonable and align well with the observed dynamic behaviour of the system.
4. Flow field analysis using qualitative and quantitative methods
In the FIV problems, understanding the flow field is essential for identifying the cause and the type of FIV response. In this section, we analyse the flow field using two different methods of flow visualisation: HB imaging and time-resolved volumetric PTV, which are discussed in §§ 4.1 and 4.2. The HB flow visualisation allows us to qualitatively visualise vortex shedding patterns in the vortex-dominated wake of the cylinder at a 2-D plane along its span. On the other hand, PTV is a quantitative flow visualisation technique that sheds light on the vortex dynamic features of the flow in the wake of the cylinder and relates them to the observed structural response of the system. Moreover, the volumetric PTV measurements enable us to obtain insights into the 3-D nature of the wake of the cylinder. In this section, we present some sample cases from the HB flow visualisation and PTV measurements to represent the vortex shedding pattern and the spanwise 3-D flow field. By analysing the wake structure, we can distinguish between different types of FIV responses observed and discussed in the previous section.
4.1. Wake structure
This section aims to investigate the flow features in the wake of the cylinder at different reduced velocities and angles of attack. The goal is to analyse the various vortex shedding patterns observed and demonstrate the three-dimensionality of the vortex shedding along the span of the cylinder. To achieve this, we used the HB flow visualisation technique to study different vortex shedding patterns in a 2-D plane in the wake of the cylinder at three different angles of attack within a relatively low reduced velocity range. For higher flow velocities, we employed the PTV analysis to obtain 3-D time-averaged and instantaneous vorticity field information. This approach allowed us to study the three-dimensionality of the flow field along the cylinder span and the surrounding flow field dynamics at a sample case with an angle of attack of  $\alpha =30^{\circ }$. Using both qualitative and quantitative flow visualisation techniques enables us to understand and distinguish between different types of FIV responses, such as VIV or galloping-type responses, as discussed in the previous section. By examining these flow patterns, we can gain further insight into the underlying physical mechanisms driving the system response.
Figure 11 shows the wake of the cylinder captured using the HB flow visualisation technique at a plane located at mid-span of the cylinder ( $z=0.5$). The figure showcases two different snapshots of vortex shedding patterns at low reduced velocities and three different angles of attack. The selected reduced velocities for this analysis are the same as those in figures 5, 7 and 9 in § 3, where we discussed the structural response of the system. Figure 11 provides two snapshots of the vortices shed in the wake of the cylinder, corresponding to the maximum (top row) and minimum (bottom row) amplitudes of oscillations within one cycle of oscillation.

Figure 11. HB snapshots of the wake at the mid-span of the cylinder for different reduced velocities and angles of attack: (a i–a ii)  $U^*=4.73$ at
  $\alpha = 0^{\circ }$, (b i–b ii)
  $U^*=6.38$ at
  $\alpha =30^{\circ }$, and (c i–c ii)
  $U^*=4.73$ at
  $\alpha =60^{\circ }$. The flow direction is from left to right. The videos are provided as supplementary movies 1–3 available at https://doi.org/10.1017/jfm.2023.1024.
Figures 11(a i, ii) show the snapshots at an angle of attack of  $\alpha = 0^{\circ }$, where the amplitude of oscillation is minimal, and the shedding pattern observed is
  $2S$, where two single vortices are shed at one cycle of oscillation, one from the top of the cylinder and one from the bottom of the cylinder. This type of symmetric shedding pattern, that is similar to those observed for a rigid flexibly mounted triangular cylinder (Seyed-Aghazadeh et al. Reference Seyed-Aghazadeh, Carlson and Modarres-Sadeghi2017), is expected to occur at this angle of attack at low reduced velocity as the amplitude of oscillation is small and the entire cylinder is excited at its first bending mode.
The second column in figure 11 shows the HB snapshots at an angle of attack of  $\alpha =30^{\circ }$, where the shedding pattern observed is non-symmetric
  $2S$. This non-symmetric shedding pattern is due to the asymmetry of the triangular cylinder's geometry that faces the flow at this angle of attack (figure 1b). At this angle of attack, the vortex size and the separation point location from the top and bottom of the cylinder are different, leading to an asymmetric
  $2S$ shedding pattern. One vortex that is shed from the top side of the cylinder is larger than the other vortex shed from the bottom side of the cylinder.
The third column of figure 11 shows the wake of the cylinder at an angle of attack of  $\alpha =60^{\circ }$, where one single vortex is shed from the top while a pair of vortices are shed from the bottom side of the cylinder over one cycle of oscillation (figure 11c i, ii). This non-symmetric vortex shedding pattern for a triangular cylinder at
  $\alpha =60^{\circ }$ was not observed for the rigid triangular prism since the vortices were shed symmetrically from both sides of the rigid prism. Due to the mean displacement in the CF direction as shown in figure 8(c), the neutral position's location changes, leading to a change in the amplitude of oscillation at each half cycle. By considering the neutral position of the cylinder in still water, the amplitude of oscillation when the cylinder moves upward is higher than the oscillation in the downward direction. Therefore, when the cylinder moves upward, a pair of vortices can be shed, while only a single vortex is shed when it moves downward. This multi-mode shedding pattern, known as the
  $S+P$ pattern, has also been observed in the quantitative flow visualisation and is discussed in § 4.2.
Although the qualitative flow visualisation technique used in this study provided valuable insights into the instantaneous shedding patterns of the 2-D flow field, it has its limitations, especially when it comes to generating high-quality HB at high reduced velocities ( $U^*>5.28$). To overcome this limitation and gain a deeper understanding of the wake of the cylinder and its 3-D flow field at high flow velocities, we employed a quantitative flow visualisation technique using our time-resolved PTV set-up. In this section, we present the results of the PTV experiments carried out at a reduced velocity of
  $U^*=14.07$ and an angle of attack of
  $\alpha =30^{\circ }$, which are shown in figures 12 and 13. We discussed the structural response of this sample case in figure 7 of § 3.3.

Figure 12. Time-averaged vorticity at the reduced velocity of  $U^*=14.07$ and angle of attack
  $\alpha =30^{\circ }$, shown in (a) 3-D view, (b)
  $XZ$ plane with structural response in the IL direction and (c)
  $YZ$ plane with structural response in the CF direction.

Figure 13. Instantaneous out-of-plane vorticity ( $\omega _y$) at
  $U^*=14.07$ and
  $\alpha = 30^{\circ }$: (a) 3-D view and (b–d) 2-D plane views.
The main objective of this section is to demonstrate the correlation between the 3-D flow field along the cylinder span and the CF and IL oscillations of the cylinder. Figure 12(a) shows the 3-D isosurface of the time-averaged vorticity field in the wake of the cylinder. The spanwise frequency of oscillation in the CF direction is presented in figure 12(b). The 2-D views of the isosurface in the  $XZ$ (IL) and
  $YZ$ (CF) planes, along with the cylinder's displacement, are shown in figure 12(c,d), respectively. The isosurface of the time-averaged vorticity field highlights the three-dimensionality of the spanwise vorticity formed in the wake of the cylinder. The projected isosurfaces in the
  $XZ$ plane reveal that the formation of the vorticity along the cylinder length follows a similar trend as the cylinder's time-averaged IL displacement. Furthermore, at this reduced velocity, the cylinder's oscillation in the CF is dominated by the second structural bending mode shape with a node at mid-span, and the observed time-averaged vorticity field represents a bottleneck at the second bending mode oscillation nodal point (figure 12b). These figures show the correlation between the spanwise structural response of the system and the 3-D flow field in the wake of the cylinder. The observed spanwise three-dimensionality of the flow is influenced by multiple factors, including the spanwise flexibility of the cylinder, which leads to mean displacement of the cylinder in the IL direction, as well as multi-modal oscillations of the cylinder in both bending and torsional modes, and excitation at higher modes of oscillation.
Figure 13 shows the instantaneous out-of-plane vorticity ( $\omega _y$) at a sample reduced velocity of
  $U^*=14.07$. Figure 13(a) displays the 3-D isosurface vorticity in the wake of the cylinder, revealing the different shedding patterns along the cylinder's length and behind the cylinder. Two planes are chosen to provide a closer view of the shedding pattern in a 2-D view in figures 13(b)–13(d). It is apparent that although the general shedding pattern is non-symmetric
  $2S$, the shedding pattern at different planes differs in terms of vortex size, shape and location of the vortex formation.
In this section, the impact of the angle of attack on the vortex shedding pattern was investigated and presented in figure 11. Furthermore, the three-dimensionality of the flow along the cylinder span due to the structural response was visualised in figures 12 and 13. However, fluid–structure interaction problems, such as that studied here, pose challenges due to the complexity of the flow field variables caused by the structure's flexibility and the turbulent flow at high Reynolds numbers. To address this, a proper orthogonal decomposition (POD) technique was applied to the flow field data to reduce the complexity and decompose the vector field representing the turbulent flow motion into a set of deterministic functions. The results of the POD analysis are discussed in detail in the following § 4.2.
4.2. Proper orthogonal decomposition
POD, also known as principal component analysis (PCA), is a powerful mathematical technique widely used in the field of fluid dynamics to analyse and reduce large datasets obtained from simulations or experiments (Berkooz, Holmes & Lumley Reference Berkooz, Holmes and Lumley1993; Holmes et al. Reference Holmes, Lumley, Berkooz and Rowley2012). The goal of POD is to extract the dominant features or modes from a high-dimensional dataset, which can be used to reconstruct the original data with a high degree of accuracy using a smaller number of modes or basis functions. In fluid dynamics, two types of modes can be extracted from a flow field using POD: temporal and spatial modes.
Temporal POD modes capture the time-dependent behaviour of the flow and represent the dominant time-dependent features of the flow. These modes are obtained by computing the singular value decomposition (SVD) of the time series data of the flow variables, such as velocity, pressure or vorticity, and selecting a subset of the singular vectors with the highest singular values. Spatial POD modes, on the other hand, capture the spatial structure of the flow and represent the dominant spatial features of the flow. These modes are obtained by computing the SVD of the spatial snapshot data of the flow variables, such as a snapshot of the velocity field at a particular time, and selecting a subset of the singular vectors with the highest singular values.
Both temporal and spatial POD modes can be used to reduce the dimension of the flow data and to extract relevant information about the flow. Temporal POD modes can be used to identify the dominant time scales of the flow, whereas spatial POD modes can be used to identify the dominant spatial structures, such as vortices, wakes or boundary layers. The combination of temporal and spatial POD modes can be used to analyse and understand the complex dynamics of fluid flow.
Frequency analysis of the temporal POD mode involves analysing the frequency content of the dominant temporal mode obtained from the POD of a fluid flow. This analysis can provide insights into the dominant time scales and frequencies of the flow and can be used for finding the vortex shedding frequency by applying the POD analysis on the vorticity field (Taira et al. Reference Taira, Brunton, Dawson, Rowley, Colonius, McKeon, Schmidt, Gordeyev, Theofilis and Ukeiley2017; Riches, Martinuzzi & Morton Reference Riches, Martinuzzi and Morton2018; Weiss Reference Weiss2019; Deep, Sahasranaman & Senthilkumar Reference Deep, Sahasranaman and Senthilkumar2022).
In this study, the flow field surrounding and in the wake of the triangular cylinder extracted from the PTV analysis has been analysed using the POD technique to capture the flow's most energetic coherent structures. The POD analysis has been carried out separately for the instantaneous and time-averaged flow field variables. The contribution of the first 20 POD modes to the total turbulent kinetic energy (TKE) is shown in figure 14 for three sample reduced velocities and three different angles of attack considered in the study. It can be observed that the first few modes contribute to the majority of the energy of the system at the selected sample reduced velocities, while the energy proportion of higher modes steadily drops to zero. The first four POD modes with the highest level of energy (highlighted in red) have been selected for further investigation in the following section. It is worth noting that the highest energy level of the POD mode decreases by increasing the reduced velocity and Reynolds number in the turbulent flow field, especially at this sample reduced velocity case at each angle of attack (third column from the left in figure 14). Further details of the POD analysis based on the time-resolved volumetric PTV data are discussed in Mousavisani et al. (Reference Mousavisani, Chowdhury, Samsam-Khayani, Samandari and Seyed-Aghazadeh2022b).

Figure 14. Energy distribution of the first 20 POD modes for the flexible triangular cylinder at different angles of attack: (a)  $\alpha =0^{\circ }$, (b)
  $\alpha =30^{\circ }$ and (c)
  $\alpha = 60^{\circ }$.
Figure 15 compares the first four temporal POD mode frequencies with the triangular cylinder's oscillation frequency at three sample reduced velocities for each angle of attack studied in § 3. The sample reduced velocities are chosen to be the same as those presented in § 3. In each plot, the horizontal axis shows the temporal POD mode number, and the vertical axis shows the non-dimensional frequency, which is normalised by the triangular cylinder's first bending frequency in water. The black circle symbols represent the non-dimensional frequency content of POD temporal modes ( $\,f_{temporal}^*$) at each mode number. The size of the circle symbols shows the magnitude of each frequency that decreases with increasing mode numbers. In addition, for cases with a multi-frequency response, the second dominant frequency is shown with grey circle symbols.

Figure 15. Comparison between the normalised frequency of each temporal mode (circle) and the normalised frequency of oscillation (orange line) for various reduced velocities and angles of attack (first row:  $\alpha =0^{\circ }$, second row:
  $\alpha =30^{\circ }$, and third row:
  $\alpha =60^{\circ }$).
The dominant non-dimensional frequency of the temporal POD mode of the most energetic modes represents the non-dimensional vortex shedding frequency ( $\,f_{sh}^*$) (Deep et al. Reference Deep, Sahasranaman and Senthilkumar2022). Therefore, this plot compares the non-dimensional vortex shedding frequency with the non-dimensional oscillation frequency (
 $\,f_{os}^*$), which is shown in the orange lines over the horizontal axis. The width of these lines show how wide-banded the oscillation frequency is. In addition to the comparison between the oscillation frequency and the shedding frequency (synchronised or non-synchronised), the vortex shedding pattern, which can be found by combining the spatial structure of the dominant spatial POD modes, helps identify the system's FIV response type (VIV or galloping).
Figures 16, 17, and 18 show the spatial structures of the streamwise velocity for the first four POD modes at each angle of attack and three sample reduced velocities. These spatial POD modes represent the dominant structures in the flow field and are obtained by decomposing the flow data into a series of orthogonal spatial modes that capture the most significant features of the flow. This approach was used to identify the vortex shedding pattern behind the cylinder by analysing the spatial structure of the streamwise velocity at the dominant POD modes. Therefore, by combining the results of figure 15 (which compares the vortex shedding frequency and oscillation frequency) and the dominant spatial structures (figures 16, 17, 18), we can gain insight into the vortex shedding frequency and pattern, which are necessary to determine the FIV response type of the flexible triangular cylinder.

Figure 16. Spatial structures of the streamwise velocity for the first four POD modes at reduced velocities of  $U^*=4.73$ (a i–a iv),
  $U^*=8.58$ (b i–b iv) and
  $U^*=14.07$ (c i–c iv) at an angle of attack of
  $\alpha = 0^{\circ }$.

Figure 17. Spatial structures of the streamwise velocity for the first four POD modes at the reduced velocity of  $U^*=6.38$ (a i–a iv),
  $U^*=10.77$ (b i–b iv) and
  $U^*=14.07$ (c i–c iv) for an angle of attack of
  $\alpha =30^{\circ }$.

Figure 18. Spatial structures of the streamwise velocity for the first four POD modes at the reduced velocity of  $U^* = 4.73$ (a i–a iv),
  $U^* = 8.58$ (b i–b iv) and
  $U^* = 13.52$ (c i–c iv) at an angle of attack of
  $\alpha =60^{\circ }$.
The first row of figure 15 shows the temporal POD mode frequencies for  $\alpha =0^{\circ }$. Figure 15(a i) shows that the frequencies of temporal modes (black circles) are identical to the oscillation frequency (orange line) for all four temporal modes. The dominant temporal POD mode frequency, which represents the vortex shedding frequency, is the same as the oscillation frequency. Figure 16(a i–iv) illustrates the spatial structures of the streamwise velocity for the first four POD modes at
  $U^*=4.73$. The dominant spatial structures (first and second POD modes, figure 16a i, ii) represent the
  $2S$ vortex shedding pattern, which is similar to the shedding pattern of the rigid triangular cylinder at the same angle of attack (Seyed-Aghazadeh et al. Reference Seyed-Aghazadeh, Carlson and Modarres-Sadeghi2017; Chen et al. Reference Chen, Ji, Xu, Zhang and Wei2020). This symmetric
  $2S$ shedding pattern is also observed in the HB flow visualisation results (figure 11a i, ii). The synchronised oscillation and shedding frequency, in addition to the symmetric
  $2S$ shedding pattern, confirm the VIV-type response at this reduced velocity. At the second sample reduced velocity
  $U^*=8.58$ (figure 15a ii), the frequency content of the temporal POD modes, which represents the vortex shedding frequency, is close to the oscillation frequency (
 $\,f_{os}^*=1.78$, which is identical to the shedding frequency as shown in § 3.2) for all four temporal modes. The similarity between the oscillation frequency and shedding frequency is attributed to the fixed separation point of the cylinder at this reduced velocity and angle of attack (Chen et al. Reference Chen, Ji, Xu, Zhang and Wei2020). Figure 16(b i–iv) shows that the dominant spatial structure, which represents the vortex shedding pattern, is
  $2S$ for all four spatial POD modes, and the magnitude of the vorticity decreases as the energy level decreases at higher modes. The synchronised oscillation and shedding frequency, in addition to the symmetric
  $2S$ shedding pattern, confirm the VIV-type response at this reduced velocity.
At  $\alpha = 0^{\circ }$ and reduced velocity of
  $U^*=14.73$, the frequency content of the temporal POD mode of the flow field (figure 15a iii) exhibits a multi-frequency response for the first temporal mode. This is attributed to the combined oscillation of the cylinder in its first bending and torsional modes (figure 5c iii). The spatial POD mode in figure 16(c i) shows the first POD spatial mode with the highest energy level. The spatial POD mode pattern follows the structural response of the cylinder's surrounding flow, with the dominant mode occurring in the near-wake region, whereas the magnitude of the vortices decreases in the far wake. The second and third temporal POD modes represent only frequencies close to the torsional frequency of the oscillation. This can also be seen in the spatial POD mode in figure 16(c ii, iii), which exhibits an upward oblique pattern due to the upward rotation of the cylinder. To better illustrate this upward pattern, a sample plane from figure 16(c ii, iii) is plotted in figure 19. The dominant spatial structure indicates that the shedding pattern are non-symmetric. Furthermore, the dominant temporal POD mode frequency, considered as the vortex shedding frequency, is higher than the oscillation frequency in the CF direction (
 $\,f_{sh}^*=2.48>f_{os}^*=0.97$). This higher shedding frequency, along with the non-symmetric shedding pattern, confirms the galloping-type response at this reduced velocity.

Figure 19. 2-D spatial structures of the streamwise velocity for the second (a) and third (b) POD mode at a reduced velocity of  $U^* = 14.07$ and an angle of attack of
  $\alpha = 0^{\circ }$.
The frequency analysis of the temporal POD modes for an angle of attack of  $\alpha =30^{\circ }$ is presented in figure 15(b i–iii). At the first sample reduced velocity of
  $U^*=6.38$ (figure 15b i), which exhibits a wide-banded frequency of oscillation (figure 7a iii), the frequency content of the first and second temporal POD modes (black circle) is higher than the oscillation frequency (orange line). The dominant temporal mode frequency, occurring in the first two modes with the highest level of energy, is considered the vortex shedding frequency. The spatial POD modes for these two first modes (figure 17a i, ii) reveal that the dominant spatial structures are non-symmetric
  $2S$ patterns, which are considered the dominant vortex shedding patterns. This pattern was also observed in the HB flow visualisation (figure 11b i, ii). The non-symmetric shedding pattern, along with the higher shedding frequency than the oscillation frequency, confirms the galloping-type response at this reduced velocity.
At  $\alpha =30^{\circ }$, the second sample reduced velocity is
  $U^*=10.77$ as shown in figure 15(b ii). The frequency analysis of the POD temporal modes indicates that the first temporal mode with the highest energy level exhibits multi-frequency content, where the first frequency matches the first oscillation frequency at the bending mode, whereas the second frequency is higher and is close to the second oscillation frequency corresponding to the torsional oscillation of the cylinder. The corresponding spatial POD mode, shown in figure 17(b i), shows a pair of vortices shed from each side of the cylinder in the near-wake region during one cycle of oscillation. These pairs are non-symmetric, and the magnitude of the vorticity in the near wake is higher than that in the far wake, as shown in figure 17(b i). The second temporal POD mode displays a single frequency corresponding to the torsional frequency, as illustrated in figure 15(b ii). The spatial structure of this POD mode displays an upward oblique
  $2S$ shedding pattern. A 2-D plane of the first and second spatial POD modes is presented in figure 20(a,b) to exhibit the oblique pattern of the flow field. Considering the dominant spatial structures with the highest energy level at this reduced velocity (the first and second POD modes), the vortex shedding has a non-symmetric pattern. Moreover, the frequency content of the dominant temporal POD mode indicates that the vortex shedding frequency is higher than the dominant oscillation frequency, which is the bending frequency at
  $f_{os}^*=1.3$. These observations confirm that the FIV response at this reduced velocity is of galloping type.

Figure 20. 2-D spatial structures of the streamwise velocity for the first (a) and second (b) POD modes at a reduced velocity of  $U^* = 10.77$ and the second (c) and third (d) POD modes at a reduced velocity of
  $U^*= 14.07$ at an angle of attack of
  $\alpha =30^{\circ }$.
At the angle of  $\alpha =30^{\circ }$, the third sample is selected at the reduced velocity of
  $U^*=14.07$ (figure 15b iii), and shows a multi-frequency oscillation with contributions from the first bending mode (
 $\,f_{os}^*=1$), the second bending mode (
 $\,f_{os}^*=2.2$) and the torsional frequency (
 $\,f_{os}^*=3.2$), with the dominant mode being the second bending mode (figure 7b iii). The temporal POD mode frequency analysis reveals that the first mode, which has the highest level of energy, has two frequencies corresponding to the bending and torsional frequencies at
  $f_{temporal}^*=1.53$ and
  $2.87$, respectively. The first spatial POD mode shows the complex spatial structures that occur in the near wake, where the flow around the cylinder follows the cylinder's complex multi-modal oscillation (figure 17c i). The frequency analysis of the second and third temporal POD modes shows a multi-frequency response. The dominant frequency content of the second and third POD modes is
  $f_{temporal}^*=1.53$, and
  $2.87$, respectively. The spatial POD mode for the second mode shows non-symmetric
  $2P$ spatial structures, which is attributed to the dominant frequency at this mode, corresponding to the first bending mode (figure 17c ii). The third spatial POD mode, which is related to the torsional frequency (dominant frequency at third temporal POD mode in figure 15b iii), shows an oblique irregular shedding pattern (figure 17c iii). Mode four, with a lower energy level compared with the other POD modes, has two frequencies and an irregular spatial structure (figure 17c iv). A 2-D plane of the spatial mode of the second and third POD modes is shown in figure 20(c,d).
At an angle of attack of  $60^{\circ }$, the temporal POD mode frequency analysis for three sample reduced velocities is shown in figure 15(c i–iii). The first sample is taken at a reduced velocity of
  $U^*=4.73$ (figure 15c i), where the cylinder oscillates at the first bending mode with a frequency of
  $f_{os}^*=0.7$. The first temporal mode has the highest level of energy, and its frequency content is the same as the oscillation frequency (
 $\,f_{temporal}^*=0.7$). The second temporal POD mode shows a multi-frequency response, with contributions of both the first frequency (
 $\,f_{temporal}^*=0.7$) and the second frequency, which is twice the oscillation frequency (
 $\,f_{temporal}^*=1.4$). The spatial structure of the dominant POD modes (first and second mode) shown in figure 18(a i, ii) indicates a pair of vortices shed from the top of the cylinder and a single vortex shed from the bottom side of the cylinder, in agreement with the vortex shedding pattern observed in the HB flow visualisation (figure 11c i, ii). The third and fourth POD modes with low energy levels exhibit an irregular shedding pattern (figure 18a iii, iv), indicating a galloping-type response. The shedding frequency is a combination of the first (
 $\,f_{temporal}^*=0.7)$ and the second (
 $\,f_{temporal}^*=1.4$) temporal POD mode frequencies, which are equal to and two times the oscillation frequency (
 $\,f_{os}^*=0.7$). The observation of a higher shedding frequency than the oscillation frequency, combined with the presence of a non-symmetric shedding pattern, confirms the occurrence of a galloping-type response at this sample reduced velocity.
The frequency analysis of the temporal POD mode at the second sample reduced velocity at  $U^*=8.58$ is shown in figure 15(c ii). The first and second temporal modes have the dominant temporal frequency at
  $f_{temporal}^*=1.35$, which is close to the dominant frequency of oscillation at
  $f_{os}^*=1.3$. The first temporal POD mode also has a contribution at the frequency of
  $f_{temporal}^*=2.7$, which is twice the oscillation frequency and corresponds to the torsional frequency of the structure. The dominant spatial structures of the POD modes are
  $2P$ with an upside oblique due to the torsion of the cylinder (figure 18b i, ii). The third and fourth POD modes have a lower level of energy and exhibit an irregular shedding pattern (figure 18b iii, iv). A 2-D plane of the spatial structure is shown in figure 21(a,b) for the first and second POD modes, demonstrating the oblique
  $2P$ shedding. The shedding frequency, which is the combination of the dominant temporal POD mode frequencies (modes one and two), is higher than the oscillation frequency, confirming the galloping-type response at this reduced velocity.

Figure 21. 2-D spatial structures of the streamwise velocity for the first and second POD modes at the reduced velocity of  $U^*=8.58$ (a,b) and
  $U^*=13.52$ (c,d) at an angle of attack of
  $\alpha =60^{\circ }$.
The third sample reduced velocity is selected at  $U^*=13.52$, at which the oscillation frequency corresponds to the merged bending and torsion frequency of the cylinder, with the first bending mode contributing to an oscillation frequency of
  $f_{os}^*=1.1$ and a merged frequency of
  $f_{os}^*=2.2$. The temporal POD mode frequency analysis shows that the dominant temporal frequency is
  $f_{temporal}^*=2.2$ for the first and second POD modes, which is equal to and two times the oscillation frequencies that contribute to the structural response. The spatial structure of the first two POD modes shows an oblique
  $2P$ shedding pattern, in which the
  $2P$ pattern is related to the temporal shedding frequency, which is two times the first bending frequency (
 $\,f_{os}^*=0.5\unicode{x2013}1.1$). The observed oblique pattern is due to the torsional oscillations of the cylinder (see figure 18c i, ii). Higher POD modes with low levels of energy show small-scale turbulence structures (see figure 18c iii, iv). A 2-D plane of the first two spatial POD modes is shown in figure 21(c,d). The shedding frequency, which is equal to the dominant temporal POD mode frequency (
 $\,f_{temporal}^*=2.2$), is higher than the dominant oscillation frequency. This confirms that the flexible triangular cylinder exhibits a galloping-type response at this sample reduced velocity.
In summary, the temporal and spatial analysis of the flow field features using the POD technique has revealed the strong correlation between the vortex dynamics and the structural response of the cylinder. By comparing the shedding and oscillation frequencies, we have successfully categorised the FIV response of the system into VIV (synchronised frequencies) and galloping-type (non-synchronised frequencies) responses. Comparison of our results with previous FIV studies of elastically mounted rigid triangular cylinders (Seyed-Aghazadeh et al. Reference Seyed-Aghazadeh, Carlson and Modarres-Sadeghi2017) shows that at low reduced velocities, such as  $U^*=4.73$ at the angle of attack of
  $\alpha =0^{\circ }$, the shedding pattern and frequency for the flexible triangular cylinder are the same as those of the rigid cylinder. This is before the contribution of higher bending modes and torsional mode to the structural response occurs. However, during the galloping-type response for the rigid cylinder (Seyed-Aghazadeh et al. Reference Seyed-Aghazadeh, Carlson and Modarres-Sadeghi2017; Chen et al. Reference Chen, Ji, Xu, Zhang and Wei2020), the number of shed vortices at each cycle of oscillation is higher compared with the relatively high-frequency and low-amplitude oscillation of the flexible cylinder observed in our study. We observed that the flexible cylinder's oscillation has a high frequency and low amplitude due to the boundary condition that does not allow the oscillation to increase unboundedly. Another factor was also the excitation of higher modes (such as the second bending mode) at higher reduced velocities due to the cylinder's flexibility.
5. Conclusion
In this study, the FIV response of a fully submerged flexible triangular cylinder in a recirculating water tunnel has been investigated. The flexible triangular cylinder had a mass ratio of 0.8 and an aspect ratio of 30, and it was placed horizontally at three different angles of attack. The experiments were performed over a range of reduced velocities corresponding to a Reynolds number range of 364–3600. It was found that the FIV response of the flexible cylinder strongly depended on the angle of attack, and the response type varied with the reduced velocity and angle of attack. The results showed that for an angle of attack of  $\alpha =0^{\circ }$, the amplitude of oscillations in the CF and IL directions was relatively smaller than those observed for higher angles of attack of
  $\alpha =30^{\circ }$ and
  $60^{\circ }$ over the entire range of reduced velocities tested. At an angle of attack of
  $0^{\circ }$, the response type was of VIV type in the range of reduced velocities of 4.73–10.77, whereas it was of galloping type in the range of reduced velocities of 11.33–16.27. On the other hand, the response type for angles of attack of
  $30^\circ$ and
  $60^\circ$ was of galloping type for the entire range of reduced velocity tested due to non-synchronised vortex shedding and oscillation frequency of the cylinder at these angles of attack.
The flow field analysis, which included both qualitative and quantitative flow visualisation methods, confirmed the three-dimensionality of the flow field. It was observed that the vortex shedding pattern in the wake of the triangular cylinder was sensitive to the angle of attack using the HB flow visualisation technique. The 3-D quantitative flow field measurement was done using the time-resolved volumetric PTV techniques. POD was applied to the flow field results captured from the PTV analysis to extract the dominant modes of the flow field data in terms of the level of their energy contributing to the TKE. The temporal and spatial modes of the dominant POD mode were extracted and used to find the system response. The frequency analysis of the temporal POD mode was used to find the vortex shedding frequency. The dominant spatial POD modes were used to find the vortex shedding pattern in the wake of the cylinder. The comparison of the structural and shedding frequency beside the vortex shedding pattern, which were obtained from temporal and spatial POD mode analysis, were used to find the response type (VIV or galloping).
Our study showed that the main difference between the galloping-type response of this flexible cylinder and those rigid cylinders in the literature was the amplitude of oscillation resulting from the difference in the experimental set-up, which affected the boundary conditions and mode shapes. The boundary condition and the IL displacement, along with the flexibility of the cylinder, led to an unbalanced moment on the triangular cylinder, which caused it to rotate. The rotation of the cylinder played an important role in the system response, as it led to a temporal and spatial change in the modified angle of attack, resulting in a change in the separation point and the interaction of the after-body and vortex/shear layers downstream of the cylinder. The findings of this study may be useful for researchers and engineers working in the field of fluid–structure interaction to help improve the designs of structures in fluid flow environments
Table 1. Experimental parameters and structural characteristics of test cylinder.

Supplementary movies
Supplementary movies are available at https://doi.org/10.1017/jfm.2023.1024.
Declaration of interests
The authors report no conflict of interest.


