Introduction
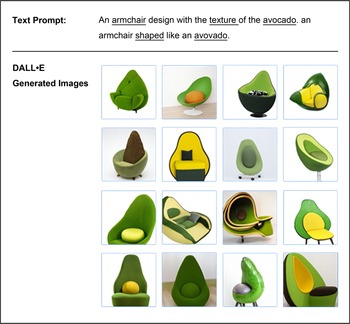
Automatic image generation based on textual description has a wide range of applications in different fields, such as computer-aided design, electronic games, and creative art generation. To improve the performance of generative models, OpenAI proposes DALL⋅E (Ramesh et al., Reference Ramesh, Pavlov, Goh, Gray, Voss, Radford and Sutskever2021) to generate images with lines of natural language textual prompts. In the DALL⋅E demonstration, text-to-image generation offers extensive and advanced capabilities. One of the most impressive aspects of DALL⋅E is its ability to combine irrelevant concepts to produce plausible images. The formation of new objects through real or imaginary things or ideas is possible due to the combinatory character of language itself. Figure 1 illustrates the example of an avocado chair formed by combining two concepts (i.e., an armchair and an avocado). From the perspective of creativity, the way in which DALL⋅E creates images and explores the structure of language composition through the combination of concepts in various formats conforms to combinational creativity proposed by previous research (Boden, Reference Boden2004). While this impressive AI image generation is challenging in human creative industries (Amato et al., Reference Amato, Behrmann, Bimbot, Caramiaux, Falchi, Garcia, Geurts, Gibert, Gravier, Holken and Koenitz2019), there is still no efficient way to assess the creativity of machine-generated content. The demand for creativity assessments of machine-generated images is increasing.

Fig. 1. The image samples containing combinational creativity generated by DALL⋅E.
A number of creativity assessment are employed to evaluate design and engineering-related products including images, such as Consensual Assessment Technique (CAT), Turing Test (TT), and Torrance Tests of Creative Thinking (TTCT). CAT requires experts in the relevant fields as assessors and a minimum number of seven assessors to ensure the reliability of the assessment (Amabile, Reference Amabile1982). The results of CAT are related to the knowledge and personality of the experts, which can lead to problems such as evaluation bias and unreliability. In contrast, TT is a non-expert evaluation method widely used for machine-generated content. The recruitment of design students who can participate in the TT is also relatively easier to achieve than the recruitment of design experts, and the sample size of participants for the evaluation is relatively larger. Although these traditional assessments can be used to assess combinational creative images, they are still time-consuming to implement and could introduce human bias. Therefore, exploring an automated assessment to assess generative images containing combinational creativity needs to be considered.
There have been several metrics to evaluate the imaging quality (e.g., clarity, variety, and the machining degree of text-image or image-image) in a distributional similarity based or image-image similarity based way for the different computer vision tasks, such as Inception Score (IS) (Salimans et al., Reference Salimans, Goodfellow, Zaremba, Cheung, Radford and Chen2016), Fréchet Inception Distance (FID) (Heusel et al., Reference Heusel, Ramsauer, Unterthiner, Nessler and Hochreiter2017), Generated Image Quality Assessment (GIQA) (Gu et al., Reference Gu, Bao, Chen and Wen2020), and Contrastive Language-Image Pre-training (CLIP) (Radford et al., Reference Radford, Kim, Hallacy, Ramesh, Goh, Agarwal, Sastry, Askell, Mishkin, Clark, Krueger and Sutskever2021). IS assesses the clarity and diversity of the images by determining the probability of the class distribution of the images in the output layer in the InceptionV3 network. FID calculates the distance between the two multivariate normal distributions of the generated and real images at the feature level. Unlike IS and FID which evaluate the quality of a large batch of generated images, GIQA is a metric quantitatively evaluating of a single generated image. CLIP is a pre-trained network to evaluate the similarity between images or between image and text. However, it is unknown whether they are applicable for assessing the creativity embedded in the machine-generated combinational images. It is, therefore, necessary to determine whether these metrics are suitable for assessing images arising from combinational creativity.
To determine the effectiveness of existing automated metrics including IS, FID, CLIP, and GIQA in assessing the images containing combinational creativity, we firstly collected image data from DALL⋅E and human designers and allocated them into eight groups for further assessments. These images were generated (or designed) according to the eight sets of textual prompts we provided, where these textual prompts already had the characteristics of combinational creativity as required by combinational creativity theory. We conducted a CAT and a TT for the eight groups and ranked the eight groups in their combinational creativity. The ranking results of these two assessments will be used as a benchmark (external validation) for the combinational creativity assessment. Four metrics for automated evaluating image quality then were conducted to score the images in each group and to rank the eight groups.
Although these four metrics are not comparable with each other due to their different mathematical implications and starting points for assessing image quality, we can compare the results of their respective score rankings for the eight groups in terms of their consistency with the results of the benchmark creativity evaluation rankings. Finally, we summarized the consistency of the four automated image-generated metrics comparing with the human creativity assessment and discussed their applicability and limitation from the perspective of combinational creativity images. Our finding shows that GIQA has some potential for assessing the images containing combinational creativity. This metric can be used as an efficient automated combinational creativity assessment to evaluate the images containing combinational creativity in the relevant task of design and engineering such as image-based conceptual sketch, digital design image, and prototyping image.
Our contributions are summarized as below:
1) We conducted the CAT and the TT as the external validations to assess the quality of machine-generated images containing combinational creativity. Both expert and non-expert assessments are considered as benchmarks to determine the applicability and reliability of the metrics to be measured under the different settings of combinational creativity assessment. Note that the effects of the subjective experience form the assessor during the experiments should be considered.
2) We proposed an approach for indirectly comparing generative image metrics with different purposes. We firstly compared the consistency results between the benchmarks and each metric separately. The result is based on CR and AVR, which are two comparable spaces. A comprehensive analysis of this consistency can identify whether a metric matches the external validations (i.e., CAT and TT). The metric with a degree of consistency close to the external validations can be considered as a potential automated method for assessing the image containing combinational creativity.
3) A self-build dataset named “base-additive dataset” was constructed for reducing the impact of irrelevant image data on the real distribution during the metrics calculation. It consists of pairs of combinational elements (i.e., the base and the additive) in each group to be tested. This helps the metrics to evaluate combinational creativity features more accurately.
Related work
Generative model
Text-to-image synthesis in computer vision aims to understand the relationship between vision and language and generates corresponding images according to the input textual prompts. It is an intricate generative task because machine learning models must understand the concept attributes, the spatial concepts, and the relationships between different concepts to produce images based on the arising understanding. Text-to-image generation demands that the machine has a deep understanding of what is being created, both semantically and contextually. Such multimodal generative tasks have great potential for applications such as image production, video games, and computer-aided design.
In the field of text-to-image generation, Mansimov et al. (Reference Mansimov, Parisotto, Ba and Salakhutdinov2015) introduced alignDRAW which is a generative model combining VAE with alignment model-generated images that correspond to input text. However, the generative adversarial network (GAN)-based models have low performance for complex and domain-general scenes. To address this issue, large-scale generative models based on autoregressive transformer (Vaswani et al., Reference Vaswani, Shazeer, Parmar, Uszkoreit, Jones, Gomez and Polosukhin2017) have been proposed. With the introduction of attention mechanism and huge number of parameters, the quality and comprehension of generative models has reached an unprecedented level. Among the generative models, DALL⋅E, a state-of-the-art model, is a 12-billion parameters GPT-3 version (Brown et al., Reference Brown, Mann, Ryder, Subbiah, Kaplan, Dhariwal, Neelakantan, Shyam, Sastry, Askell and Agarwal2020) which trains a discrete variational autoencoder (dVAE) compressing image into token and an autoregressive transformer modeling the joint distribution over text and image tokens. DALL⋅E receives text and image as a data stream of 1280 tokens, and all tokens are generated using the maximum-likelihood algorithm during the training period. It can create anthropomorphic objects, transform the underlying attributes of objects (i.e., surface material, composition form, internal and external structure), and achieve the ability of controlling the viewpoint of the scene. Furthermore, it can combine unrelated concepts according to textual prompts and generates real or imaginary objects, which means it not only can be extended to a variety of industrial design tasks but also has the ability of combinational creativity. In addition, two other approaches, CogView (Ding et al., Reference Ding, Yang, Hong, Zheng, Zhou, Yin, Lin, Zou, Shao, Yang and Tang2021) and ERNIE-ViLG (Zhang et al., Reference Zhang, Yin, Fang, Li, Duan, Wu and Wang2021), have recently been proposed, which claim to deliver similar combinational creativity abilities and excellent performance similar to DALL⋅E but so far lack convincing sample cases.
DALL⋅E can select and combine arbitrary concepts from the semantic space to create novel images, which seems to demonstrate the ability of content understanding and creativity like human intelligence. We have seen the potential of DALL⋅E for generating creative contents, especially combining two non-relevant concepts. By exploring the possible combinations and forms of caption, DALL⋅E can approximate the ability of visual mental imagery. Compared to other generative models, DALL⋅E demonstrates more powerful capabilities in image generation and it can generate unusual visual content which is difficult for human imagination, as required by the input textual prompts. Therefore, we chose DALL⋅E as the target generative model to collect the machine-generated images for our assessment experiment.
Combinational creativity
Combinational creativity is the easiest way to generate ideas by exploring non-relevant combinations of familiar concepts (Han, Reference Han2018). The generated ideas can be expressed as the form of visual content such as texts and images, auditory contents such as sounds and music, and even abstract conceptions (Ward and Kolomyts, Reference Ward and Kolomyts2010). Visual content is more intuitive compared with textual content, which allows the human brain to quickly process the design ideation (Muller, Reference Muller1989). Based on this, recent research of combinational creativity image synthesis (Chen et al., Reference Chen, Wang, Dong, Shi, Han, Guo, Childs, Xiao and Wu2019) has focused on derivative noun-noun combinations, where a noun is not limited to a single word, such as “stationery”, but can also be a noun phrase, such as “tea pot”. In the two conceptual nouns, one of them is called “the base” which is the main or basic concept in a creative combination; another one is called “the additive” which is an additional concept to form the combination. For example, in the combinational description of “lamp in the style of paper carving”, “lamp” is the base and “paper carving” is the additive.
Inspired by visual mental imagery (Kosslyn et al., Reference Kosslyn, Ganis and Thompson2001), text-to-image synthesis in the computer vision domain aims to understand the relationship between vision and language and generate corresponding image according to the input textual prompts (Frolov et al., Reference Frolov, Hinz, Raue, Hees and Dengel2021). The images synthesized by DALL⋅E seems to contain a certain degree of combinational creativity, as it generates images that match the textual content based on the prompts with combinational creativity. However, whether an individual or a system is creative or not needs to be determined by creativity assessment (Kaufman et al., Reference Kaufman, Plucker and Baer2008b). To our knowledge, there is no evidence of evaluation methods specifically designed for combinational creativity in the field of generative models. The challenge of discovering an efficient creativity assessment for generative models is deemed worthy of attention. We will discuss the potential automated metrics for evaluating image creativity in the section “Turing test”.
Consensual assessment technique
An important issue in creativity research is how to find an appropriate method to measure it. Early creativity assessments are mainly based on divergent thinking test, such as Unusual Usage Test (UUT) and TTCT (Torrance, Reference Torrance1972), which emphasize conceptual fluency. However, these methods face challenges of predictiveness and reliability. Amabile believes that a person's creativity can be reflected in the inventiveness of their creations, while the inventiveness of creations is mainly reflected in the novelty and appropriateness (Amabile and Hennessey, Reference Amabile and Hennessey1999). Although people may not all define creativity in the same way, experts in the same field will have a largely shared view of the same work (i.e., consensus). Based on this, a method of assessing creativity called CAT has been proposed (Amabile, Reference Amabile1982). This method is a subjective assessment based on expert consensus. It has been widely used for creativity in the fields of art (Burnard and Power, Reference Burnard and Anne2013), writing, as well as design (Cropley and Kaufman, Reference Cropley and Kaufman2013) and engineering (Denson et al., Reference Denson, Buelin, Lammi and D'Amico2015) in relation to problem-solving. Although the assessment performance of CAT is widely accepted, effective CAT implementation is often difficult and expensive to assemble a group of relevant experts.
Turing test
In computational creativity fields, subjective evaluation has been widely adopted for assessing the creativity of generated outcomes due to the fuzzy definition of creativity combined with varying goals of the evaluated generative models (Yang and Lerch, Reference Yang and Lerch2020). TT, one of the subjective evaluation methods, is often used as a non-expert method to assess computational creativity (Bringsjord et al., Reference Bringsjord, Bello, Ferrucci and Moor2003; Boden, Reference Boden2010). The main purpose of TT is to examine whether a machine has the ability to exhibit intelligent behavior that is comparable to, or indistinguishable from a human (Turing, Reference Turing2007). TT and its variation provided a fundamental method for assessing computational creativity. For instance, in the field of text generation, LeakGAN (Guo et al., Reference Guo, Lu, Cai, Zhang, Yu and Wang2018) is used to take TT to compare the generated text with the real text by inviting online subjects, in which the subjects selected sentences they believed to be real. In the field of music generation, several studies (Pearce and Wiggins, Reference Pearce and Wiggins2007; Chu et al., Reference Chu, Urtasun and Fidler2016; Shin et al., Reference Shin, Crestel, Kato, Saito, Ohnishi, Yamaguchi and Harada2017) utilize TT to assess generative music systems by asking subjects to identify the pieces considered to be composed by a human as opposed to a machine, and the purpose of these studies show how close is the music generated to the real sample.
Metrics for assessing generative images quality
To measure the quality of images produced by the generative model, a list of metrics adopting the pre-trained neural network for generative model have been proposed, such as IS (Salimans et al., Reference Salimans, Goodfellow, Zaremba, Cheung, Radford and Chen2016) and FID (Heusel et al., Reference Heusel, Ramsauer, Unterthiner, Nessler and Hochreiter2017). IS and FID can provide objective criterion in terms of image quality and assist the model to improve the generation performance, and they both receive the highest rating of all GAN evaluation methods sorted by Borji (Reference Borji2019). The IS focuses on evaluating the performance of generative models with image classifiability and diversity, and the FID measures the generated image quality by calculating the distance of data distribution between real images and generated images, which can detect intra-class mode dropping and to be consistent with human judgment. Nevertheless, these two approaches are limited to assess the quality of whole image sets instead of individually evaluating each of the images.
To address this issue, GIQA was proposed, which can be conducted with two approaches (i.e., learning-based and data-based). The learning-based approach trains a convolutional neural network (CNN) to regress the quality scores of each image, and the data-based approach estimates the quality of each image in a probability estimation perspective. For the text-to-image synthesis, the alignment degree between generated images and input texts is also an essential criterion to be measured. Thus, previous research utilized CLIP which is a neural network learned vision concept from natural language supervision. By calculating the cosine similarity of the text and image embedding, CLIP was capable for measuring the alignment degree and re-rank images generated by DALL⋅E in each caption.
Although these metrics are valid for assessing the generative quality of images, it is unclear whether they are still applicable for assessing the combinational creativity embedded in the generated images. It is, therefore, necessary to investigate the validity of each metric for assessing the combinational creativity of images.
The assessment method
Method overview
Inspired by the mechanism of the combinational creativity and the text-to-image generation, we first extracted key information from the text with the combinational creativity prompts, including the base and additive, where the base is the subject of the combinational creative information, and the additive is a decorative expression of the subject base. To build the combinational creativity dataset used for subsequent experiments, we collected the image data from human designer and machine, where the machine-generated images were created by DALL⋅E according to the input textual prompts. These images with their corresponding textual description are distributed to eight groups. Each group couples of human-created images and machine-generated images. To our knowledge, existing image datasets are built based on ontologies composed of common objects in our daily life, and these datasets are usually used in the evaluation task of generative models. However, the concepts in the collected bases and additives are not fully covered in these datasets. Therefore, a new dataset was constructed from the Internet based on the previously collected texts of the base and additive. This dataset was named the base-additive. It can be used in subsequent evaluation tasks.
In this study, to explore the applicability of assessing generative images containing combinational creativity and to seek an automated assessment solution, four of the most representative metrics (i.e., IS, FID, CLIP, and GIQA) which are widely used for image quality evaluation were selected in the combinational creativity image assessment experiments. However, these four metrics assess “image quality” from different principles and starting points. IS estimates the clarity and diversity of the generated images based on how well the image classifier Inception v3 classifies the generated images. In contrast, FID captures the similarity between the generated images and the real image set. Both are metrics based on data distribution. CLIP is originally used for the task of reordering the images generated by DALL⋅E. It can assess how well individual images match a given description text or image. GIQA defines “quality” as the similarity of a generated image to the distribution of the ground-truth dataset, which has the ability to score the single generated image in a way that previous methods of generative model metrics lack. It can be seen that these four metrics cannot be directly compared with each other due to their different calculation methods and ranges of results. To address this challenge, we used the ranking results of eight groups in creativity assessments based on human evaluation as benchmarks, and indirectly evaluated the performance of the four metrics by comparing the results of them with those of the benchmarks, respectively.
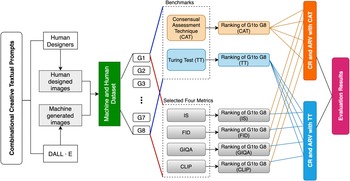
We choose CAT and TT as two benchmarks for evaluating the quality and creativity of generated images. CAT can be used as a valid expert assessment method to evaluate the creative quality of images in the eight groups. In the CAT for this study, 19 experts with 20 years’ experience in design were asked to assess the novelty, feasibility, and combinational completeness of the images. In addition, a non-expert-based TT was conducted. Ninety-seven non-expert subjects were asked to determine whether an image matched the corresponding combinational textual description and is machine or human to generate the image. Chosen both expert and non-expert assessments is to ensure a valid external validation. This validation will be used to analyze the feasibility of the four metrics for the combinational creativity assessment. The group ranking of the CAT and TT were used to calculate the consistency with the group ranking of each metric. The effectiveness of assessing images containing combinational creativity can be determined by comparing the coincident rate (CR) and the average rank variation (ARV) of each metric with the results of the TT and CAT. The process of our study is shown in Figure 2.

Fig. 2. The process of evaluating metrics for creative images.
Machine and human datasets
To compare the ability of graphical design and creative concepts combination for human and machine, we respectively collected human-designed and machine-generated images. For this purpose, we provided eight groups of textual prompts containing combinational creativity. These textual prompts contained descriptions of product design as well as of conceptual fragments from earlier stages of divergent thinking, such as combining different materials, synthesizing the appearance of objects, and generating imaginary animals. Table 1 shows the textual prompt as well as base and additive corresponding to all eight classes of images. Human and machine were both required to sketch and design corresponding visual images based on these prompts containing combinational creativity.
Table 1. Groups of prompt related to combinational creativity and corresponding base and additive

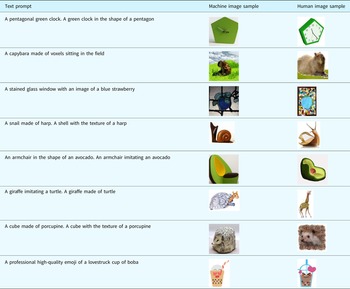
To build the machine image set, DALL⋅E generated 32 images for each group of textual prompts. However, we found that machine and human may have different insights on “what a good image is” by observing these images. From the machine's point of view, the 32 images were carefully selected by machine itself. Nevertheless, some of images were obviously inferior to the human-designed images from human being's perspective, or the generated contents did not match with text descriptions. Therefore, to reasonably select the generated images with better quality, we conducted an image selection based on the CAT approach. Three designers with design experience of at least 5 years were asked as the assessors to select the best five images in each group. The assessment process required the assessor to select the image that best matches the content of the corresponding textual description. Specifically, a high-quality image means that it should show the main features of the base, while also reflecting the decorative features of the additive. The main feature indicates that the image shows the main function of the base and the decorative feature can be the texture, color, or style of the additive. The final selection results of each group are shown in Table 2.
Table 2. Selected DALL⋅E generated image and human-designed image

To build a human-designed image set, we invited seven designers who had received undergraduate education in design for 4 years. Each designer was required to design eight different images for each group according to the textual descriptions. The designers were required to complete each image class within 1 h. They were allowed to search the information of each individual concept in a combination (i.e., base or additive) on the Internet. They were restricted to search the relevant images containing combined concepts to avoid any impact from existing combinational design solutions. In addition, the graphical design was required without descriptive texts, and the background should be white or as clean as possible. These image contents should conform to the corresponding text description as much as possible and the individual concepts that composed the combinational images should be recognizable by human intuitive observation. We also selected the best five images from each group with the same process of machine images selection. The selected human-designed images with the selected machine-generated images together constituted as the test data in the subsequent assessments, as shown in Table 2.
Base–additive dataset
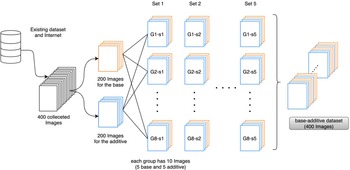
The calculation of the four metrics is influenced by the distribution of the dataset. However, the existing image sets do not fully cover the base and the additive concepts related to our combinational image creativity experiment. For this reason, we collected 400 images from existing datasets and the Internet by respectively searching the corresponding the base and the additive keywords in Table 3. The collected images were required to be clear and complete and to keep the diversity of images with different characteristics. They were then constructed as a small dataset called the base–additive dataset. As illustrated in Figure 3, the dataset was divided into five sets. Each set contains eight groups of combinational classes. Each group of classes includes five base images and five additive images. The selected image samples in the dataset are shown in Table 3. This dataset will be used in the calculation of FID and CLIP.

Fig. 3. The construction process of the base–additive dataset.
Table 3. A demonstration of base and additive

In addition, most images in the same category appear to be the same in the current dataset and the Internet. Although we removed duplicates and approximate images and kept as many images with large differences as possible for each category, we finally collected only 400 images. GIQA thus used MS-COCO (Lin et al., Reference Lin, Maire, Belongie, Hays, Perona, Ramanan, Dollár and Zitnick2014) which is most commonly used in computer vision as the real dataset.
Evaluation experiment
Consensual assessment technique
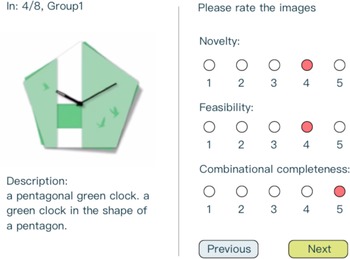
We organized a CAT experiment to evaluate the creativity scores of human and machine images for each group. Nineteen experts who all had 15–20 years of experience in creative design-related fields were recruited. We randomly mixed the machine and human images in each group before assessment and hid the corresponding producer labels. The raters knew each image and its corresponding combined text description but did not know who had generated the image. They also were asked to rate each image on three dimensions: novelty, feasibility, and combinational completeness. The scoring method is based on a five-point Likert scale. All raters rate a random image on a score of 1–5 after getting an overall understanding of all the images to be assessed, as shown in Figure 4. In order to ensure the reliability of the CAT results, the raters were in an experimental environment where there was no other suggestive information. They were not allowed to use any equipment or tools to assess the images. The whole assessment process was based entirely on the raters’ own experiential understanding and implicit reflection on the combinational creativity. Each rater was limited to 30 min to complete the assessment. After the experiment was completed, the ranking results and reliability of the CAT were calculated separately.

Fig. 4. A user interface example of our CAT.
Turing test
We adopted the TT to examine to what extent the images generated by DALL⋅E can “fool” the human subjects by combining prompts in terms of the combinational creativity. The ranking result among the different groups was used as the benchmark to identify the effectiveness of the four metrics for the generative model on the combinational creativity. Our task settings were split into eight classes of groups, and each group contained five human-designed and five machine-generated images. In our TT setting, the images in each group were randomly ordered and each image was shown along with the text descripting the image contents. Ninety-seven participants, who had not viewed the test images before, successfully took part in the experiment. The number of those who had received drawing training was divided into three intervals: less than 1 year, 1–3 years, and more than 3 years, with the numbers representing 58%, 19%, and 23% of the overall population, respectively. The test starts with eight groups of questions where each group contains 10 images, and each image pairs with the corresponding text description. The invited subjects were asked to choose one option that the image produced by either human or machine, as shown in Figure 5. However, there are some effects that may interfere with the accuracy of the results during the experiment, such as aligning the UI to be uniform across different devices, requiring no less than three seconds to answer each question, and preventing answering multiple times through phone number verification from the same person. In addition to ensuring the independence and objectivity of the process, we did not provide any response to the subjects during the test. At the end of the test, the subjects can choose to leave the feedback which describes the reason of judging whether an image is human-designed or machine-generated, or the difficulties they encountered during the testing process. Their feedback was collected and then used in the subsequent analysis of the combinational creativity.

Fig. 5. A webpage example of our TT.
Metrics for generative models
In this section, we selected four metrics to calculate the quality of the generated images, which include IS, FID, GIQA, and CLIP. In our evaluation experiment, each metric feeds in the images from human and machine of eight groups respectively to obtain the corresponding calculation results.
-
1) Inception Score (IS)
The IS experiment was divided into two parts. In the first part, we calculated the overall IS from Group 1 (G1) to Group 8 (G8) of the machine images and the human images separately. To objectively evaluate the scores, we also calculated the IS of the five groups of base–additive datasets as experimental controls. In the second part, IS was calculated separately for each of the eight groups in the machine and human datasets. The equation for IS is as follows:
 $$\matrix{ {{\bf {IS}}( G ) = \exp ( {{{\mathbb E}}_{{{\bf x}}\sim p_g}D_{\rm KL}( {\,p( {y \mid x} ) \parallel p( y ) } ) } ) } \cr }, $$
where x is an image sampled from p g. D KL(p, q) calculates the KL divergence between p and q, where p(y|x) is the conditional class distribution and p(y) is the marginal class distribution. The IS mainly considers two criteria of evaluating the performance of the generative model. The first criterion is that the generated image should possess a clear classifiable object. If the probability of an image belonging to a certain class is very high and to other classes is low, p(y|x) will be considered as low entropy. The second one is the diversity of label classes of generated images. If the generative model generates images with enough classes, p(y) will be considered as large entropy. When the generated images have been satisfied with the two conditions above, the KL divergence between p(y|x) and p(y) is larger, which allows the generative model to have a higher IS with better generation performance, and vice versa.
-
2) Fréchet Inception Distance (FID)
The FID experiment was also divided into two parts. In the first part, we calculated the FID performance of machine images and human images both on the MS-COCO dataset and on the five groups of base–additive dataset. In the second part, the eight groups of machine images and human images were subjected to FID calculation with the corresponding base images and additive images of the five groups of base–additive datasets, respectively. The equation is as shown in Eq. (2). By extracting the activation vectors exported by the real image r and the generated image g in the last pooling layer and calculating their mean (μ r, μ g) and covariance matrix (Σr, Σg), respectively, to summarize as a continuous multivariate Gaussian distribution, the Fréchet distance is used to calculate the distance between two Gaussian distributions, as shown in the following equation. If the FID is lower, it means that the generated image will be closer to the real image (Heusel et al., Reference Heusel, Ramsauer, Unterthiner, Nessler and Hochreiter2017).
 $${\rm FID}( {r, \;g} ) = \Vert {\mu_r} - {\mu_g} \Vert _2^2 + {\rm Tr}\left({{\rm \Sigma }_r + {\rm \Sigma }_g-2\sqrt {( {{\rm \Sigma }_r{\rm \Sigma }_g} ) } } \right).$$
-
3) Generated Image Quality Assessment (GIQA)
Due to the lack of evaluation results from real data, we preferred to use the proposed hyperparameters M = 70 and K = 3500 in Gu et al. (Reference Gu, Bao, Chen and Wen2020), for the calculation. In addition, to ensure the accuracy of the results, the dataset size of GIQA needs to be greater than 5000 images. Therefore, the MS-COCO dataset was chosen as the real dataset. By modeling the probability distribution of the real data, the corresponding probability calculates for each generated image to score the quality. As stated by the authors, GIQA is divided into the two methods: the parametric Gaussian Mixture Model (GMM) based and the non-parametric K-nearest neighbors (KNN) based (Gu et al., Reference Gu, Bao, Chen and Wen2020). Since both methods have their own advantages, such as the GMM-based method is easy to use and the KNN-based method has no training phase, and there is no evidence to prove which method is more appropriate for assessing creativity, we chose to introduce both methods to our experiment. In the calculation of GMM-GIQA and KNN-GIQA, the scores of all machine images and human images were calculated at once, respectively.
The GMM-GIQA adopts the GMM which is the weighted sum of Gaussian densities of M component for real data capture. We denoted the mean vector of the Gaussian density of the ith component as μ i and covariance matrix as Σi. The probability of image  ${\cal I}$ was calculated as follows:
 $${\,p(x \mid \lambda;)= \sum \limits_{i=1}^{M} w^i g(x \mid \mu^i, \Sigma^i )},$$
where  ${\bf x}$ is the feature extracted from image
  ${\cal I}$, let the feature extraction function to be f(*) , then
  ${\bf x} = f( {\cal I} )$.
  ${\bf w}^i$ is the mixture weight coefficient satisfying
  $\sum \nolimits_{i=1}^{M} {\bf w}^i =1$ and
  $g( {{\bf {x} \mid \boldsymbol {\mu} }^i, {\bf \Sigma }^i} )$ is the component of Gaussian densities. In addition, all relevant parameters of the GMM are represented as
  $\lambda = \{ {{\bf w}^i, \;{\boldsymbol \mu }^i, \;{\bf \Sigma }^i} \}$.
The authors of the KNN-GIQA suggested that calculating Euclidean distance of features between the generated image and the nearby real image in the feature space can express the probability of the generated image. Let the feature of generated image as  ${\bf x}$ and the feature of real image near the kth in the feature space as
  ${\bf x}^k$, then the probability of the corresponding generated image can be expressed as:
 $$p(\mathbf x)= \frac {\rm 1}{\it K} \sum \limits _{ \it k={\rm 1}}^{\it K} \frac{\rm 1}{ \parallel {\bf x} - {\bf x}^{\it k} \parallel^ {\rm 2}}. $$
-
4) Contrastive Language-Image Pre-training (CLIP)
The experiment was composed of three parts. In the first part, we calculated the cosine similarity by inputting each of the eight groups of machine images and human images with corresponding textual prompts into CLIP. In the second part, to evaluate the ability of computing the base and additive representations of the combined creative images of CLIP, we respectively input machine and human images with their corresponding base and additive text into CLIP to compute the cosine similarity. In the third part, considering that CLIP maps input texts and images into its multimodal embedding space, we aimed to test the performance of the method of computing the distance between images in the CLIP embedding space. Based on this, we chose to use the base–additive dataset as a contrast to calculate the cosine similarity between the machine images as well as the human images and all the base images as well as the additive images.
Evaluation result analysis
Subjects were not asked to provide any private information during the whole test. Their data were collected with the consent of the subjects and used only in this study. The results of CAT, TT, and four metrics for generative models are presented in the following subsections.
Result of CAT
We first calculated the reliability of the CAT. In this experiment, we used Cronbach's α to represent the reliability coefficient, where the items chosen were novelty, feasibility, and combinational completeness, and the descriptives were item and scale. After the calculation in SPSS, the result of Cronbach's α is 0.698. To reduce the bias affected by variable factors in the CAT, we therefore assigned the same weights of 1:1:1 to three attributes (i.e., novelty, feasibility, and combinational completeness), respectively. We then separately calculated the average of these attributes for human and machine images in each group. The CAT scores of human and machine for each group were obtained by Eq. (5), where N for novelty, F for feasibility, and C for combinational completeness, and W x for the weight of each attribute.
 $$S_{{\rm CAT}} = {N}{W}_n + {F}{W}_f + {C}{W}_c.$$
In addition, we calculated the percentage difference (PD) between machine and human images in each group and each group was ranked according to the PD from largest to smallest. The results are shown in Table 4. It should be noted that the bold values in this table (as well as other tables applicable) indicate the higher one of scores. The qualitative results between humans and machines and the ranking results among the eight groups will be used in a subsequent consistency analysis between the CAT and each metrics.
Table 4. The score and ranking results in CAT

Result of TT
After the TT was completed, we tallied the accuracy of human-designed images versus machine-generated images for each group. Each group reflects the rate where subjects successfully identify images as human or machine. The results are shown in Table 5.
Table 5. The accuracy of successful identification in TT

We calculated the proportion of each image considered as human-designed, similar to the way of calculating the quantitative scores of each text based on the TT in LeakGAN. The higher percentage means the more creative of the combinational images. Therefore, we named this proportion as “human-like score (HLS)”. For the human-designed images, the human-like score represented the accuracy of the TT. For the machine-generated images, the score was calculated by “1 – the accuracy of the TT”. However, we found that the calculated human-like scores did not fully reflects the real situation in the aspects of human perception. For example, when a human-designed image has obvious hand-drawn traces, it directly has been judged as a human-designed image by most subjects without considering other factors. This might result that a human-designed image still receives a high rate from subjects even if this image is with poor creativity and lacking design logic. To increase the reliability of the human-like score, we removed two hand-drawn images from 40 human-designed images in the G1 and G3. The accuracy of the G1 drops to 0.405 and the G3 drops to 0.632. Averaging the human-like scores of all groups, the human score was 0.5076 and the machine score was 0.4214, where the human score was 20.47% higher than the machine. We also calculated and ranked the PD of human-like scores between the human and the machine for each group, the equation is shown as follows, where the HLSh and HLSm represent the human-like score of human and that of machine, respectively. The qualitative results between humans and machines and the ranking results among the eight groups will be used in a subsequent consistency analysis between the TT and each metrics (Table 6).
 $${\rm PD} = \displaystyle{{{\rm HL}{\rm S}_{\rm h}-{\rm HL}{\rm S}_{\rm m}} \over {{\rm HL}{\rm S}_{\rm m}}} \times 100{\rm \% }.$$
Table 6. Human-like score after dropping images

Result of IS
In the IS experiment, the machine scored 8.17 and human scored 7.08, where the machine is better than the human by 13.34%, which had contradicted with the results of the TT. To compare the computation results, we calculated IS for each set in the base–additive datasets. The mean value of the five sets was 13.32 (σ = 1.05). The calculation results are shown in Figure 6.

Fig. 6. IS result comparison.
To explore the IS in each group in depth, we calculated the IS for the human and machine images of each group in eight groups. The results are presented in Table 7. Since each group included less images (only five images) which leads to the lack of the feature diversity, the IS score in each group is lower than the overall score. By observing the gap between the score of human and machine in each group, we found that the G6 is a unique group in which the human score is better than machine and the results of G8 was close to the same group in the TT.
Table 7. IS of each group of human and machine

Result of FID
The experimental results of FID are shown in Figure 5. The score of the human images were 4.57% lower than the machine images. Similarly, the FID was calculated on the five base–additive datasets and the results are shown in Figure 7, where the mean of the five images were 227.0 (σ = 1.49) for human and 288.2 (σ = 3.97) for machine, and the FID of human images were 21.24% lower than the machine images. In addition, the mean of the base–additive dataset was 28.03% lower for the human images and 12.82% lower for the machine images than that of the MS-COCO dataset. Such results indicated that the dataset constructed by bases and additives was somewhat closer to the human and machine designed images than the MS-COCO dataset. The base–additive dataset better reflected the distance between the tested images and collected base and additive images was more suitable as a dataset for combinational creativity.

Fig. 7. Human and machine FID result on the MS-COCO and base–additive datasets.
To further calculate the distance between the base and additive concepts, we split the datasets into eight classes and calculated their FIDs, which are shown in Table 8. The mean of the base of eight groups were 341.1 (σ = 82.02) for the human and 366.4 (σ = 91.64) for the machine, and the mean of the human was 6.90% lower than that of the machine. The mean of the additive of eight groups for the human was 358.4 (σ = 113.20), while that for the machine was 449.6 (σ = 97.14), where the FID of the human was 20.29% lower than that of the machine.
Table 8. Base and additive FID result comparison

To understand the degree of authenticity of the base and additive concepts presented in individual images containing combinational creativity, we averaged two sets of FIDs with equal weights. The results showed that the mean of FID was 349.8 (σ = 82.71) for human and 408.0 (σ = 79.72) for machine, where the human score was 14.27% lower than the machine.
Result of GIQA
GMM-GIQA
The calculation results are shown in Table 9, where the GMM-GIQA score had a wide threshold ([−10^7, 10^5]). By comparing the GMM-GIQA score of all images of human and machine, we can calculate the rankings of each image. Therefore, instead of comparing the average scores of each group and the difference between human and machine, we averaged the GMM-GIQA scores of each group and then ranked the scores of all groups. We also introduced the mixed mean FID of base and additive and compared the rankings with the GMM-GIQA results. A comparison between the GMM-GIQA and the FID showed that 13/16 of the groups had no more than two place changes in the ranking and 6/16 of the groups had unchanged ranking. In all groups, the G4 had the larger variance and received a lower average ranking in the FID experiment. The final rankings of the two methods were not quite distinguishing because both the GMM-GIQA and the FID might be based on the calculation with the output in the last pooling layer of Inception V3.
Table 9. GMM-GIQA result and rank comparison

KNN-GIQA
The results are shown in Table 10, where a higher score obtained for an image means that it is closer to the real image dataset. We used the analysis same as the GMM-GIQA. The ranking results showed that the human images received higher scores than the machines in the G2–G7, which accounts for 75% of the total groups. The overall average ranking of the human is 6.88 and that of the machine is 10.13. By comparing with the FID ranking results, 56.3% of the groups changed within two places, and 18.3% of the groups unchanged. However, some of them, such as G3 and G4, had a significant difference. Also, the results of KNN-GIQA were significantly different when compared to GMM-GIQA.
Table 10. KNN-GIQA result and rank comparison

Result of CLIP
CLIP: text-image
The measured cosine similarity of each group is shown in Table 12. Surprisingly, in the textual prompts provided by DALL⋅E, the mean cosine similarity was 0.323 (σ = 0.028) for the human images and 0.340 (σ = 0.017) for the machine images, where the human score is 5.0% lower than machine. However, in the base, the mean was 0.269 (σ = 0.021) for the human images and 0.265 (σ = 0.014) for the machine images, where the human score is 1.5% lower than machine; in the additive, the mean was 0.257 (σ = 0.037) for the human images and 0.254 (σ = 0.021) for the machine images, where the human score is 1.2% lower than machine. The results are shown in Figure 8.

Fig. 8. Average text-image cosine similarity of human and machine.
The results indicated that the human-bdesigned images were closer than the machine images in matching the base and additive text features, but the image features of machine were closer than the human-designed in original prompt. We further found that there were 87.5% of image groups that machine images were closer to the text features than humans for the original prompt text. There were five eighths of groups in the base and four eighths of groups in the additive in which human images were closer to the machine images.
For this reason, in the process of pre-training, the CLIP predicted which text segment to be paired with the corresponding images instead of the previous approach which predicted the specific text corresponding to each image in a paragraph of text. Although the trained CLIP model showed a good performance in text matching task with a single subject, the text content of the descriptions corresponding to the images containing combinational creativity might be more complicated or the text combination form and descriptions were different from the training. This problem would lead to difficulties in the CLIP assessment for the images containing combinational creativity.
In this regard, instead of calculating the cosine similarity of original textual prompt, we only calculate the cosine similarity of the base and additive and average them to get a single new score, the result is shown in Table 11. The average result seems to possess higher CR with the TT since only the G8 showed that machine images were better than human images in the TT. Therefore, this new method would be more appropriate to evaluate the alignment between text and image when used CLIP for the assessment of images containing combinational creativity.
Table 11. CLIP's text-image cosine similarity comparison of human and machine

CLIP: image-image
The mean of each group and the overall mean are presented in Figure 9 and Table 12. Compared with the base image, the mean cosine similarity was 0.645 (σ = 0.048) for the human groups and 0.655 (σ = 0.034) for the machine groups; Compared to the additive images, the mean was 0.661 (σ = 0.058) for the human groups and 0.633 (σ = 0.048) for the machine groups. By averaging the two groups, the results showed that the human score is 1.2% higher than machine, where the overall cosine similarities were 0.653 for the humans and 0.644 for the machines. In addition, the cosine similarity of image-image was nearly twice higher than that of text-image, which means that using real images as references better reflected the quality of the images to be tested. Thus, we believed that the feature difference of CLIP model measured between image-image can also be used to rank the quality of the images containing combinational creativity.

Fig. 9. Average image-image cosine similarity of human and machine.
Table 12. CLIP's image-image cosine similarity of human and machine

Metrics ranking
To identify the consistency of the metrics with the CAT and TT in terms of the qualitative analysis, we compared the similarity of the qualitative results on the human–machine comparisons in the same group with the result of metrics and the human-like score. For example, the result of the GMM-GIQA showed that the human images were better than the machine images in the G1–G7 but the G8 with the opposite result, which was concluded that the CR was 75% by comparing with the CAT and 100% by comparing with the TT. In addition, we also calculated the CR between CAT and TT, which shows 75% consistency. The complete results of CR and rankings are presented in Table 13.
Table 13. The ranking of coincident rate with CAT and TT

The CR can reflect the qualitative consistency of human and machine image scores in each group between a metric and the benchmarks. However, the degree to which human and machine images are evaluated as good or bad in each group and the overall ranking similarity were still unknown. We calculated the variations of original ranking from the G1 to G8 of all metrics by comparing with the CAT and TT. By averaging these variations in each metric, we obtained the quantitative results for all metrics and calculated these results based on Spearman's Footrule as the ARV, where n is the total number of groups, G Ti represents the ith group of CAT or TT, and G Xi represents the ith group of an evaluation method:
 $$\matrix{ {{\rm ARV} = \displaystyle{1 \over n}\mathop \sum \limits_{i = 1}^{i = n} \vert {G_{Ti}-G_{Xi}} \vert } \cr }. $$
If the ARV of a metric is lower, it means that the overall consistency of that metric is closer to the CAT or TT. The ranking of the ARV is shown in Table 14.
Table 14. The ranking of average rank variation

Discussion
Machine and human images are generated based on the corresponding combinational creative textual prompts by generative model and human designers, respectively. Due to the excellent diversity generation capabilities of DALL⋅E who can generate images with different styles and appearances, a small number of samples may lead to biases in the subsequent assessment (Ramesh et al., Reference Ramesh, Pavlov, Goh, Gray, Voss, Radford and Sutskever2021). We, therefore, generated 32 iterations for each set of texts. The human-designed images are also based on the human brain's understanding of the combination of textual content. The design of combinational image by a single individual is unable to reflect the overall level of human design (Sternberg and Kaufman, Reference Sternberg and Kaufman2018). Seven designers with the same design experience were therefore asked to participate in the human image data collection to reduce the bias. The selection process of the machine and human dataset is implemented based on the CAT, which can reduce the bias in choosing certain types of images from each group. However, the combinational quality of the selected images may therefore be affected by human designer bias (Kaufman et al., Reference Kaufman, Baer, Cole and Sexton2008a). A further study could mix the machine and human test images before the selection but needs to consider how to keep the number of selected human images and machine images to be equally proportional.
Combinational creativity product seeks to show both features of the base and the additive on a single frame. As the combinational creativity images of each group do not exist in the reality, it is unrealistic to collect these kinds of images as the comparison dataset for the task of evaluation. We, therefore, built the base–additive dataset to enable the image evaluation metrics to correctly capture both the base and additive information. While this self-built dataset improved the accuracy and reliability of both combinational features in our experiment, it cannot be used in GIQA due to its small size (Gu et al., Reference Gu, Bao, Chen and Wen2020). Although the MS-COCO set contains 80 classes natural images as well as common images from life and is widely used for various computer vision tasks, it does not cover all the base or additive concepts relevant to the experiment (Kim, Reference Kim2019). This may lead to an evaluation bias in the GIQA metric test. In our experiments, we calculated the image score corresponding to the base and the additive separately and then averaged them. Although this approach meets part of the requirements for combinational creativity assessment (Han, Reference Han2018), we do not consider the difference in the proportion of features between the base and the additive. In contrast, combinational creativity theory indicates that the combinational concept should reflect a combined form with the base as a primary idea and the additive as an additional idea. Further research should be done to construct the large base–additive dataset to cover the GIQA test and to investigate the impacts of the base–additive dataset in computational proportion and fusion algorithms.
In the CAT experiment, we primarily explored combinatorial creativity and therefore specified three assessable attributes: novelty, feasibility and combinatorial completeness. To reduce the bias affected by variable factors in the CAT, we preferred to give same weight to each attribute. However, the setting of the weights may affect the scores of creativity assessment (Sarkar and Chakrabarti, Reference Sarkar and Chakrabarti2011). The effect of different weights on the assessment of combinational creativity in CAT can be considered in the future study. The Cronbach's α of the CAT experiment is 0.698, which very close to 0.7. The score been very close or more than 0.7 can be an acceptable level of reliability (Bujang et al., Reference Bujang, Omar and Baharum2018). Our experiment thus can be considered reliable in general. The reliability and validity of the CAT may be affected by the number of assessors and the assessment bias of individual experts (Kaufman et al., Reference Kaufman, Baer, Agars and Loomis2010). Future research can increase the number of assessors and tailor more rigorous selection criteria of the experts. Although the TT is based on non-experts, the results of the TT are related to the knowledge of the participants. Participants’ perceptions and biases may affect the accuracy of the TT (Adams et al., Reference Adams, Banavar and Campbell2016). Since the knowledge required in our designed test is basic, and rigorous instructions were given in our test, the bias involved in the test is minimized. We chose both CAT and TT as benchmarks and compared their consistency. This allowed us to verify whether the metrics to be measured are still applicable and replicable under different creativity assessment settings. The results show that their CR is 75% and ARV is 1.5, which is the highest consistency of all the results. This means that subsequent comparisons of the replicability of the same metrics in different contexts are reliable. In this paper, only the CAT and TT settings are valid. However, it is unclear how other creativity assessment scales such as the TTCT (Torrance, Reference Torrance1972) and the “How Do You Think” (HDYT) test (Davis, Reference Davis1975) impact in the metrics’ consistency. Future research can replace different settings to verify the applicability of the metrics.
IS, FID, GIQA, and CLIP are the metrics that determine the performance of generative models by assessing image quality, which are widely used in the field of computer vision (Ravuri and Vinyals, Reference Ravuri and Vinyals2019; Gu et al., Reference Gu, Bao, Chen and Wen2020; Ramesh et al., Reference Ramesh, Dhariwal, Nichol, Chu and Chen2022). However, all four metrics have different starting points and mathematical rationales for assessing image quality. It is not reasonable to compare their scoring results directly. To address this challenge, we constructed two consistency ranking spaces, namely CR and ARV. CR compared the consistency between each metric and the benchmarks on the overall qualitative results of G1 to G8. ARV is based on Spearman's Footrule (Diaconis and Graham, Reference Diaconis and Graham1977), and it compared the consistency between each metric and the benchmarks on the overall quantitative results of G1 to G8. The consistency results of each metric with external validation on the CR and ARV are comparable. A comprehensive analysis of this consistency can identify whether a metric matches the external validations. The metric with a degree of consistency close to the external validations can be considered as a potential automated method for assessing the image containing combinational creativity.
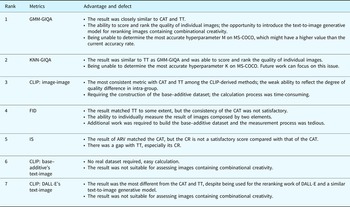
Although the CR of GIQA in the CAT dropped compared with that of in the TT, it still shows the best consistency performance in the overall CAT. Although the ARV ranking of KNN-GIQA in the CAT dropped two places from TT, the average ARV score of GIQA remains the same. Considering CR and ARV together, the highest consistency with both CAT and TT is the GIQA series which includes KNN-GIQA and GMM-GIQA. Despite IS receiving an average score of 17.5 on the ARV ranking, its CR result has a large gap compared with CAT and TT. We thus did not recommend using IS for assessing image's combinational creativity. In the CR result GMM-GIQA obtained the first rank, but it received an average score of 2.125 which followed that the scores of IS in ARV ranking. The reason behind this seemed to be more pronounced on the GMM-GIQA using the GMM (Gu et al., Reference Gu, Bao, Chen and Wen2020). In CLIP experiments, two CLIP text-image methods both had higher ARV scores. As the feature distribution on the training set does not match that on the combinational creativity image set, we do not recommend the use of CLIP test-image for combinational creativity assessment. The scores and rankings of ARV of CLIP text-image in CAT and TT are stable, yet CLIP image-image fluctuated considerably. A possible explanation for this might be that the set of textual mappings is disjoint with the set of image mappings in the embedding space of CLIP, yet in the image-image method, the two embeddings are closer together in the image-image method (Liang et al., Reference Liang, Zhang, Kwon, Yeung and Zou2022). By averaging the summation of the CR ranking of and ARV ranking of in each evaluation method separately, we presented the final suggestions of their performance and applicability as well as the strengths and weaknesses for assessing images containing combinational creativity, as shown in Table 15. In contrast to human-evaluation based assessments such as CAT and TT, the four metrics are not labor-intensive. They can automatedly complete creativity assessment in a short time.
Table 15. Suggestions of image metrics for assessing combinational creativity

In general, we suggest using GMM-GIQA and KNN-GIQA as an automatic combinational creativity assessment in the cases where images are generated by machines, no experts available or where image data amount is too large to complete manually. For the human-designed images with a small sample, we still recommend using traditional assessments such as CAT. Future research can introduce the large base–additive dataset to identify the most accurate hyperparameter of GIQA. As GIQA can rank individual images, future research comparing with the CLIP in terms of accuracy in the assessment for combinational creative images is therefore suggested.
Conclusion
This study is a preliminary exploration of using four image quality evaluation metrics in the field of computer vision to identify the applicability in assessing generative images containing combinational creativity. Although existing traditional creativity assessments such as CAT and TT are widely used to assess creativity, they are still time-consuming to implement and expensive to recruit assessors. In this paper, four metrics (IS, FID, GIQA, and CLIP) for image quality assessment are considered as potential automated means of assessing combinational creativity. However, these four metrics are not directly comparable with each other, as they each have a different starting point and mathematical principle. To address this challenge, we first collected the images containing combinational creativity from DALL⋅E and human designers as the eight groups to be assessed. We used the ranking results from the eight groups creativity assessment based on human evaluation (i.e., CAT and TT) as the benchmarks and indirectly assessed the performance of the four metrics. The overall consistency of ranking results with CAT and TT can reflect the capacity of the metrics to assess combinational creativity in generative images to some extent. By comparing the consistency with the CR and ARV of the benchmarks, the results show that not all metrics are applicable to assessing images containing combinational creativity. In the four metrics, the GIQA had shown the closest consistency to the TT. It also showed the potential value of assessing combinational images containing combinational creativity and even the ranking of creative text-to-image generative models. Although the IS and FID had shown a certain degree of consistency with the CAT and TT separately, they often carry with tedious and time-consuming calculating problems. We doubt the authenticity and reference of the CLIPs in the context of assessing combinational creative images, and do not recommend using CLIPs as an assessment for image's combinational creativity. In summary, GIQA showed a high level of agreement with the results of the human creativity assessment, which can be regarded as a potential metric for automated combinational creativity assessment. It also can be used to evaluate the images containing combinational creativity such as image-based conceptual sketch, digital design image, and even the prototyping image in the tasks of creative design and engineering.
Financial support
This paper is funded by the National Natural Science Foundation of China (No. 62207023) and The Ng Teng Fong Charitable Foundation in the form of ZJU-SUTD IDEA Grant.
Conflict of interest
The author(s) declare none.
Boheng Wang is a PhD student at the Dyson School of Design Engineering at the Imperial College London, London, UK. His research focuses on computational creativity, design knowledge retrieval, and data-driven design. His research interests fall within AI-aided design, 3D based knowledge retrieval and combinational creativity.
Yunhuai Zhu is an undergraduate majored in computer science and technology at the College of Computer Science and Technology, Zhejiang University. His research interests include: data analysis and computational creativity.
Liuqing Chen is a ZJU-100 Young Professor at the College of Computer Science and Technology, Zhejiang University, Hangzhou, China. His research interests include: Design Intelligence, Computational creativity, UI Design, Human-computer interaction, and Artificial intelligence.
Jingcheng Liu is an undergraduate majored in electrical engineering and automation at the International campus, Zhejiang University. His research interests include: big data and artificial intelligence, and application of AI in design.
Lingyun Sun is a Professor at Zhejiang University. His research interests include Big Data and AI, Digital Twins, Human-Computer Interaction, Information Visualization. He is currently the Vice Dean of College of Computer Science and Technology at ZJU and the director of International Design Institute at ZJU.
Peter Childs is the Professorial Lead in Engineering Design and was the founding Head of the Dyson School of Design Engineering at Imperial College London. His general interests include creativity, innovation, design; sustainable energy and robotics. He is the Editor of the Journal of Power and Energy, Professor of Excellence at MD-H, Berlin, Advisor Professor at Guangdong University of Technology, the Advisory Chair for the Leonardo Centre on Business for Society, and Director and Chairperson at BladeBUG Ltd and Founder Director and Chairperson at QBot Ltd.