With the increase in lifespan, healthy ageing has become a public health priority. The World Health Organization's 2002 Active Ageing Report(1) has recommended a life-course approach to older-age health and well-being that acknowledges the critical periods throughout life when an individual may be particularly vulnerable to environmental exposures and the cumulative effect of these environmental influences that may interact with genetic propensity to health or disease(Reference Darnton-Hill, Nishida and James2, Reference Ben-Shlomo and Kuh3).
Dietary intake has been identified as one of the readily modifiable environmental factors that influence health, in particular intake levels of antioxidant vitamins and minerals and nutrients such as folate, vitamin B12, n-3 fats and dietary fibre(4). Recently, there has been increasing interest in analysing dietary intake in terms of whole dietary patterns, given that individual nutrients or even foods are not eaten in isolation and may act in a synergistic manner to influence outcomes(Reference Hu5, Reference Kant6). Dietary patterns may be defined by two general approaches. In the first approach, dietary intake indices or scores group together foods and nutrients that are associated with health or other outcomes(Reference Newby and Tucker7). Diets are assessed for the presence or absence of the relevant foods/nutrients and the scores indicate the level of adherence to the a priori defined dietary pattern(Reference Kant6), for example the Healthy Eating Index developed by the US Department of Agriculture(Reference Kennedy, Ohls and Carlson8) and the Mediterranean Diet Score(Reference Trichopoulou, Costacou and Bamia9). The second approach is driven by the statistical relationships between dietary variables and is not dependent on the pre-existing definitions of diet quality, although theoretical interpretability is an important consideration when evaluating the patterns that emerge from the data(Reference Newby and Tucker7). These methods generally derive dietary patterns that are specific to a particular population; nonetheless, common patterns such as ‘healthy’, ‘traditional’, ‘sweets’ and ‘Western’ patterns have emerged consistently across studies(Reference Moeller, Reedy and Millen10). Cluster analysis, factor analysis and principal component analysis all fall into this category of data-driven methodology(Reference Newby and Tucker7).
Although there is some theoretical and methodological debate surrounding the objectivity and reproducibility of dietary patterns(Reference Kant6, Reference Newby and Tucker7, Reference Martínez, Marshall and Sechrest11, Reference Schulze and Hoffmann12), the approach is nonetheless considered a valuable exploratory tool in nutritional epidemiology(Reference Slattery and Boucher13). Instantiations of both healthy and unhealthy dietary patterns have been associated with older-age disease risk factors such as hypertension, cholesterol levels and BMI measurements(Reference Weikert, Hoffmann and Dierkes14, Reference van Dam, Grievink and Ocke15) and with the risk of developing CVD(Reference Tourlouki, Matalas and Panagiotakos16), cancer(Reference Murtaugh, Sweeney and Giuliano17), diabetes(Reference Schulze, Hoffmann and Manson18, Reference Kim, Park and Grandinetti19), Alzheimer's disease and cognitive decline(Reference Barberger-Gateau, Raffaitin and Letenneur20, Reference Akbaraly, Singh-Manoux and Marmot21), as well as with all-cause mortality(Reference Huijbregts, Feskens and Rasanen22–Reference Heroux, Janssen and Lam25). Furthermore, it has been recognised that dietary patterns are determined within the context of the broader sociodemographic environments of the population under consideration; age, sex, ethnicity, education and occupation have all been shown to influence the consumption of particular dietary patterns. Such information can enable the identification of those groups that would benefit from public health initiatives regarding dietary intake(Reference Darmon and Drewnowski26–Reference Mishra, Ball and Arbuckle29).
Given the demonstrated relationships between dietary patterns and disease risk, together with the salience of a life-course perspective on healthy ageing(Reference Ben-Shlomo and Kuh3, Reference Whalley, Dick and McNeill30), assessing dietary patterns from across the lifespan could contribute valuably to our understanding of long-term dietary influence on older-age health outcomes. However, accruing actual lifetime dietary data requires longitudinal cohort studies and these are relatively rare; in those that do exist, the comprehensive biological and psychosocial data necessary for life-course research were not collected always or even available(Reference Ben-Shlomo and Kuh3, Reference Wadsworth, Butterworth and Hardy31). Thus, despite the plausible influence of earlier-life dietary intake on later-life health, dietary assessment across multiple life periods remains a considerable research challenge. An alternative approach to logistically complex and costly longitudinal cohort studies, when investigating the contribution of lifetime diet to older-age outcomes, is to use the recall of lifetime diet from cognitively healthy older adults(Reference Hosking, Danthiir and Nettelbeck32).
Although measurement error is inherent in past diet recall, it may have some utility in dietary epidemiology(Reference Friedenreich, Slimani and Riboli33, Reference Dwyer and Coleman34), in particular on a group level when the reported intake level, either low or high, is used to predict disease outcomes(Reference Dwyer and Coleman34). Recently, the Lifetime Diet Questionnaire (LDQ), a non-quantitative, retrospective lifetime FFQ, has been proposed as an instrument to assess lifetime diet in older people. It has been shown to have excellent test–retest reliability in an older cognitively healthy sample, with an average reproducibility correlation coefficient of 0·81 for the recall of dietary intake across five life periods(Reference Hosking, Danthiir and Nettelbeck32). One method of examining the potential utility of the LDQ as an instrument to examine relationships between older-age health outcomes and dietary intake from across the lifespan is to first extract plausible dietary patterns from the LDQ and then relate these to outcomes. To this end, the present study conducted an exploratory factor analysis (EFA) of the items from the LDQ. Subsequently, associations were investigated between these LDQ factors and current demographic and cardiovascular health variables.
Methods
Participants
Participants were drawn from the Older People, Omega-3 and Cognitive Health (EPOCH) cohort, who participated in an 18-month randomised controlled trial assessing the effects of n-3 fish oil on cognitive functioning in a cognitively healthy, community-dwelling population of older adults in Adelaide, South Australia(Reference Danthiir, Burns and Nettelbeck35). The present study was conducted according to the guidelines laid down in the Declaration of Helsinki, and all procedures involving human subjects were approved by the Commonwealth Scientific and Industrial Research Organisation (CSIRO) Human Ethics Committee. Written informed consent was obtained from all subjects. A total of 352 subjects (53·7 % female) completed the LDQ, aged in the range of 65–91 years (mean 73·12 (sd 5·47) years). Of the total participants, 26·4 % of men and 37·6 % of women completed schooling to year 10 and 22·7 % of men and 21·8 % of women completed schooling to year 12. A bachelor or higher degree was held by 8·2 % of the sample. Median gross household income accorded with the national median for individuals aged 65 years and above(36). For 95 % of the participants, English was the first language, but 13 % had at least one parent from a non-Anglo background. The baseline Mini Mental State Examination(Reference Folstein, Folstein and McHugh37) mean score for the LDQ cohort was 28·71 (sd 1·32).
Mann–Whitney non-parametric tests demonstrated that there were no significant differences between LDQ participants and non-participants from the EPOCH cohort in age, level of education and baseline Mini Mental State Examination score.
Lifetime diet assessment
The LDQ is a self-reported, non-quantitative FFQ that divides the life into periods of 15 years from childhood until older age. The questionnaire has been described previously(Reference Hosking, Danthiir and Nettelbeck32), but a brief overview is given: participants recalled their average consumption frequency of various food items on a four-point frequency scale ranging from ‘rarely/never’ to ‘daily’. The food groups and their items were the same for each life period, with exceptions being food items that were unlikely to have been consumed during a particular life period, specifically alcohol-related questions for childhood and those related to lard for the later-life periods. The number of items for each life period ranged from seventy-four in childhood to seventy-nine in early adulthood, with adulthood and middle age each having seventy-eight items. Questions assessing physical activity levels were also asked as a proxy measure for energy expenditure across each life period. One question was asked for each life period regarding the frequency per week of vigorous, moderate and light physical activities. One additional question (for all periods except for childhood) was included to determine the physical activity level (‘little, some, frequent, or heavy and frequent’) associated with occupation. Recall across life periods was aided by a series of autobiographical cue questions that were completed before the period-specific dietary recall questions; these were related to family and working lives at the time as well as to important world or personal events that may have occurred.
The LDQ has been shown to have good reproducibility in an older population with test–retest correlations for each of the life-period questionnaires being 0·86 for childhood, 0·81 for early adulthood, 0·82 for adulthood, 0·79 for middle age and 0·80 for older age. The average-weighted κ statistics for food items between the two administrations of the questionnaire were 0·55 for childhood, 0·36 for early adulthood, 0·52 for adulthood, 0·051 for middle age and 0·53 for older age(Reference Hosking, Danthiir and Nettelbeck32).
Current diet
Current diet was assessed by the Victorian Cancer Council FFQ (CCFFQ)(Reference Giles and Ireland38), an eighty-four-item assessment of dietary intake over the previous 12 months. Response frequencies ranged from 1 (‘never’) to 10 (‘three or more times a day’) with the exception of eggs (number per week) and bread, milk and sugar, for which responses were defined as units per d.
Reported current intake was used in subsequent analyses to control for the known influence of current diet recall on past diet recall(Reference Dwyer, Gardner and Halvorsen39). To ensure that current intake was represented in a manner commensurate with past intake, foods that were assessed by the CCFFQ but not by the LDQ were excluded (eighteen items). In addition, consumption frequencies of the relevant items were converted to equivalent times per week, and composite items were made from some individual foods to represent the food groupings in the LDQ; for example, the items cabbage, broccoli and cauliflower in the CCFFQ were combined into a single item ‘cruciferous vegetables’ and bacon, ham, sausages and salami in the CCFFQ were combined to form ‘processed meats’, as represented in the LDQ.
Demographic and cardiovascular health variables
Extensive health and demographic information was collected from the EPOCH cohort, which has been fully described in the study protocol(Reference Danthiir, Burns and Nettelbeck35). The variables included in the present analyses were age, sex, years of education (including schooling and post-schooling), parental birth country and parental income, current income level, pack years of smoking and both current and past physical activity levels. Indicators of cardiovascular health were measured by BMI, systolic blood pressure, diastolic blood pressure, and concentrations of LDL-cholesterol, HDL-cholesterol, total cholesterol and TAG. Medication use was also assessed for hypertension, high cholesterol levels and cardiac conditions. Descriptive statistics for these variables are presented in Table 1.
Table 1 Descriptive statistics for the subsample of the Older People, Omega-3 and Cognitive Health cohort who answered the Lifetime Diet Questionnaire (Mean values and standard deviations)

* Pack years = (cigarettes/d × years of smoking)/20.
Procedure
All EPOCH participants were given the opportunity to participate in the lifetime diet assessment. The study was described to the participants individually during a study visit to CSIRO Animal Food and Health Sciences (the study centre). On providing written informed consent, they were given the self-administered LDQ to complete at home and provided with detailed verbal and written instructions as to the study requirements. The questionnaire for each life period was completed in chronological order, 1 d at a time, over 5 d to minimise memories from one life period intruding into another period. In addition, given that each life period covered up to 15 years, the participants were asked to recall their most representative diet and to report their average consumption of seasonal foods. All participants completed the first four life periods: ‘childhood’; ‘early adulthood’; ‘adulthood’; ‘middle age’. The fifth life period, ‘older age’, only applied to the participants who were aged 80 years or over, of whom there were thirty.
Statistical analyses
Missing data
Participants who had responses missing for their whole life periods or >80 % of responses missing across any life period (n 3) were excluded from the following missing value analysis.
The remaining missing data in the LDQ were of two types: item non-response (mean per person 6·43 (sd 10·79)) and multiple consumption frequencies reported for a food item (mean per person 1·06 (sd 0·55)). Fatigue may cause elderly participants to skip questionnaire items for foods not eaten(Reference Fraser, Yan and Butler40, Reference Michels and Willett41), so for this population, it was assumed that null responses generally equated to the ‘rarely/never’ consumption frequency. It has been shown that the greater the proportion of initially missing items, the greater the probability that these missing responses are likely to be true zeros (where zero equals non-consumption). This probability declines when the level of non-response reaches a threshold where 25 out of 80 items are missing responses (approximately 30 %)(Reference Fraser, Yan and Butler40). Thus, missing responses herein were equated with a food being ‘rarely/never’ eaten (mean n for all life periods 58 (sd 3·65)), except when a participant had less than the average number of non-responses (mean n for all life periods 184·25 (sd 10·84)) or a large number (>30 %) of non-responses (mean n for all life periods 30 (sd 5·88)) for items in each life period. These items, in addition to those with multiple responses, were missing at random and estimated with the missing value analysis in SPSS for Windows statistical package version 17.0.1 (SPSS, Inc.).
Dietary patterns
EFA was conducted on the food frequency response items for each separate life period assessed by the LDQ (EFA could not be conducted on the questionnaire data from the older-age period (>75 years) because only thirty participants fell within this age range), using M-plus Statistical Analysis with Latent Variables version 5.1 (Muthén LK and Muthén BO). The weighted least-squares matrix estimator was used as estimates were based on polychoric correlations as opposed to the more commonly used Pearson's product-moment correlation coefficient. Polychoric correlations are appropriate when variables are ordinal or categorical, but can be assumed to represent a latent continuous construct, in this case, consumption frequency. Thus, the strength of linear relationships between ordinal variables that would be otherwise attenuated, due to the limited range of response frequencies, is better represented by a polychoric correlation coefficient rather than by Pearson's correlation.(42).
The consumption frequency of all items was checked before analyses. It is feasible that relationships between foods that were either never or rarely consumed by the majority of participants may still define dietary patterns; however, any subsequent associations between such a factor and other measures would be driven by a very small proportion of the overall sample. Consequently, items that had 70 % or greater ‘rarely/never’ responses were excluded from the EFA. The number of foods excluded and the number entered for each life period were as follows: childhood – seventeen foods excluded and fifty-seven foods entered; early adulthood – ten foods excluded and sixty-nine foods entered; adulthood – seven foods excluded and seventy-one foods entered; middle age – four foods excluded and seventy-four foods entered.
A range of two to ten factors were extracted and an oblique rotation was specified (oblimin) to allow factors to be correlated. All factor correlations were below 0·3, so the orthogonal rotation varimax was subsequently chosen to promote a simple structure of the rotated solution and therefore aid in factor interpretability(Reference Kline43).
An important decision when conducting a factor analysis is how many factors are to be retained. There is an extensive literature on the processes available to determine factor retention and their relative strengths and weaknesses, although theoretical plausibility is the overarching criterion(Reference Fabrigar, Wegener and MacCallum44, Reference Stellefson, Hanik and Chaney45). In these analyses, the factor retention decision was guided by the break point in the scree plot(Reference Costello and Osborne46), interpretability and having a clear factor structure(Reference Kline43). The participants received a score on each factor extracted from the LDQ by weighting all food items by their factor loadings and then by summing the items(Reference DiStefano, Zhu and Mîndrilă47).
EFA was also conducted on the abbreviated (forty-seven items) CCFFQ in M-Plus, following a procedure similar to that followed for the LDQ and using the frequency of intake as the input variable. There were no missing data, and responses had a frequency range from 1 (rarely/never) to 10 (three or more times a day), so data were treated as continuous. Bread, milk, sugar and eggs were exceptions; these were assessed as units per d (so the number of slices of bread, etc.) and recoded as binary values representing consumption v. non-consumption, except for eggs where the response frequency was number per week and the original coding was retained. M-plus can conduct EFA simultaneously on both binary and continuous variables; factors were extracted using the maximum-likelihood estimator.
Current diet and demographic variables as predictors of Lifetime Diet Questionnaire dietary patterns
Regression models were carried out using IBM SPSS for Windows statistical package version 20 (IBM Corporation) with each past dietary pattern being the outcome variable in separate models. First, current dietary patterns were used as predictors of each of the LDQ patterns across all life periods to determine the influence of current dietary intake on past diet recall; the average R 2 value for each life period indicated the average percentage of variance in recalled past diet that was accounted for by current diet. Next, demographic variables were entered to demonstrate relevant associations between these variables and past dietary intake as assessed by the LDQ.
The LDQ factor scores were normally distributed, and regression diagnostics showed no influential cases or serious violations of assumptions. Models were adjusted for current diet, physical activity (past and present) and the other past dietary factors; the study was powered at 0·8 to detect a medium effect size with α (two-tailed) at 0·05(Reference Green48).
In preliminary analyses, a number of LDQ factors showed higher-than-acceptable variance inflation factor values in the regression models, indicating multicollinearity among the LDQ factors. This would be problematic in further analyses when individual LDQ patterns were to be the predictors of model outcomes; when predictors are significantly related, their shared variance makes it impossible to reliably identify the individual contribution of any one of them(Reference Myers49). One method to deal with multicollinearity among predictors is to compute principal components and use these components instead of the original variables in the analyses(Reference Tabachnick and Fidell50); therefore, for each LDQ factor, a set of four unrelated principal components that accounted for approximately 80 % of the shared variance among all the other past dietary patterns was created. Subsequently, these LDQ principal components, rather than the original LDQ factors, were entered as covariates in the models.
Lifetime Diet Questionnaire dietary patterns as predictors of cardiovascular risk factors
In separate analyses, cardiovascular risk factors were outcomes in the regression models with the individual LDQ factors as predictors. Multiple regression was used to test associations with the continuous variables of BMI, blood pressure and lipid measurements. The variables for BMI and TAG were log10-transformed, and those for systolic and diastolic blood pressure were square root-transformed to normalise the distributions(Reference Tabachnick and Fidell50). Covariates were entered simultaneously into the models. These included age, sex, number of years of education, smoking history (pack years), income (parents' income for childhood and early adulthood and current income for adulthood and middle age), life period-specific physical activity, current physical activity, medication use, current dietary factors and the four principal components representing the other past dietary factors.
In total, three dichotomous variables (use/do not use medication) represented medication use for managing hypertension, cholesterol levels or cardiac conditions. Logistic regression was employed for models using these variables. Restrictions were imposed by sample size on the number of covariates possible to be included in the logistic regressions(Reference Peduzzi, Concato and Kemper51) compared with the previous multiple regressions. These models were adjusted for age, sex, the relevant life-period physical activity variable, current physical activity and current diet; the number of ‘events per variable’ precluded the entry of the other LDQ principal component scores as covariates.
Results
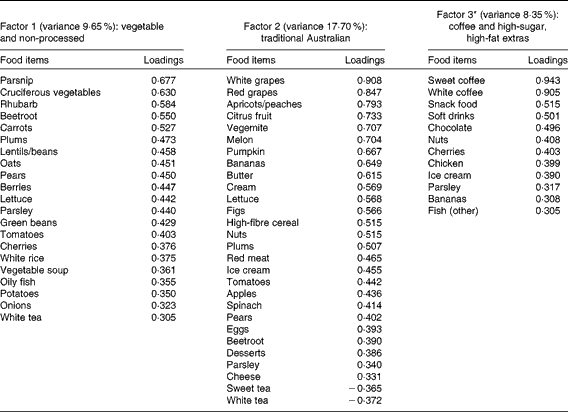
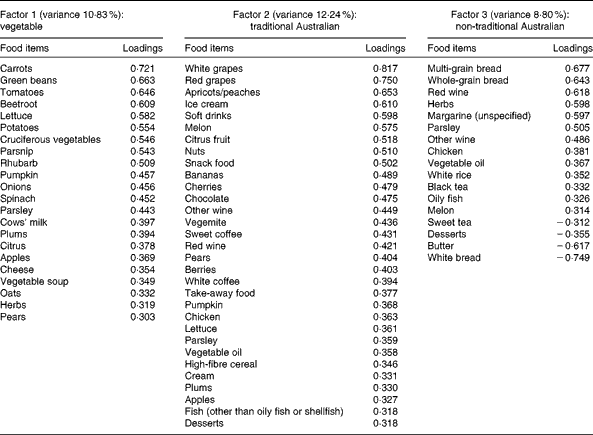
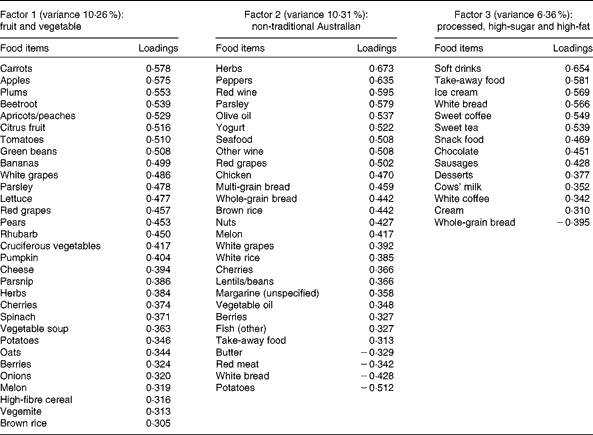
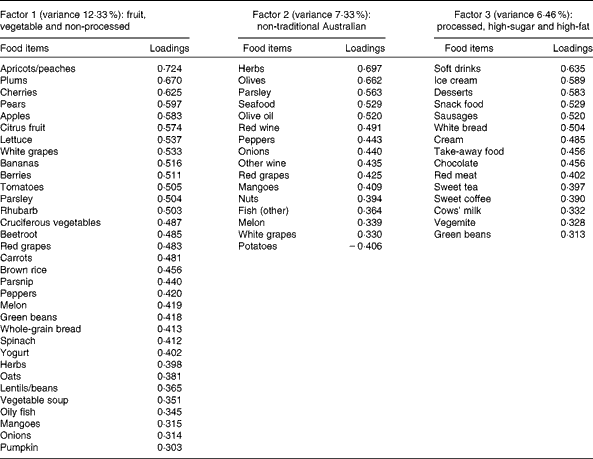
A total of three factors were retained for each life period from the EFA of the LDQ. These factors and the food items with a loading of 0·3 and above are presented in Tables 2–5. No single factor was common to all periods, although there was considerable consistency in the factors across periods. These were the ‘traditional Australian’ and ‘non-traditional Australian’ patterns, a version of a ‘processed fat and sweets’ pattern, and a ‘vegetable’ or a ‘fruit and vegetable’ pattern. The ‘traditional Australian’ pattern was only evident in the two early-life periods of childhood and early adulthood; however, the ‘non-traditional Australian’ pattern was present in all periods except in childhood, and the ‘processed fat and sweets’ pattern was common across all periods except in early adulthood. The total percentage of variance accounted for by the factors in all the items of the LDQ for each life period was 35·7 % in childhood, 31·87 % in early adulthood, 26·93 % in adulthood and 26·12 % in middle age.
Table 2 Dietary patterns for childhood: item loading >0·3 and variance accounted for

* Item loadings on this factor were initially all negative, so the sign has been reversed on all loadings and in subsequent associations for ease of interpretation.
Table 3 Dietary patterns for early adulthood: item loading >0·3 and variance accounted for

Table 4 Dietary patterns for adulthood: item loading >0·3 and variance accounted for

Table 5 Dietary patterns for middle age: item loading >0·3 and variance accounted for

Based on the same criteria, three factors similar to those extracted from the LDQ were extracted from the abbreviated CCFFQ using EFA. Loadings on each factor >0·3 and the variance accounted for in the items are presented in Table 6. Item loadings for the current dietary factors were generally lower than those for the LDQ with the highest loading value of 0·53 for processed meat on factor 2. Consequently, the extracted factors for current diet accounted for much less item variance than those for past diet.
Table 6 Current dietary factors extracted from the Cancer Council FFQ (CCFFQ): loadings >0·3 and variance accounted for

* Only intake frequency of foods common to the Lifetime Diet Questionnaire and CCFFQ was assessed.
Each of the past dietary patterns was significantly predicted by the three current dietary patterns, as shown by the highly significant F values in Table 7. However, the percentage of variance accounted for by current diet in the past dietary factors from each life period increased incrementally over the life course. In childhood, current diet contributed 7·6 % of the variance in dietary patterns for this period, while by middle age current diet contributed 41·5 % of the variance in the later patterns.
Table 7 Contribution of current diet to the variance in past dietary factors

CHD, childhood; EAD, early adulthood; AD, adulthood; MAGE, middle age.
*** P< 0·001.
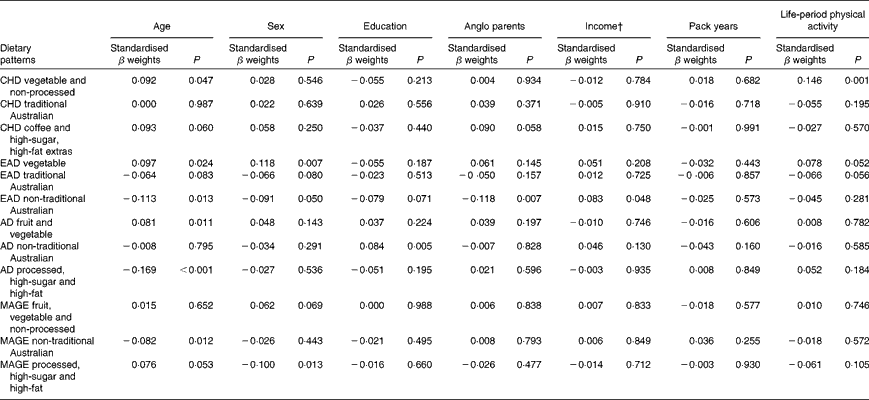
Demographic and cardiovascular health variables were significantly associated with lifetime dietary patterns after controlling for current dietary intake in this sample of older Australians. The standardised β weights for the relationships between the LDQ patterns and the demographic variables are presented in Table 8.
Table 8 Demographic predictors of lifetime dietary patterns*

CHD, childhood; EAD, early adulthood; AD, adulthood; MAGE, middle age.
* Models additionally adjusted for current dietary intake, current physical activity and other Lifetime Diet Questionnaire dietary patterns.
† Parents' income level (low v. medium/high) for the life periods of childhood and early adulthood; current income as proxy for income in adulthood and middle age.
Age was the most robust predictor of the dietary patterns with one association being found in every life period and two in early adulthood and adulthood. Age positively predicted the ‘vegetable’ or ‘fruit and vegetable’ pattern in childhood, early adulthood and adulthood. It also negatively predicted the ‘non-traditional Australian’ pattern (early adulthood and middle age) and the ‘processed, high-sugar and high-fat’ pattern in adulthood. Being female predicted higher scores on the ‘vegetable’ pattern in early adulthood, and men scored higher on the ‘processed, high-sugar and high-fat’ pattern in mid-life. In adulthood, a greater number of years spent in formal education was associated with higher scores on the ‘non-traditional Australian’ pattern. Having one or both parents from a non-Anglo background strongly predicted a higher score on the ‘non-traditional Australian’ dietary pattern in early adulthood, which also positively predicted income. Childhood was the only life period where physical activity was associated with a dietary pattern; it positively predicted the ‘vegetable and non-processed’ pattern.
The results did not change substantially when current dietary factors or the LDQ principal components were excluded from the models; the exception was for associations between the LDQ patterns and smoking history. In the primary models, when the variance from other past periods was controlled for, smoking did not predict any dietary pattern. When the LDQ components were excluded, however, smoking history negatively predicted the healthful ‘non-traditional Australian’ patterns, in addition to those with high loadings of vegetables, fruit and those that were non-processed.
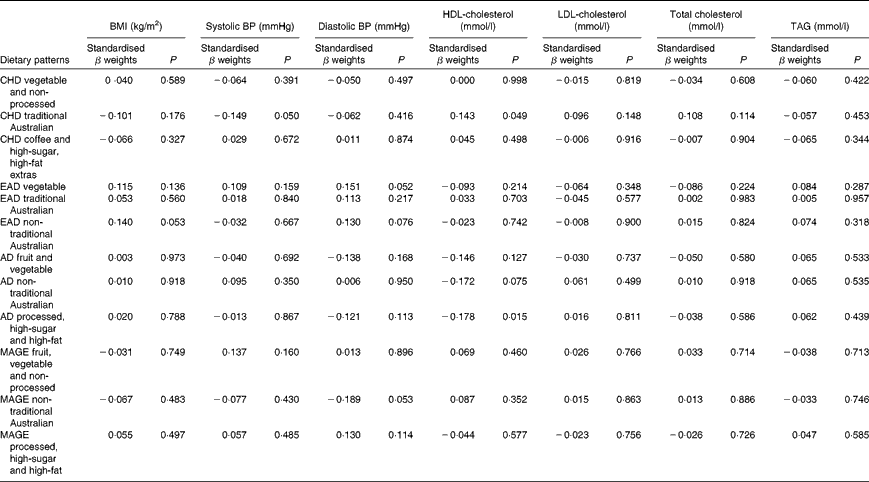
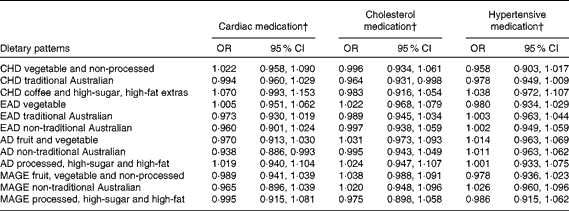
One lifetime dietary pattern from childhood and two from adulthood significantly predicted markers of current cardiovascular health in the sample. Table 9 presents multiple regression models for the continuous outcomes, and Table 10 presents logistic regression models for the dichotomous outcomes.
Table 9 Lifetime dietary patterns as predictors of cardiovascular outcomes*

BP, blood pressure; CHD, childhood; EAD, early adulthood; AD, adulthood; MAGE, middle age.
* Models adjusted for age, sex, education, smoking history, income, life-period physical activity, current dietary intake, other past dietary factors and medication use. BMI, log10-transformed; systolic BP and diastolic BP, square root-transformed; TAG, log10-transformed.
Table 10 Lifetime dietary patterns as predictors of cardiovascular medication use* (Odds ratios and 95 % confidence intervals)

CHD, childhood; EAD, early adulthood; AD, adulthood; MAGE, middle age.
* Logistic regression models adjusted for age, sex, current dietary intake, current physical activity and life-period physical activity.
† Medication use coded as 1.
Higher scores on the childhood ‘traditional Australian’ pattern predicted higher HDL-cholesterol levels and a 3·6 % reduced chance of using cholesterol medication. In adulthood, the ‘processed, high-sugar and high-fat’ pattern negatively predicted HDL-cholesterol levels, and the ‘non-traditional Australian’ pattern predicted a 6·2 % reduced chance of using cardiac medication in later life.
For the medication outcomes, associations were not adjusted for possible shared variance with the other lifetime dietary patterns due to the limited number of covariates able to be included to ensure adequate power, but in each case, no more than one pattern was a significant predictor. Therefore, it was reasonable to assume that controlling for the other dietary patterns would not change the results.
Discussion
Lifetime dietary intake is a potentially modifiable environmental contributor of health and well-being in older age. The LDQ provides a possible means of assessing this intake in older cognitively healthy people, with dietary patterns extracted for each life period of the questionnaire proving to be useful for representing this intake.
Patterns similar to those extracted from the LDQ have been found in other studies across a variety of populations. A version of the ‘sweets or desserts’ pattern has been found to be the most reproducible(Reference Newby and Tucker7) and was present for all life periods of the LDQ, except for early adulthood. The ‘non-traditional Australian’ pattern that emerged in three of the four periods of the LDQ comprised many foods that have been associated in other studies with a ‘prudent’ style or healthful diet such as whole grains, herbs, chicken and fish, fruit, olives and olive oil, red wine and grapes(Reference Hu5, Reference Newby and Tucker7); it was named ‘non-traditional’ in the present study to differentiate it from the ‘traditional Australian’ pattern. The ‘traditional Australian’ pattern also had high loadings from particular vegetables and fruit (such as lettuce, pumpkin, beetroot, grapes and pears) but, in combination with other items such as ice cream, vegemite (a yeast extract spread), butter, cream and red meat, this pattern represented dietary intake that was more specific to an Australian population with a predominantly Anglo-Saxon heritage, particularly in the period when participants were children or young adults(Reference Truswell and Wahlqvist52). The ‘fruit and vegetable’ pattern found in both adulthood and middle age is also common across multiple populations when a dietary pattern analysis is applied to a FFQ. Patterns dominated by fruit and vegetable intake are often also known as ‘health aware’ or ‘healthful’ to differentiate them from patterns high in processed foods or sweets(Reference Newby and Tucker7).
It is well established that dietary intake changes over time(Reference Lake, Rugg-Gunn and Hyland53–Reference Mishra, McNaughton and Bramwell55) and that these changes are determined by changes in individuals' social and demographic circumstances(Reference Lake, Rugg-Gunn and Hyland53, Reference Mishra, Prynne and Paul56). The LDQ has been previously demonstrated to capture changes in dietary intake over the lifespan(Reference Hosking, Danthiir and Nettelbeck32), thereby giving some validity to the long-term dietary recall process. These findings have been strengthened by the results of the present study. When current diet was used to predict each of the past dietary patterns, the percentage of variance accounted for by current diet incrementally increased from childhood, where current diet only accounted for 7·6 % of variance, to middle age, where current diet accounted for 41·5 % of the variance in recalled intake for this later-life period.
Age, sex and markers of socio-economic status are robust predictors of dietary intake across a wide spectrum of populations(Reference Kant6, Reference Pryer, Nichols and Elliott57). These variables also predicted patterns from the LDQ after controlling for the influence of both current diet and other past dietary patterns; however, interpretation of these associations in the context of previous findings is challenging, given that no studies have followed the eating patterns of individuals over their whole lifetime. Dietary choices across life are determined by direct cohort effects, for example, the imposed frugality during the Second World War, and within-person effects, such as having a greater disposable income at various life stages, or particular health concerns that necessitate dietary modifications(58). In this cohort, it was evident that participants' diet, as captured by the dietary patterns of the LDQ, particularly reflected the influence of the cultural and social determinants of dietary intake across the various life periods.
Catalysts for change in Australian eating habits were the post-war influx of European migrants and the introduction of many previously unavailable foods and meal choices(Reference Truswell and Wahlqvist52). Accordingly, in this sample, having non-Anglo parents strongly predicted a non-traditional Australian diet in early adulthood. In this period also, being of older age negatively predicted this ‘non-traditional Australian’ pattern. Early adulthood for the older participants would have spanned the late 1940s to the beginning of the 1960s, and it is possible that the impact of European immigration was yet to be assimilated into mainstream dietary practices, which may explain the negative association.
Changes in food availability in Australia were also reflected by the older members' early-life dietary patterns. Higher consumption of the ‘vegetable and non-processed’ pattern in childhood and a ‘vegetable’ pattern in early adulthood was predicted by older age; these were frugal eating patterns defined by high loadings from garden-grown vegetables and represent a diet common to the war and pre-war years in Australia(Reference Truswell and Wahlqvist52). For these older participants, the higher consumption of dietary patterns high in vegetables continued into adulthood also, with older age positively predicting the adult ‘fruit and vegetable’ pattern, and in middle age, this more conservative diet was reflected by the negative association between age and the ‘non-traditional Australian’ dietary pattern.
Sex predicted dietary patterns in early adulthood and middle age. Differences in dietary patterns consumed by men and women are a robust finding in the dietary pattern literature and, in general, women have been found to follow healthier dietary patterns than men(Reference Park, Murphy and Wilkens28, Reference Villegas, Salim and Collins59). This finding was replicated to some extent for the patterns from the LDQ; the exception was the higher consumption of the healthful ‘non-traditional Australian’ pattern by males in early adulthood. This borderline association was unexpected, and it is possible that there were other unassessed sociodemographic variables confounding the relationship.
The relationship between higher educational attainment and healthy dietary choices has been well established(Reference Vlismas, Stavrinos and Panagiotakos60–Reference De Irala-Estévez, Groth and Johansson62). It is unknown, however, whether this association is also historically relevant, although others did find that higher education positively predicted increased consumption of an ‘ethnic foods and alcohol’ pattern during adulthood in the decade from 1989 to 1999(Reference Mishra, McNaughton and Bramwell55). The adulthood ‘non-traditional Australian’ dietary pattern (which could be considered ‘ethnic’ during the relevant time period) had high loadings from herbs, peppers, all wine, olive oil, yogurt, seafood, whole grains, chicken and nuts, with negative loadings from butter, meat, bread and potatoes. This pattern was strongly and positively predicted by years of formal schooling. Formal education (including individuals' highest level of post-school qualification) would have been completed for the majority of people by adulthood; it is appropriate then that the association between higher education and a healthful diet emerged in this life period.
Interestingly, the relationship did not carry through into mid-life. Given the relatively high amount of shared variance that was demonstrated between current dietary intake and diet in middle age, it is theoretically possible that controlling for current diet in the models suppressed the association; however, supplementary analyses that excluded the current and other past dietary factors failed to reveal any association between years of education and healthy dietary choices in middle age. It appears that for this life period, there were other more influential factors that determined dietary intake.
Childhood was the only period in which physical activity specific to the life period was associated with a dietary pattern from the LDQ with higher levels of activity predicting the ‘non-processed vegetable’ pattern. This is consistent with other findings of a positive relationship between healthier patterns of intake and higher levels of physical activity(Reference van Dam, Grievink and Ocke15, Reference Park, Murphy and Wilkens28). In recent years, the synergistic interaction between dietary choice and physical activity has been a widely promoted public health message(63), with the aim of reducing the risk and incidence of disease in society. During the earlier years of the six decades covered by the LDQ, however, physical activity and dietary choices may not have always been so closely related, which could explain the overall lack of associations between dietary patterns from the LDQ and historical levels of physical activity. Alternatively, the lack of associations between the lifetime dietary patterns and lifetime physical activity could be explained by some systematic error in long-term recall on both measures.
In the fully adjusted models, smoking history was not associated with any of the dietary patterns during any life period. This could be considered unexpected, given that the relationship between smoking and dietary choices is a robust one in the literature(Reference La Vecchia, Negri and Franceschi64–Reference O'Doherty, Skidmore and Young66); however, when the influence of the other lifetime patterns was not controlled for, smoking history significantly predicted the dietary patterns. This finding suggests that lifetime smoking habits, in particular, are not related to variance specific to a particular life-period pattern, but are related to general dietary pattern variance that is common across life periods.
Given that lifetime exposures, including diet, contribute to older-age health outcomes, it was also of interest, for exploratory purposes, to investigate the associations between recalled lifetime dietary patterns and the specific markers of cardiovascular health that were measured in this cohort. Although it is well established that dietary intake has an impact on cardiovascular outcomes in later life(Reference Tourlouki, Matalas and Panagiotakos16, Reference Mente, de Koning and Shannon67), there is only scant evidence from longitudinal cohort studies as to the contribution of earlier-life dietary influences on long-term outcomes. In the Boyd Orr cohort(Reference Martin, Gunnell and Pemberton68), the association was examined between household diet during childhood and cardiovascular-induced death post-30 and -50 years of age. A higher consumption of fruit and vegetables but a lower consumption of fish was associated with lower stroke risk. These authors did not propose a mechanism for the fruit and vegetable association with later stroke risk, but suggested that the finding may have been due to confounding and should be reproduced(Reference Ness, Maynard and Frankel69). Higher HDL levels are protective against the risk of stroke(Reference Boden-Albala, Sacco and Lee70), and healthy levels are partly determined by the dietary intake of fruit and vegetables(Reference Bertsias, Linardakis and Mammas71). The childhood ‘traditional Australian’ pattern in the present study predicted higher HDL levels and is a pattern primarily defined by higher loadings from both fruit and vegetables. It is possible that frequent consumption of these items during childhood may determine a lifetime of habitual intake, thereby lowering the risk of unfavourable vascular outcomes via HDL maintenance.
Consumption of this childhood ‘traditional Australian’ pattern was also associated (at borderline significance, P= 0·05) with participants having lower systolic blood pressure. This finding adds support to the increasing evidence that early-life factors, including childhood diet, are important determinants of later-life hypertensive outcomes(Reference Lawlor and Smith72). The pattern is defined by factor loadings from spinach, tomatoes, pumpkin, nuts and eggs, all of which are high in vitamin E(73). Relationships between vitamin E intake from food in childhood and cardiovascular health in mid-life were examined in the 1946 British birth cohort(Reference Mishra, Malik and Paul74). No associations were found for the effect of intake during either childhood or middle age alone, but the lowest consumers of vitamin E in childhood, together with low intake at 43 years, were more likely to be hypertensive(Reference Mishra, Malik and Paul74). An additional explanation for the protective effect of the childhood ‘traditional Australian’ diet on later-life blood pressure measurement is via the K content of other higher-loading foods such as apricots, bananas, citrus, melon, figs, nuts, tomatoes and pears(73, Reference He and Whelton75).
Borderline significance (P= 0·05) was also found for the prediction of higher diastolic blood pressure by greater consumption of the ‘vegetable’ pattern in the early adulthood period. The association between diastolic blood pressure and cardiovascular risk is not clear-cut in older adults, and there is some evidence that higher diastolic blood pressure may actually be protective in this age group(Reference Okayama, Kadowaki and Okamura76, Reference Basile77).
In contrast to the protective effects of the fruit- and vegetable-based diets, those high in trans-fats or foods with a high glycaemic index are detrimental to cardiovascular health. The 20-year follow-up of the Nurses' Study cohort(Reference Oh, Hu and Manson78) has demonstrated that in 78 778 women free of CHD in 1980, trans-fat intake significantly increased the odds of disease development particularly in younger or overweight women. In the present study, a higher consumption of such a pattern (processed, high-sugar and high-fat) in adulthood was associated with lower levels of HDL-cholesterol in older age. Just as high HDL levels are protective, lower HDL levels are considered a risk factor for CVD via their contribution to the atherosclerotic process, which, from early onset, takes many decades to develop the lesions that result in heart disease(Reference Hansson, Robertson and Söderberg-Nauclér79).
One other lifetime dietary pattern predicted cardiovascular health in the EPOCH cohort. Current cardiac medication use was negatively associated with the ‘non-traditional Australian’ pattern in adulthood, a pattern similar in many respects to a Mediterranean-style diet. It is defined by herbs, parsley, red and white wine, yogurt, olive oil, seafood, chicken and whole grains. Given the empirical findings regarding the protective effect of such a diet in adulthood on later cardiac health(Reference Willett80), the association between this recalled dietary pattern and the non-use of medications for cardiac conditions further contributes to establishing the validity of the LDQ.
Conclusions
This is the first known study to extract retrospective dietary patterns from across periods comprising an individual's whole life. Although precise estimates of intake over such a timeframe are impossible, the present exploratory analyses have demonstrated the utility of a simplified, non-quantitative approach to gathering long-term food frequency data from older cognitively healthy people.
Building on these findings by replication is desirable. Doing so potentially provides valuable public health information regarding dietary modifications that are possible in earlier-life periods so as to increase the odds of a healthier older age. Although it is acknowledged that error in recalled historical diet is an inevitable outcome of such an approach, as is some confounding by unmeasured environmental factors, it nonetheless offers a valuable and hitherto untapped contribution to unravelling the influence of early-life dietary choices on older-age health when long-term dietary information is otherwise not available.
Acknowledgements
The present study was supported by an NHMRC project grant (no. 578800) and the Brailsford Robertson Award (University of Adelaide and CSIRO Food and Nutritional Sciences) awarded to V. D. D. H. was supported by a PhD scholarship jointly funded by the Faculty of Health Science at the University of Adelaide, South Australia, and CSIRO Food and Nutritional Sciences. We thank the participants of the EPOCH trial for their participation. D. H. was responsible for the concept and design of the study, collected the lifetime dietary data, conducted the statistical analyses and wrote the manuscript. V. D. was responsible for the concept and design of the EPOCH trial and of the present study, statistical analyses and manuscript revision and approved the final version. Neither of the authors has a conflict of interest.


