Poor physical health is an important risk factor for depression in later life (Reference Lenze, Rogers and MartireLenze et al, 2001). Together with bereavement and cognitive decline, it is one of the risk factors that demarcate depression in later life from early-onset depression (Reference Cole and DendukuriCole & Dendukuri, 2003). In a worldwide study of adults up to age of 65 years (Reference Ormel, Von Korff and UstunOrmel et al, 1994), the association between disability and depression was shown to be fairly consistent across cultures. More heterogeneity across cultures for this association may be found among older adults because of substantial variation in the availability of healthcare (Reference BramesfeldBramesfeld, 2003) and variation in attitudes to old age, with traditional values being more widespread in southern than north-western European countries (Reference Inglehart and BakerInglehart & Baker, 2000). In this study we investigated whether the impact of physical impairment on depressive symptoms (Reference Ormel, Von Korff and van den BrinkOrmel et al, 1993) varies across western Europe.
METHOD
Samples
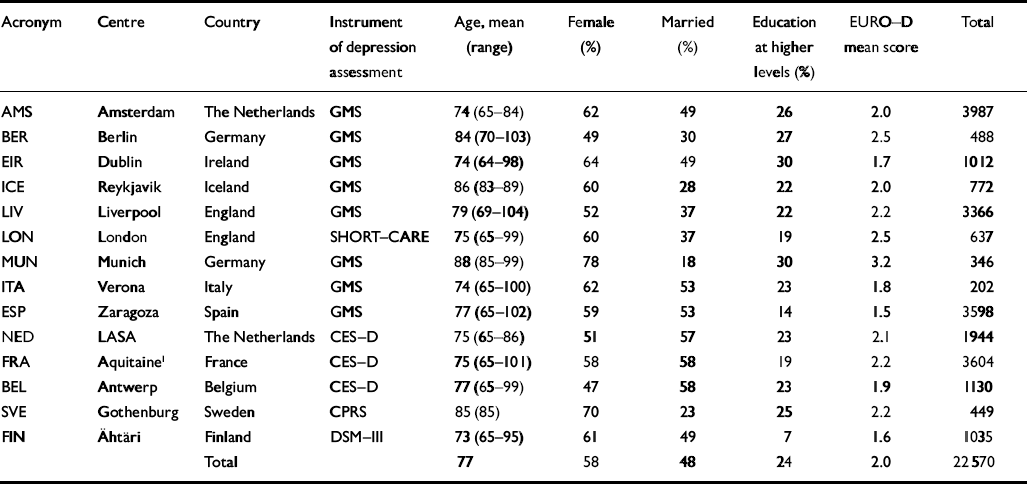
The EURODEP Concerted Action is a consortium of 14 research groups from 11 European countries all engaged in population-based research into the epidemiology of late-life depression (Reference Copeland, Beekman and DeweyCopeland et al, 1999). Three countries have two participating centres: England (Liverpool and London), Germany (Berlin and Munich) and The Netherlands (Amsterdam and the nationwide sample of the Longitudinal Aging Study Amsterdam (LASA), denoted here as ‘Netherlands'). Basic demographic characteristics of the 14 study samples with data available for the present study are summarised in Table 1. The overall sample size of the pooled EURODEP data-set amounts to 22 570 individuals. More detailed information on sampling-frame, interview procedures and non-response has been given by Copeland et al (Reference Copeland, Beekman and Dewey1999) and Braam et al (Reference Braam, Delespaul and Beekman2004), including key references. For Liverpool, the first follow-up measurement 2 years after baseline (Reference Wilson, Chen and TaylorWilson et al, 1999) has been used, because this observation cycle included measures of physical functioning and chronic conditions. In the Spanish sample used in the current study, more health characteristics were assessed than in the sample that was used in the first series of EURODEP studies.
Table 1 The EURODEP consortium - studies, assessment of depression and basic demographics
| Acronym | Centre | Country | Instrument of depression assessment | Age, mean (range) | Female (%) | Married (%) | Education at higher levels (%) | EURO-D mean score | Total |
|---|---|---|---|---|---|---|---|---|---|
| AMS | Amsterdam | The Netherlands | GMS | 74 (65-84) | 62 | 49 | 26 | 2.0 | 3987 |
| BER | Berlin | Germany | GMS | 84 (70-103) | 49 | 30 | 27 | 2.5 | 488 |
| EIR | Dublin | Ireland | GMS | 74 (64-98) | 64 | 49 | 30 | 1.7 | 1012 |
| ICE | Reykjavik | Iceland | GMS | 86 (83-89) | 60 | 28 | 22 | 2.0 | 772 |
| LIV | Liverpool | England | GMS | 79 (69-104) | 52 | 37 | 22 | 2.2 | 3366 |
| LON | London | England | SHORT-CARE | 75 (65-99) | 60 | 37 | 19 | 2.5 | 637 |
| MUN | Munich | Germany | GMS | 88 (85-99) | 78 | 18 | 30 | 3.2 | 346 |
| ITA | Verona | Italy | GMS | 74 (65-100) | 62 | 53 | 23 | 1.8 | 202 |
| ESP | Zaragoza | Spain | GMS | 77 (65-102) | 59 | 53 | 14 | 1.5 | 3598 |
| NED | LASA | The Netherlands | CES-D | 75 (65-86) | 51 | 57 | 23 | 2.1 | 1944 |
| FRA | Aquitaine 1 | France | CES-D | 75 (65-101) | 58 | 58 | 19 | 2.2 | 3604 |
| BEL | Antwerp | Belgium | CES-D | 77 (65-99) | 47 | 58 | 23 | 1.9 | 1130 |
| SVE | Gothenburg | Sweden | CPRS | 85 (85) | 70 | 23 | 25 | 2.2 | 449 |
| FIN | Ä htäri | Finland | DSM-III | 73 (65-95) | 61 | 49 | 7 | 1.6 | 1035 |
| Total | 77 | 58 | 48 | 24 | 2.0 | 22570 |
LASA, Longitudinal Aging Study Amsterdam (The Netherlands, nationwide).
GMS, Geriatric Mental State Examination; SHORT-CARE, short version of the Comprehensive Assessment and Referral Evaluation; CES-D, Center for Epidemiologic Studies Depression Scale; CPRS, Comprehensive Psychopathological Rating Scale.
1. Including the city of Bordeaux.
Measures
Outcome variable
The depressive symptom measure in the current study was the EURO-D scale (Reference Prince, Reischies and BeekmanPrince et al, 1999). This harmonised depressive symptom scale has been developed to enhance analyses of the pooled EURODEP data-set, because not all centres used the same depression assessment procedure (Table 1). Eight centres used the Geriatric Mental State Examination (GMS; Reference Copeland, Dewey and Griffiths-JonesCopeland et al, 1986), three other centres used the Center for Epidemiologic Studies Depression Scale (CES-D; Reference RadloffRadloff, 1977), one the Comprehensive Psychopathological Rating Scale (CPRS; Reference Asberg, Periis and SchallingAsberg et al, 1978), one the short version of the Comprehensive Assessment and Referral Evaluation (SHORT-CARE; Reference Gurland, Golden and TeresiGurland et al, 1984), and one a DSM-III interview (American Psychiatric Association, 1980) with identical items to those used in the GMS. To obtain a pooled EURODEP data-set, these five instruments were harmonised according to a procedure developed and validated by Prince et al (Reference Prince, Reischies and Beekman1999). This resulted in the EURO-D scale, which comprises 12 items: depressive affect, pessimism, wishing death, guilt, sleep, interest, irritability, appetite, fatigue, concentration, enjoyment and tearfulness (0=‘not present'; 1=‘present', range 0-12). For each centre, the EURO-D has been internally consistent, with Cronbach α=0.72 for the current pooled sample, with α ranging between 0.65 (in Dublin) and 0.83 (in Finland). The EURO-D scale was applied with standardised standard deviations (s.d.=1), as recommended by Prince et al (Reference Prince, Reischies and Beekman1999).
Demographic variables
These include gender, age, marital status and education. Marital status was categorised as ‘married' v. ‘non-married', the latter comprising those who were never married, the divorced or separated, and the widowed. Education was assessed in several ways: years of education, level of education, or non-specified classifications into ‘lower', ‘intermediate' and ‘higher'. To maintain maximal variability, a range of index scores was computed with values between 0 and 1.
Physical health
Two measures of physical health were available for most samples: functional disability and presence of chronic physical conditions.
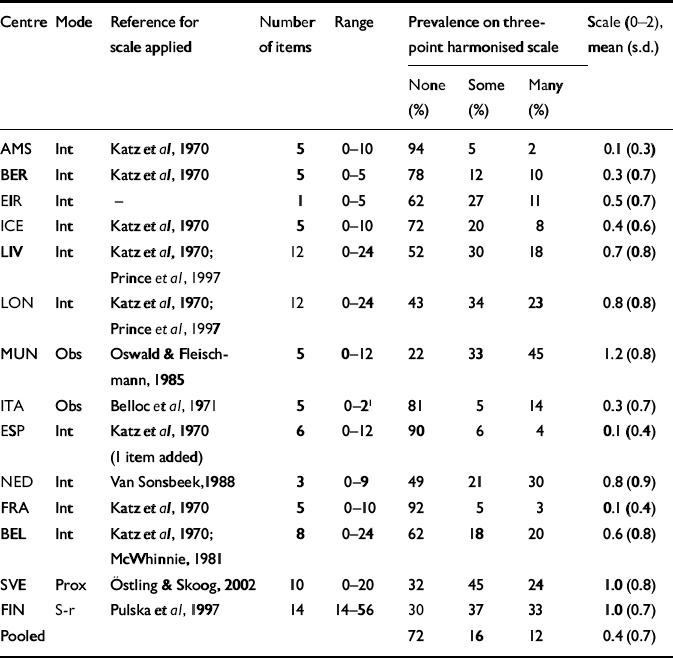
For functional disability, several versions of ‘activities of daily living' scales were employed (Table 2). To obtain comparable measures, total scores of each scale were trichotomised into ‘no', ‘intermediate' or ‘high' levels of disability. The category of ‘high' level of disability was defined as the scores that fell in the highest tertile of the range of the scale.
Table 2 Assessment of functional disability in the participating EURODEP centres; measurement details and prevalences and means on the three-point harmonised scale
| Centre | Mode | Reference for scale applied | Number of items | Range | Prevalence on threepoint harmonised scale | Scale (0-2), mean (s.d.) | ||||
|---|---|---|---|---|---|---|---|---|---|---|
| None (%) | Some (%) | Many (%) | ||||||||
| AMS | Int | Katz et al, 1970 | 5 | 0-10 | 94 | 5 | 2 | 0.1 (0.3) | ||
| BER | Int | Katz et al, 1970 | 5 | 0-5 | 78 | 12 | 10 | 0.3 (0.7) | ||
| EIR | Int | - | 1 | 0-5 | 62 | 27 | 11 | 0.5 (0.7) | ||
| ICE | Int | Katz et al, 1970 | 5 | 0-10 | 72 | 20 | 8 | 0.4 (0.6) | ||
| LIV | Int | Katz et al, 1970; Prince et al, 1997 | 12 | 0-24 | 52 | 30 | 18 | 0.7 (0.8) | ||
| LON | Int | Katz et al, 1970; Prince et al, 1997 | 12 | 0-24 | 43 | 34 | 23 | 0.8 (0.8) | ||
| MUN | Obs | Oswald & Fleischmann, 1985 | 5 | 0-12 | 22 | 33 | 45 | 1.2 (0.8) | ||
| ITA | Obs | Belloc et al, 1971 | 5 | 0-2 1 | 81 | 5 | 14 | 0.3 (0.7) | ||
| ESP | Int | Katz et al, 1970 (1 item added) | 6 | 0-12 | 90 | 6 | 4 | 0.1 (0.4) | ||
| NED | Int | Van Sonsbeek, 1988 | 3 | 0-9 | 49 | 21 | 30 | 0.8 (0.9) | ||
| FRA | Int | Katz et al, 1970 | 5 | 0-10 | 92 | 5 | 3 | 0.1 (0.4) | ||
| BEL | Int | Katz et al, 1970; McWhinnie, 1981 | 8 | 0-24 | 62 | 18 | 20 | 0.6 (0.8) | ||
| SVE | Prox | Ö stling & Skoog, 2002 | 10 | 0-20 | 32 | 45 | 24 | 1.0 (0.8) | ||
| FIN | S-r | Pulska et al, 1997 | 14 | 14-56 | 30 | 37 | 33 | 1.0 (0.7) | ||
| Pooled | 72 | 16 | 12 | 0.4 (0.7) | ||||||
Int, interview; Obs, observer; Prox, proxy interview; S-r, self-report.
1. Answers from five items are categorised into three levels.
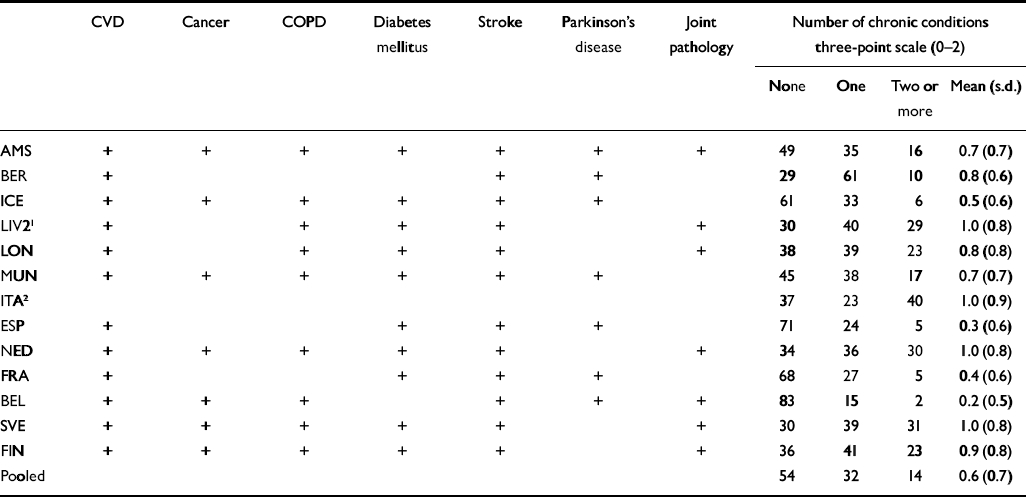
A similar procedure was used for the variable ‘number of chronic conditions', resulting in the categories ‘no', ‘one' and ‘two or more'. The types and numbers of chronic conditions showed considerable variation (Table 3). Furthermore, the types of questions also varied; this mostly concerned the self-reporting of specific chronic conditions, but sometimes was limited to the self-reporting of essential symptoms of conditions such as congestive heart failure or Parkinson's disease. From the Irish centre, no data were available on the type or number of chronic conditions. The physical health instrument used in Verona permitted categorisation of both disability and number of chronic conditions, but not the type of chronic condition.
Table 3 Assessment of chronic conditions in the participating EURODEP centres; prevalences on three-point harmonised measure of number of chronic conditions
| CVD | Cancer | COPD | Diabetes mellitus | Stroke | Parkinson's disease | Joint pathology | Number of chronic conditions three-point scale (0-2) | |||||||
|---|---|---|---|---|---|---|---|---|---|---|---|---|---|---|
| None | One | Two or more | Mean (s.d.) | |||||||||||
| AMS | + | + | + | + | + | + | + | 49 | 35 | 16 | 0.7(0.7) | |||
| BER | + | + | + | 29 | 61 | 10 | 0.8(0.6) | |||||||
| ICE | + | + | + | + | + | + | 61 | 33 | 6 | 0.5(0.6) | ||||
| LIV2 1 | + | + | + | + | + | 30 | 40 | 29 | 1.0(0.8) | |||||
| LON | + | + | + | + | + | 38 | 39 | 23 | 0.8(0.8) | |||||
| MUN | + | + | + | + | + | + | 45 | 38 | 17 | 0.7(0.7) | ||||
| ITA 2 | 37 | 23 | 40 | 1.0(0.9) | ||||||||||
| ESP | + | + | + | + | 71 | 24 | 5 | 0.3(0.6) | ||||||
| NED | + | + | + | + | + | + | 34 | 36 | 30 | 1.0(0.8) | ||||
| FRA | + | + | + | + | 68 | 27 | 5 | 0.4(0.6) | ||||||
| BEL | + | + | + | + | + | + | 83 | 15 | 2 | 0.2(0.5) | ||||
| SVE | + | + | + | + | + | + | 30 | 39 | 31 | 1.0(0.8) | ||||
| FIN | + | + | + | + | + | + | 36 | 41 | 23 | 0.9(0.8) | ||||
| Pooled | 54 | 32 | 14 | 0.6(0.7) | ||||||||||
CVD, cardiovascular disease; COPD, chronic obstructive pulmonary disease.
1. Liverpool, wave 2, year 2 only, n=1635.
2. In Italy, only presence of any chronic condition was assessed, not type of chronic condition.
The procedure of harmonisation employed in the present study has the advantage that the variability of the estimates is largely maintained. This ‘inclusive approach', however, has the disadvantage that the comparability may be reduced. Therefore, for both variables, a ‘selective approach' was explored, in which only items were included that explicitly cover the same types of functional disability (ability to wash, dress, use toilet, move out of bed, and eat, which correspond to the five items of the Katz index) and chronic conditions (namely, cardiovascular disease, diabetes and stroke), in a majority of study centres.
Cognitive functioning
In 11 centres, cognitive functioning was assessed using the Mini-Mental State Examination (MMSE; Reference Folstein, Folstein and McHughFolstein et al, 1975). In London, the Dementia Diagnostic Scale score was derived from the SHORT-CARE interview (Reference Livingston, Hawkins and GrahamLivingston et al, 1990). In Finland, the Wilson Mental Capacity scale (Reference Wilson and BrassWilson, & Brass, 1973) was used (ten items on memory and orientation, ranging from 0, ‘no cognitive impairment' to 10, ‘severe cognitive impairment'). Cognitive functioning was not assessed in Iceland.
European ‘building blocs'
The European countries can be categorised into interlocking and overlapping regions according to sociological and historical factors, which are denoted as ‘European building blocs' (Reference Davie and BaileyDavie, 1992). The following blocs are distinguished: ‘Western Isles' (England and Ireland), ‘Nordic' (Iceland, Sweden and Finland), ‘Western continent' (Belgium, Germany and The Netherlands) and ‘Southern/Mediterranean' (south of France, Italy and Spain). France is normally ranked within the ‘Western continent' category. The classification has been adapted, because the ‘Western continent' category would include more than half of the pooled EURODEP sample. As the French sample is drawn from the Aquitaine region in the south-west of France, the French study is classified as Southern European.
Statistical procedures
Associations between physical health measures and depressive symptoms (EURO-D scores) were analysed separately for each centre using linear regression analysis, computing regression coefficients, adjusted for effects by demographics. The physical health measures were divided into three categories, to check for non-linear associations. The reference category was ‘no disability' or ‘no chronic conditions'. Two alternative models were also examined, in which the ‘selective approach' was followed, including only centres in which all questions on functional disability were identical, or in which the same chronic conditions were assessed. The next series of models focused on the relative contributions of both physical health variables to depressive symptoms when entered in one model.
Finally, the data from the different centres were pooled into one EURODEP sample. Associations between the estimates of physical health and EURO-D score were examined using multilevel analysis (Reference Bryk and RaudenbushBryk & Raudenbush, 1992). Multilevel random regression modelling (MLRM) is ideally suited for conglomerate data-sets of nested subsets for which each data point cannot be considered as equally independent. In fact, individuals from the same country are more similar to each other than those from different countries. Although sampling characteristics, sample sizes, the assessment instruments used, and research design and context can differ among the centres included in the study, the target relation under study can be considered as fixed. These differential levels of independence are corrected for by MLRM, which also allows the control of known characteristics of the different subsets as well as the differential weighting of unknown dependencies within the data. Moreover, MLRM allows the analysis of associations between higher-level characteristics and lower-level characteristics, while controlling for covariates on either level, and allows the assessment of interactions between variables on the higher and lower level.
In the present study, the unit of measurement on the lower level was that of the individual respondent. Characteristics on this level include EURO-D score, physical health variables and demographics. The unit of measurement on the higher level was that of the contributing centres. For the pooled analysis, two types of multilevel models were employed. First, the associations between the physical health variables and EURO-D score were examined in one model based on the pooled data-set. The analyses were adjusted for effects by demographics, as well as the relevant interactions between gender and age with each other, and with marital status and education. Second, we examined whether the strength of the association between physical health and depressive symptoms is modified by living in one of the four European ‘building blocs'. In these analyses, the building bloc of the ‘Western Isles' was used as the reference category.
RESULTS
Sample characteristics
Table 1 summarises the basic demographics for each of the 14 samples. The mean age was 77 years. Three samples were recruited among octogenarians: Iceland, Munich and Gothenburg. In Berlin the mean age was also above 80 years. In the other centres, the mean age was around 75 years. In several centres, an even distribution of male and female respondents was achieved by over-sampling of male respondents. The percentage of those still married more or less parallels the distribution of age, with older samples showing a lower percentage of married respondents. The mean EURO-D scores are also included in Table 1. The highest scores were found in Munich, London and Berlin, and the lowest in Ireland, Finland and Spain. The distributions of levels of functional disability (Table 2) and chronic conditions (Table 3) varied across the samples. The disability assessment procedure according to Katz et al (Reference Katz, Downs and Cash1970), as used in Spain, France and Amsterdam, but also among octogenarians in Iceland and Berlin, yields low rates of those with high levels of disability and may be regarded as the most stringent.
Centre comparisons: inclusive approach
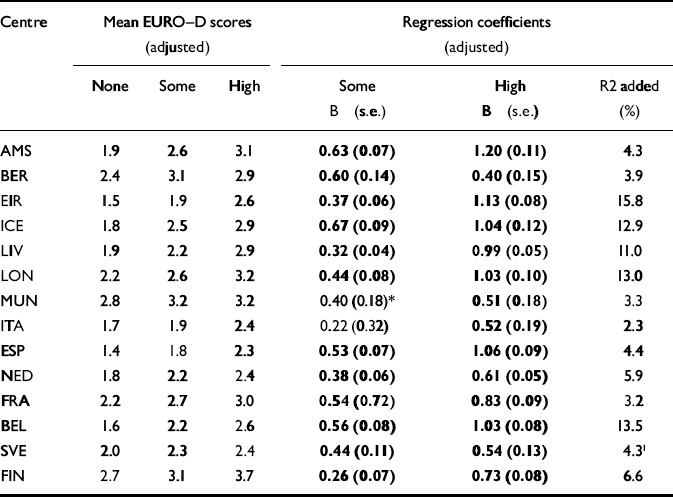
There was substantial congruence between centres in the association between functional disability and depressive symptoms (Table 4). The variance was higher in most centres where instruments were used with a higher number of items on disability (London, Liverpool, Finland), although the variance was also high in Ireland, where a one-item estimate was used.
Table 4 Depressive symptoms (EURO-D scores) and categories of functional disability: mean EURO-D scores and regression coefficients (adjusted for effects by demographic variables); values printed in bold type are significant at the P<0.01 level
| Centre | Mean EURO-D scores (adjusted) | Regression coefficients (adjusted) | ||||||||
|---|---|---|---|---|---|---|---|---|---|---|
| None | Some | High | Some B (s.e.) | High B (s.e.) | R2 added (%) | |||||
| AMS | 1.9 | 2.6 | 3.1 | 0.63 (0.07) | 1.20 (0.11) | 4.3 | ||||
| BER | 2.4 | 3.1 | 2.9 | 0.60 (0.14) | 0.40 (0.15) | 3.9 | ||||
| EIR | 1.5 | 1.9 | 2.6 | 0.37 (0.06) | 1.13 (0.08) | 15.8 | ||||
| ICE | 1.8 | 2.5 | 2.9 | 0.67 (0.09) | 1.04 (0.12) | 12.9 | ||||
| LIV | 1.9 | 2.2 | 2.9 | 0.32 (0.04) | 0.99 (0.05) | 11.0 | ||||
| LON | 2.2 | 2.6 | 3.2 | 0.44 (0.08) | 1.03 (0.10) | 13.0 | ||||
| MUN | 2.8 | 3.2 | 3.2 | 0.40 (0.18) * | 0.51 (0.18) | 3.3 | ||||
| ITA | 1.7 | 1.9 | 2.4 | 0.22 (0.32) | 0.52 (0.19) | 2.3 | ||||
| ESP | 1.4 | 1.8 | 2.3 | 0.53 (0.07) | 1.06 (0.09) | 4.4 | ||||
| NED | 1.8 | 2.2 | 2.4 | 0.38 (0.06) | 0.61 (0.05) | 5.9 | ||||
| FRA | 2.2 | 2.7 | 3.0 | 0.54 (0.72) | 0.83 (0.09) | 3.2 | ||||
| BEL | 1.6 | 2.2 | 2.6 | 0.56 (0.08) | 1.03 (0.08) | 13.5 | ||||
| SVE | 2.0 | 2.3 | 2.4 | 0.44 (0.11) | 0.54 (0.13) | 4.3 I | ||||
| FIN | 2.7 | 3.1 | 3.7 | 0.26 (0.07) | 0.73 (0.08) | 6.6 | ||||
* P between 0.050 and 0.010.
I. No adjustment for age (all of same age, 85 years).
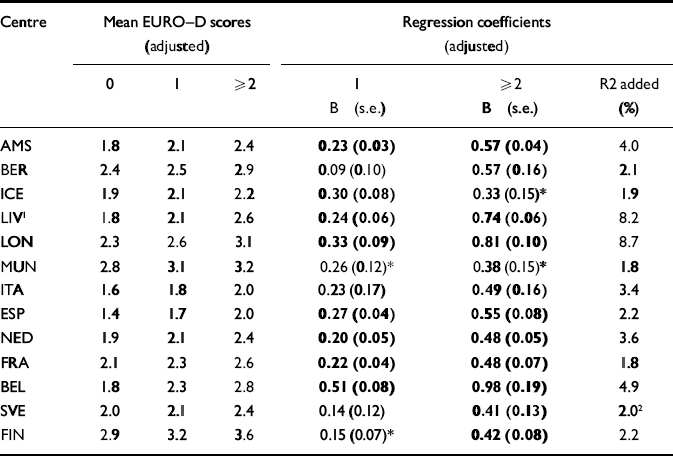
The associations for chronic conditions were less pronounced than those for disability (Table 5). Furthermore, the findings are less prominent or even non-significant in the older samples of Iceland, Munich and Gothenburg. The combined physical health assessment in Verona may have been less sensitive than those used in the other centres.
Table 5 Depressive symptoms (EURO-D scores) and categories of chronic conditions: mean EURO-D scores and regression coefficients (adjusted for effects by demographic variables); values printed in bold type are significant on the P <0.01 level.
| Centre | Mean EURO-D scores (adjusted) | Regression coefficients (adjusted) | ||||||||
|---|---|---|---|---|---|---|---|---|---|---|
| 0 | 1 | ≥ 2 | 1 B (s.e.) | ≥ 2 B (s.e.) | R2 added (%) | |||||
| AMS | 1.8 | 2.1 | 2.4 | 0.23 (0.03) | 0.57 (0.04) | 4.0 | ||||
| BER | 2.4 | 2.5 | 2.9 | 0.09 (0.10) | 0.57 (0.16) | 2.1 | ||||
| ICE | 1.9 | 2.1 | 2.2 | 0.30 (0.08) | 0.33 (0.15) * | 1.9 | ||||
| LIV 1 | 1.8 | 2.1 | 2.6 | 0.24 (0.06) | 0.74 (0.06) | 8.2 | ||||
| LON | 2.3 | 2.6 | 3.1 | 0.33 (0.09) | 0.81 (0.10) | 8.7 | ||||
| MUN | 2.8 | 3.1 | 3.2 | 0.26 (0.12) * | 0.38 (0.15) * | 1.8 | ||||
| ITA | 1.6 | 1.8 | 2.0 | 0.23 (0.17) | 0.49 (0.16) | 3.4 | ||||
| ESP | 1.4 | 1.7 | 2.0 | 0.27 (0.04) | 0.55 (0.08) | 2.2 | ||||
| NED | 1.9 | 2.1 | 2.4 | 0.20 (0.05) | 0.48 (0.05) | 3.6 | ||||
| FRA | 2.1 | 2.3 | 2.6 | 0.22 (0.04) | 0.48 (0.07) | 1.8 | ||||
| BEL | 1.8 | 2.3 | 2.8 | 0.51 (0.08) | 0.98 (0.19) | 4.9 | ||||
| SVE | 2.0 | 2.1 | 2.4 | 0.14 (0.12) | 0.41 (0.13) | 2.0 2 | ||||
| FIN | 2.9 | 3.2 | 3.6 | 0.15 (0.07) * | 0.42 (0.08) | 2.2 | ||||
* between 0.050 and 0.010.
1 Sub-sample, n=1706.
2 No adjustment for age (all of same age, 85 years).
Centre comparisons: selective approach
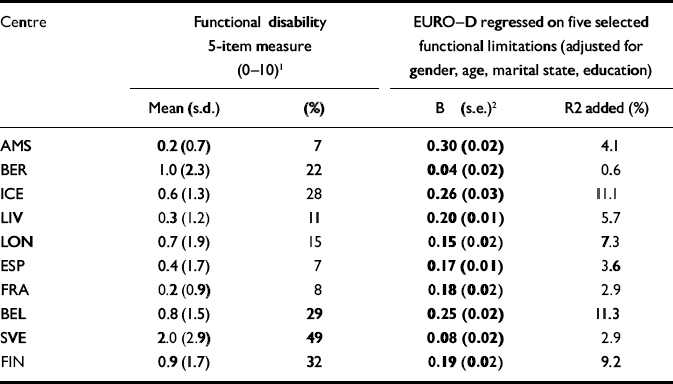
In ten centres, a strict (‘selective') approach was possible with respect to functional disability, using five items on the same activities of daily living (Table 6). The pattern of associations across the centres did not change dramatically. The percentage of variance for EURO-D scores in Iceland and Belgium remained high. In London and Liverpool, the amount of variance increased because of the reduction in the number of items in the functional disability measure.
Table 6 Depressive symptoms (EURO-D scores) and selection of five activities of daily living according to the Katz index (range 0-10), available in a majority of centres: means and regression coefficients (adjusted for effects by demographic variables)
| Centre | Functional disability 5-item measure (0-10) 1 | EURO-D regressed on five selected functional limitations (adjusted for gender, age, marital state, education) | ||||
|---|---|---|---|---|---|---|
| Mean (s.d.) | (%) | B (s.e.) 2 | R2 added (%) | |||
| AMS | 0.2 (0.7) | 7 | 0.30 (0.02) | 4.1 | ||
| BER | 1.0 (2.3) | 22 | 0.04 (0.02) | 0.6 | ||
| ICE | 0.6 (1.3) | 28 | 0.26 (0.03) | 11.1 | ||
| LIV | 0.3 (1.2) | 11 | 0.20 (0.01) | 5.7 | ||
| LON | 0.7 (1.9) | 15 | 0.15 (0.02) | 7.3 | ||
| ESP | 0.4 (1.7) | 7 | 0.17 (0.01) | 3.6 | ||
| FRA | 0.2 (0.9) | 8 | 0.18 (0.02) | 2.9 | ||
| BEL | 0.8 (1.5) | 29 | 0.25 (0.02) | 11.3 | ||
| SVE | 2.0 (2.9) | 49 | 0.08 (0.02) | 2.9 | ||
| FIN | 0.9 (1.7) | 32 | 0.19 (0.02) | 9.2 | ||
1 Ability to wash, dress, use toilet, move out of bed and eat.
2 Printed in bold type: all coefficients are significant at the P=0.001 level.
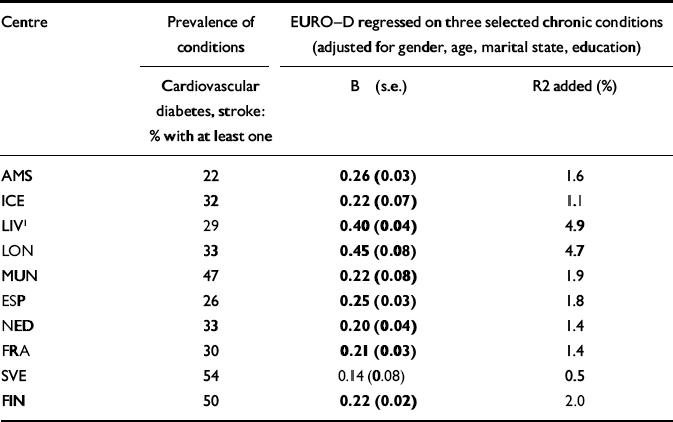
The ‘selective' approach of harmonisation of chronic conditions, which covers three diseases only (cardiovascular disease, diabetes and stroke), is shown in Table 7. In the octogenarian samples, the prevalence of these diseases was notably higher. The association between the diseases and EURO-D score was very similar in most samples, except for the British centres, where stronger associations were found.
Table 7 Depressive symptoms (EURO-D scores) and selection of three chronic conditions (cardiovascular disease, diabetes and stroke): means and regression coefficients (adjusted for effects by demographic variables); values printed in bold type are significant at the P <0.01 level
| Centre | Prevalence of conditions | EURO-D regressed on three selected chronic conditions (adjusted for gender, age, marital state, education) | ||
|---|---|---|---|---|
| Cardiovascular diabetes, stroke: % with at least one | B (s.e.) | R2 added (%) | ||
| AMS | 22 | 0.26 (0.03) | 1.6 | |
| ICE | 32 | 0.22 (0.07) | 1.1 | |
| LIV 1 | 29 | 0.40 (0.04) | 4.9 | |
| LON | 33 | 0.45 (0.08) | 4.7 | |
| MUN | 47 | 0.22 (0.08) | 1.9 | |
| ESP | 26 | 0.25 (0.03) | 1.8 | |
| NED | 33 | 0.20 (0.04) | 1.4 | |
| FRA | 30 | 0.21 (0.03) | 1.4 | |
| SVE | 54 | 0.14 (0.08) | 0.5 | |
| FIN | 50 | 0.22 (0.02) | 2.0 | |
1. Sub-sample, n=1706.
Functional disability and chronic conditions in one model (inclusive)
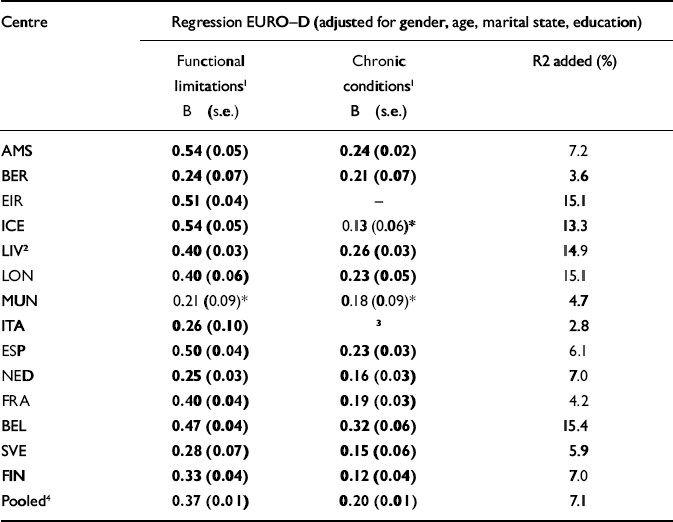
Table 8 shows the multivariate analyses of both physical health variables in one model. For both physical health variables, the trichotomised scores were used as a brief scale, because of the linear relationship found in the previous analyses. Expressed as standardised coefficients, the strength of the association between functional disability and depressive symptoms ranged between 0.16 and 0.37. The strength of the association between chronic diseases and depressive symptoms in these models was smaller, ranging between 0.08 and 0.20. There is some more variation in the amount of variance explained (see final column, Table 8), mostly ranging between 4% and 9%, but higher in Belgium, and the English samples (up to 15%). When cognitive functioning was included as a control variable, no substantial differences were found (results not shown).
Table 8 EURO-D scores regressed on both physical health variables
| Centre | Regression EURO-D (adjusted for gender, age, marital state, education) | ||||
|---|---|---|---|---|---|
| Functional limitations 1 B (s.e.) | Chronic conditions 1 B (s.e.) | R2 added (%) | |||
| AMS | 0.54 (0.05) | 0.24 (0.02) | 7.2 | ||
| BER | 0.24 (0.07) | 0.21 (0.07) | 3.6 | ||
| EIR | 0.51 (0.04) | - | 15.1 | ||
| ICE | 0.54 (0.05) | 0.13 (0.06) * | 13.3 | ||
| LIV 2 | 0.40 (0.03) | 0.26 (0.03) | 14.9 | ||
| LON | 0.40 (0.06) | 0.23 (0.05) | 15.1 | ||
| MUN | 0.21 (0.09) * | 0.18 (0.09) * | 4.7 | ||
| ITA | 0.26 (0.10) | 3 | 2.8 | ||
| ESP | 0.50 (0.04) | 0.23 (0.03) | 6.1 | ||
| NED | 0.25 (0.03) | 0.16 (0.03) | 7.0 | ||
| FRA | 0.40 (0.04) | 0.19 (0.03) | 4.2 | ||
| BEL | 0.47 (0.04) | 0.32 (0.06) | 15.4 | ||
| SVE | 0.28 (0.07) | 0.15 (0.06) | 5.9 | ||
| FIN | 0.33 (0.04) | 0.12 (0.04) | 7.0 | ||
| Pooled 4 | 0.37 (0.01) | 0.20 (0.01) | 7.1 | ||
* P between 0.050 and 0.010.
1. Trichotomised scores are used as a brief ordinal scale (range 0-2).
2. Liverpool, wave 2, year 2 only, n=1635.
3. Codes for functional disability and chronic conditions are mutually exclusive; the B for chronic conditions amounts to 0.25 (s.e.=0.08), P=0.002, and adjusted variance explained is 3.8%.
4. n=18 989, multilevel analysis, degrees of freedom=10, χ2=2840.
Pooled data-set: effect modification by building blocs
The associations between functional disability, chronic diseases and EURO-D score in the pooled data-set are shown in Table 8. When the three dummy variables for European building blocs were introduced in the regression analysis, no direct effects were found between the building blocs and depressive symptoms (results not shown). However, the building blocs modified the associations under study. Compared with the ‘Western Isles' building bloc, significant interaction terms with functional disability and depressive symptoms were found for the Western continent (B=-0.12, s.e.=0.02, P<0.001) and for the Nordic building bloc (B=-0.18, s.e.=0.03, P<0.001). This indicates that in the Western Isles, the association between functional disability and depressive symptoms is more pronounced than in the Western continent and in the Nordic region. For chronic diseases, very similar interaction terms were found, again with the Western Isles as comparison group (Western continent: =-0.08, s.e.=0.03, P=0.012; Nordic: B=-0.15, s.e.=0.04, P<0.001; Southern/Mediterranean: =-0.10, s.e.=0.03).
DISCUSSION
This 14-centre cross-national study showed that the pattern of associations between physical health variables and depressive symptoms in later life is very similar in 11 western European countries. In the majority of centres, there was a linear association between depressive symptoms and disability as well as with chronic diseases, indicating a ‘dose-response' relationship. Furthermore, the relative contribution of these aspects of physical health showed the same pattern in all centres involved: disability had a stronger association with depressive symptoms than chronic diseases. The findings, therefore, are compatible with previous studies without a cross-national approach (Reference Cole and DendukuriCole & Dendukuri, 2003).
‘Modern maturity' confined to Britain?
In their worldwide study of adults between 15 and 65 years of age, Ormel et al (Reference Ormel, Von Korff and Ustun1994) described a fairly consistent association between disability and depression across five continents. The present study provides evidence of a similar consistency in the older population, at least, in western Europe. It may be inferred that the mutual relationship between physical decline and depression is fairly universal. Therefore, sociological and cultural factors seem to give way to life-cycle perspectives and biological mechanisms that pertain to all people, irrespective of cultural traditions.
Within the framework of associations between physical health and depressive symptoms, some significant differences between the main regions in Europe were observed. In contrast to what was expected, the association between physical health and depressive symptoms was somewhat more pronounced in the UK and Ireland, but not in western Europe or in the Scandinavian countries. Moreover, no support was found for the hypothesis that in southern European countries traditional views of ageing would attenuate the association between physical health and depressive symptoms. The conclusion that expectancies about successful ageing and ‘modern maturity' are only more pronounced in the British Isles is uncertain. Issues of assessment procedures and translation of instruments are likely to be more relevant than the sociocultural climate on ageing in Britain.
An alternative explanation is that health services were more accessible in other European regions under study than in Britain. Indeed, the Organisation for Economic Co-Operation and Development data show that the national health expenditure per capita in Britain in 1990 was clearly below that of most other western European countries (Reference Braam, Delespaul and BeekmanBraam et al, 2004), in spite of at least equally high standards in the British healthcare system. Nevertheless, further study into healthcare facilities seems to be warranted, to determine which aspects of healthcare may be relevant, such as distance of travel to the general practitioner or availability of formal home nursing and other ancillary services.
Depression on syndrome level
Because of the attempt to follow a congruent harmonisation procedure across the 11 countries, the current approach focused on depressive symptoms only. Provisional analyses (data not shown), however, did show completely similar patterns of associations between functional disability and depression on the syndrome level, defined by the GMS in most centres, and by DSM diagnosis or high CES-D scores in the remaining centres. The associations with chronic conditions were somewhat less pronounced. One may conclude that the mental consequences of physical decline are not restricted to limited levels of depressive symptoms, but also reach the level of depressive disorder.
Methodological concerns
An unavoidable limitation of the present study is the varying response rate across the participating studies. Generally, the oldest and the more disabled elderly people are under-represented in community studies. This may have led to less pronounced findings and possibly the risk of overlooking cross-national differences. The exact pattern of effects of non-response, however, is difficult to reconstruct.
A second limitation is that the measurement of the aspects of physical health and the depression instruments showed considerable variation across the centres. Although the harmonisation procedures followed are straightforward and easy to reproduce, some categorisations may include a bias. For example, functional disability instruments with more items may be more reliable than those with few items. The ‘selective approach', however, made clear that using scales with equal numbers of items affected the pattern of associations only to a modest degree. Another example is that in London and Liverpool, the chronic disease data differ slightly from diagnostic information and are closer to disability as a concept. Possibly for that reason, the associations in the English samples between chronic disease and depressive symptoms are stronger than in most other centres. Moreover, the very low prevalence of chronic conditions in Spain and Belgium suggests measurement errors, in spite of the regular interview procedure used in these centres.
A third limitation is that the current cross-cultural study was confined to a range of countries in the Western world, and comparison with aged populations in eastern European countries and other continents still needs to be addressed. It is, however, promising that a straightforward harmonisation of assessment procedures seems to be feasible and may be employed for further cross-cultural comparisons, even when restricted to secondary analyses.
Finally, the current study design did not include several possible relevant factors, such as family support and loneliness, income and living accommodation, duration of disease, pain or acute illness, and treatment.
Fatalism or simultaneous treatment
For those who suffer both depressive symptoms and physical decline, a mutual and unfortunate pathway has been demonstrated by longitudinal studies (Reference Ormel and Von KorffOrmel & Von Korff, 2000; Reference Geerlings, Beekman and DeegGeerlings et al, 2001). However, epidemiological studies of disability and depressive symptoms may be criticised because of the possibility of overlap: those who do not feel well, obviously do not function well, and vice versa. Lenze et al (Reference Lenze, Rogers and Martire2001), on the other hand, suggested that the depressed state itself is disabling. Therefore, ignoring depressive symptoms among those with physical decline should be regarded as fatalistic. When both processes affect each other, simultaneous treatment may be rational and is probably essential for management. The rate of recognition of depression is likely to increase because of a greater awareness both in research (Reference Cole and DendukuriCole & Dendukuri, 2003) and in training programmes (Reference BramesfeldBramesfeld, 2003). Nevertheless, there should be close cooperation between those offering practical help to adapt domestic surroundings because of functional limitations and the mental healthcare team.
Clinical Implications and Limitations
CLINICAL IMPLICATIONS
-
▪ As functional disability is closely linked to depressive symptoms in later life, assessment and management of disability is needed in the treatment of depression in the older population.
-
▪ Patients from more traditionally oriented cultures within the Western world are equally prone to depressive symptoms in times of physical decline, and depressive symptoms need to be addressed actively.
-
▪ Application of brief, harmonised procedures to identfy determinants of depressive symptoms are feasible across cultures.
LIMITATIONS
-
▪ With respect to cross-cultural variability, the study is limited to relatively prosperous western European countries.
-
▪ The sampling procedures and patterns of non-response show considerable variation between the participating centres.
-
▪ The methods of assessment of functional disability and the types of chronic diseases were diverse across the participating study centres.
Acknowledgements
The authors thank Professor R. Fuhrer from the Departments of Epidemiology and Biostatistics and Occupational Health, McGill University, Montreal, for her constructive advice in the design of the current collaborative project. The EURODEP collaboration was supported by the European Commission BIOMED 1 initiative; the study on the role of cultural factors in declining physical health was supported by a grant from the Universitair Stimuleringsfonds of the Vrije Universiteit Amsterdam.


eLetters
No eLetters have been published for this article.