


Introduction
The Motor Carrier Act (MCA) of 1980 transformed US freight transport industry. Market forces replaced institutional labour market regulation, like that provided by collective bargaining, quickly fragmenting the general freight common carrier trucking industry into two operationally distinct sectors: truckload (TL) and less than truckload (LTL).Footnote 1 The removal of entry controls resulting from the Interstate Commerce Commission’s new interpretation of the ‘public convenience and necessity’ doctrine, in conjunction with the new firms’ ability to adjust prices and services in accordance with market forces, brought a wave of new motor carriers into the industry. Relatively small, specialised carriers flowed into the highly competitive, easy-to-enter TL sector of the industry creating industrial and workforce disruption (Reference BelzerBelzer, 2000).
Greater competition and lower cost, however, brought with it a corresponding series of public safety challenges. While trucking’s role in the supply chain – and with it trucking industry employment – grew rapidly, unionisation and truck driver compensation declined precipitously. Declining compensation made the trucking industry less attractive and evidence of a ‘labour shortage’ appeared by the late 1980s. More precisely, the trucking industry complained of a shortage of labour quality at the price market pressures allowed them to pay (Reference BelzerBelzer, 1993).
Concomitant with the labour shortage alleged by the industry, the public perception of declining safety led to stronger public policy emphasis on truck driver and motor carrier safety. The burden of protecting the public from trucking risk shifted to the US Department of Transportation, and since 2000, the Federal Motor Carrier Safety Administration (FMCSA) has shouldered the regulatory burden for containing the effects of this competition. While substantial research has suggested that low pay associated with this competition has contributed to the safety problem, research on this question has never determined whether ‘safety pays’. That is, do better-paid, experienced and safer truck drivers have more productivity that offsets the higher compensation?
This research aims to fill that gap. We find that the net present value (NPV) of experienced and safe truck drivers is significantly positive, demonstrating that higher wages paid to qualified drivers are more than offset by lower search, hiring and training costs; lower casualty costs from crashes; and higher productivity. The value of the higher productivity strongly suggests that higher wages paid to truck drivers contribute positively to firms’ bottom line. Safety pays.
Literature review
A large number of the new entrants in the motor carrier industry were small specialised carriers that took advantage of regulatory liberalisation. In 1981, following the enactment of the MCA, about 4200 new carriers quickly entered the trucking industry (Reference MooreMoore, 1983, Reference Moore, Weiss and Klass1986), and by 1986, roughly 19,000 new carriers had entered the market, in addition to the approximately 18,000 carriers that existed in 1980 (Reference Corsi, Fanara, Moses and SavageCorsi and Fanara, 1989; Reference GraweGrawe, 2008). The elimination of the patchwork of former route certificates enabled new entrants to ‘cream’ TL shipments from the existing common carrier sector, leaving primarily LTL shipments to the remaining firms. The LTL sector became concentrated while the TL sector became extremely competitive (Reference BelzerBelzer, 2000; Reference BoyerBoyer, 1993; Reference CorsiCorsi, 1993). The new carriers, aided by an expanded brokerage industry, enabled small motor carriers to compete effectively with the largest motor carriers and the marginal carrier’s cost brought down the price of freight transport (Reference McMullen, Belman and WhiteMcMullen, 2005).
The market segmentation into TL and LTL industry sectors that resulted from deregulation (Reference Belzer and VoosBelzer, 1994), coincident with the 1979 through 1982 recessions (Reference Belman and MonacoBelman and Monaco, 2001), reduced motor carrier freight rates (Reference MooreMoore, 1983) and wages and segmented the trucking industry labour force. In addition, the consolidation of the LTL sector and the burgeoning TL sector effectively reduced overall union coverage in trucking (Reference Belman and MonacoBelman and Monaco, 2001; Reference BelzerBelzer, 1995; Reference HirschHirsch, 1993; Reference RoseRose, 1987); by 2017, union density fell to 9.4% (Reference Hirsch and MacphersonHirsch and Macpherson, 2018). The decentralised nature of the TL segment, combined with the difficulty of organising under The National Labour Relations Act (NLRA), made it difficult for the Teamsters Union to actively recruit new members. As market forces pressured trucking, freight rates fell, eroding TL motor carriers’ margins and driving down compensation. As TL carriers recruited inexperienced drivers straight out of truck driver training school (Reference ViscelliViscelli, 2016), safety issues quickly became salient among policymakers, researchers and the general public.
Some industry observers and researchers contend that there has been a decline in the industry’s overall safety. After the passage of the MCA, the number of crashes in trucking increased sharply (Reference GlaskowskyGlaskowsky, 1990), creating demand for new regulations on motor carrier and truck driver safety. Recent data reveal that while the number of fatal truck and bus crashes per 100 million vehicle miles travelled (VMT) trended down through 2009, truck and bus fatalities have trended up. From 2009 through 2016, truck and bus fatalities have risen 28%. Fatal crashes involving large trucks have increased 31%, with increases of 8.4% in 2015 and 3.4% in 2016 (FMCSA US Department of Transportation, 2016a, Trends, Table 1).Footnote 2 The media coverage of large truck crashes and fatalities, as well as the growth in trucking and highway congestion, has increased public awareness for the need for continued improvements in safety levels. For all these reasons, crashes remain a serious problem for motor carriers, for regulators and for the public.
Table 1. J.B. Hunt descriptive data.

Source: J.B. Hunt.
Values expressed in 1997 dollars. Mean pay rate is $0.46 in December 2018 dollars. Available at: www.bls.gov/data/inflation_calculator.htm
Crashes can be extremely costly for firms and increase the costs imposed on society (Reference Saltzman and BelzerSaltzman and Belzer, 2002). Costs due to crashes include vehicle down time, higher insurance rates and reduced customer service for cargo owners (Reference LeMay, Taylor and TurnerLeMay et al., 1993; Reference Suzuki, Crum and PautschSuzuki et al., 2009), as well as the external cost imposed on society resulting from property damage, productivity loss and loss of life that exceed the limits of current insurance regulations (Reference Saltzman and BelzerSaltzman and Belzer, 2002). Reference Zaloshnja and MillerZaloshnja and Miller (2007) estimate the average cost of a crash for all large trucks at USD91,112 in 2005 dollars. The average cost for a heavy-duty truck crash was USD171,710 even when the injuries to the victim were non-incapacitating. When the victim’s injuries were incapacitating, the costs increased to USD437,845. The average cost per fatality crash was USD3,833,721Footnote 3 (Reference Zaloshnja and MillerZaloshnja and Miller, 2007), far above the minimum liability insurance of USD750,000 prescribed by FMCSA regulations. The FMCSA estimated the cost of all truck and bus crashes at USD112 billion (FMCSA US Department of Transportation, 2016b: 45).
Intercity truck drivers usually earn a mileage-based piece-rate, calculated using a standard mileage calculation, between cities or between a specific origin and destination rather than actual miles driven. Drivers may be paid ‘by the load’, but this system really is a flat mileage rate that has been somewhat obscured for each individual carrier and freight movement. Driver pay also may be based on a percentage of the freight rate for the load being hauled. In this mechanism, drivers’ compensation is contingent on both distance and the market rate to move the freight based on microeconomic pricing factors associated with the availability of the particular skill-set of the driver, the type of equipment used and the type of freight. Examples of special skills include hazardous materials handling licensure (for the carrier and the driver) and the ability to operate specific equipment (Reference Burks, Belzer and KwanBurks et al., 2010). In a few limited cases, drivers are paid hourly for intercity work, but only by a few carriers with tightly managed operations.
Compensation may include health insurance, safety and performance bonuses, retirement plans, life insurance and other financial incentives. Because so few long-distance drivers are paid by the hour, it is difficult to compare safety performance based on hourly and piecework pay. The only known study, performed for FMCSA, isolated carriers’ pay for non-driving labour and found a significant relationship between motor carrier crash rates and the drivers’ unpaid non-driving time (Reference Belzer, Rodriguez and SedoBelzer et al., 2002). This research is consistent with the work performed by Australian scholars on compensation and safety. Quinlan’s research demonstrated broad relationships between compensation and safety, and Williamson and Friswell specifically showed that unpaid waiting time significantly predicted safety (Reference QuinlanQuinlan, 2001; Reference Quinlan, Mayhew, Johnstone and TuckerQuinlan et al., 2006; Reference Williamson, Bohle and QuinlanWilliamson et al., 2009; Reference Williamson and FriswellWilliamson and Friswell, 2013). Scholars also have studied the relationship between a firm’s financial health and its effect on the firm’s safety outcome (Reference Corsi, Barnard and GibneyCorsi et al., 2002; Reference Rodriguez, Rocha, Belzer, Peoples and TalleyRodriguez et al., 2004).
Reference Corsi, Barnard and GibneyCorsi et al. (2002) attempted to determine whether a relationship existed between a firm’s safety performance, measured by driver and vehicle evaluations carried out in roadside inspections, and a firm’s financial health with respect to commonly used financial measures. They segmented the data by carrier type, finding a statistically significant negative correlation between the driver safety measure and the drivers’ wages as a percent of operating expenses. They also found a negative correlation between the vehicle safety measure and driver wages as a percent of operating expenses. They conclude that carriers that spend a larger percentage of operating expenses on wages attain better driving and vehicle safety scores.
Reference Rodriguez, Rocha, Belzer, Peoples and TalleyRodriguez et al. (2004) combine three data sources compiled at the firm level to construct the variables for driver compensation, a firm’s financial status, and variables for the various occupational demands placed on the drivers. They started with The National Survey of Driver Wages published by Signpost Inc.,Footnote 4 a quarterly convenience sample of approximately 200 TL carriers. The researchers combined these data with data from the Motor Carrier Management Information System (MCMIS), collected by FMCSA, and firm-level data from the Motor Carrier Financial and Operating Statistics (F&OS) Programme, administered until 2003 by the US Department of Transportation’s Bureau of Transportation Statistics (BTS). After all three data sets were combined, 60 TL motor carriers that paid employee drivers by the mile remained in their analysis. Due to the limited number of observations in the data set, they estimated three separate regressions to determine whether the operating ratio, the cash flow ratio or the labour cost ratio – all measures of the financial health of motor carriers – have an effect on the safety outcomes of the motor carriers. Across all three of the models, the control for unpaid driver working time had a statistically significant effect on safety outcomes. At the mean, a 10% increase in a workers’ unpaid working time will increase crashes by 2.3%. Although pay rate is not statistically significant in the models, the authors included compensation variables as a block; the block of variables is statistically significant. They found that a 10% higher labour cost ratio – the ratio between driver pay and firm revenue – was associated with a 0.6% lower crash rate, and that greater liquidity and carrier financial health reduces overall crashes (Reference Rodriguez, Rocha, Belzer, Peoples and TalleyRodriguez et al., 2004).
Reference Britto, Corsi and GrimmBritto et al. (2010) also found a relationship between a motor carrier’s financial health and safety performance. Their data set consisted of 657 carriers in all major motor carrier industry segments, of which 86% were TL motor carriers. They used average driver wages as a control variable in three regressions and found a statistically significant relationship between average driver wages and the driver safety performance score, the vehicle safety performance score and total reported crashes from SafeStat (n.d).Footnote 5 Improved driver and vehicle safety suggest that motor carriers that pay higher wages, on average, experienced fewer driver and vehicle regulatory violations and have improved safety performance, implying that higher average wages paid to drivers improve motor carrier safety (Reference Britto, Corsi and GrimmBritto et al., 2010).
Reference Monaco and WilliamsMonaco and Williams (2000) utilised a survey conducted by the University of Michigan Trucking Industry Programme (UMTIP) during the summer and fall of 1997 (Reference Belman, Monaco and BrooksBelman et al., 2004). The depth of the survey allowed for a much richer understanding of the characteristics that might contribute to truck crashes. They found that pay level and method have a statistically significant effect on the probability that the driver will have a crash. For example, an USD0.10 per mile raise was associated with a 1.76% lower probability of experiencing a crash; moreover, drivers earning an hourly rate were 10.2% less likely to have been involved in a crash. Their most notable finding was the fact that occupational variables – particularly pay method – were more significant predictors than demographic variables. Drivers earning a higher effective mileage rate have lower crash probabilities and are less likely to have logbook or moving violations (Reference Monaco and WilliamsMonaco and Williams, 2000).
Reference Belzer, Rodriguez and SedoBelzer et al. (2002) also studied the relationship between compensation and safety. Their research objective was to study the relationship between the various compensation practices of motor carriers and the resulting behaviour of the drivers employed by them. In a cross-sectional analysis of 102 non-union TL carriers, using the Signpost data referenced above along with their survey of carriers, they created an ‘unpaid’ time variable. Unpaid time had a mean value of 0.004 hours per mile driven, which translates into approximately 3.6 hours of unpaid work on a 906 mile average trip. At the mean, they estimate that 10% greater compensation is associated with a 9.2% lower crash rate, including all components of compensation: pay rate, pay for non-driving labour time, anticipation of a regular raise, safety bonus, health insurance and life insurance all contribute to lower motor carrier crash rates (Reference Belzer, Rodriguez and SedoBelzer et al., 2002).
Reference Rodriguez, Targa and BelzerRodriguez et al. (2006) employ a unique driver-level data set from J.B. Hunt, a large US TL carrier. Their event history (survival) analysis showed that a one penny greater driver base pay was associated with an 11% lower crash probability, and that a 10% increase in the level of the drivers’ pay reduces crash risk by 6%. Overall, their extensive examination of driver’s compensation and safety outcomes suggest that truck driver compensation is an extremely strong predictor of a truck driver’s safety performance (Reference Rodriguez, Targa and BelzerRodriguez et al., 2006).
Reference Rodriguez, Rocha and KhattakRodriguez et al. (2003) expanded on Reference Belzer, Rodriguez and SedoBelzer et al. (2002), attempting to develop a better understanding of the underlying operational factors motivating driver behaviour. Using a zero inflated Poisson regression count model, they found that occupational factors – specifically the rate of pay – and job tenure influence safety outcomes significantly more than demographic factors (Reference Rodriguez, Rocha and KhattakRodriguez et al., 2003). In addition, their results suggest that if the driver were to receive a one cent per mile increase in pay, the driver’s expected crash count would fall by 8.15%; moreover, when they estimate the model at the mean rate of pay (USD0.30 per mile in 1997 dollars), if the driver’s pay rate increases by 10%, the overall crash count is 24.7% lower. When the model is standardised, the model validity is unchanged, although the estimated coefficients must be interpreted in units of standard deviation. Therefore, when a driver’s pay increased from USD0.307 per mile to USD0.37 per mile – a one standard deviation change – the expected crash count is 43.6% lower (Reference Rodriguez, Rocha and KhattakRodriguez et al., 2003). Indeed, after the company raised pay by that amount, crashes declined nearly 50% in the first year.
While this research supports the hypothesis that compensation strongly influences motor carrier safety, the causal pathways for how pay actually influences safety outcomes remain less clear. The authors’ research objectives were to disentangle the direct and indirect effects of pay on safety. The indirect effect refers to the ability of motor carriers to attract and retain employees that will allow the drivers to accumulate human capital and improve safety outcomes, as measured by the number of crashes. In the Hunt crash model, the control variable for the driver’s pay at his or her time of hire, ‘Basepay’, was not statistically different from zero. The control variable, ‘Newpay’, a driver’s pay level after receiving a raise suggests that a 1% higher pay rate reduces a driver’s crash probability by 1.33%. However, Reference Rodriguez, Targa and BelzerRodriguez et al. (2006) were unable to disentangle the causal path – specifically the indirect path of human capital accumulation controlled by ‘Basepay’ in the model. We attempt to resolve this problem.
Background and industrial context
A typical TL truck driver can expect to work long and irregular hours. Although working time technically is limited by hours of service (HOS) regulations, drivers frequently report working considerably more hours than allowed by the law (Reference BelzerBelzer, 2000; Reference Chen Guang, Sieber and LincolnChen Guang et al., 2015: 68; Reference Kemp, Kopp and KempKemp et al., 2013; Panel on Research Methodologies and Statistical Approaches to Understanding Driver Fatigue Factors in Motor Carrier Safety and Driver Health, 2016; Reference Stephenson and FoxStephenson and Fox, 1996). Long-haul truck drivers trade labour and leisure depending on their pay level, however, with higher pay associated with fewer hours worked (Reference Belzer and SedoBelzer and Sedo, 2018). Drivers commonly work 80–100 hours per week and evade legal requirements simply by logging their on-duty not-driving labour as off-duty. Since they earn little or no pay for this labour, they have no incentive to log it legally (Reference ViscelliViscelli, 2016).
Loading and unloading operations carried out by the drivers, often without compensation similar to what they earn while driving, exacerbate driving demands and incent drivers to log off duty. In fact, drivers’ opportunity cost for excessive labour creates a choice architecture in which drivers choose between short-haul work (more likely limited to the legal limit of 60 hours per week because short-haul drivers log their time on a regular time clock, by law) and long-haul work; in long-haul, drivers can evade HOS regulations easily and log on-duty not-driving work as off duty, allowing them reach target earnings by working unusually long hours (Reference Belzer and SedoBelzer and Sedo, 2018). Drivers have reported that the compensation is not adequate for the long hours and extended periods away from home. Some argue that TL drivers experience ‘sweatshop’ working conditions, and Reference ViscelliViscelli (2016) reports on the prevalence of debt peonage, as drivers are encouraged by some trucking companies to lease trucks directly from them and become indebted to their employer, misclassifying their employment as contracting out. Drivers working within these employment structures earn a bare subsistence level of pay, work extremely long and irregular hours, and experience working conditions that are not conducive to their overall good health or the health of the industry (Reference BelzerBelzer, 2000).
Bargaining power has shifted to the cargo owners, who hire freight transport in a highly competitive auction that has kept freight rates very low for decades. To secure the freight, TL carriers must choose the cost-minimising amount of capital and labour inputs in order to deliver shipments of freight in a manner that is most efficient and cost effective to the carrier and to the cargo owner, which sets the rates. This requires the trucker to have equipment and drivers strategically located in order to influence these movements. The labour choice for motor carriers considers the overall price of ‘effective labour’ that includes the total cost to the firm for hiring and employing labour. The effective labour cost for a driver consists of the original cost to recruit and train a driver; the operational costs needed to create the employment bundle, including working conditions needed to hire and retain the marginal driver; the cost of insurance and crashes that the firm incurs from selecting certain types of drivers; and the actual compensation paid to the driver including any necessary compensating wage differential for drivers who work under the worst conditions. The TL sector now expects high turnover levels, high crash rates and low to non-existent compensating differential payments (Reference Burks, Carpenter and GoetteBurks et al., 2008). Entrenchment of this model in the TL sector of the motor carrier industry leaves few firms able to afford to exploit cost tradeoffs needed to do more than maintain continuous churn, which is approximately 100% per year (Reference Burks, Carpenter and GoetteBurks et al., 2008).Footnote 6
The firm we studied, J.B. Hunt, wanted to become a world-class provider of freight transportation, rebranding itself as a good company for which to work and to which to consign freight. To fulfil this goal, Hunt initiated a new managerial culture in which managers and supervisors became more attentive to safety issues and recognised driver concerns, turning their attention to workforce stabilisation. To accomplish this task, Hunt raised the per-mile rate of pay for drivers by an average of 37%, terminated those with poor safety records and substantially increased the per-mile rate of pay for newly hired safe and experienced drivers up to USD0.38 per-mile (USD0.60 in 2018). While the carrier formerly hired only ‘students’ (drivers new to trucking, whom they trained), the new policy was to pay experienced and safe drivers a higher wage that was significant enough to attract and retain the most experienced drivers in the TL sector – hoping that the efficiency-wage increase in pay would erode the disutility of the long-haul TL driving job enough to attract experienced safe drivers and reduce turnover and crashes, going beyond the ‘effective labour’ trap. In other words, J.B. Hunt moved from the model of high crash incidence and low wages to the high-road model of low crash incidence and high wages.Footnote 7
In addition to increasing wages, to the highest in the TL industry, the firm completely remade the corporate culture by enhancing the benefit package for their drivers ‘running the system’ (irregular route, indeterminate scheduling and long-haul) to attract the highest quality drivers. They increased the amount of home time earned with a 100% guarantee that with at least 14 days’ notice, drivers would return to their home terminals; implemented a new recognition programme in order to restore driver dignity and accountability; and reduced tractor age and increased maintenance schedules, among many other remedies.Footnote 8 Translated into economics, the carrier believed that hiring experienced and safe truck drivers who earn a higher starting wage would give the company a higher expected NPV than the expected NPV of returns to the firm for the inexperienced drivers whom they previously hired.
Theory and model
To investigate, we estimate the expected NPV of experienced and inexperienced drivers at different pay rates. We estimate a Cox proportional hazards model that disentangles the effects of pay, the effects of driver experience and the new management regime’s effects on the driver exit rate and driver crash rate, controlling for demographic and operational covariates that have not been considered in other research. Cox regression – also known as survival analysis and originally used to estimate life tables – estimates the hazard rate (probability) of an event, controlling for other factors (Reference CoxCox, 1972). In this use, the driver ‘survives’ because he or she does not have a crash and does not exit the firm. The estimates for the driver survival rate for crashes and employment termination, using the Cox proportional hazards models, are instrumental in the calculation of the expected costs and expected revenues in the current NPV analysis. We expect that the firm will retain the drivers to whom the company pays a higher starting wage; moreover, the drivers to whom the company pays higher starting wages will experience a lower probability of crash, affecting the overall expected NPV. In addition, we expect that experienced-at-hire drivers will be more productive in terms of miles driven per month. Finally, we expect that the expected NPV of experienced-at-hire drivers in pay regime two will be larger than the expected NPV of inexperienced-at-hire drivers in pay regime one.
Following Reference BeckerBecker’s (1963) human capital analysis, labour shares many of the characteristics of capital employed in the production process. In particular, the trucking company hires labour with the reasonable expectation that the employee will work in the production process past the initial hiring period. Firm training and on-the-job experience gained by the employee during the production of a good or service contributes to the expected future revenue stream for the firm. Similar to capital, the long-lived nature of labour allows for a multi-period analysis that compares the discounted stream of expected future revenues to the associated discounted stream of expected future costs. After subtracting the initial hiring cost, rational firms will hire employees if the expected future revenues exceed the expected future cost. The model utilised for J.B. Hunt is

where C is the initial cost of hiring a driver at time zero and
 denotes the driver types hired by Hunt. Drivers denoted as ‘type one’ were inexperienced when they were hired under pay regime one (before a pay raise), and ‘type two’ drivers were experienced at the time of hire during pay regime two, during which the mileage wage rates were USD0.37 and USD0.38 based on prior experience. Time is measured in driver tenure months where
 , and the expected revenue and cost is discretely discounted by the driver tenure month.
Data
J.B. Hunt is a large TL motor carrier that hauls general freight throughout the US. The proprietary data supplied by the firm for the current research consists of 87,887 driver observation months (11,457 unique drivers) that includes driver demographic and operational covariates in their ‘random over-the-road’ irregular route TL division. In addition to the standard operational covariates of driver mileage and dispatches per month, the data set includes information on a driver’s prior driving experience before hire, the value of crashes each driver sustained per month and the month that a driver exits the firm’s employment.
The drivers are observed during two time periods; the periods are referred to as ‘pay regime one’ for the first observation period and as ‘pay regime two’ for the second observation period. Pay regime one, 13 months of observation, commenced on 1 September 1995 and ended on 30 September 1996 – the date on which Hunt announced the impending changes in compensation and other policies. Observation for pay regime two began on 1 February 1997 – the month that the drivers retained by the firm (carried over from pay regime one) received a mileage pay increase, and the first month that fully incorporated the newly hired experienced drivers. The observation ended on 28 February 1998, including 13 months of data during period two. No data, except the hire dates of the drivers hired in the intervening 4-month period for pay regime two employment, are observed during that period. Selected statistics for the entire data set are shown in Table 1.
Methodology
The analysis estimates the expected NPV for drivers inexperienced-at-hire in pay regime one but continuing their employment into the second period, and for drivers experienced-at-hire in pay regime two. We employ a probability estimate for a driver exit in each tenure month and a probability estimate for a driver crash incident in each tenure month, using models established in prior research (Reference FaulkinerFaulkiner, 2015). These data do not distinguish as to whether each crash involved only the freight being carried, only the tractor or trailer, other pedestrian or highway vehicles, property damage or any combination of these various types of incidents; moreover, we do not know from the data whether each particular crash was preventable or unpreventable. We also do not know whether the driver exits from Hunt were voluntary quits or involuntary discharges. Other estimates used in this analysis were calculated from the current data or obtained from publicly available sources.
We obtain the initial cost estimate for hiring each driver type l,
 , from the internal documents that were supplied by the firm for which the firm provided no specific breakdown. These direct costs reflect advertising, recruitment, training and miscellaneous costs not identified in the documentation related to the hiring of the driver at time
 , the time period before each employee appears in the data and drives for the firm. The cost for drivers who were inexperienced-at-hire reflects a per-driver estimate for the firm’s driver training facilities and any wages and benefits paid to the driver while attending the intensive driver-training course. All inexperienced drivers would have been required to undertake the firm’s training course and almost all drivers hired in period one had no prior trucking experience. We do not know the extent to which the carrier recovered payments for the training in the event that a driver’s employment terminated. At the end of period one, the firm closed its training facilities. For drivers who were experienced-at-hire and hired during period two (after the carrier increased wages), their initial cost reflects training at the firm intended only to familiarise new employees with company policies and procedures. Hunt estimated hiring costs at USD4251 for a pay-regime-one driver and USD948 for a pay-regime-two driver (December 2018 US dollars).
The data are recorded in driver tenure months and therefore we estimate the discounting in the model discretely on a monthly basis. The discount factor, r, is the average of the 2-year US Treasury note rate from the beginning of 1995 through the end of 1998,Footnote 9 and other discount rates will be used for comparison. It should, however, be noted that the 2-year Treasury note rate is a conservative estimate of the opportunity cost for the firm during this time period; the firm’s commercial paper rate, the short-term rate the firm paid to obtain funding, closely approximated the 2-year US Treasury note rate. In model (1) above, the expected revenue is

We ran a fixed effects (FEs) regression on the two subsets of drivers of interest in the data to obtain the predicted miles for each driver type l during each tenure month t, where the FE model is

We include a dummy variable for each tenure month in the FE regression to control for potential time trends and effects. The operating revenue per mile was calculated from Hunt’s publicly available annual reports and averaged over the years during which the drivers were observed. The firm’s reported insurance and claims’ cost were added to the operating income reported in the annual reports and divided by the firm’s reported miles driven, where

The probability of survival (retention) for each driver type l at each tenure month t is

where each driver j of type l has survived to the time just before his or her employment at the firm terminated or the test period ended. The expected cost in model (1) from above is

The average crash cost for each driver type l is calculated from the firm’s supplied data and was chosen to smooth the monthly expected NPV estimates. We estimate the probability of a crash from equation (5). The predicted lost miles are estimated from equation (3), and operating revenue per mile is calculated from equation (4).
Finally, in model (1), we estimate no residual value. In the analysis of physical capital, one should estimate a scrap value or residual value for the material used in the capital that the firm typically sells at the end of its useful life. Because labour is not a commodity and is free to move without constraint, it depreciates instantaneously and therefore has no residual value to the firm. When an employee terminates employment, the firm cannot claim a residual; for the firm, all of the value vanishes.
Results
Drivers who earn a higher starting wage in pay regime two remain employed longer. The turnover results are similar for the estimated driver crash probabilities. In the early tenure months, experienced drivers in pay regime two have a significantly lower crash probability. The estimate from the FE productivity analysis shows by way of a difference in means test that there is a statistically significant difference between the two driver groups tested. As hypothesised, the experienced-at-hire drivers were more productive; we estimate that, on average, they drove 1268 miles more per month than the inexperienced-at-hire drivers.
Productivity and value
The results of the expected NPV analysis show that the inexperienced-at-hire driver during pay regime one had an expected NPV of – USD2477 for the firm, while the experienced-at-hire driver during pay regime two had an expected NPV of USD7997 – a USD10,474 per year difference in value accruing to the firm (December 2018 US dollar values). The expected NPV was calculated at the preferred discount rate of 5.78% during the observation period, the average rate of the 2-year US Treasury notes. In addition, we used the preferred average operating revenue of USD0.12 per mile estimated from the carrier’s publicly available financial reports to make this expected NPV estimate. As hypothesised, once the estimates for the expected NPV are normalised to account for the large pay increase, the expected NPV of the experienced-at-hire driver significantly exceeded the expected NPV of the inexperienced-at-hire driver by USD2783 (December 2018 dollars).
Our principal objective was to examine and compare the expected NPV of the inexperienced-at-hire drivers to the expected NPV for the experienced-at-hire drivers, the primary operational groups of J.B. Hunt. The survival probabilities are estimated to calculate the expected revenues that each driver type accrued for the firm; moreover, we estimate crash probabilities to calculate the expected costs to the firm for each of the driver types. We employed a FE regression to predict driver productivity, in miles driven, during each month of employment tenure. This research has shown, from those estimates, that experienced-at-hire drivers are more productive and have a large positive expected NPV, while inexperienced-at-hire drivers give the firm a negative expected NPV. This suggests the rational firm will hire experienced drivers, even though their pay rates are higher.
Retention probability and results
During pay regime one, Hunt required all inexperienced drivers to attend extensive truck driver training. Although the firm did not break down the cost of this training, it is reflected in the substantial initial cost of hiring a pay-regime-one driver when compared with the initial cost of hiring an experienced pay-regime-two driver. The closing of the training facilities, and the consequent reduction in hiring costs, offsets the higher wage the firm paid to pay-regime-two drivers, contributing to the larger NPV of pay-regime-two drivers.
During pay regime one, inexperienced-at-hire drivers worked at the pay rate of USD0.23–USD0.25 per mile (about USD0.38 in 2018 dollars); experienced-at-hire drivers in pay regime two were hired at either USD0.37 or USD0.38 per mile, based on their prior driving experience (about USD0.60 in 2018 dollars, the ‘safe rate’ estimate in Reference Belzer and SedoBelzer and Sedo (2018); the likelihood of drivers working 60 hours per week. In the first 2 months of employment, drivers of both types survived at about the same rate. However, beginning at the third month of employment, the data show a marked difference in the driver survival rates.
By the eighth month of employment, only 40% of the inexperienced-at-hire drivers remained employed at Hunt while approximately 70% of the experienced-at-hire drivers who were paid USD0.37 per mile and 75% of the drivers paid USD0.38 per mile remained with the firm. By the 12th month of employment, the point at which inexperienced-at-hire drivers would be reclassified as experienced, only 28% of the inexperienced-at-hire drivers remained employed by Hunt, while 62% and 70% of the higher paid drivers (USD0.37 and USD0.38, respectively) still remained employed (see Figure 1). The fact that the higher starting wage influenced experienced drivers to remain working longer for Hunt is one of the primary reasons that the expected revenues in the current analysis and the expected NPV is larger for the experienced-at-hire drivers in pay regime two. In sum, the more the firm paid the drivers the greater the fraction of drivers it retained. This suggests that firms wanting to reduce turnover could succeed by paying higher wages.
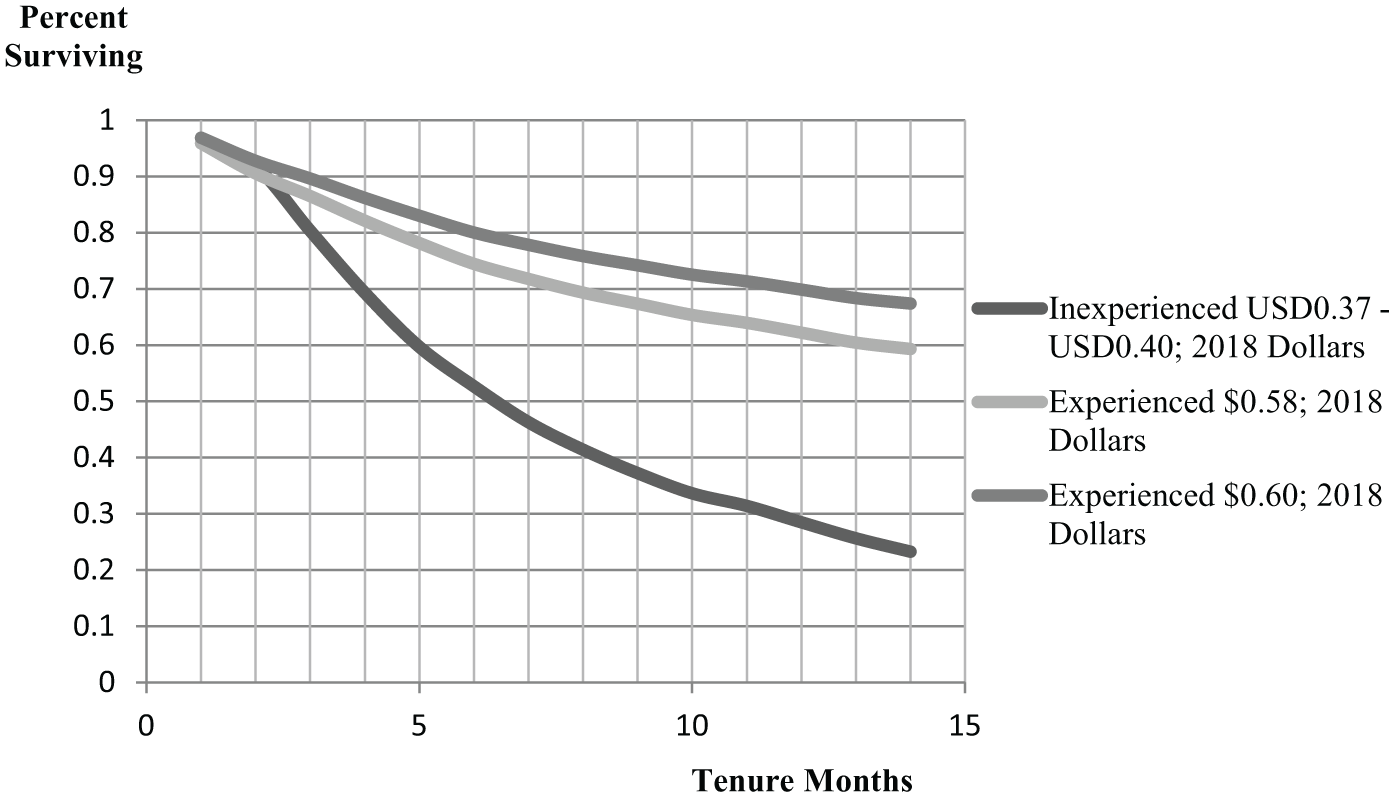
Figure 1. Survival function by driver type at hire.
J.B. Hunt data. Values expressed in December 2018 USD
Available at: www.bls.gov/data/inflation_calculator.htm
Crash probability, miles driven and cost
Throughout the experienced-at-hire drivers’ tenure, those who earned USD0.37 and USD0.38 per mile have almost the same crash probability. However, during tenure months 2 through 8, inexperienced-at-hire drivers have a significantly higher crash probability, which peaks in tenure month 3 at about a 15% probability of a crash during the month. Importantly, however, at around tenure month 10, when the inexperienced-at-hire driver will soon become classified as experienced, the drivers’ crash probabilities are indistinguishable from the experienced-at-hire drivers (see Figure 2). Low turnover, made possible by higher compensation, has contributed to safer driver performance.
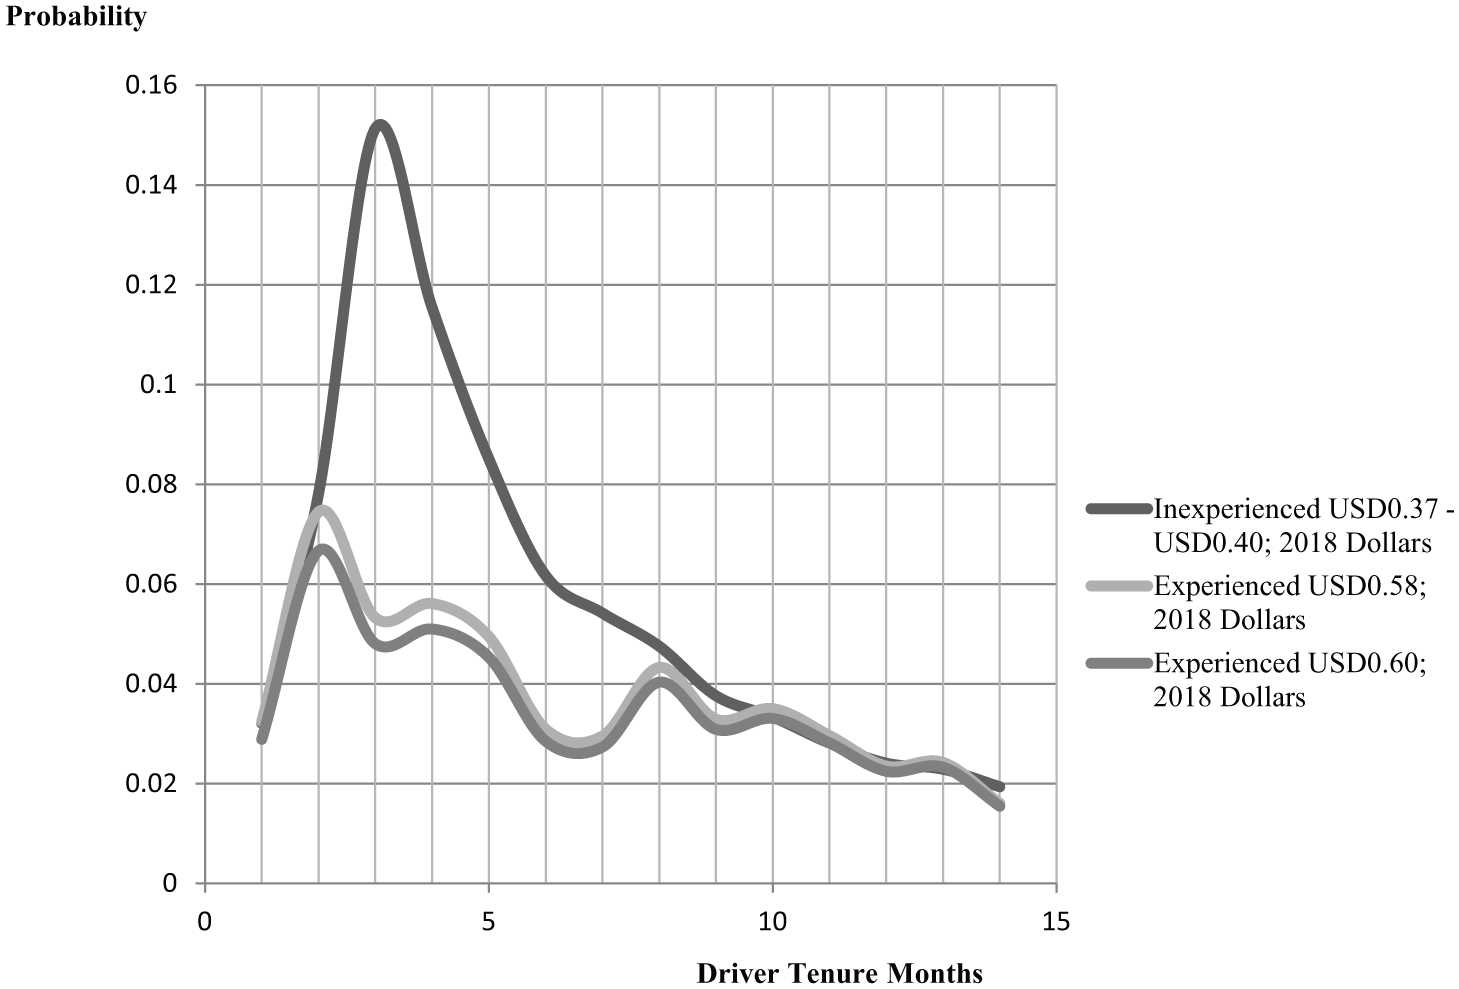
Figure 2. Hazard rate for crashes by driver type at hire.
J.B. Hunt data. Values expressed in December 2018 USD.
Available at: www.bls.gov/data/inflation_calculator.htm
Workers whom Hunt hired without trucking experience and trained to become drivers not only cost more to hire and train and had more crashes, but the cost of their crashes was almost twice as great as those of experienced drivers. In pay regime one, inexperienced-at-hire drivers’ average crash cost was USD8653, while the experienced-at-hire drivers’ average crash cost was USD4581(both in December 2018 real dollars). The high probability of a crash early in the tenure of the inexperienced-at-hire drivers, in conjunction with their much larger average crash cost during pay regime one, significantly contributed to the large expected costs for those drivers and that also contributed strongly to their much lower expected NPV. The high probability of crash also contributed to a major service problem that the carrier wished to remedy in order to attract and retain higher valued customers.
The estimates from the FE productivity regression in the first tenure month of employment suggest that both groups drove similar monthly miles. However, we estimate that experienced-at-hire truckers drove significantly more miles per month in tenure month 2. From tenure month 3 forward, experienced-at-hire drivers consistently drove approximately 1000 miles per month more than the inexperienced-at-hire drivers (see Figure 3). This productivity differential stems from the firm’s more intensive use of their more experienced and safe drivers, awarding more dispatches per period allowing these drivers to log more miles, as well as their greater understanding of how to log those miles and complete more trips. Furthermore, even if the mileage prediction from FE productivity analysis was the same for both driver types, experienced-at-hire drivers would still have a larger expected NPV because of the significance of the estimates of the survival and crash probabilities.

Figure 3. Predicted monthly miles driven by driver type at hire.
Source: J.B. Hunt.
The survival model and crash model estimated from Hunt’s data can be used to make predictions for driver tenure months beyond the driver tenure months contained in the data set. Because 75% of the observations contain 9 months of tenure-month data or less, we estimate the expected NPV at nine tenure months. Using the same discount rate as specified above, we calculate the preferred operating revenue is USD0.12 per mile from the firm’s publicly available annual reports. We applied various discount rates from 3% to 8%, as well as various operating revenues from USD0.07 to USD0.16 per mile for experienced-at-hire drivers who earn USD0.37 per mile, and from USD0.07 to USD0.30 for inexperienced-at-hire drivers who earn USD0.23–USD0.25 per mile, to find a range of expected NPVs. In the preferred range of operating revenue per mile from USD0.07 to USD0.16, the NPV for the inexperienced-at-hire drivers is negative, including estimates past nine tenure months that are not shown. At operating revenue estimates greater than USD0.16 per mile for inexperienced-at-hire drivers, the expected NPV is positive (see Table 2). This suggests that the carrier needs to have higher operating revenue to compensate for the lower expected NPV of inexperienced-at-hire drivers. Less skilled and inexperienced drivers cost the company money.
Table 2. Inexperienced at hire driver’s expected net present value.
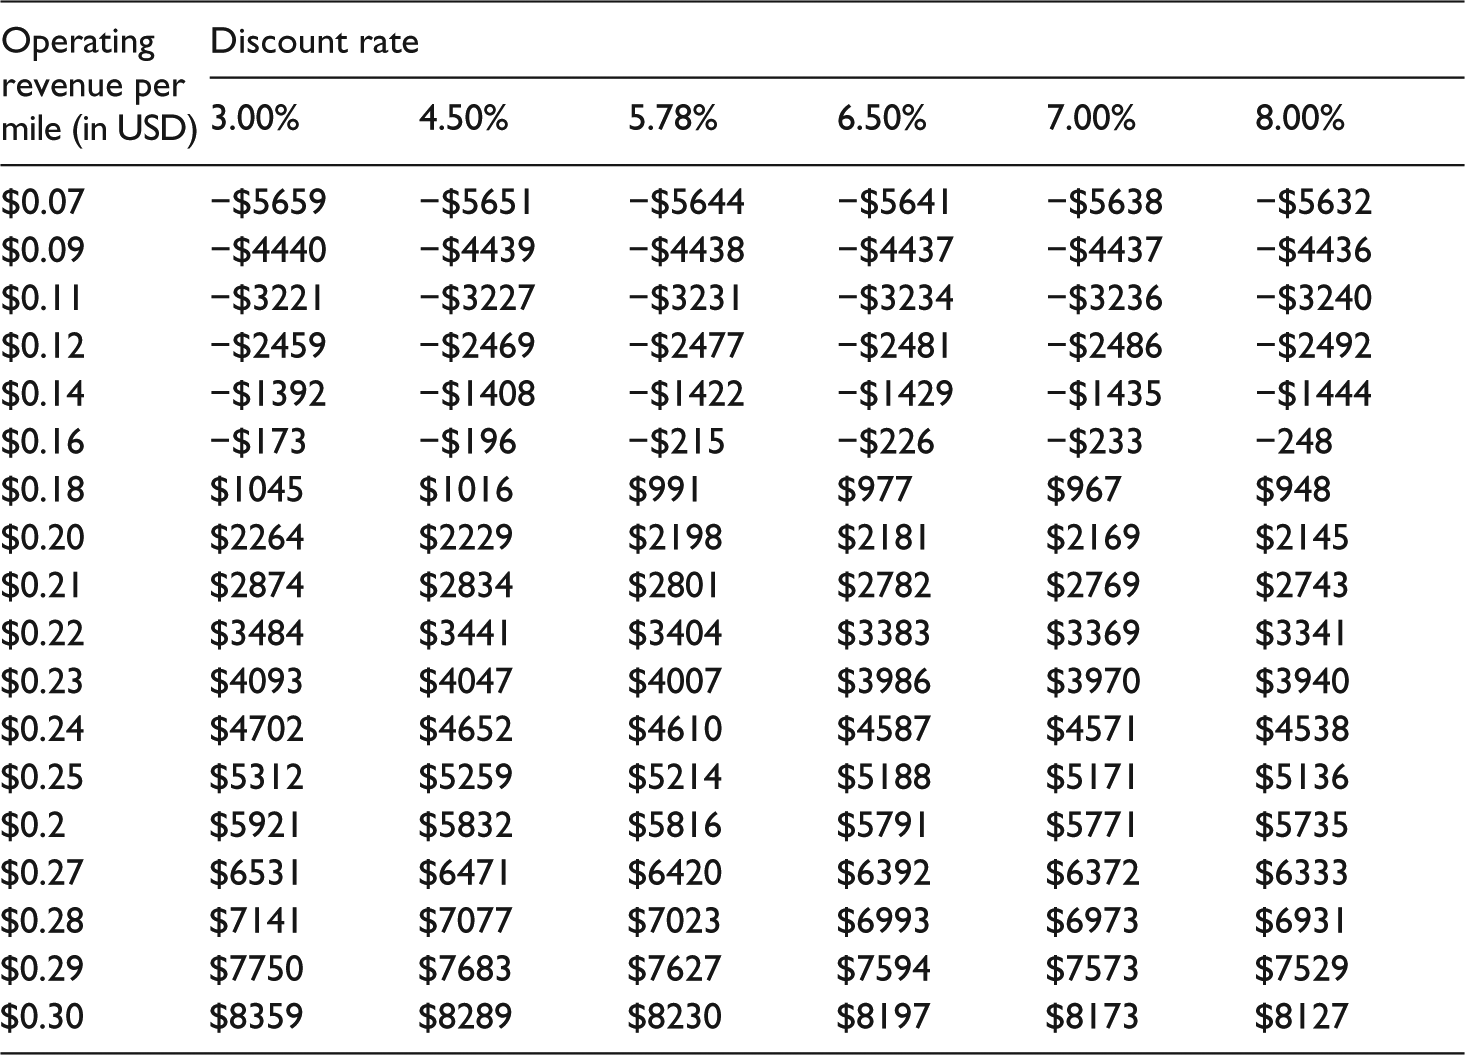
Operating revenue values expressed in 1997 dollars.
The expected NPV of inexperienced drivers ranged from the low of –USD5659 to a high of +USD8127 (December 2018 dollars). For the experienced-at-hire drivers, their estimated NPV is always positive and ranged in value from USD3441 to USD11,177 (December 2018 US dollars) (see Table 3).
Table 3. Experienced-at-hire driver’s expected net present value.
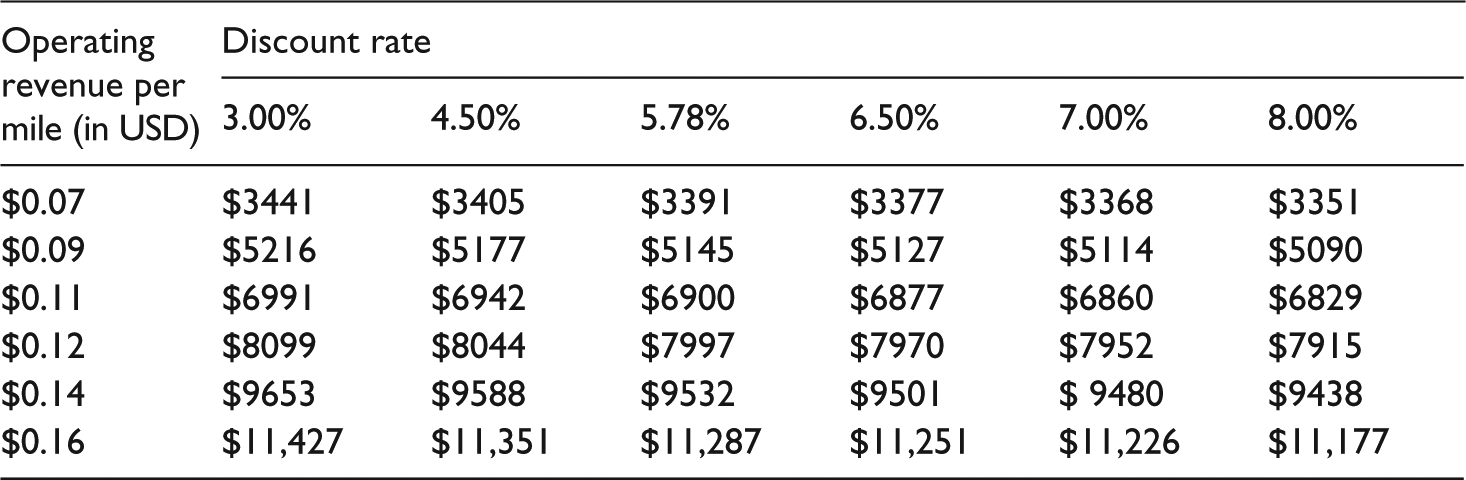
Source: J.B. Hunt data; www.bls.gov/data/inflation_calculator.htm
NPV of experienced driver at assumed $0.12 OR per mile ($0.19/mile in December 2018 dollars) is $7997 December 2018 dollars.
Inexperienced-at-hire drivers have high upfront costs at hire, higher crash costs and a low per mile wage. To hire this type of driver, the firm requires a higher per mile operating margin. Because inexperienced-at-hire drivers have a high probability of separation in the early tenure months, even with higher operating margins, the firm fails to earn a good expected return from these drivers. Furthermore, the opposite is true for experienced-at-hire drivers. The low upfront costs, lower crash costs and higher wages result in a lower per mile operating margin; however, the experienced-at-hire driver remains employed with the firm for a longer time, which generates a positive expected return. To adjust for the difference in the required operating margins between the two driver groups under investigation, for which the publicly available annual report data do not account, we add the mean difference of USD0.13 per mile – the difference in the per mile wage rate of the two driver groups being compared – to the inexperienced-at-hire driver’s operating revenue per mile in order to make an equivalent comparison in the expected NPV between the two driver groups. The results shown in Table 4 indicate a large difference in the expected NPV of the experienced-at-hire driver over the inexperienced-at-hire driver for various discount rates and the comparable adjusted operating revenue per mile.
Table 4. Difference between experienced and inexperienced driver’s normalised expected net present value.
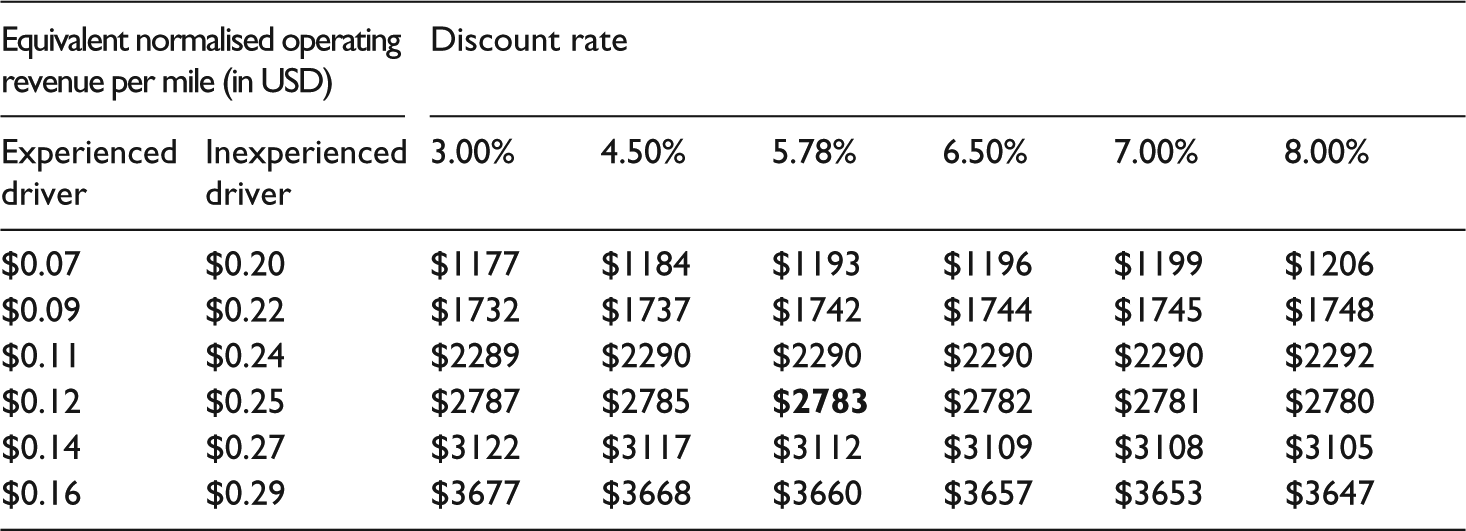
Source: J.B. Hunt data; www.bls.gov/data/inflation_calculator.htm
NPV of experienced driver at assumed $0.12 OR per mile ($0.19/mile in December 2018 dollars) and inexperienced driver at $0.25 OR per mile ($0.39/mile in December 2018 dollars). Difference in expected net present value is $2783, December 2018 dollars (shown in bold).
Finally, while the data provided by J.B. Hunt were stratified on the two managerial periods, overall model results are not shown. The strata covariate provided a control for data that was not supplied by Hunt to account for the change from pay regime one to pay regime two; furthermore, the strata covariate captured the effect of the managerial change on turnover rates and crash rates at Hunt.
Discussion
This research takes advantage of a natural experiment undertaken by J.B. Hunt and the rare nature of the data set to quantify the effects of increased driver pay on driver retention rates and to quantify the effects of driver experience at hire on driver crash probabilities. We employ those estimates in order to calculate the expected NPV for Hunt’s target driver groups. These findings, in addition to providing a new contribution to the existing literature, can inform regulatory as well as business decision making, as it shows substantial company benefits associated with higher CMV driver pay. These individual firm benefits, if spread across the industry, suggest that higher compensation, aimed at reducing turnover, mitigating an alleged driver shortage, and improving safety, could pay for itself.
The findings suggest that the large increase in the wage paid by the trucking company to attract safe and reliable drivers effectively improved driver retention rates, reducing turnover; reduced driver crash probability; and reduced the average cost of a crash during pay regime two. The lower cost of driver turnover (search and training costs), as well as reduced crash casualty cost and improved firm performance, has led to significantly higher expected NPV for the higher-priced experienced drivers who were hired during pay regime two, when compared with the previously hired inexperienced drivers during pay regime one.
Increasing the wage for newly hired drivers allowed the carrier to hire safe, experienced and productive drivers, which significantly improved the firm’s return on investment (Region(s) of interest (ROI)).Footnote 10 The ROI for pay regime one (the ‘low-road’ cost-minimisation regime), calculated from the NPV estimate, is –25%, while the ROI for pay-regime-two drivers (the ‘high-road’ regime) is 285%. The company policy to raise wages led to a rapid and significant improvement in safety performance as well as a 10-fold improvement in ROI. Although the two driver groups are statistically different in these data, the productivity gain in this analysis arises from the firm’s awareness of the drivers’ abilities in terms of experience, safe driving skills and productivity. The skill of the new workforce enabled the firm to utilise their drivers more intensively, leading drivers to produce more miles per month per driver. In addition to about 1000 more miles per month, the firm dispatched experienced drivers more times per month. In essence, workers are driving more miles and driving more safely, resulting in increased driver retention rates and greater productivity and therefore increasing ROI. Economic research and theory leads us to expect that higher paid and more experienced drivers will be both safer and more productive. The evidence from Hunt shows that both were true. If it is true for Hunt, we would expect that it would be true for other motor carriers in the US and elsewhere. The economic theory supported empirically by this research suggests that this should be true for other industries as well, and certainly these results should not be limited to the US. The low-road cost-minimisation business model may indeed be irrational. This research suggests a high-road model may be the rational business choice.
Overall, J.B. Hunt effectively traded the costs associated with a ‘low road’ low-cost labour regime for a ‘high road’ high-cost labour regime, and created value for itself. Indeed, during period one, the carrier weathered a sharp stock decline due to analysts’ scepticism regarding the likely success of the high-road strategy; these analysts were wrong, and the firm’s stock value more than recovered its losses during period two, validating executives’ belief that safety pays. During pay regime one, J.B. Hunt’s high turnover rates forced the company to pay a high cost in driver recruitment and training of inexperienced drivers, and the company paid the high cost from frequent and more severe crashes. Originally, Hunt had offset these high costs by paying long-distance drivers a low wage. In pay regime two, Hunt significantly reduced recruitment and training costs, had fewer and less severe crashes, and reduced casualty costs while improving performance. J.B. Hunt successfully traded the high costs of hiring in the cost minimisation framework in favour of higher wages and better conditions for drivers. Indeed, safety paid real dividends.
The actual costs of crashes can be much higher than the average costs and can easily exceed the regulated minimum liability of USD750,000, leading to catastrophic cost both to the trucker and the public. The firm studied here is no exception; several incidents occurred during the observation period that exceeded the current regulated minimum liability. If the marginal carrier is pricing its freight rates based on an insurance level that does not adequately price its potential risk, freight rates will be subsidised by the public – priced below total social cost, distorting the competitive market. When crash costs exceed the regulatory required insurance level, much of the cost of crashes will be borne by other road users – as an externality leading to inefficiently low freight rates and dangerous safety risks.
If the FMCSA increases the minimum required liability level for an insurance policy to more accurately reflect the cost of crashes to eliminate the external cost imposed on society, insurance costs will certainly increase and prices will increase accordingly, potentially clearing the market. This research suggests that hiring quality drivers will reduce the quantity and severity of crashes, increase driver retention, lower firms’ overall costs and allow freight rates to reflect the true cost of carrying freight while increasing carrier and driver productivity.
Conclusion
Overall, three important findings stand out. First, the probability of retention, especially for the experienced-at-hire drivers, greatly influenced the estimated expected firm revenues of both driver types. Second, the severity of a crash, measured by the average crash cost, in conjunction with the probability of incurring a crash, significantly influenced the estimated expected costs, especially for the inexperienced-at-hire drivers during pay regime one, who experienced more frequent and more costly crashes. Finally, as inexperienced-at-hire drivers gain experience, their crash probabilities begin to mirror the lower crash probabilities of experienced-at-hire drivers. As a result of increased tenure and the decreased probability of a crash, we would anticipate that the expected driver costs would also decrease. As the number of crashes decline, the expected costs fall, the expected net present value (E (NPV)) would increase, thereby creating value for the firm and eliminating the potential that crash costs would be imposed on society as an externality, as well as a potential reduction in liability insurance costs for motor carriers. In sum, not only does higher compensation influence safety in a positive way, but safety pays.
Funding
This research was self-funded as part of the academic mission of Wayne State University.


