Policy Significance Statement
The article evaluates the comparative performance of the cities in terms of urban logistics using the data envelopment analysis methodology. The analysis is based on the production frontiers. The results provide insights for governments to formulate policies for managing urban freight flow, truck traffic, and land use. These policies are derived by benchmarking against cities closer to the production frontier and consequently more efficient.
1. Introduction
In Latin America and the Caribbean (LAC), several cities are experiencing massive population growth alongside chaotic traffic congestion. São Paulo, Mexico City, Buenos Aires, Rio de Janeiro, Lima, and Bogotá are among these cities. Furthermore, countries such as Argentina, Brazil, Chile, Colombia, Costa Rica, and Mexico are witnessing the emergence of a large group of smaller retailers or nano stores, outside metropolitan regions (Boulaksil and Belkora, Reference Boulaksil and Belkora2017). These establishments cater to a significant portion of fast-moving consumer goods to a large part of consumers in a low-income segment (D’Andrea et al., Reference D’Andrea, Lopez‐Aleman and Stengel2006) across central and peripheral areas. These aspects, coupled with governmental regulations for trucks, expanding population, and the increasing traffic congestion, have exacerbated the complexity of urban logistics.
Inefficient urban logistics can directly and negatively impact both the quality of life for the population and the local economy. The concentration of cargo vehicles can lead to negative externalities such as congestion, traffic accidents, and pollution (de Vasconcellos, Reference De Vasconcellos2005).
In this context, several indicators play a crucial role in achieving efficient urban logistics, including travel time, cargo fleet size, GDP Gross Domestic Product, population density, and presence of local businesses. In addition, the urban infrastructure and morphology of the cities (Oliveira et al., Reference Oliveira, Garcia and Góes Pinto2020), congestion levels (Laranjeiro et al., Reference Laranjeiro, Merchán, Godoy, Giannotti, Yoshizaki, Winkenbach and Cunha2019), traffic regulations (Dias et al., Reference Dias, Sobanski, Silva, Oliveira and Vieira2018), and population culture (Lewis, Reference Lewis2019) are also influential factors. Some studies in Latin America examined the impact of urban freight transport and logistics efficiency through microlevel analysis (Vieira et al., Reference Vieira, Fransoo and Carvalho2015) and focused on specific solutions for logistics challenges faced by the companies (Oliveira et al., Reference Oliveira, Oliveira and Correia2014, Reference Oliveira, Barraza, Bertocini, Isler, Pires, Madalon, Lima, Viera, Meira, Bracarense, Oliveira, Ferreira and Bandeira2018; Santos Junior and Oliveira, Reference Santos Junior and Oliveira2020); however, a microanalysis considering city characteristics or efficiency comparisons between attributes affecting urban logistics remains absent. Therefore, a broader analysis is warranted to assess the efficiency of urban logistics in cities.
This research aims to evaluate and compare the logistics efficiency of diverse cities using readily accessible data. The data include parameters such as population size, GDP Gross Domestic Product, urban area, number of commercial establishments, and parameters related to the flow of goods, including cargo fleet size and the average time of displacement. Analyzing these attributes can provide insights on prospective public policies for these and other medium- and large-sized cities. The study employs the DEA methodology assessing and applying it to selected cities based using publicly available data, resulting in a multivariate analysis.
The scientific contribution of this work lies in the development of a methodology for conducting preliminary assessments of cities within a country or a region, with data that are easily obtained from public institutions’ websites or free-of-charge services. This methodology offers a preliminary performance evaluation of urban logistics without the need of surveys or independent studies. The methodology is a valuable tool for policymakers and traffic planners.
This paper is structured as follows: (i) a literature review focusing on performance measurement of urban logistics indicators and the DEA model; (ii) an exploration of the research question pursuing the understanding the urban logistics efficiency in cities, the methodology used to gather data from Brazilian cities, and the subsequent comparison; (iii) presentation of the results; (iv) a discussion regarding the significance of the model; and (v) conclusion.
2. Literature review
2.1. Performance measurement
Improving efficiency brings benefits to society and yield positive impact on regional income, business, and profitability (Clarke and Gourdin, Reference Clarke and Gourdin1991; Lidasan, Reference Lidasan2011). Each quantitative analysis is related to the need of assessing the adverse repercussions spanning various sectors—economic, social, political, or environmental—which are essential for the sustainability of economic activity in urban settings (Mei et al., Reference Mei, Lan and Xu2015; González-Feliu, Reference González-Feliu2018). Logistic efficiency, on the other hand, manifests when a region or company optimizes operations to minimize errors and uphold product and service quality (Zheng et al., Reference Zheng, Xu and Wang2020).
Even though, the urban logistics literature presents a range of indicators to measure performance (Pina and Torres, Reference Pina and Torres2001; Mei et al., Reference Mei, Lan and Xu2015; Vieira et al., Reference Vieira, Fransoo and Carvalho2015; Giret et al., Reference Giret, Julián, Corchado, Fernández, Salido and Tang2018), they are often not included in proposed frameworks due to data limitation. In certain instances, these indicators are confined to specific initiatives or projects as microlevel measures, which allows them to evaluate efficiency from an external context toward an internal context of the region or sector (Van Wee, Reference Van Wee2016).
On a macroscale, scholars have been exploring diverse methods to measure logistics efficiency as the gravity model (Martí et al., Reference Martí, Puertas and García2014), the grey relational analysis model (Li and Xiao, Reference Li and Xiao2013), and the DEA (Liu et al, Reference Liu, Lu, Lu and Lin2013; Cao, Reference Cao2018). DEA, in particular, has been employed to assess logistics performance at regional, municipal, and specific supply chain levels. It encompasses indicators linked to service quality, societal values, operations management, pollutant emissions, and road systems, spanning economic, environmental, and infrastructural dimensions. Comparing these indicators across organizations, cities, or regions poses a challenge; variations in data collection methodologies based on circumstances or researchers might impede valid comparisons over time (Chow et al., Reference Chow, Heaver and Henriksson1994). Nonetheless, the practice of assessing logistics efficiency across cities remains valuable as such efforts can unveil constraints that inform public policies related to urban freight transport planning in cities.
2.2 Efficiency measurement—DEA model
The DEA model was initially proposed by Charnes et al. (1978) as a tool for assessing the relative efficiency of similar system of economic production, by assigning decision-making units (DMUs) within economic production systems. The DEA employs a mathematical programming approach to quantify the effectiveness of DMUs in various contexts, such as urban evaluation (Gerdessen and Pascucci, Reference Gerdessen and Pascucci2013), analysis of businesses and firms (Kaffash et al., Reference Kaffash, Azizi, Huang and Zhu2020), and innovation assessments (Bertoni and Croce, Reference Bertoni and Croce2011). It is particularly valuable for aiding decisions related to administration, finance, logistics, and production management. Adolphson et al. (1991) suggest a broader application of DEA extending its application to the comparison of homogeneous units in multiple dimensions; and Charnes et al. (Reference Charnes, Cooper and Li1989) pointed out that since a city is a complex input–output system, the DEA model is suitable for evaluating urban efficiency.
The DEA method has been utilized to assess agricultural system sustainability by considering economic, social, and environmental indicators across 252 European agricultural regions. This approach enables an analysis of action disparities within EU Member States which is crucial for evaluating sustainability (Gerdessen and Pascucci, Reference Gerdessen and Pascucci2013). Another study employs the urban logistics assessment to compare the efficiency of LAC cities (Fioravanti et al., Reference Fioravanti, Montoya, Isa, Pinto and Fontes Lima2023). This comparative analysis of urban logistics performance offers insights for further examination of specific cities or variables, elucidating their proximity to or deviation from the efficiency frontier.
The DEA model incorporates various inputs (resources or production factors) and outputs (products) (Carvalho, 2010). A DMU’s efficiency is defined as the ratio between its productivity and the productivity of the most efficient DMU (Figueiredo et al, 2009). The DEA is categorized into two models: the constant return to scale (Charnes, Cooper, and Rhodes—CCR) and the variable return to scale (Banker, Charnes, and Cooper—BCC) as proposed by Banker et al. (1984) and is described by the following notation:
where i represents the number of input indicators and r represents the number of outputs indicators. Based on formulas (1) and (2), the model proposed by Charnes, Cooper, and Rhodes is established by the following equation:
Outputs:
![]() $ \max {h}_0={\sum \limits}_{r=1}^s{u}_r{y}_{rj.} $
$ \max {h}_0={\sum \limits}_{r=1}^s{u}_r{y}_{rj.} $
Subject to:
Inputs:
![]() $ {\sum \limits}_{i=1}^m{v}_i{x}_{ij}=1 $
$ {\sum \limits}_{i=1}^m{v}_i{x}_{ij}=1 $
 $$ \sum \limits_{r=1}^s{u}_r{y}_{rj}-\sum \limits_{i=1}^m{v}_i{x}_{ij}\le 0\hskip0.35em j=1,\dots .,n $$
where:
-
•
 $ {x}_{ij} $
= Amount of the ith input entering the jth DMU.
 -
•
 $ {y}_{rj} $
= Quantity of the rth product that comes out of the jth DMU.
 -
•
 $ {x}_{ij} $
and
 $ {y}_{rj} $
are the known parameters.
 -
•
 $ {u}_r $
= Weight of the rth product coming out of the jth DMU.
 -
•
 $ {v}_i $
= Weight of the ith input entering the jth DMU.
Thus, relative efficiency in DEA is represented for each (DMU) and by the ratio between the weighted sum of the vector components (outputs of a system) and the weighted sum of the vector components (inputs of a system) used in the process of production. In mathematical programming, it is defined as the following equation:
For DMU0:
![]() $ {\mathrm{Efficiency}}_0=\frac{\sum_r{u}_r{y}_{r0}}{\sum_r{v}_i{x}_{i0}} $
$ {\mathrm{Efficiency}}_0=\frac{\sum_r{u}_r{y}_{r0}}{\sum_r{v}_i{x}_{i0}} $
3. Methodology
The methodology applied is based on the model of Paiva (Reference Paiva Junior2000), which consists of seven phases presented in Figure 1.
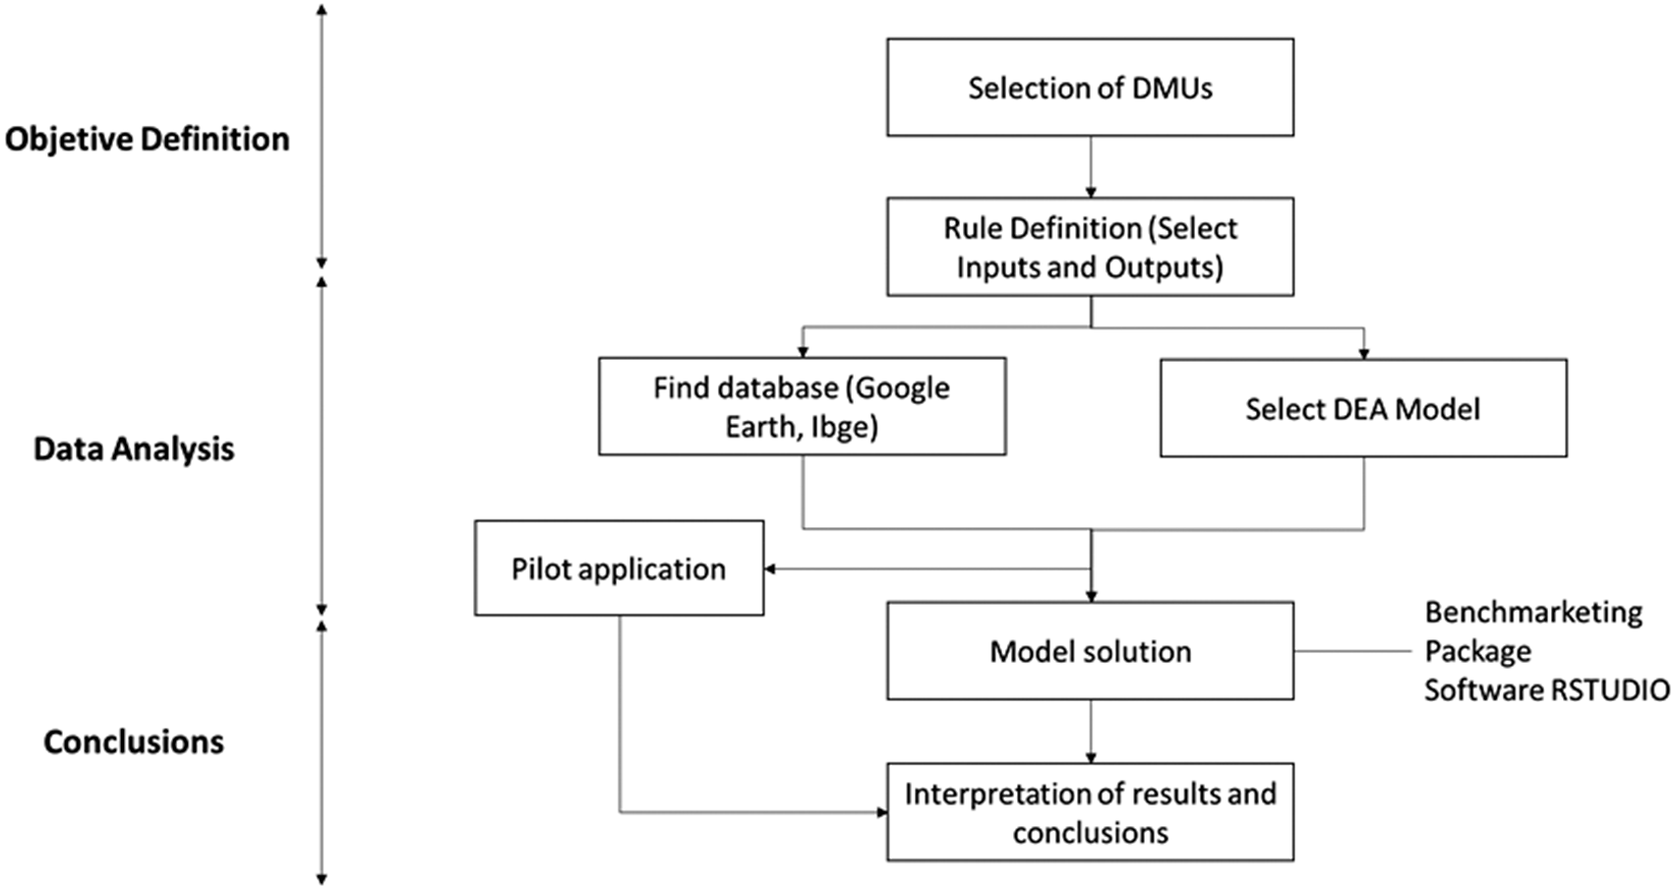
Figure 1. Methodology.
Objective definitions: The selection of the DMUs to be analyzed was based on three criteria: homogeneity, size of the benchmarking group and the constraints that define a DMU. The 12 cities studied were São Paulo, Rio de Janeiro, Curitiba, Guarulhos, Salvador, Campo Grande, Teresina, Santos, Recife, Fortaleza, Porto Alegre, and Campinas.
Data analysis and conclusion: Definition of the role and purpose of DMUs in the application to choose or formulate performance indicators for identifying relevant variables to monitor and control. Selecting the variables to be analyzed must start from a list of quantitative, qualitative, controllable, or noncontrollable factors that show the production relationships of a set of DMUs.
Considering the complexity of activities and stakeholders involved in urban logistics, it is challenging to compare cities in terms of their efficiency levels. Therefore, the main research question that motivates this work is: How efficiently is performing the urban logistics in selected Brazilian cities, vis a vis its peers in the same region? It is important to note that there are innumerable challenges in comparing cities with different geographical, socioeconomic, and cultural attributes.
The purpose of applying DEA is the examination of whether specific macrolevel data variables have the potential to identify the most efficient cities among a designated cluster of cities within a specific region. In a previous study, the focus was on the LAC region, a developing region with very different topography, sizes, urban concentration, and regulatory framework governing cargo transportation (Fioravanti et al., Reference Fioravanti, Montoya, Isa, Pinto and Fontes Lima2023). After analyzing the large cities of the LAC region in the work of Fioravanti et al. (Reference Fioravanti, Montoya, Isa, Pinto and Fontes Lima2023), this study focuses on analyzing 12 specific Brazilian cities, namely São Paulo, Rio de Janeiro, Curitiba, Guarulhos, Salvador, Campo Grande, Teresina, Santos, Recife, Fortaleza, Porto Alegre, and Campinas.
In the design of the DEA, the first phase involves the definition of the role and purpose of DMUs, coupled with the selection of performance indicators, as well as the identification of relevant variables to monitor and control.
This study revolves around the central concept of efficiency, which is divided into two main approaches: input-oriented and output-oriented models. The first approach aims to minimize inputs while staying within the limits of what is achievable. On the other hand, the second approach aims to maximize outputs while staying within the same limits of inputs.
The choice of the cities was based on some factors that can influence the cargo movement within urban areas, for instance, population density, industrial and commercial activities, presence of airports/ports, and historical and urban centers with restrictions to cargo circulation.
The variables were chosen based on data availability, relevance, and accessibility in public databases. The final selected variables were grouped into three main categories: socioeconomic (including GDP, population size, and the number of commercial establishments); operational (cargo fleet size from national records) and average travel time in the city center); and spatial (urban area size within city limits).
The selection of the DMUs was based on three criteria: homogeneity, the size of the benchmarking group and the constraints that define a DMU. Data analysis and conclusion: this phase involved defining the roles and objectives of DMUs, selecting or designing performance indicators to identify relevant variables for monitoring and control).
The RStudio’s Benchmarking data package, developed by Bogetoft and Otto (Reference Bogetoft and Otto2020), was used for the statistical analysis of the different efficiency measures. The package generates database rules, deriving association rules based on data mining for each factor analyzed. The package applies the methods of limit analysis. Different efficiency measures were formulated under varied technological assumptions (fdh, vrs, drs, crs, irs, add/frh, and fdh+), spanning input-based, output-based, hyperbolic graph, additive efficiency, super and directional approaches. Additionally, the package provides graphical representation of technology sets and it is suitable to solve standard models and many other variants. Finally, the data were analyzed, and conclusions were drawn.
4. Application development
4.1. DEA BBC—Input oriented
The first model used was the input-oriented DEA, where the input variables were GDP, urban area, commercial establishments, number of jobs, and business revenue (Table 2). In the input-oriented model, for the units to be located on the border, it is necessary to minimize the value of the inputs to achieve maximum levels of efficiency, while the value of variables representing the results or outputs, namely travel time, cargo fleet, transport, and logistics companies, remain constant.
Table 1. Descriptions to quantitative variables

Table 2. Data Brazil cities based 2021

Note. Data referring to Brazil were extracted from the IBGE, only referring to the year 2021.
The results obtained from the efficiency levels in Brazilian cities based on the model described above are depicted in Table 3:
Table 3. Summary relative efficiency
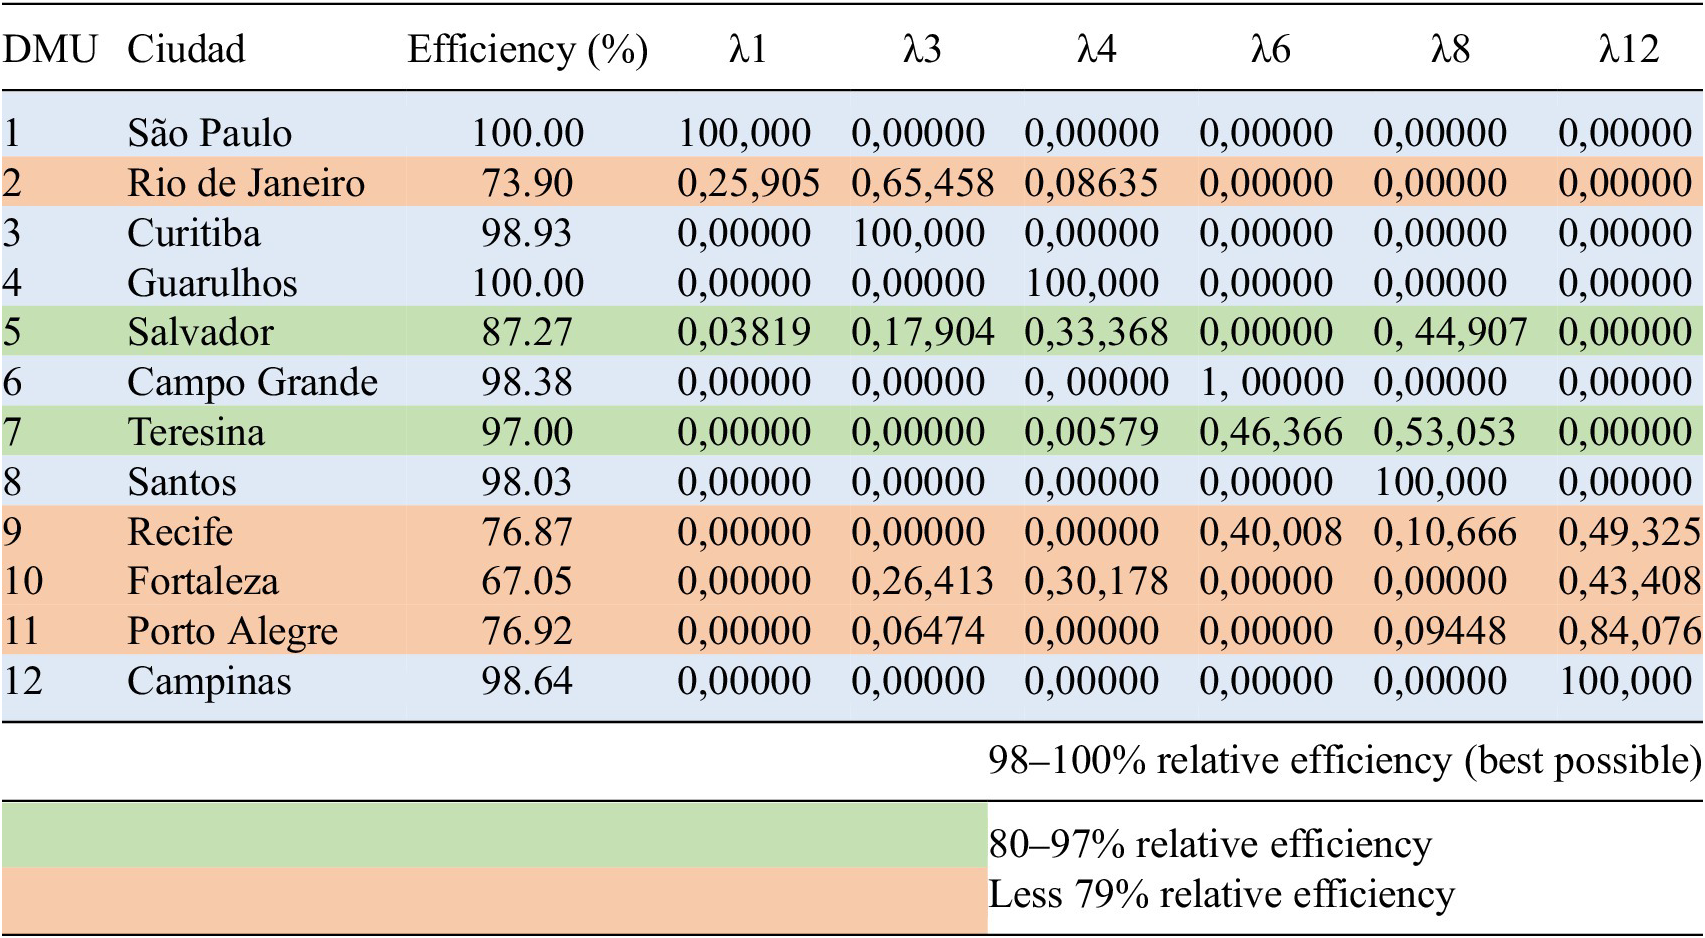
In an input-based DEA model, the lambdas depicted in Table 3 represent the weights assigned to each DMU to achieve efficiency. These weights indicate the proportion of each DMU’s input that contributes to the efficiency score.
From Table 3, it can be noted that most Brazilian cities approach the upper limit of relative efficiency, with many scorings above 80%. Rio de Janeiro stands out with a relatively lower efficiency of 73.9%. To achieve 100% efficiency, Rio de Janeiro could benchmark operational strategies from cities such as São Paulo, Curitiba, and Guarulhos (λ > 0). Similarly, Recife exhibits an efficiency of 76.87% and could aim for 100% efficiency using DMUs like Campo Grande, Santos, and Campinas as benchmarks. Fortaleza, at 67.05% efficiency, can consider Curitiba, Guarulhos, and Campinas as its reference points. Additionally, Porto Alegre’s efficiency of 76.92% aligns with the references of Curitiba, Santos, and Campinas. Salvador, with 87.27%, could reference São Paulo, Curitiba, Guarulhos, Santos, and Campinas and Teresina, with a high level of efficiency of 97%, can have Guarulhos, Campo Grande, and Santos as references.
Furthermore, Campinas proves to be a pivotal reference for Recife (λ = 0.4932511), Fortaleza (λ = 0.4340841), and Porto Alegre (λ = 0.8407669), underscoring its significance as an exemplar of efficient cargo transportation.
As a result of the DEA application and for a more homogenous interpretation of the results, the model group cities in four clusters (Figure 2). Generally, cities with higher GDP and population dominate the upper portion of the vertical axis due to their elevated production values. Conversely, medium and small cities cluster in the lower range of the chart, reflecting comparatively lower output values:

Figure 2. Relative efficiency—Input oriented.
4.2. DEA BBC—Output oriented
The first model used was the input-oriented DEA, where the input variables were GDP, urban area, commercial establishments, number of jobs, and business revenue. In the input-oriented model, for the units to be located on the border, it is necessary to minimize the value of the inputs to achieve maximum levels of efficiency, while the value of variables representing the results or outputs, namely travel time, cargo fleet, transport, and logistics companies, remain constant.
The second model used was the output-oriented DEA, where, given a level of inputs, the model seeks the maximum proportional increase in outputs while remaining within the production possibilities frontier. A unit cannot be considered efficient if any output can be increased without increasing or decreasing another output.
We use the same proposition and variables as in Section 4.1, and the results obtained from the efficiency levels in Brazilian cities are presented as follows:
From Table 4, in general, most Brazilian cities are close to the upper limit of relative efficiency, with the majority surpassing the mark of 97%. While Curitiba (78.8%) does not achieve full efficiency, it maintains a position above the lower threshold of 50%. To reach 100% efficiency, Curitiba’s target benchmarks include DMUs such as São Paulo, Rio de Janeiro, Fortaleza, Porto Alegre, and Campinas. Similarly, Guarulhos exhibits an efficiency of 75.34%. To realize perfect efficiency, Guarulhos can benchmark from DMUs like Rio de Janeiro, Teresina, Santos, and Fortaleza. Additionally, Campo Grande, with an efficiency of 76.38%, could align itself with Santos or Teresina to approach the frontier of efficiency.
Table 4. Summary relative efficiency

As a result of the DEA application, and for a more homogenous interpretation of the results, the model group cities in four clusters (Figure 3). Generally, cities with higher GDP and population dominate the upper portion of the vertical axis due to their elevated production values. Conversely, medium and small cities cluster in the lower range of the chart, reflecting comparatively lower output values:
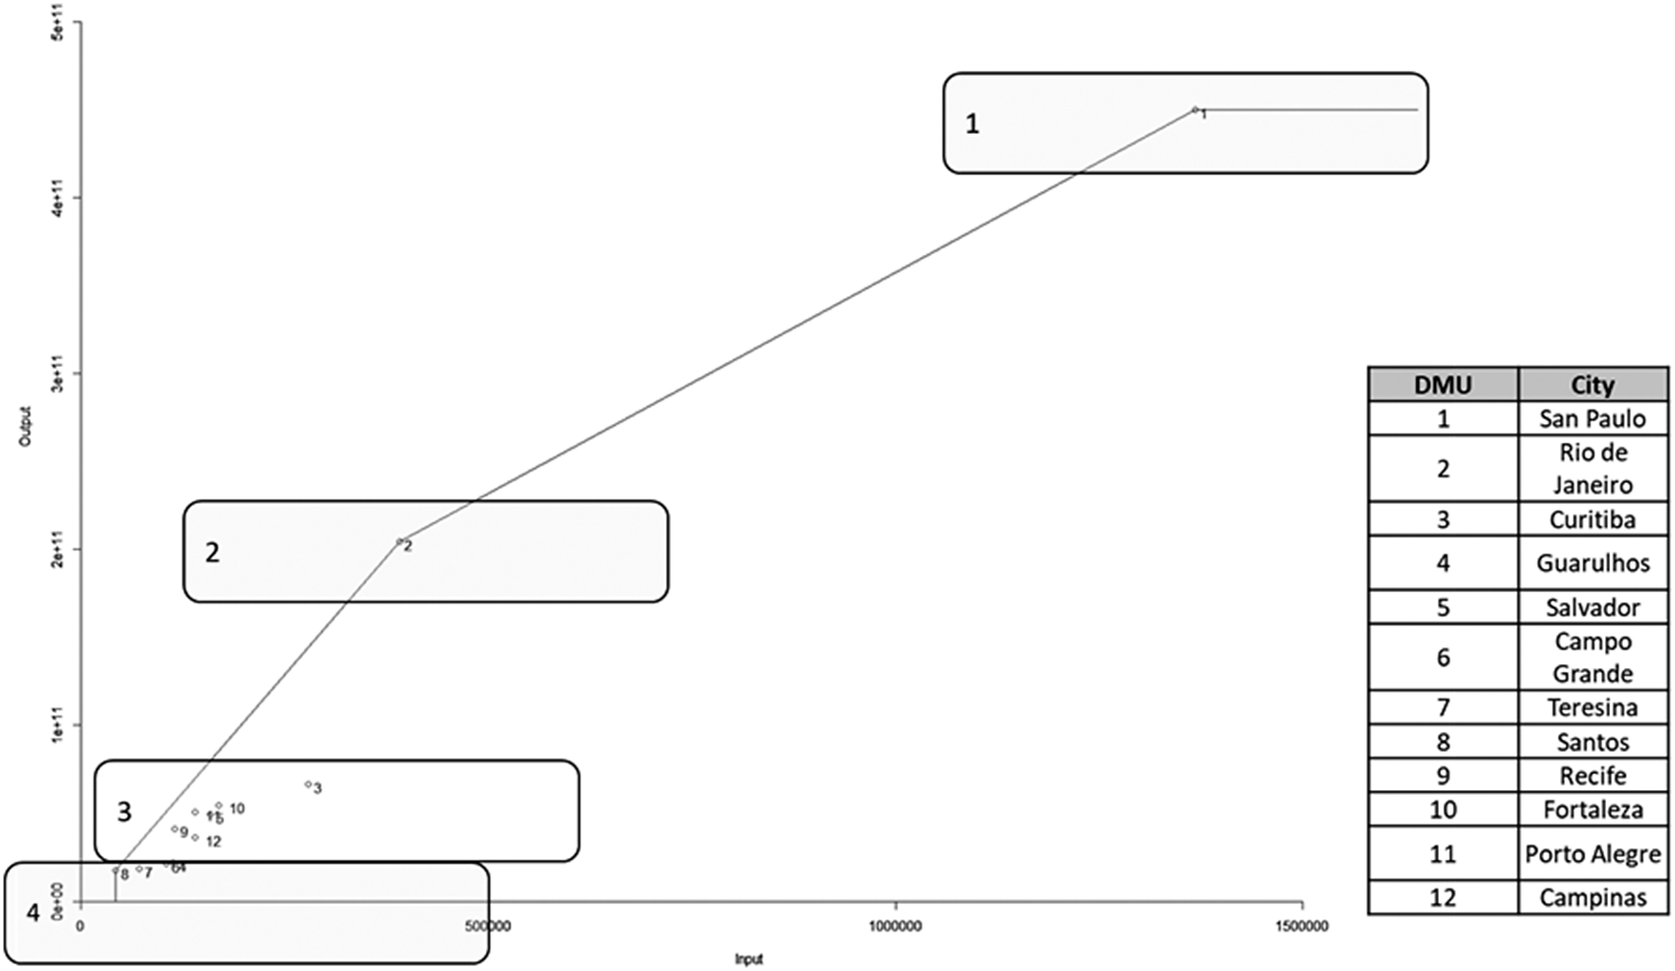
Figure 3. Relative efficiency—Output oriented.
5. Conclusions
This work’s main contribution is proposing a methodological strategy for comparative assessment of urban logistics in cities focused on the efficient use of resources. The data used are acquired on websites of public institutions or free services without conducting field surveys. This approach intends to inform future public policies, in areas such as land use, logistics infrastructure and services, and urban traffic management.
The DEA method proved its effectiveness as a tool for analyzing and classifying DMUs. In this case, specifically urban logistics performance in different Brazilian cities. The results demonstrated the feasibility of obtaining an overview of urban logistics among major cities.
The input-based model fits better to the problem of urban logistics, based at the economic unit level; it recognizes the freedom of action of those DMUs, as it should be in the currently selected regions. Productivity can be influenced by economic progress and the change in the logistics and transport efficiency indicator, which can act in opposite directions, cancelling one another or working in the same order, adding both. Suppose productivity is increasing mainly due to the movement up the frontier. In that case, logistical innovations will be taking place that increase the potential output generated by the economic production process of the sector.
The process was shown to be robust, quick to apply, and adaptable for personalized valuations, even for nonexperts in statistical and computational tools. The DEA methodology allows the use of multiple inputs and outputs, including macroeconomic indices that directly affect and help to characterize urban logistics. It also accommodates various units for measurement, allowing comparisons with best practice units to set goals for inefficient ones.
The application of the methodology relies on gathering necessary data, having access to it, and mastering its organization and processing. Once consistently handled with a clear goal, these data-driven decisions can support evidence-based policymaking. Even though, the method is of easy application, there are potential limitations in the case of gap of availability or quality of data. This can be enhanced by improving databases or conducting complementary surveys when feasible.
As future research, other aspects could be included in the DEA model either as input or output, for example, variables related to environmental sustainability or low carbon urban logistics and also variables related to the e-commerce as a relevant component of cargo generation in urban areas.
Supplementary material
The provided summary code was developed to conduct the analyses of Figures 2 and 3, applying the model described in Section 2.2. The supplementary material for this article can be found at https://doi.org/10.1017/S2632324923000408.
Funding statement
This research was supported by grants from the Inter-American Development Bank. The funder had no role in study design, data collection and analysis, decision to publish, or preparation of the manuscript.
Competing interest
The authors declare none.
Author contribution
Conceptualization: R.F., G.N.M.M., O.F.L.; Data curation: G.N.M.M.; Data visualization: G.N.M.M.; Methodology: G.N.M.M., O.F.L.; Writing original draft: R.F., O.F.L., J.A.P. All authors approved the final submitted draft.
Data availability statement
The data used were all obtained from freely accessible public databases in (Instituto Brasileño de Geografía y Estadística) at (https://cidades.ibge.gov.br/brasil/panorama), except for the calculation of the average travel time (Appendix A), which was estimated based on the levels of congestion in the cities at critical times. And finally, the transport cargo companies, logistic Companies, and others (Table 1). Data that support the findings of this study are available from (Empresaqui.com). Restrictions apply to the availability of these data, which were used under license for this study. Data are available (https://www.empresaqui.com.br/).
Appendix A
METHODOLOGY: CALCULATION OF AVERAGE TRAVEL TIME
Description of the methodology
-
1. Using Google Earth and with help from other internet pages, the points for each city were located. A location was chosen in the center of each city, which was established as the arrival point.
-
2. Four points (N, S, O, E) were created, within a radius of 5 km from the arrival point, using the ruler tool.
-
3. These points were located on Google maps, and their addresses were considered as departure points.
-
4. In Google maps, the minimum and maximum time between the starting point and the arrival point was calculated, for each of the starting locations (N, S, E, O) (Figure A.3).
-
5. The departure times 8, 9, and 10 am, on Wednesday November 21, 2018 were considered.
-
6. The final data called “average time travel” was found from the formula, (the data taken at 9 am.):
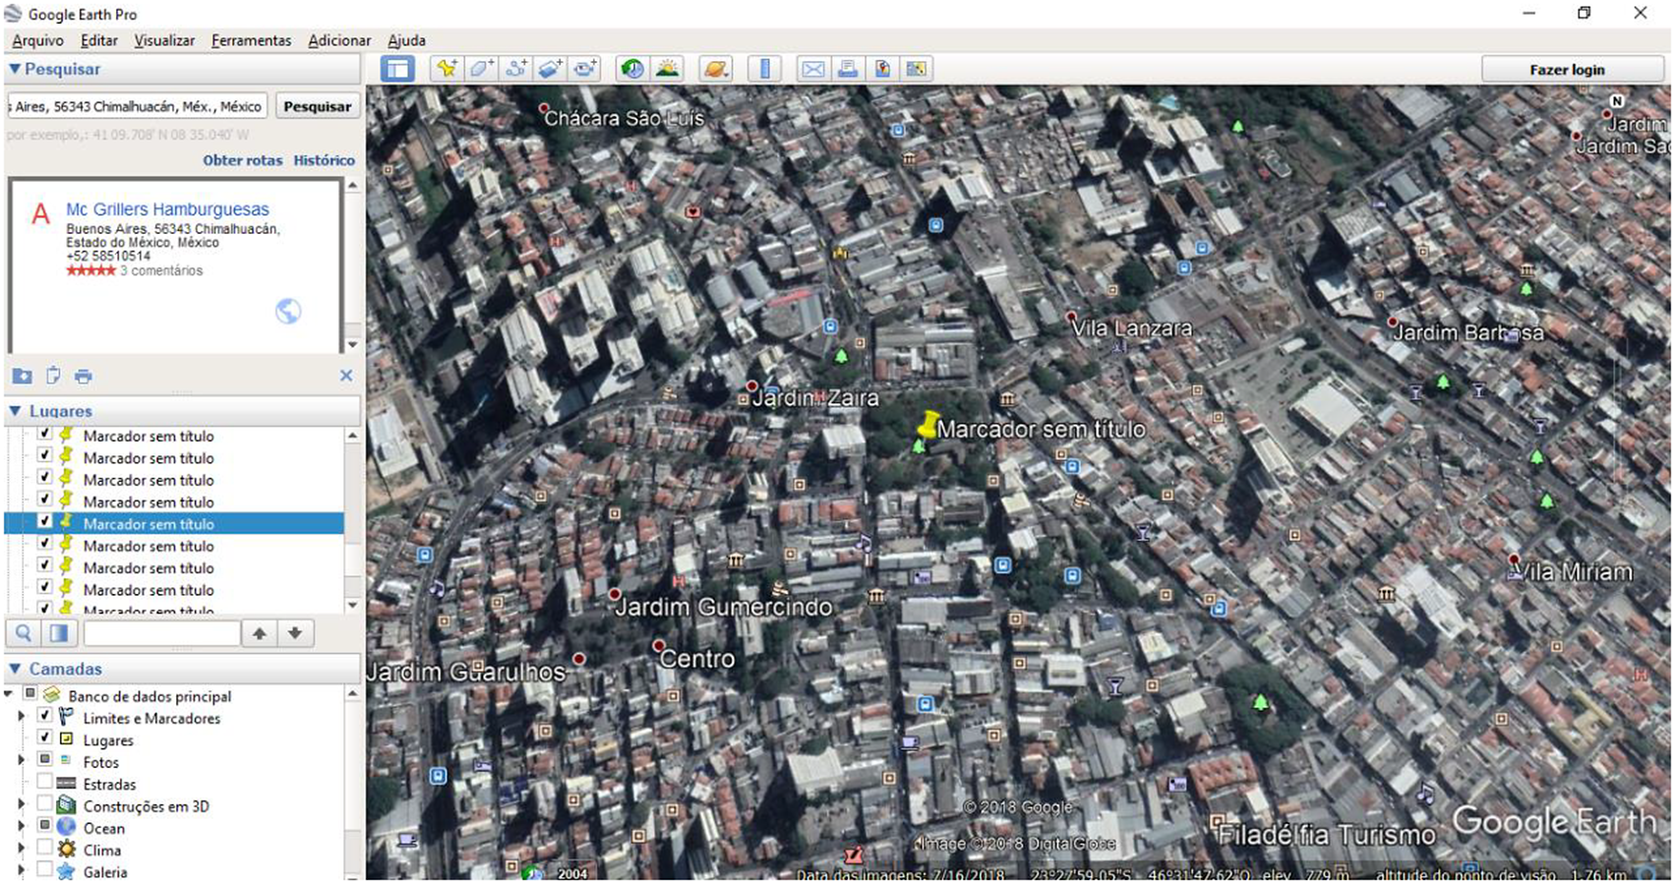
Figure A1. Example of arrival point (city center).
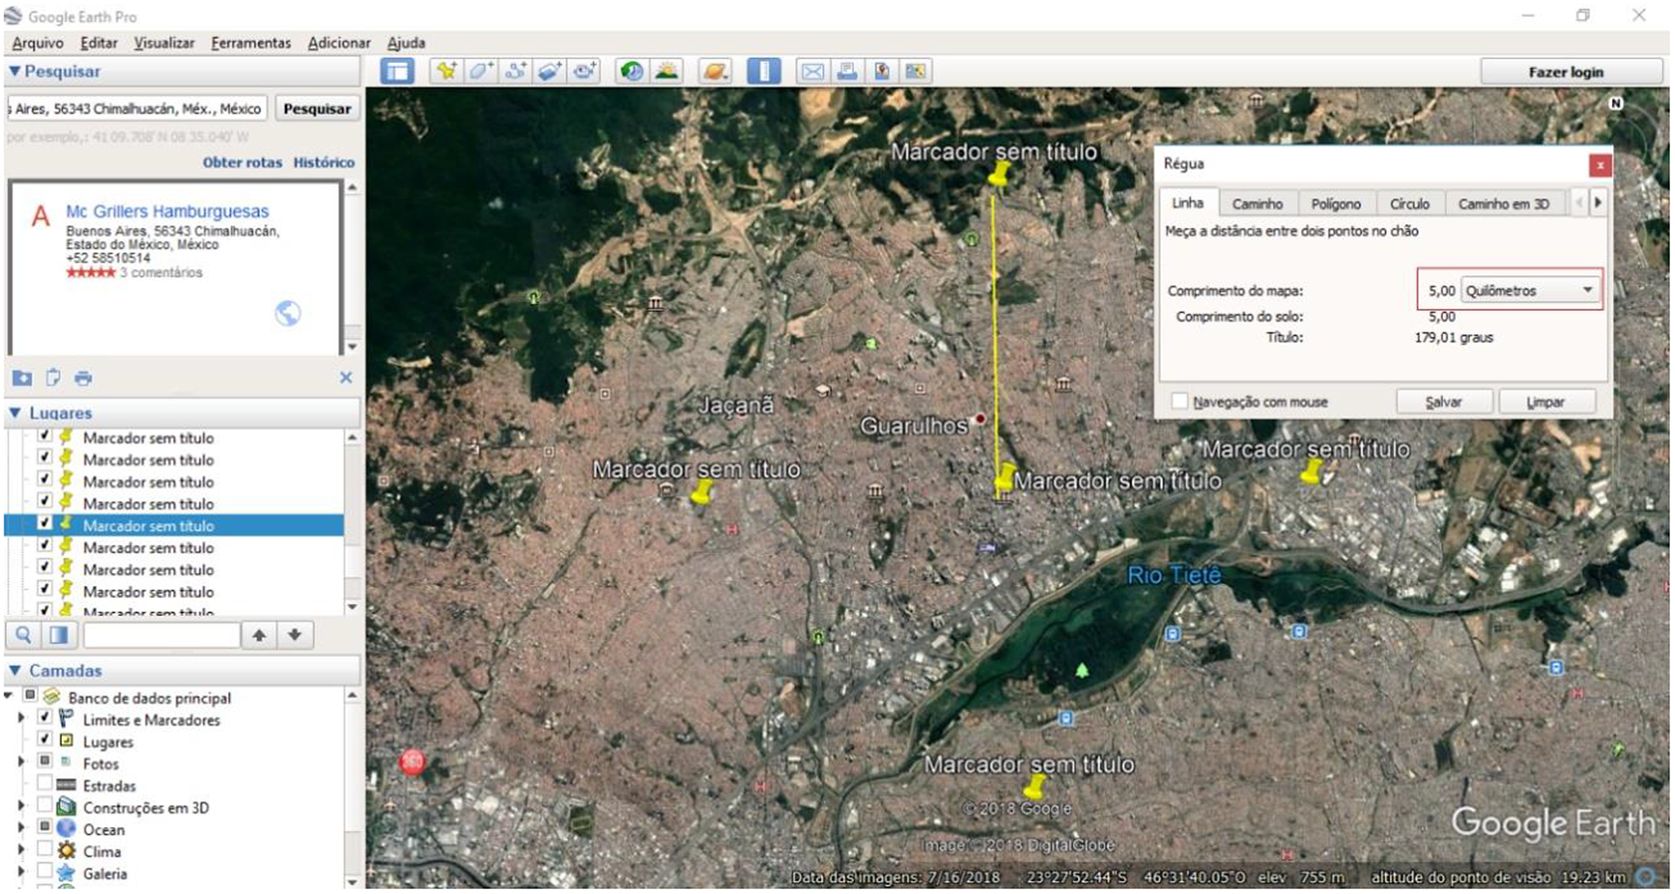
Figure A2. Example of origin points.
The formula was applied for all the starting locations and finally the total mean is applied.
where
![]() $ {\overset{\sim }{X}}_{tmin}= Average\ of\ minimum\ time\ of\ displacement $
$ {\overset{\sim }{X}}_{tmin}= Average\ of\ minimum\ time\ of\ displacement $

Figure A3. Example of arrival point (city center).


Comments
No Comments have been published for this article.