Introduction
Ice cores are well known for being one of the best archives of information on past climatic and environmental changes. One problem is that most high-resolution data available from the Northern Hemisphere are from the cold dry firn zone in interior Greenland; this biases the data in terms of the atmospheric circulation characteristics of this region. In order to obtain a more comprehensive view of the climatic and environmental change on a more global, or hemispherical, scale, we need data from other locations outside the large ice sheets.
Svalbard is positioned in a climatically interesting area and is vulnerable to temperature changes in the North Atlantic Current. Several ice cores have been drilled on Svalbard ice fields through the years (see next section). In general, the results from the earlier ice-core studies suggest major climatic trends similar to those recorded in other ice cores from the Arctic. However, many questions remain concerning the timing of events and shorter time-scale changes and determining how much of the original record has been altered by melting (Reference KoernerKoerner, 1997). Published data from a previous ice core on Lomonosovfonna drilled in 1976 (Fig. 1) indicated better-preserved stratigraphy than the other sites on Svalbard (Reference Gordiyenko, Kotlyakov, Punning and VaikmaeGordiyenko and others, 1981). Therefore we selected Lomonosovfonna as our coring site, with the aim of performing higher-resolution sampling than accomplished in previous studies of ice from this site.
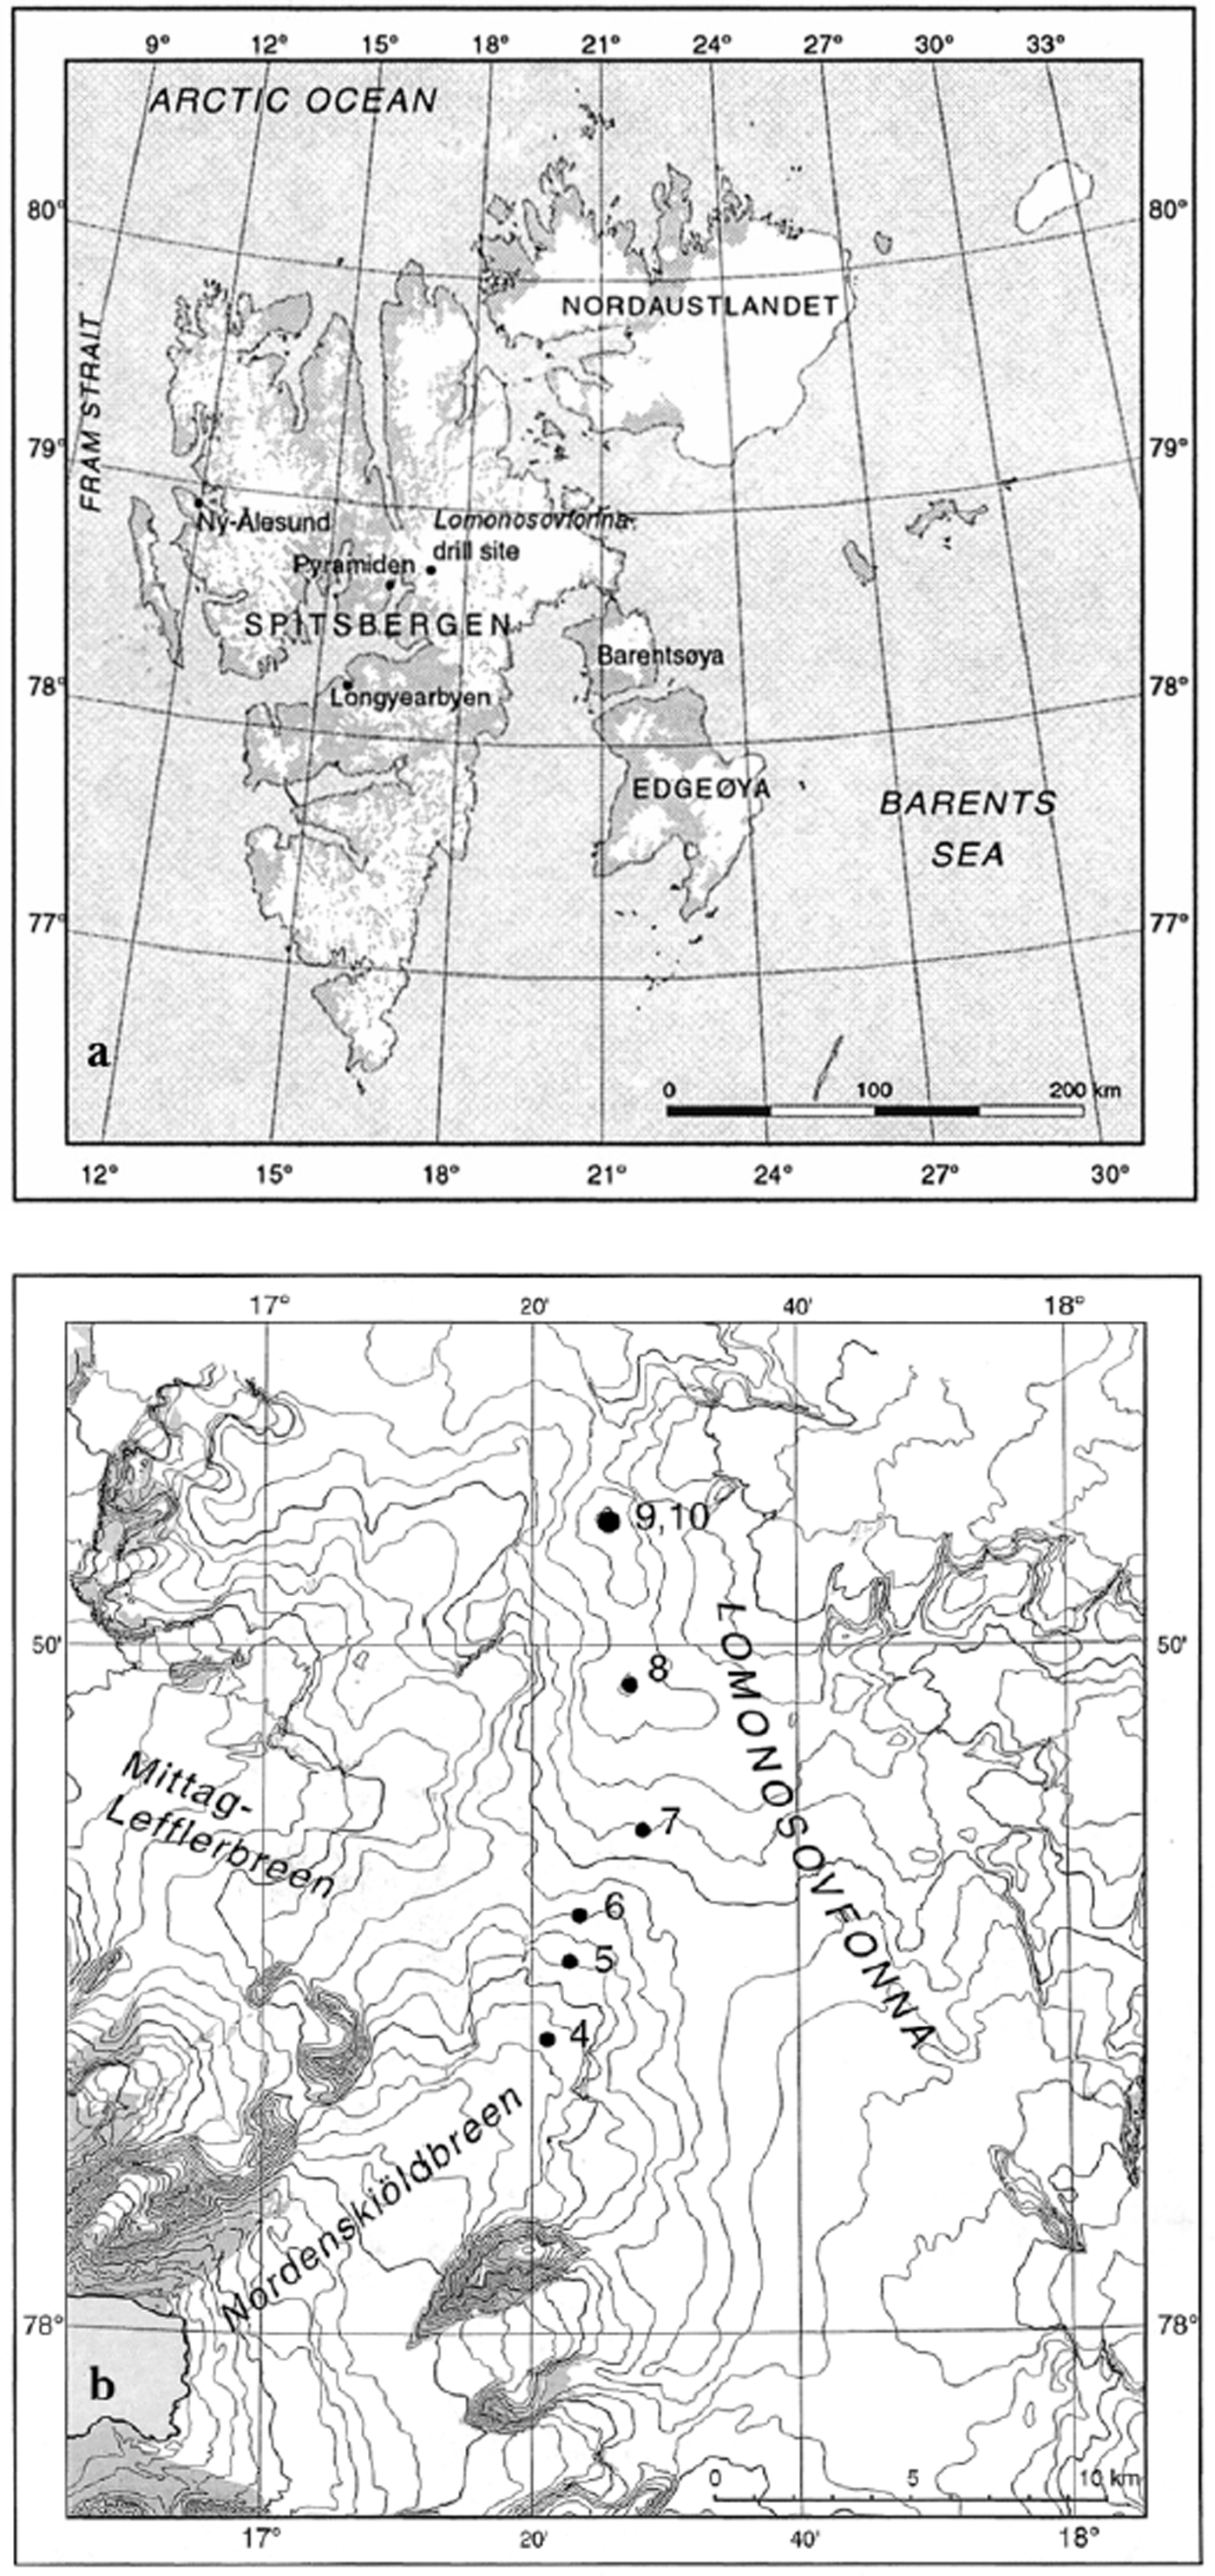
Fig. 1. (a) Map of Svalbard with the geographical names mentioned in the text, (b) Lomonosovfonna and Nordenskjöldbreen with the position of the deep core (10) and six shallow firn cores (4–9).
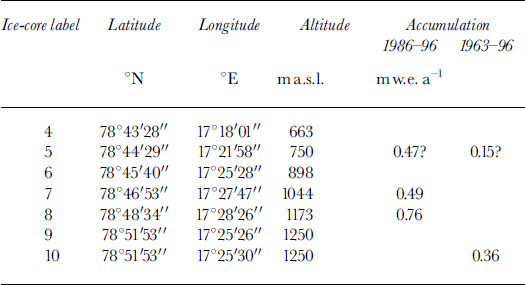
We retrieved a 121 m ice core at the summit (1250 m a.s.l.) and a number of shallow ice cores along Nordenskjöldbreen (Fig. 1; Table 1) in early May 1997. In this paper we present accumulation data from the shallow ice cores and data from ice-structural logging, and analyses of water isotopes, major ions and MSA (methanesulphonic acid) in the uppermost 36 m of the deep core, covering the time period between about 1920 and 1997. We discuss the potential for extracting high-resolution environmental and climatic data from this site by comparing the ice-core data to other climatic and environmental records from the area.
Table 1. Positions of all the the shallow ice cores drilled along Nordenskjöldbreen and the main ice core on Lomonosovfonna. The mean annual accumulation rates based on the depth of Chernobyl (1986) and major nuclear tests (1963) are included
Previous Ice-Core Studies in Svalbard
During the past three decades several ice cores have been drilled in Svalbard by groups from the former Soviet Union and Japan, but very few of these have been studied in detail. In many cases the dating is insufficient due to a combination of melting, coarse sampling and limited analyzed chemical species. The site information from these previous ice-core drillings is compiled in Table 2.
Table 2. A compilation of the previous ice-core drill sites in Svalbard
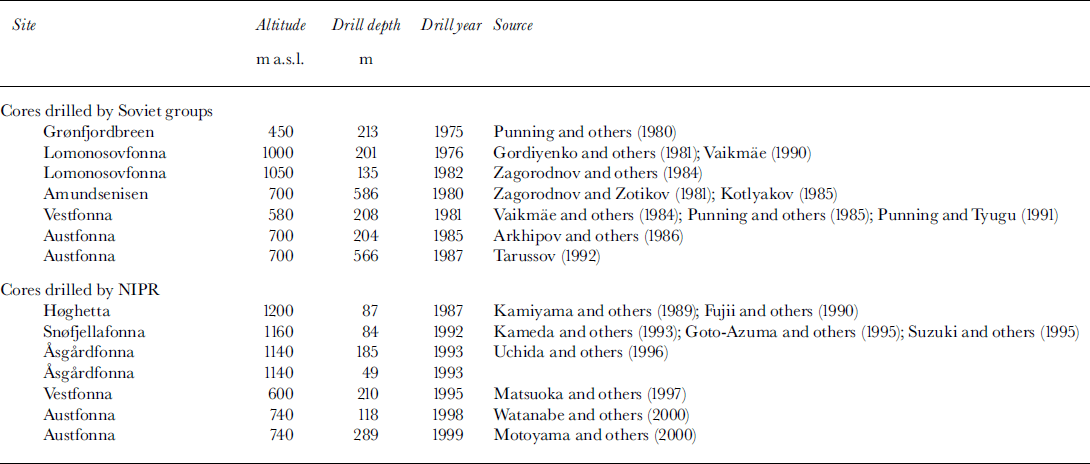
During the period 1974–87, Soviet groups drilled seven ice cores in Svalbard (Reference Tarussov, Bradley and JonesTarussov, 1992). Most of these cores were dated using the accumulation rate deduced from the depth of the 1961–63 radioactive layer. Dating and climatic interpretation of many of these ice-core records was very difficult due to extensive meltwater percolation (Reference KoernerKoerner, 1997).
Of all the ice cores drilled by Soviet expeditions, the core from Lomonosovfonna drilled in 1976 provided the best record, i.e. the one that was apparently least disturbed by meltwater percolation. The 200 m core at 1000 m a.s.l. on Lomonosovfonna provided a core with partly preserved seasonal stratigraphy in oxygen isotopes (Reference Gordiyenko, Kotlyakov, Punning and VaikmaeGordiyenko and others, 1981), and was dated back to the 12th century based on calculations of the accumulation rate during the last few decades. Some of the most important findings were that the climatic fluctuations were in agreement with those found in cores from Greenland and that the Svalbard climate seems to lag behind the temperature changes in Europe. The only ion chemistry done on the core was an analysis of chloride and sulphate (Vaikmae, 1990). A second core of 135 m was drilled in 1982 (Reference Zagorodnov, Samoylov, V Raykovskiy, Tarusov, Kuznetsov and SazonovZagorodnov and others, 1984), but only stratigraphic studies were performed on this core.
Since 1987, Japanese scientists have drilled seven medium-length ice cores in Svalbard (Reference WatanabeWatanabe, 1996), most of which have still to be analyzed and studied in detail. The most recent cores were drilled in cooperation with the Norwegian Polar Institute on Austfonna in 1998 (Reference Watanabe, Kamiyama, Kameda, Takahashi and IsakssonWatanabe and others, 2000) and in spring 1999 (Reference MotoyamaMotoyama and others, 2000). The last of these cores has been dated back to about AD 1200 and is providing a good-quality climatic and environmental record from this part of Svalbard.
Study area
General climate in Svalbard
The climate over the Svalbard archipelago is very mild, considering its northern position. A branch of the Gulf Stream, the Norwegian Current, brings warm water towards the west coast of Spitsbergen and into the Barents Sea. This makes it possible for open water on the southwest coast to occur even during winter.
The general large-scale atmospheric circulation is dominated by the low-pressure area over Iceland and the high-pressure area over Greenland and the Arctic Ocean. Mild air from lower latitudes is transported towards Svalbard with the prevailing westerly and southwesterly winds. However, in the northern part of the archipelago easterly and northeasterly winds dominate, and the climate in Svalbard is therefore characterized by variations in movement of these two extreme air masses. A characteristic feature of Svalbard is the high average temperature during winter (Reference HisdalHisdal, 1998). The easterly to southeasterly winds bring a significant contrbution of anthropogenic pollution, much of it originating in mid-latitudes (e.g. Reference Heintzenberg, Hansson and LanneforsHeintzenberg and others, 1981; Reference Semb, Brækkan and JorangerSemb and others, 1984; Reference StaeblerStaebler and others, 1999).
Temperature measurements in Svalbard started in 1911, and by combining several records from the vicinity of Longyearbyen at Isfjorden a continuous record has been created (Reference Nordli, Hanssen-Bauer and FørlandNordli and others, 1996). The most characteristic feature is the abrupt warming which occurred after a temperature minimum in 1917 and lasted until the late 1930s. Following a cooler period that culminated in the late 1960s there has been a significant recent increase in temperature, but Svalbard is still somewhat colder than it was in the 1930s (Fig. 2). No significant trend can be found during the period covered by instrumental records. During the same period, precipitation has increased by about 25%, probably as a result of changes in the atmospheric circulation (Farland and others, 1997).
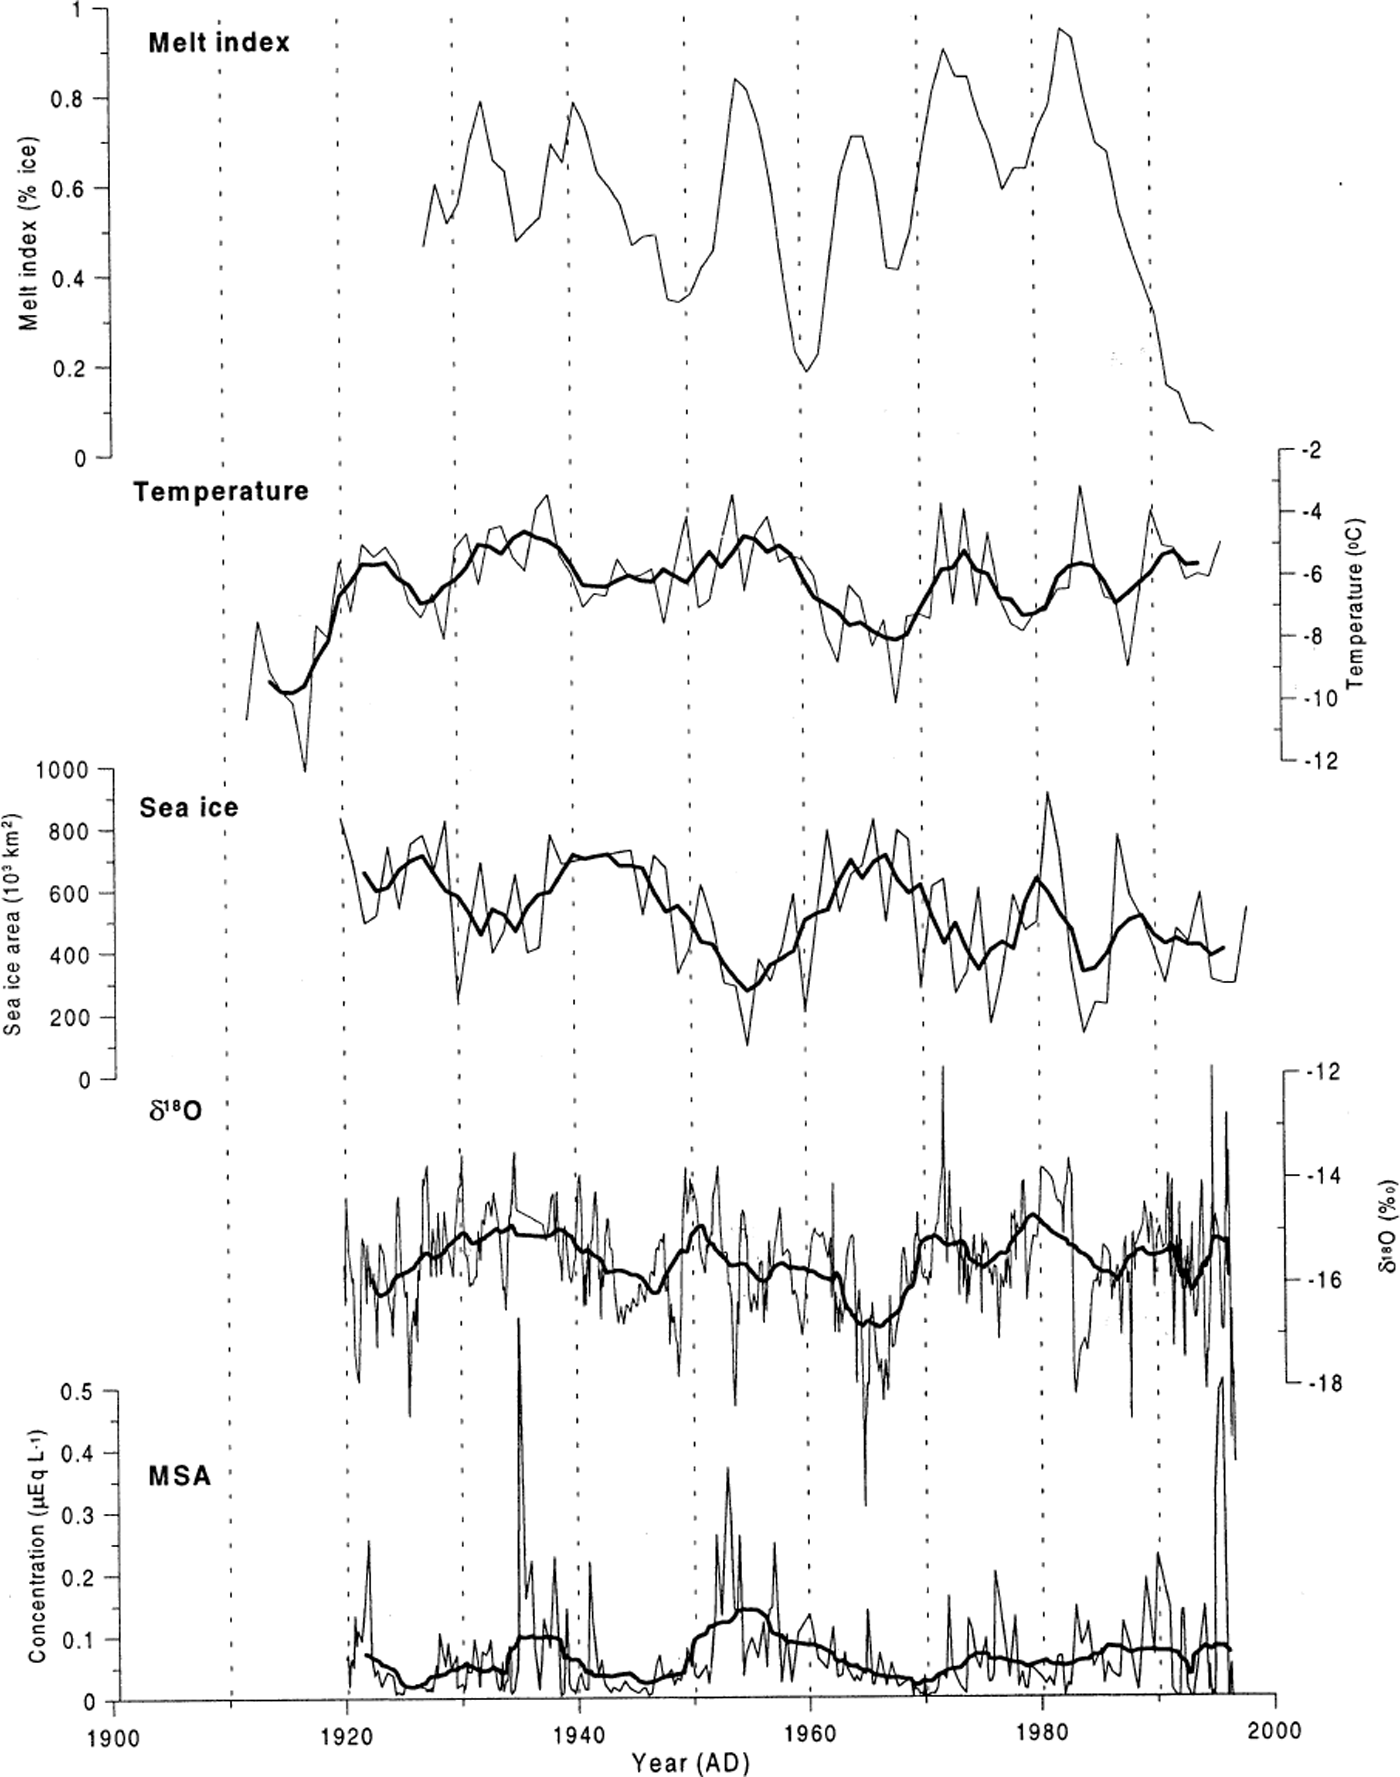
Fig. 2. The melt index, δ18O and MSA records from the ice core compared with Longyearbyen mean annual temperature record (data from Norwegian Meteorological Institute) and the sea-ice record from the Barents Sea (Vinje, 2001). The records have been smoothed using running mean equivalent to about 4 years.
Site description of Lomonosovfonna
Lomonosovfonna (Fig. 1) is one of the highest ice fields on Spitsbergen. The summit lies at 1250 m a.s.l., and has a pronounced cupola shape, with an approximate radius of 500 m. Radar measurements indicate a depth of 126.5 m at the summit, where the core was extracted. The ice field is drained through several glaciers that extend to sea level, Nordenskjöldbreen, Grusdievbreen and Mittag-Lefflerbreen being the major ones with widths/lengths around 5/20 km. Ice fluxes have not been determined in the area, but ice-velocity measurements at the centre line close to the equilibrium line on Nordenskjöldbreen suggest high fluxes with horizontal velocities of about 150 m a−1 during the years 1997–99 (J. Hedfors, unpublished information). The accumulation area of the Lomonosovfonna ice system is about 600 km2.
There are few direct air-temperature observations at the drill site. Observations by Soviet groups suggest that the top of Lomonosovfonna is in the cold-firn area, with only a few days per year in which temperatures exceed the freezing point during the melting season (Reference Gordiyenko, Kotlyakov, Punning and VaikmaeGordiyenko and others, 1981). Temperature measurements from the borehole at the summit show that the ice is a few °C below the melting point, and that the temperature history in the borehole follows the measured temperature trend in nearby sea-level stations (R. van de Wal and others, unpublished information).
Lomonosovfonna lies not far from the coalmine village Pyramiden (Fig. 1), 35 km from the drill site (in operation between 1947 and 1998), and Longyearbyen (Fig. 1), 100 km from the drill site (in operation since 1911).
Drilling and Analytical Methods
The summit ice core was drilled using an electromechanical drill (diameter 105 mm) from the Institute for Marine and Atmospheric Research in Utrecht, The Netherlands. In total, 2.4 m of the core in the interval 0.65–36 m was lost during the drilling, with the core loss evenly distributed over this length. A Polar Ice Coring Office (PICO) drill with a diameter of 75 mm was used to drill shallow ice cores for accumulation studies (Fig. 1; Table 1). The cores were kept in insulated boxes and were transported with snowmobiles from the field site to freezer storage in Longyearbyen and from there via ship and truck to Stockholm University where the sub-sampling was done in a cold laboratory. During the whole transportation process the temperatures were kept below freezing.
In the cold laboratory the ice core was cut into 5 cm sections using a band-saw after visual inspection of the ice structures on the core face. In this work we have used a more simplified division of ice facies than that presented by Reference ShumskiiShumskii (1964) and Reference ZagorodnovZagorodnov (1981). The division of the different facies is based on a subjective, visual inspection of the bubble density through the core, giving a 5 mm vertical resolution of the structures. We have defined the ice structures in terms of the ratio of the volume of pores to the total volume of the sample, i.e. a measure of the density of the core section. Since the visually derived structural information is a function of density, this can be used to estimate the density distribution along the core.
For the chemical analyses the outer 2–2.5 cm parts of the ice (approximately 40% of volume) were removed by band-saw (rough cleaning) and stainless-steel knife (fine cleaning) inside a clean-air bench. The saw and knife blades were cleaned by repeatedly cutting Milli-Q (MQ) ice. The cleaned ice samples were placed in clean polyethylene (PE) bags after Sdividing the samples into several pieces for separate anion, cation and acidity measurement, or in cleaned PE bottles, for transportation in cold bags to Finland (Finnish Forest Research Institute). The samples were stored in cold rooms until they were analyzed. Face masks and PE gloves were used continuously during the sample preparation steps. To monitor the chemical contamination level of the sample-handling procedure, pure water, obtained from a MQ water purification system, was frozen in a PE measuring cylinder to make a MQ-ice core which was then handled in the same way as the sample cores.
For the δ 18O we used standard procedures for oxygen isotope preparations (Reference Epstein and MayedaEpstein and Mayeda, 1953). The CO2 is prepared and extracted on a fully automated system (Reference StahrenbergStahrenberg, 1985) attached to a Finnigan-MAT Delta-E mass spectrometer. Reproducibility of replicate analyses is generally better than ±0.1%. A total of 672 oxygen isotope samples were analyzed.
The deuterium analysis is based on the method originally described by Reference Bigeleisen, Perlman and ProsserBigeleisen and others (1952). A sample of 10 μL of water is quantitatively reduced to pure hydrogen gas on a hot uranium surface. To reduce memory effects, each sample is injected and reduced twice, and only the second aliquot is used. The hydrogen gas is analyzed for its deuterium content using a SIRA 9 dual inlet Isotope Ratio Mass Spectrometer. Corrections for H3+ and for cross-contamination (Reference Meijer, Neubert and VisserMeijer and others, 2000) have been applied. The deuterium scale of the mass spectrometer is calibrated with respect to Vienna Standard Mean Ocean Water and normalized using Standard Light Antarctic Precipitation (Reference CoplenCoplen, 1988), both on a frequent basis. The overall accuracy is estimated to be ±1.5%. One-third of this core interval (11.50 m) was analyzed with respect to δD, concentrated into three main intervals.
Water from 50 cm long ice-core samples was used for radioactivity measurements. The melted samples from the main core and the six shallow ice cores were filtered and analyzed using gamma-ray spectrometry (Reference PinglotPinglot and others, 1994; Reference Pinglot and PourchetPinglot and Pourchet, 1995) to find datum horizons.
Ion chromatography (IC) was used to measure major anions, cations and MSA. The IC method is described in detail elsewhere (Reference Jauhiainen, Moore, Peramaki, Derome and DeromeJauhiainen and others, 1999). Analyses of MQ-ice blanks indicated almost contamination-free sample-handling and analytical procedures. The low concentrations of species found from blanks were subtracted from the core sample results (Reference Jauhiainen, Moore, Peramaki, Derome and DeromeJauhiainen and others, 1999).
Acidity was measured using a sensitive pH meter with a narrow-head electrode after melting the samples in Ar atmosphere. The method was compared with the titration method developed by Reference Legrand, Aristarain and DelmasLegrand and others (1982), and an excellent linear relation between the methods was found.
Results
Accumulation gradient from shallow cores
In three of the shallow ice cores (5, 7 and 8) we found one clear 137Cs peak that we interpret as the Chernobyl event (1986) (Table 1). In the deep core (10) one horizon was found at 18.50–18.95 m, which is interpreted as the 1963 bomb-test marker (Reference PinglotPinglot and others, 1999). The shallow cores were not deep enough to reach the 1963 layer. The accumulation rates are 0.49 and 0.76 m w.e. a−1 in cores 7 and 8, respectively, during the period 1986–96 and 0.36 m w.e. a−1 for the summit during the period 1963–96 (Table 1). Reference Gordiyenko, Kotlyakov, Punning and VaikmaeGordiyenko and others (1981) estimated the accumulation rate in the area to be 0.82 m w.e. a−1 for the period 1963–76, measured on a core drilled about 1000 m a.s.l., close to our core 7 (Fig. 1).
The accumulation rates from the different sites vary by a factor of two. This may be a function of the temporal variations in snow accumulation, or due to wind scouring at the summit site and lee deposition downslope. The fact that the Chernobyl layer has not been detected for the ice cores from the summit of the ice dome is most likely due to the short duration of this event of about 1 week at Svalbard (Reference Pourchet, Pinglot, Reynaud and HoldsworthPourchet and others, 1988) and the possibility that surface conditions and wind scouring have removed the deposit. However, the total137 Cs deposition (from the nuclear tests, between 1954 and 1980) at the summit (260 Bq m−2) does not show a significantly lower value than the mean value (288 Bq m−2) from eight other ice cores from Svalbard. This indicates that the lower accumulation rate at the summit is most likely due to a local precipitation feature since strong wind scouring should have led to a much lower 137Cs deposition (Reference PinglotPinglot and others, 1999).
The records of melt index, δD, δ 18O and major ions
The distribution of the ice facies in the core shows that melt features occur along the core, thus providing evidence for summer melting (e.g. Reference Koerner and FisherKoerner and Fisher, 1990). If we assume that solid ice-layer facies are the result of warmer events, then the percentage of solid facies along the core will show how melting and refreezing processes have varied with time. The melt index was calculated as the percentage of ice (in water equivalent) made of solid ice and diffuse ice from the total water equivalent for each decade. The melt-index record is included in Figure 2.
The mean values of δD and δ 18O are presented in Table 3. The records show variations that may be interpreted as seasonal signals (Fig. 3), despite the fact that the original signal has probably been altered to give a post-depositional annual signal.
Table 3. Isotopes and mean ion concentrations from Lomonosovfonna at 0–36 m. The ion concentrations are in μeq L−1 δ18O and δD are in ‰

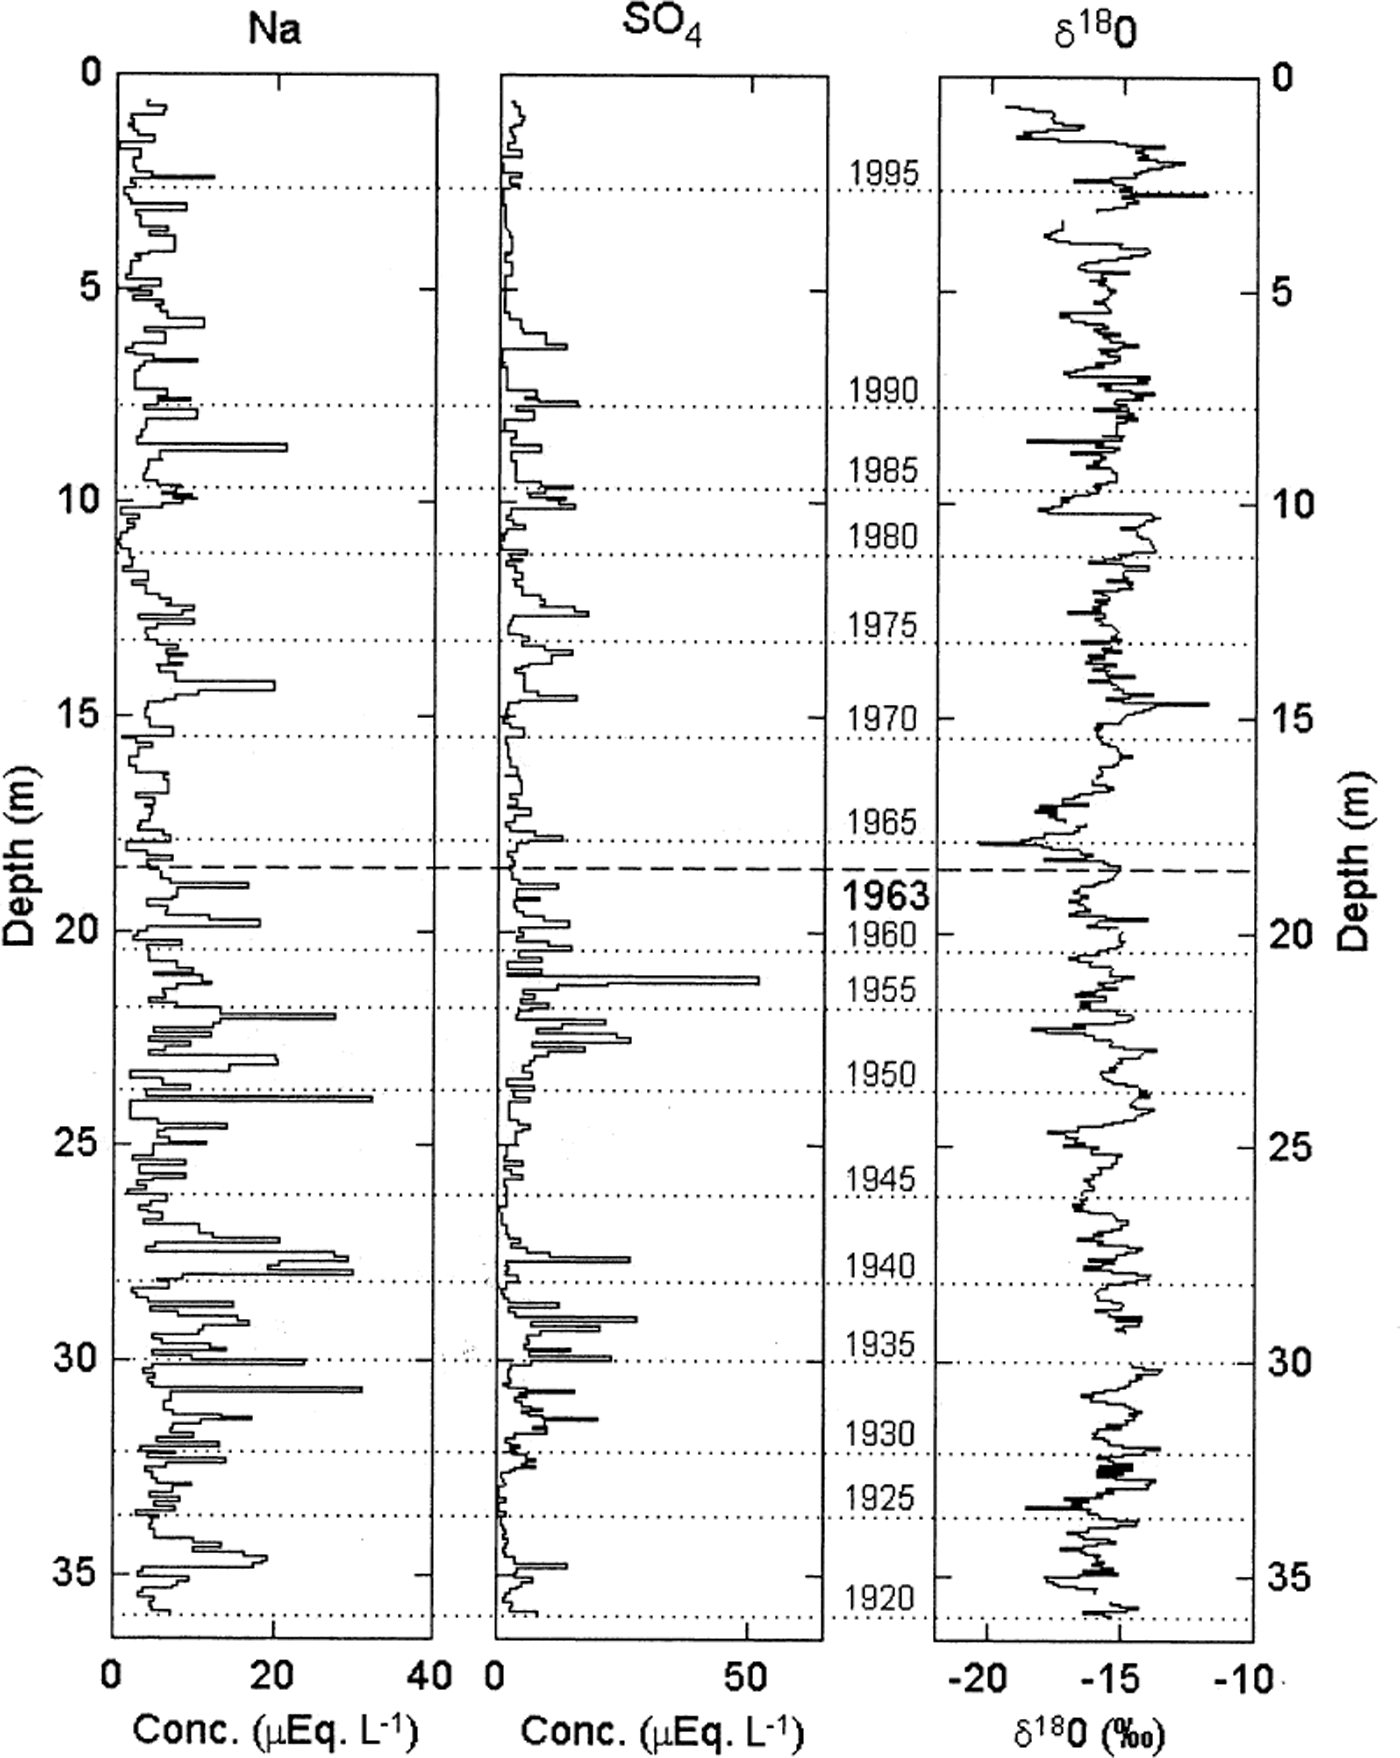
Fig. 3. Detailed section of the core showing the dating process. Dating was done counting layers based on the quasi-seasonal variations in Ma+ and SO4 2− using the radioactive layer from 1963 as a reference layer. The δ18O record is included for comparison.
Table 3 includes average concentrations of major ions and seems to contain all ions which influence the ion balance (e.g. Reference Legrand and MayewskiLegrand and Mayewski, 1997). The ion records are presented in Figures 3 and 4. For information on detection limits see Reference Jauhiainen, Moore, Peramaki, Derome and DeromeJauhiainen and others (1999).

Fig. 4. Concentration profiles of acidity, nitrate, sulphate, MSA, calcium, sodium and chloride (0–36 m). The thick line represents moving average of nine samples.
Evaluation of Time-Scale
We have established a time-scale for the uppermost 36 m of the core by counting peaks in the ion records, and found that the seasonal variations appear to be preserved to a large degree in several of these records. We use the Cs peak from 1963 found at 18.50–18.95 m depth as the reference layer, and by counting the quasi-annual layers in Na+ and SO4 2− we estimate a date of 1920 at 36 m depth (Fig. 3). There is a pronounced peak in the sulphate record (Fig. 3) that could be the eruption of Bezymianny, Kamchatka, northeast Russia, in 1956 (Reference ZielinskiZielinski and others, 1994), which fits well with the peak counting.
The question of the preservation of seasonal signals in ice cores that undergo melting is difficult to resolve. Unlike ice cores where no melting takes place and seasonal cycles can be used for dating purposes (e.g. Reference Legrand and MayewskiLegrand and Mayewski, 1997), seasonal cycles in many species are destroyed in the summer after deposition if there is the least amount of meltwater percolation. Certain species are even mobile at temperatures well below the melting point (Reference Pasteur and MulvaneyPasteur and Mulvaney, 1999). Although evidence exists that strong acids are rapidly removed by meltwater from the snowpack, faster than marine salts or dust (Reference Davies, Vincent and BrimblecombeDavies and others, 1982), we find that many species in the core exhibit peaks at approximately the frequency to be expected if they were annual cycles. Data from other ice caps with climatic conditions similar to those at Lomonosovfonna, such as Snøfjellafonna on Svalbard (Reference Goto-AzumaGoto-Azuma and others, 1995) and Penny Ice Cap in the Canadian Arctic (Reference Grumet, Wake, Zielinski, Fisher, Koerner and JacobsGrumet and others, 1998), also show signals which have been interpreted as quasi-annual.
The Na+ and SO4 2− records have the clearest seasonal variations (Fig. 3). However, SO4 2− is a complex signal made up of several components: sea salts and anthropogenic and natural biogenic acid sources. The nssSO4 2− component in aerosols over Svalbard peaks in February–April (Reference Heintzenberg and LeckHeintzenberg and Leck, 1994), while the peak in MSA occurs in midsummer. The peak in nssSO4 2− seems to be due to the Arctic haze phenomenon, at least in recent years. This is supported by pit studies on the Penny Ice Cap (Reference Grumet, Wake, Zielinski, Fisher, Koerner and JacobsGrumet and others, 1998) and from Snøfjellafonna (Reference Goto-AzumaGoto-Azuma and others, 1995). However, back-trajectory calculations on aerosol parcels during spring over Svalbard (Reference StaeblerStaebler and others, 1999) indicate that the situation is often more complex. Air without obvious industrial contamination originates from open-water areas and Greenland to the west, and contains predominantly marine salts, while air coming from Eurasia contains many more aerosols and much higher levels of acidity and especially more nssSO4 2−. Both types of air mass can be present in all seasons on Svalbard, as was discovered by Reference GjessingGjessing (1977) in the snow chemistry of the winter snowpack on Svalbard, making seasonal signals hard to distinguish clearly. The possibility of multiple peaks in certain species has also been discussed by several authors (Reference Goto-AzumaGoto-Azuma and others, 1995; Reference Grumet, Wake, Zielinski, Fisher, Koerner and JacobsGrumet and others, 1998), especially in years with unusual conditions such as volcanic acid deposition.
The second dating method is based on assuming a constant accumulation rate, deduced from γ activity, and allowing for thinning by pure shear (Reference NyeNye, 1963). Both models give approximately the same age at 36 m depth (±4 years).
Temporal Variability
Oxygen isotopes and ice structures
There is a good correspondence, at a multi-year scale, between δ 18O and the temperature record from Longyearbyen (Fig. 2). Due to the complicated theoretical relationship between δ 18O in snow and air temperature, the meteorological conditions around Svalbard and the inexact time-scale, a year-to-year correlation is not to be expected.
We also find that the melt index during this time period shows a generally good agreement with the temperature distribution from Longyearbyen (Fig. 2). The decadal variability in temperature matches the melt index from Lomonosovfonna, though they have different magnitudes on different occasions.
Major ions
The concentrations of the sea-salt ions, chloride and sodium, show a decreasing trend from 1920 to the present (Fig. 4). We do not have information on the seasonal input of sea salt, but previous work from chemical sampling of snow pits in Svalbard at approximately the same altitude indicates higher wintertime input of sodium and chloride (Reference Goto-AzumaGoto-Azuma and others, 1995). Continuous aerosol sampling in Ny Ålesund (Fig. 1) shows highest input during March and April (Reference Torseth, Berg, Hanssen and ManoTorseth and others, 1999). Because of the altitude of our drill site we believe that these ions reflect either a decrease in wind speed/transport strength (e.g. Reference Whitlow, Mayewski and DibbWhitlow and others, 1992) or a change of dominating air masses, rather than a change in sea-ice extent. Aerosol measurements from Ny Ålesund show that during warm periods the air masses come from the west, while during cold periods they come from the Barents Sea in the east (Reference StaeblerStaebler and others, 1999). Another air-sampling mission from this area suggests that the marine air masses from the west have higher concentrations of MSA and sea salts, while the colder and drier Barents Sea air is enriched in nssSO4 (Reference Hara, Osada, Hayashi, Matsunaga and IwasakaHara and others, 1997). This difference in ion content may make it possible to use the ice-core record to distinguish the dominance of different air masses.
Another possibility is that the decrease is caused by increased removal of ions by leaching due to increased melting during the last three decades. However, the Na/Cl ratio does not support this (Fig. 5). The mean molar Na/Cl ratio is 0.95 compared with a marine ratio of 0.86. Because chloride leaks out before sodium (Reference Davies, Vincent and BrimblecombeDavies and others, 1982), this ratio is an estimate of the severity of percolation, and therefore leaching of ions during melt tends to increase the ratio (Reference Goto-AzumaGoto-Azuma and others, 1995). The fairly uniform behaviour exhibited in Figure 5 does not suggest a significant trend in chloride depletion since the 1950s, unlike the case of the Snøfjellafonna ice core which shows a dramatic change in Na/Cl ratio from the 1950s onwards (Reference Goto-AzumaGoto-Azuma and others, 1995). There is a small increase in the Na/Cl ratio around the 1940s, which is in agreement with warmer temperatures in the instrumental record (Reference Nordli, Hanssen-Bauer and FørlandNordli and others, 1996). The fact that concentrations of other species such as nitrates are lower deeper in the core suggests that percolation of those species is not important. The relatively small amounts of melt in the core (about 50% on average in this part of the core) at present suggest that run-off is very unlikely, so the decreases in species concentration are probably a real indication of decreased deposition. Overall concentrations of both sodium and chloride are lower in the 1990s than earlier, suggesting that some meltwater percolation may have taken place recently. An alternative explanation is an actual depletion of chloride in the aerosol fraction over Svalbard during this period, as has been observed for some air masses coming from the east over the Arctic Ocean (Reference StaeblerStaebler and others, 1999).
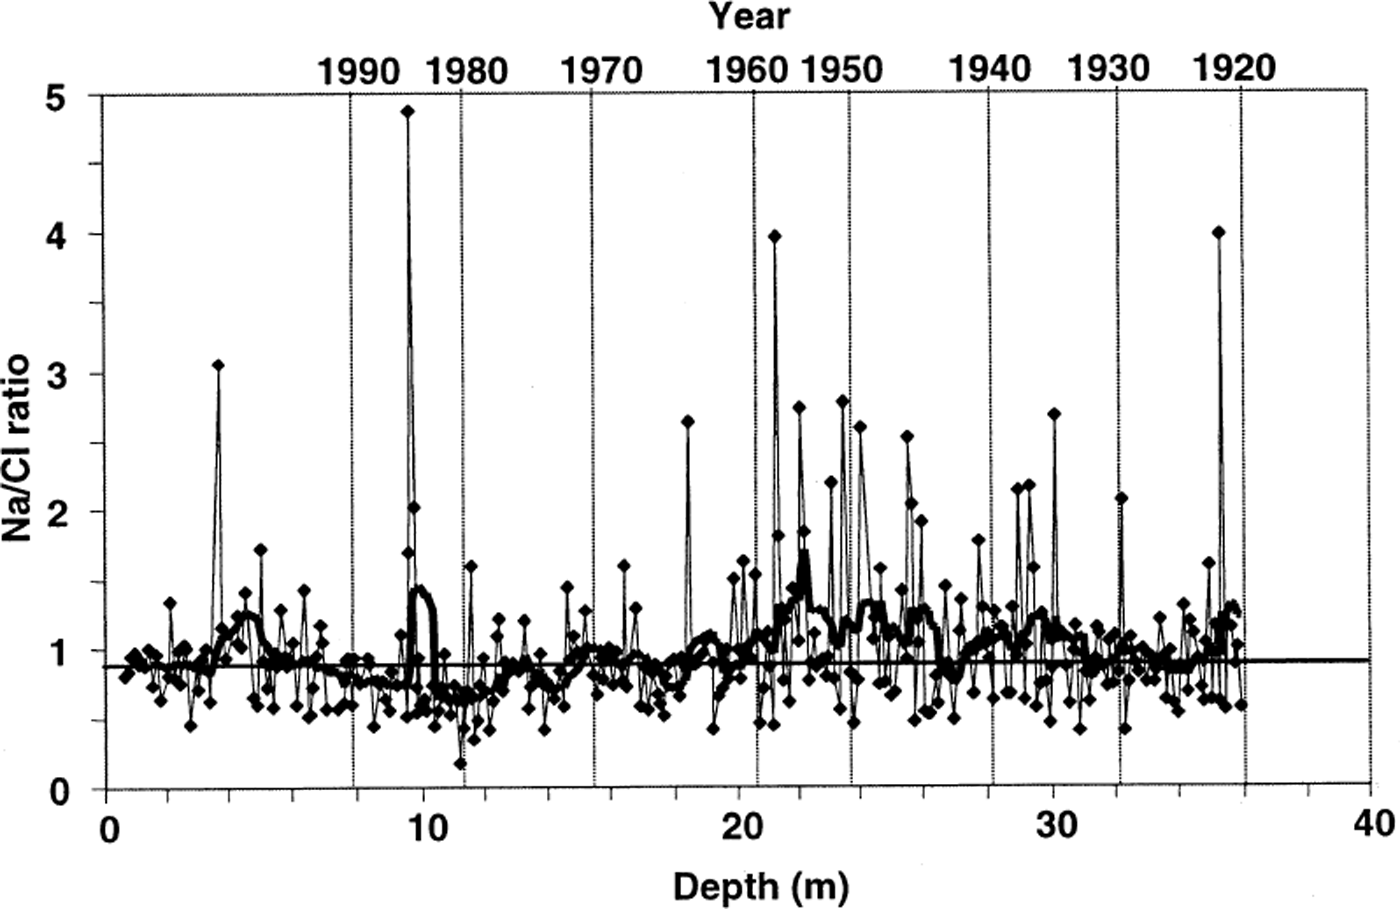
Fig. 5. Na/Cl ratio for the uppermost 36 m of the ice core. The thick line represents moving average of nine points. The horizontal line shows marine ratio (0.86). The mean molar Na/Cl ratio is 0.95.
The acidity profile is dominated by nitric acid, and therefore resembles the nitrate record (Fig. 4), except at specific intervals (e.g around 30 m in about 1935) where high amounts of alkaline calcium are present. This probably originates from local dust sources.
There is an increasing trend of acidity, sulphate and nitrate from the 1950s (about 20–23 m depth) to about 1990 (Fig. 4), which most likely reflects increased global anthropogenic input during the time period. Some of the decrease in the upper part of the core may be related to loss of ions through increasing melt, which would lead to preferential elution of nitrate and sulphate, even more than for sodium and chloride (Reference Davies, Vincent and BrimblecombeDavies and others, 1982; Reference Goto-AzumaGoto-Azuma and others, 1995). Nitrate levels start to increase in the late 1950s, remain high until the late 1980s and decrease thereafter. Sulphate levels start to increase earlier, in the 1940s, in agreement with findings from other Svalbard ice cores (Reference Simoes and ZagorodnovSimões and Zagorodnov, 2001), from Greenland (Reference MayewskiMayewski and others, 1986; Reference LegrandLegrand and others, 1997) and from the Canadian Arctic (Reference Koerner, Fisher and Goto-AzumaKoerner and others, 1998). Furthermore, Reference Goto-Azuma and KoernerGoto-Azuma and Koerner (2001) have shown that the sulphate record from the Snofjellafonna ice core closely resembles the total sulphate emission record for Eurasia from about 1940 to about 1990. The sulphate levels in our ice core are lower during the last decade, which is in agreement with aerosol measurements in Ny Ålesund showing an almost 60% decrease during the period 1980–97 in response to the decrease in sulphate emission (Reference Torseth, Berg, Hanssen and ManoTørseth and others, 1999) (Fig. 6). The close comparison of the air measurements and our ice-core data reveals similar behaviour and suggests again that the ice-core data have not been severely altered by meltwater percolation. However, the local sulphate source may also be part of the trend, since the onset of mining activities in nearby Pyramiden (Fig. 1) coincides with an increase in the sulphate record. Furthermore, the ending of mining activities in Pyramiden in 1990 may have contributed to the decreasing sulphate concentration on Lomonosovfonna during the last decade.
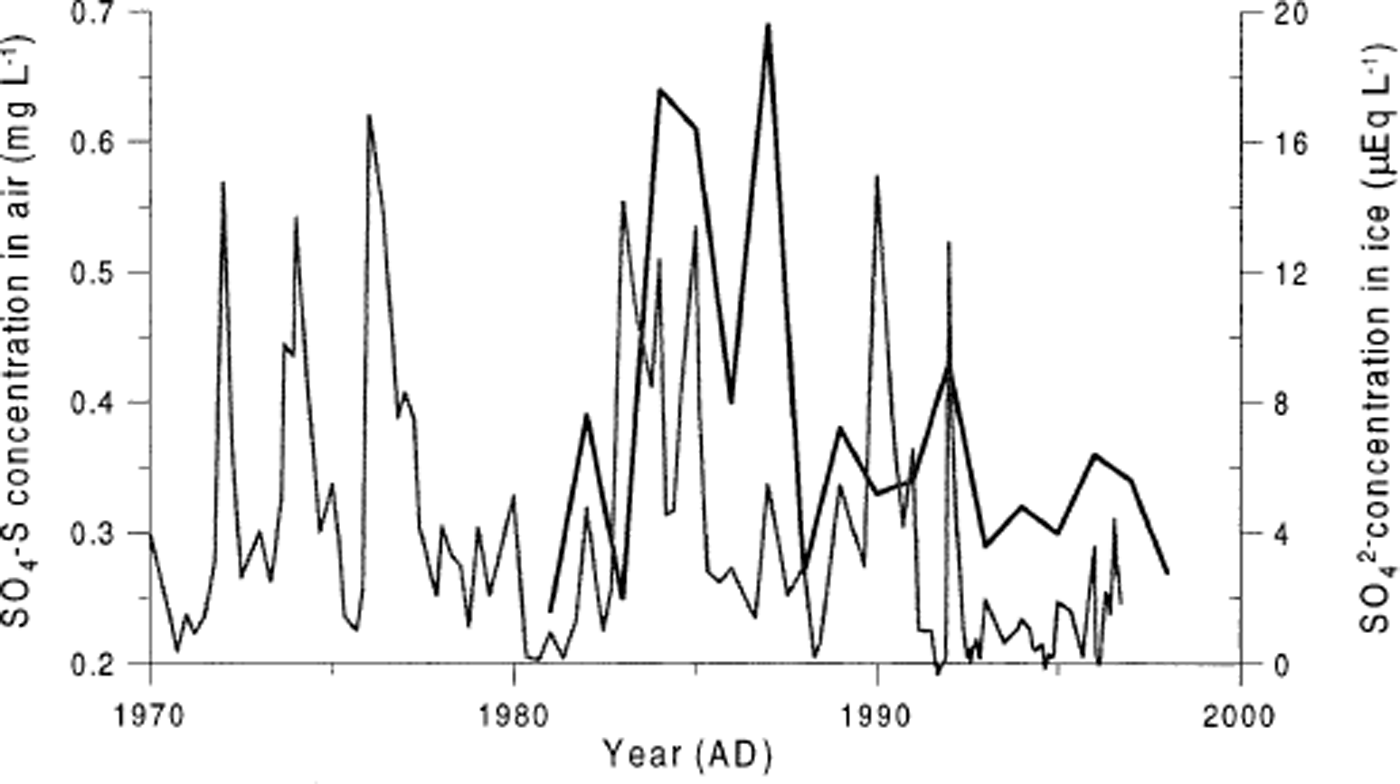
Fig. 6. The sulphate record from the ice core (thin line) and the air-sampling (thick line) station in Ny Ålesund (Reference Torseth, Berg, Hanssen and ManoTørseth and others, 1999).
A reconstructed sea-ice record from around Svalbard (Reference VinjeVinje, 2000) provides an opportunity to investigate a possible link between sea ice and the ice-core record (Fig. 2). We have found that the only clear correspondence between sea ice and our analyzed species is with MSA (Reference O’DwyerO’Dwyer and others, 2000). A close comparison of the MSA record and the sea-ice record over the 1920–97 period shows that years with little sea ice seem to favour more MSA, perhaps through enhanced DMS (dimethyl sulphide) production, and vice versa (Reference O’DwyerO’Dwyer and others, 2000). This is not in agreement with data from central Greenland, which show the opposite relationship over the same time period (Reference LegrandLegrand and others, 1997). The ice-core data from Greenland show that MSA concentrations have been reduced since 1945, and the suggested cause is a decrease in biogenic DMS emission (Reference LegrandLegrand and others, 1997). MSA concentration in the Lomonosovfonna core varies about twice as much as has been reported for sites from interior Greenland covering the same time period (Reference Jaffrezo, Davidson, Legrand and DibbJaffrezo and others, 1994; Reference Whung, Saltzman, Spencer, Mayewski and GundestrupWhung and others, 1994; Reference LegrandLegrand and others, 1997). However, the mean MSA/nssSO4 ratio is 2.8% (median = 1.7%, n = 272; nssSO4 = SO4 − 0.052[Cl] according to Reference HanssonHansson (1994)), which is similar to what is found in Greenland (Reference LegrandLegrand and others, 1997) and from aerosol sampling in the atmospheric boundary layer in the ocean west of Svalbard (Reference Leck and PerssonLeck and Persson, 1996). The MSA and temperature data show a correspondence on a decadal basis, suggesting that MSA at our core site reflects local climate to a large degree and that MSA actually corresponds more closely to the temperature than the commonly used δ 18O record (Fig. 2).
Comparisons of ion data from the Lomonosovfonna core and other Svalbard ice cores are presented in Table 4. Although the cores cover slightly different time periods, the comparison indicates some differences. The concentrations of sodium and chloride in the Lomonosovfonna core are only 50% of the concentrations at the other three sites. The difference in sea-salt loading between Snøfjellafonna and Lomonosovfonna may be explained by the more easterly position of Lomonosovfonna, which is less influenced by the moist marine air masses from southwest, while the lower elevation at the Austfonna drill site may explain the higher sea-salt concentrations found there. It is interesting to note that the sulphate level is much higher at Lomonosovfonna than at either Snøfjellafonna or Austfonna, while Hoghetta has even higher levels than Lomonosovfonna. In a study of spatial variations of major ions in surface snow on Svalbard, Reference Semb, Brækkan and JorangerSemb and others (1984) found that the pattern of deposition was in agreement with orographic deposition, with the major air trajectories moving southeast–northwest. They also found high variability between individual years, which they traced to the duration of the period with southeasterly winds. The larger sulphate loading at Lomonosovfonna may also be due to the local impact of the mining towns.
Table 4. Comparisons of mean ion concentrations from Svalbard ice-core sites. Lomonosovfonna data are from this work, while the other ice cores were drilled by japanese scientists from the National Institute of Polar Research (NIPR)

Summary and Conclusions
The data presented in this paper focus on the uppermost 36 m of a 121 m deep ice core from Lomonosovfonna. They cover the period 1920–97, during which interval instrumental meteorological data are available. This makes it possible to evaluate the reliability of the data series with respect to post-depositional alterations of the ice-core record due to percolation of meltwater. The main conclusions are: (1) the chemical stratigraphy suggests quasi-annual layers which enable dating; (2) the distribution of species at Lomonosovfonna has probably been altered to some degree by melt, but the records still provide information about major trends in atmospheric variability; (3) the temporal variations seems to agree with available climate and environmental records on decadal scales, and therefore contain a potential for temporal reconstructions of these parameters further back in time; (4) comparisons of melt index, δ 18O and MSA with the sea-ice record and instrumental temperature record suggest that this ice-core record reflects local climate conditions. The results from the upper part of this ice core suggest that there is also a potential to date the lower part of the core. Trends will be discussed and evaluated more thoroughly once the remainder of the core is analyzed.
Acknowledgements
Many people helped to make this project possible. We are grateful to L. Conrads, T. Karlberg, B. Lytskjold and A.-M. Nuttall for assistance in the field. Logistical support came from the Norwegian Polar Institute (NPI) in Longyearbyen, with special thanks to E. Johansen. W Karlén at the Department of Physical Geography, Stockholm University, kindly let us use the freeze storage and cold laboratory facilities. E. Huss and B. Lefauconnier are thanked for assisting with laboratory work. J. B. Ørbæk at NPI provided strong support during the planning of the project, and our Japanese collegues from NIPR kindly made unpublished data available. A. Igesund drew the maps and J. Kohler corrected the language. D. Peel, R. Koerner and an anonymous reviewer provided very helpful comments on the manuscript. Financial support came from NPI, The Netherlands Foundation for the Advancement of Pure Research, The Finnish Academy, Stiftelsen Ymer-80 and The Nordic Minister Council.


