Maybe our biggest strength in Germany … is the rational decision-making at the highest level of government combined with the trust the government enjoys in the population.
—New York Times, April 4, 2020Footnote 1
Communities and nations with higher levels of social trust and connections are more resilient in the face of natural disasters and economic crises. Fixing rather than fighting becomes the order of the day.
—Helliwell, Layard, Sachs, and De Neve Reference Helliwell, Layard, Sachs and Neve2020
In stark contrast to the United States and other similarly afflicted nations, Germany experienced a significantly lower mortality rate at the outset of the COVID-19 pandemic.Footnote 2 Beyond the superior initial testing capacity of Germany, which can help explain this outcome, Germans appeared to be complying to a high degree with government orders aimed at mitigating the spread of the virus. These mandated policies included “stay-at-home” orders, which minimized opportunities for individuals to interact outside the home, and social distancing, which limited person-to-person contact when individuals did go outside. Compliance with preventative measures is the single most critical behavioral change citizens can make to prevent an exponential spread of the virus, which is needed to protect health systems from becoming overwhelmed with patients. Yet even as such health policies have become increasingly standardized across the globe, compliance with these policies differs across each society. At the outbreak of the virus, news reports were replete with American college-aged students woefully ignoring mitigation orders. A consequence was that these individuals—who appeared to be at decreased health risks from the virus—could potentially pass along the virus to more vulnerable populations. This underscores the dire potential fallout for public health when there exists asymmetrical compliance with public policy.
The puzzle of differential compliance underscores the importance of determining which factors are critical to the success of public policy. We highlight partisanship as making a substantial difference in compliance with stay-at-home orders, which we contend relates to trust in science and expertise. Moreover, we examine how mitigation measures issued by co-partisan politicians elicit improved compliance from supporters, which we relate to trust in co-partisan politicians. We also consider another salient form of trust that has been attributed to aiding unity among citizens and, in turn, the effectiveness of crisis responsiveness: social trust, that is, trust in others. Trust has long been a focus of inquiry in the social sciences and has regained import in the context of the COVID-19 pandemic, but a significant drawback has been the use of empirical strategies that measure attitudes rather than behavior, for example, surveys. Our study captures real-world behavior and finds that several forms of trust play significant roles in public responsiveness to mitigation orders. In addition, we examine the interaction of partisanship and social trust, uncovering amplifying effects that either improved or decreased compliance, depending upon partisan predispositions. Finally, we connect our results to a popular narrative, which is highlighted by the New York Times quote above, that political trust is critical for producing mass compliance. Overall, our study provides a real-world behavioral benchmark for the importance of these factors in the successful implementation of public policy.
Partisanship, Trust, and Policy Compliance
Compliance with voluntary or legally enforced public policies requires that individuals sacrifice some of their autonomy to adhere to the orders of the state (Tyler Reference Tyler, Braithwaite and Levi2003). Yet policy compliance often confers costs whereby the benefits remain unclear or produce positive externalities that complying citizens may not personally enjoy, which manifests as strong incentives to free ride (Scholz Reference Scholz, Braithwaite and Levi2003; Scholz and Lubell Reference Scholz and Lubell1998). It follows that public health is a universal public good that benefits everyone when it is in a more robust condition. Yet maintenance requires costly buy-in, e.g., following stay-at-home orders, and the contribution of any one individual to the public wellness of others, e.g., not passing along the virus, may not be readily visible or internalized by those who sacrifice. In a sense, compliance with public policy can be deemed an act of faith on the part of citizens. To be willing to trade off individual authority to government mandates, citizens must trust that a policy is worthwhile. That is, they must evaluate policy and conclude there are net benefits compared to potential drawbacks or sanctions related to disobedience. We narrow our focus to factors we contend shape an assessment of policy (rather than penalties related to noncompliance), all of which we relate directly or indirectly to forms of trust. These factors include the policy domain being considered, attitudes toward government, the relevant political actors, and the views of social peers toward policy. Our study speaks to each of these elements in the context of government orders intended to mitigate the spread of COVID-19.
One of the primary measures that we argue impacts an evaluation of policy and, thereby, compliance, is partisanship. We hypothesize that Republican supporters are less likely to comply with mitigation orders. Ex-ante, one may not expect Republicans to be less compliant, particularly as survey evidence suggests that Republicans are generally more supportive of law enforcement and, by extension, legal compliance (Brown Reference Brown2017). However, we contend that the types of policies needed to mitigate the spread of COVID-19 share a characteristic that leads them to be a partisan issue, namely: they are based on scientific expertise. Additionally, we argue that there will be differential partisan compliance with COVID-19 policies because they represent a large-scale government action that limits individual autonomy.
In recent years, Republican voters have generally shown a greater mistrust of science-based and expert-driven policies.Footnote 3 This has notably played out in attitudes toward climate change legislation (McCright and Dunlap Reference McCright and Dunlap2011; Bolsen and Druckman Reference Bolsen and Druckman2018). This mistrust has also contributed to behavioral effects, such as fewer evacuations in response to government hurricane warnings and diminished vaccine rates among Republicans (Suryadevara et al. Reference Suryadevara, Bonville, Cibula, Domachowske and Suryadevara2019; Long, Chen, and Rohla Reference Long, Chen and Rohla2020). The COVID-19 crisis is another domain in which scientific experts have shaped policymaking. It is largely health scientists and professional bureaucrats at the Centers for Disease Control and Prevention (CDC) who have produced mitigation policies. Hence, a positive assessment of COVID-19 policy likely requires being receptive to scientific reasoning.Footnote 4 Furthermore, mitigation policies represent a sweeping government intervention that necessarily curtails individual liberties, such as the freedom of movement. A defining characteristic of Republican ideology is opposition to many, but not all, forms of government intervention, such as large government spending programs targeting the poor as well as business regulations (Williamson, Skocpol, and Coggin Reference Williamson, Skocpol and Coggin2011). Hence, COVID-19 measures likely represent yet another unwelcome government intervention, which an individual may interpret to not be in their best interest if disposed to be mistrustful of large-scaled government policies. Moreover, as partisanship has been found to be predictive of differential engagement with voluntary policy (Lerman, Sadin, and Trachtman Reference Lerman, Sadin and Trachtman2017), we hypothesize that partisanship is a significant driver of differential compliance with mandatory COVID-19 orders. That is, we contend that Republicans will be less likely to comply with mitigation policies when compared to Democrats, who, in general, are more accepting of science, expertise, and government interventions.
We also consider the role that shared partisan identity between citizens and a politician plays in producing compliance. We argue that if individuals hold greater trust in co-partisan elites, that trust will enhance their assessment of policy advocated by those politicians. Surveys collected during the 2014–2015 Ebola epidemic revealed that respondents who expressed a greater trust in government were more likely to comply with mitigation orders (Blair, Morse, and Tsai Reference Blair, Morse and Tsai2017). Furthermore, evidence suggests that trust in government is augmented by whom is in office, and citizens are generally more trusting of co-partisan political actors as well as more approving of a policy implemented by a co-partisan (Bianco Reference Bianco, Braithwaite and Levi2003; Druckman and Lupia Reference Druckman and Lupia2016; Citrin and Stoker Reference Citrin and Stoker2018). In fact, vaccine rates have been found to increase when a co-partisan is president, suggesting that shared co-partisanship with elites may augment underlying trust in science (Krupenkin Reference Krupenkin2020). Therefore, we expect COVID-19 measures enacted by co-partisan politicians to likely receive an improved evaluation and, thus, lead to greater compliance by supporters. Our research design also benefits from the fact that policymaking has largely fallen on state governors during the COVID-19 crisis. Although the partisan identity of governors varied, the immediate policy solution to the pandemic was relatively uniform across states—enactment of stay-at-home orders—meaning our study may serve as a behavioral test of this hypothetical co-partisan effect.
Next, we contend that policy compliance should increase with higher levels of social trust. Trust in others is thought to improve collective action, connoting a public mindedness that may indicate a greater willingness to sacrifice in order to benefit public welfare. In addition, social trust is thought to be conducive to holding government accountable (Putnam Reference Putnam2001; Liu and Stolle Reference Liu, Stolle, Zmerli and van der Meer2017), which would likely improve assessment of the quality of government policy. Thus, we argue that social trust should improve willingness to comply with government policy.
Yet we hypothesize that social trust can also mobilize in the opposite direction, depending upon underlying partisanship. As citizens gain information about policy and politicians from their social networks, local attitudes can reinforce beliefs and actions (Lupia and McCubbins Reference Lupia and McCubbins1998; Klar Reference Klar2014). Relating back to the mechanism that we propose underlies partisanship, there is evidence indicating that mistrust of science, reflected in attitudes toward climate change, is shaped by the beliefs held by peers (Kahan et al. Reference Kahan, Peters, Wittlin, Slovic, Ouellette, Braman and Mandel2012). Thus, if many in one’s community are skeptical of a policy, we hypothesize that higher social trust may amplify this poor assessment. Potentially, this can make noncompliance a focal action engaged in by many in a community, which we contend would disincentivize compliance with COVID-19 orders in our setting. Thus, our study contributes to uncovering both the benefits and the harms of social trust, thereby adding behavioral evidence to the potential downside of social trust, whereas the related literature has generally focused on its positive consequences.
Compliance with COVID-19 Orders
The mitigation orders intended to combat the COVID-19 pandemic offer a unique opportunity to provide a large-scale and direct behavioral test of the roles that partisanship and trust play in determining compliance with salient public policy. Notably, the roles of trust and compliance have largely relied upon survey methodology, which limits the assessment of the consequences of trust because it only reports attitudes or self-reported actions (Citrin and Stoker Reference Citrin and Stoker2018). In contrast, our study uses real-world measures to demonstrate the impact of partisanship and social trust while also emphasizing that their interaction can potentially prove detrimental to general public health.
We leverage data on how much individuals move on a daily basis during the COVID-19 pandemic to quantify compliance with stay-at-home orders. Our mobility measure is created by using county-level cellphone data provided by Cuebiq Inc. Then, staggered roll-out of stay-at-home orders allows us to implement difference-in-differences estimation, which establishes baseline causal measurements of the degree of compliance with mitigation orders. Shifting to our descriptive analysis, we use time and state fixed effects as well as a battery of control variables—including age, income, county ruralness, race, and sectoral composition, among others—to examine heterogeneous effects related to compliance. We directly examine partisanship as well as co-partisanship, for which we analyze the interaction of partisanship with the influence of a co-partisan governor. To investigate social trust, we use a measure of social capital. Finally, we test how social trust may amplify differences in compliance due to partisanship by examining the interaction of partisanship and social capital, which we refer to as “partisan social trust.” In addition, among a number of robustness checks, we re-run our analysis using vaccination rates as a proxy of mistrust in science. Moreover, we make use of multilevel regression and post-stratification (MRP) with survey data in order to verify our social trust measure as well as to consider suggestive evidence of the effect of political trust on compliance.
Unsurprisingly, stay-at-home orders prove extremely effective at diminishing mobility, decreasing mobility measured at the county-level from 23%–45%. Moreover, we find that, within the same states, counties that are generally more Democratic-leaning comply at significantly higher rates with stay-at-home orders than do Republican-leaning counties: a 10% increase in Democratic vote share is associated with a 11%–19% compliance increase as measured by mobility. We argue that this effect derives from Democrats having greater trust in science and large-scale government policy. Next, we find that when stay-at-home orders are enacted by Republican governors as compared to Democratic governors, the compliance gap between Republican-leaning and Democratic-leaning counties shrinks. This suggests that even when public policy is essentially the same across regions, individuals are more willing to comply with policies issued by a co-partisan. Lastly, we find that counties with higher levels of social capital, which serves as our measure of social trust, have increased rates of compliance. However, when social capital is compounded by partisanship, we find that the compliance gap between Republican-leaning and Democratic-leaning counties widens further. This result is supportive of the theory that social trust amplifies existing partisan attitudes towards policy. Hence, an individual in a Republican county is more likely to not comply and increased social trust will reinforce this behavior. Finally, our MRP analysis corroborates our use of the proxy measure of social capital as well as supports our social trust findings and produces suggestive evidence that higher levels of trust in government also improves compliance.
Taken as a whole, the heterogeneous effects suggest that in the United States, as compared to Germany, partisanship—which we contend relates to trust in science and expertise—has had a detrimental effect on compliance with stay-at-home orders. Moreover, differential levels of social trust may have also contributed to these divergent outcomes. Due to the gravity of the COVID-19 pandemic, the health consequences of asymmetrical compliance underline the tangible welfare impacts of trust. Furthermore, our study provides suggestive but, critically, behavioral evidence of the fundamental impact that partisanship, co-partisanship, and social trust, as well as the interaction of partisanship and social trust, hold for successful implementation of public policy. Building on these results, we will suggest how our findings also testify to the key role political trust plays in successful policy implementation, an objective that is crucial for effective state capacity, particularly in the context of polarized but high social trust environments (Bustikova and Corduneanu-Huci Reference Bustikova and Corduneanu-Huci2017).
We now highlight relevant literature and expand upon our theory. Then, we detail our data and empirical strategy before discussing our results. Finally, we outline several robustness checks and implications before concluding.
Literature
What drives policy compliance is a question that spans a diverse academic literature. However, the connection between compliance and trust has been less frequently considered. A few studies have highlighted the importance of trust for voluntary compliance (Hardin Reference Hardin, Braithwaite and Levi2003; Tyler Reference Tyler, Braithwaite and Levi2003). For example, a strand focuses on how trust impacts resistance to receiving vaccines (Salmon et al. Reference Salmon, Dudley, Glanz and Omer2015; Grossman, Phillips, and Rosenzweig Reference Grossman, Phillips and Rosenzweig2018). Regarding compliance with mandatory orders, Marien and Hooghe (Reference Marien and Hooghe2011) find that individuals with higher trust in government are less willing to break the law. However, research on mandatory compliance is largely based on survey data (Citrin and Stoker Reference Citrin and Stoker2018). In contrast, our study contributes a real-world behavioral measure of the impact of trust on mandatory compliance.
Partisanship and Co-Partisanship
Partisanship has been found to shape individual attitudes, the type of media one consumes, one’s perceptions of objective information, and individual actions (Gerber and Huber Reference Gerber and Huber2009; Bolsen, Druckman, and Cook Reference Bolsen, Druckman and Cook2014; Mason Reference Mason2015; Henderson and Theodoridis Reference Henderson and Theodoridis2018). Similarly, we argue that partisanship may alter compliance with COVID-19 orders. Survey evidence from the onset of the COVID-19 pandemic suggests that partisanship partially accounts for variation in self-reported behavior such as hand washing (Kushner Gadarian, Goodman, and Pepinsky Reference Gadarian, Shana and Pepinsky2020). Moreover, concurrent studies find that partisanship has impacted compliance with stay-at-home orders (Barrios and Hochberg Reference Barrios and Hochberg2020; Allcott et al. Reference Allcott, Boxell, Conway, Gentzkow, Thaler and Yang2020).Footnote 5 The mechanism that we contend underlies this effect is differential trust in science and large-scale government policies.
In the United States, trust in science, trust in professional bureaucrats, and support for government interventions into private life break along partisan lines. A 2018 Pew Survey found that respondents approximately trust elected officials the same amount. However, Democrats compared to Republicans were much more likely to trust scientists, academic professors, and non-appointed career bureaucrats (Rainie, Ketter, and Perrin Reference Rainie, Ketter and Perrin2019). Moreover, Democratic-leaning respondents report higher trust in science, including climate change and the utility of vaccines (Hamilton, Hartter, and Saito Reference Hamilton, Hartter and Saito2015). This result may be driven by Democrats being particularly swayed by scientific reasoning (Blank and Shaw Reference Blank and Shaw2015). Such attitudes have been found to have behavioral implications. For example, greater trust in medical workers and government programs led to higher compliance with preventative measures during the 2014–2015 Ebola outbreak (Christensen et al. Reference Christensen, Dube, Haushofer, Siddiqi and Voors2020). In addition, Republicans have been found to be more likely to believe that government intervenes in matters too often and prefer individual or free market mechanisms rather than government actions (Pew Research Center 2014; Lerman, Sadin, and Trachtman Reference Lerman, Sadin and Trachtman2017; Newport Reference Newport2020).
Policy compliance may also be impacted by the alignment of the partisan identity of citizens with the politician who proposed and enacted a policy. Bianco (Reference Bianco1994) argues that when citizens perceive a politician to hold common interests with them, they are more trusting of the politician’s actions such that they hold an improved evaluation of their policies. This connects to the well-established finding that the particular individuals in power affect general trust in government (Keele Reference Keele2005; McCarty, Poole, and Rosenthal Reference McCarty, Poole and Rosenthal2016; Citrin and Stoker Reference Citrin and Stoker2018). Additionally, recent trends in which politicians focus on partisan differences have served to alter their supporters’ levels of trust in opposing partisans and their policies (Hetherington and Rudolph Reference Hetherington and Rudolph2015). Nonetheless, while political mistrust can lead to individuals clinging to their existing beliefs (Gerber and Green Reference Gerber and Green1999), the positive trust they associate with co-partisan politicians may make them more receptive to new ideas (Alt, Marshall, and Lassen Reference Alt, Marshall and Lassen2016). We also note that co-partisanship has been found to alter behavior. For example, Cullen, Turner, and Washington (Reference Cullen and Turner2018) find that sharing a partisan identity with the current president appears to lead to greater trust in governmental policy and, subsequently, to higher tax compliance.
Beyond our focus on trust, the political communication literature contends that politicians serve as sources of information to their supporters and that citizens often defer to their policy positions (Lupia and McCubbins Reference Lupia and McCubbins1998; Broockman and Butler Reference Broockman and Butler2017). Furthermore, motivated reasoning holds that individuals are likely to interpret information in a manner that confirms their preferred party’s position (Bolsen, Druckman, and Cook Reference Bolsen, Druckman and Cook2014). These factors suggest that policy compliance may be impacted by citizens sharing a co-partisan identity with relevant political actors.
Social Trust
Social trust, that is, trust in others, may develop due to “rationally” trusting individuals who claim to represent one’s best interests, or it may be fostered as a learned moral outlook on how to treat others (Hardin Reference Hardin2002; Uslaner Reference Uslaner2002; Nannestad Reference Nannestad2008). Social trust appears to notably develop among individuals who possess a common attribute, such as nationality (Alesina and La Ferrara Reference Alesina and Ferrara2002; Newton and Zmerli Reference Newton and Zmerli2011).
We contend that social trust may impact policy compliance because it enhances a willingness to help others in society. In the case of COVID-19, higher social trust may manifest as greater compliance with governmental mitigation policies in order to assist others in one’s community. Communities with higher social trust may have improved responsiveness in crises and increased rates of social participation (Helliwell et al. Reference Helliwell, Layard, Sachs and Neve2020; Alesina and La Ferrara Reference Alesina and Ferrara2000; Uslaner and Brown Reference Uslaner and Brown2005). Moreover, communities that have higher reported norms of reciprocity and altruism correlate with greater support of international climate policy, a global public good (Bechtel, Genovese, and Scheve Reference Bechtel, Genovese and Scheve2019). This suggests that higher social trust may improve public good provision. Finally, higher social trust may improve the functioning of government, which, consequently, can also increase trust in government (Putnam Reference Putnam2001; Liu and Stolle Reference Liu, Stolle, Zmerli and van der Meer2017). In our section on implications, we suggest that improvements to trust in government may also increase compliance.
Due to challenges associated with measuring social trust using real-world behavioral data, we consider the proxy of social capital, which Putnam (Reference Putnam2000) defines as networks that forge reciprocity. Social capital and trust are closely related concepts. Social capital allows social trust to develop, promoting overall societal cohesion and stability (Woolcock and Narayan Reference Woolcock and Narayan2000; Putnam Reference Putnam2001; Newton, Stolle, and Zmerli Reference Newton, Stolle, Zmerli and Uslaner2018). Moreover, both social trust and capital can improve collective action and instill a public-spiritedness (Liu and Stolle Reference Liu, Stolle, Zmerli and van der Meer2017).
Lastly, we contend that community connections may gain leverage with higher social trust, impacting policy compliance through enhanced social pressure and the reinforcement of beliefs. Local communities can insulate the information citizens receive (Lupia and McCubbins Reference Lupia and McCubbins1998). In addition, social trust can enforce social norms that incentivize compliance with prevailing behavioral mores (van Deth Reference van Deth, Zmerli and van der Meer2017). This may manifest as social networks exerting pressure to enforce policy compliance, such as paying taxes (Besley, Jensen, and Persson Reference Besley, Jensen and Persson2019). Most literature focuses on the positive attributes of social trust and capital, as with Putnam (Reference Putnam2000). However, we argue that social trust can work either against or in favor of policy compliance, depending upon the focal orientation of a particular community. This result relates to the limited work on the potential negative effects of social capital (Berman Reference Berman1997; Mutz Reference Mutz2002; Rothstein Reference Rothstein2011).
Theory
We argue that citizens comply with public policy when they believe there exist positive net benefits to altering their behavior, which necessarily outweigh incentives toward or punishment from noncompliance. However, as one cannot witness the counterfactual situation that is being avoided, net benefits are speculative. Hence, citizens often use trust as a heuristic to determine the costs associated with a policy (Rudolph Reference Rudolph, Zmerli and van der Meer2017). We argue that a citizen’s trust regarding a policy’s topic area and who enacted the policy will both shape willingness to comply.
Public health is a universal public good, which entails that there is a strong temptation to free ride while still gaining the benefits of policy, such as not catching the coronavirus, without paying the associated costs, e.g., staying at home. We maintain that a key factor in shaping benefit evaluations of COVID-19 mitigation policies is partisanship. We argue that Republicans will be less likely to comply, which we contend is due to an underlying mistrust of science and expertise as well as a skepticism of government interventions. That is, a citizen who is mistrustful of scientific experts would be less likely to agree with their recommendations for government policy and, thus, would be less willing to comply. For example, Dr. Anthony Fauci is a career bureaucrat who has often helped shape COVID-19 policy as director of the U.S. National Institute of Allergy and Infectious Disease. As trust in science, expertise, and professional bureaucracy has become increasingly polarized, we expect Republicans to become less receptive to policies shaped by figures similar to Dr. Fauci.
We also theorize that policy receives an improved evaluation by citizens, which translates to greater compliance, when they share a partisan affiliation with the politician enacting the policy. This is because citizens hold greater trust in co-partisan politicians who share common interests, particularly regarding the policy they pursue (Bianco Reference Bianco1994). Thus, if COVID-19 orders come from co-partisan politicians, that should add validity to the perception of the policy being in a co-partisan citizen’s interest, and will likely improve the effectiveness of these interventions. For example, Republican Governor of Ohio Mike DeWine was a proactive leader within his state during the onset of COVID-19. Despite the initial skepticism by segments of the Republican Party and President Donald Trump, DeWine proved to be a forceful administer of mitigation methods. This could potentially convince co-partisan supporters who may have been more mistrustful of mitigation policy had it come from a politician of the opposing party.
Lastly, we argue that greater social trust can orient citizens toward actions that benefit overall society. Consequently, amplified social trust may manifest as enhanced compliance with policies that serve public health. Moreover, and less directly, social trust may also improve behavior within civil institutions, which should improve political trustworthiness (Levi and Stoker Reference Levi and Stoker2000; Bjørnskov Reference Bjørnskov2010). In our section on implications, we provide suggestive evidence that higher political trust increases compliance. Thus, we contend that higher social trust ought to increase compliance with COVID-19 orders.
Yet we also contend that, as increased social trust also strengthens social pressure and insulates beliefs, higher social trust can increase incentives to abide by prevailing community attitudes. Therefore, policy compliance or noncompliance may become a focal point depending upon community preferences, which we capture by partisanship. For example, if an individual mistrusts science and is surrounded by family, friends, and neighbors whom they do trust and who also mistrust science, they are even less likely to comply with mitigation policies. This is the result of the community likely discouraging compliance through pressure to ignore a mitigation order or by re-enforcing the belief that it is a poor policy. As a consequence, we predict that in communities disinclined to trust in science and government interventions—those made-up of mostly Republicans—high social trust will deepen this mistrust. Conversely, if an individual is immersed in a community that generally trusts experts and government policy—largely Democratic communities—one’s evaluation of mitigation policy is likely to be positively amplified through similar mechanisms.
Overall, our theory produces the following empirical hypotheses: first, within states that implemented stay-at-home orders, counties that have more Democratic-leaning citizens, as compared to those with a greater number of Republican-leaning citizens, should demonstrate higher compliance. Second, across states that implemented stay-at-home orders, the compliance gap between counties associated with partisanship, i.e., decreased compliance produced by Republican partisanship, will decrease when orders are given by a Republican governor as compared to states led by a Democratic governor. Third, within states that implemented stay-at-home orders, counties with higher levels of social capital demonstrate higher compliance than counties with lower social trust. Finally, fourth, within states that implemented stay-at-home orders, the compliance gap associated with partisanship will be amplified by social capital, i.e., the partisan effect on compliance increases for counties with higher levels of social trust.
In addition, in our section on implications, we present suggestive evidence that higher levels of trust in government will lead to greater compliance, which we suggest is an additional connection between partisanship and compliance.
Methods
In contrast to past studies on trust, which have largely utilized surveys, we examine a real-world behavioral measure of policy compliance. We use cellphone mobility data to observe compliance with an essentially uniform policy—stay-at-home orders—that was implemented on a state-by-state basis. We combine mobility with a number of sociopolitical data sources on the county-level (our unit of analysis), allowing us to examine the effect of partisanship and trust on compliance with COVID-19 mitigation orders.
Data
We focus on the period of January 1 to April 19, 2020 and use weekly county-level data, which includes sixteen full calendar-weeks.Footnote 6 We generally have between 47,000 and 50,000 unique week-county observations in our sample (for summary statistics, refer to the online appendix).Footnote 7
As our outcome of interest, we rely on a county-level mobility index (CMI) provided by Cuebiq Inc. (Cuebiq 2020).Footnote 8 The index measures the relative movement by individuals within a given U.S. county on a particular day.Footnote 9 Note that, due to the logged nature of the index, the coefficients we present may be interpreted as percentage changes of the distance traveled by the median inhabitant within a county.Footnote 10
Figure 1 illustrates the change in mobility by county between the fifteenth calendar week of 2019 and the corresponding week in 2020 (April 6–12). Darker shades are indicative of greater reductions in mobility. Overall, this figure indicates that mobility decreased in virtually all U.S. counties. However, the extent of the decrease varies considerably. For example, the most drastic mobility reductions appear to have taken place in the Northeast as well as in California, Michigan, and Washington state. Moreover, it appears that urban counties have experienced relatively larger reductions.
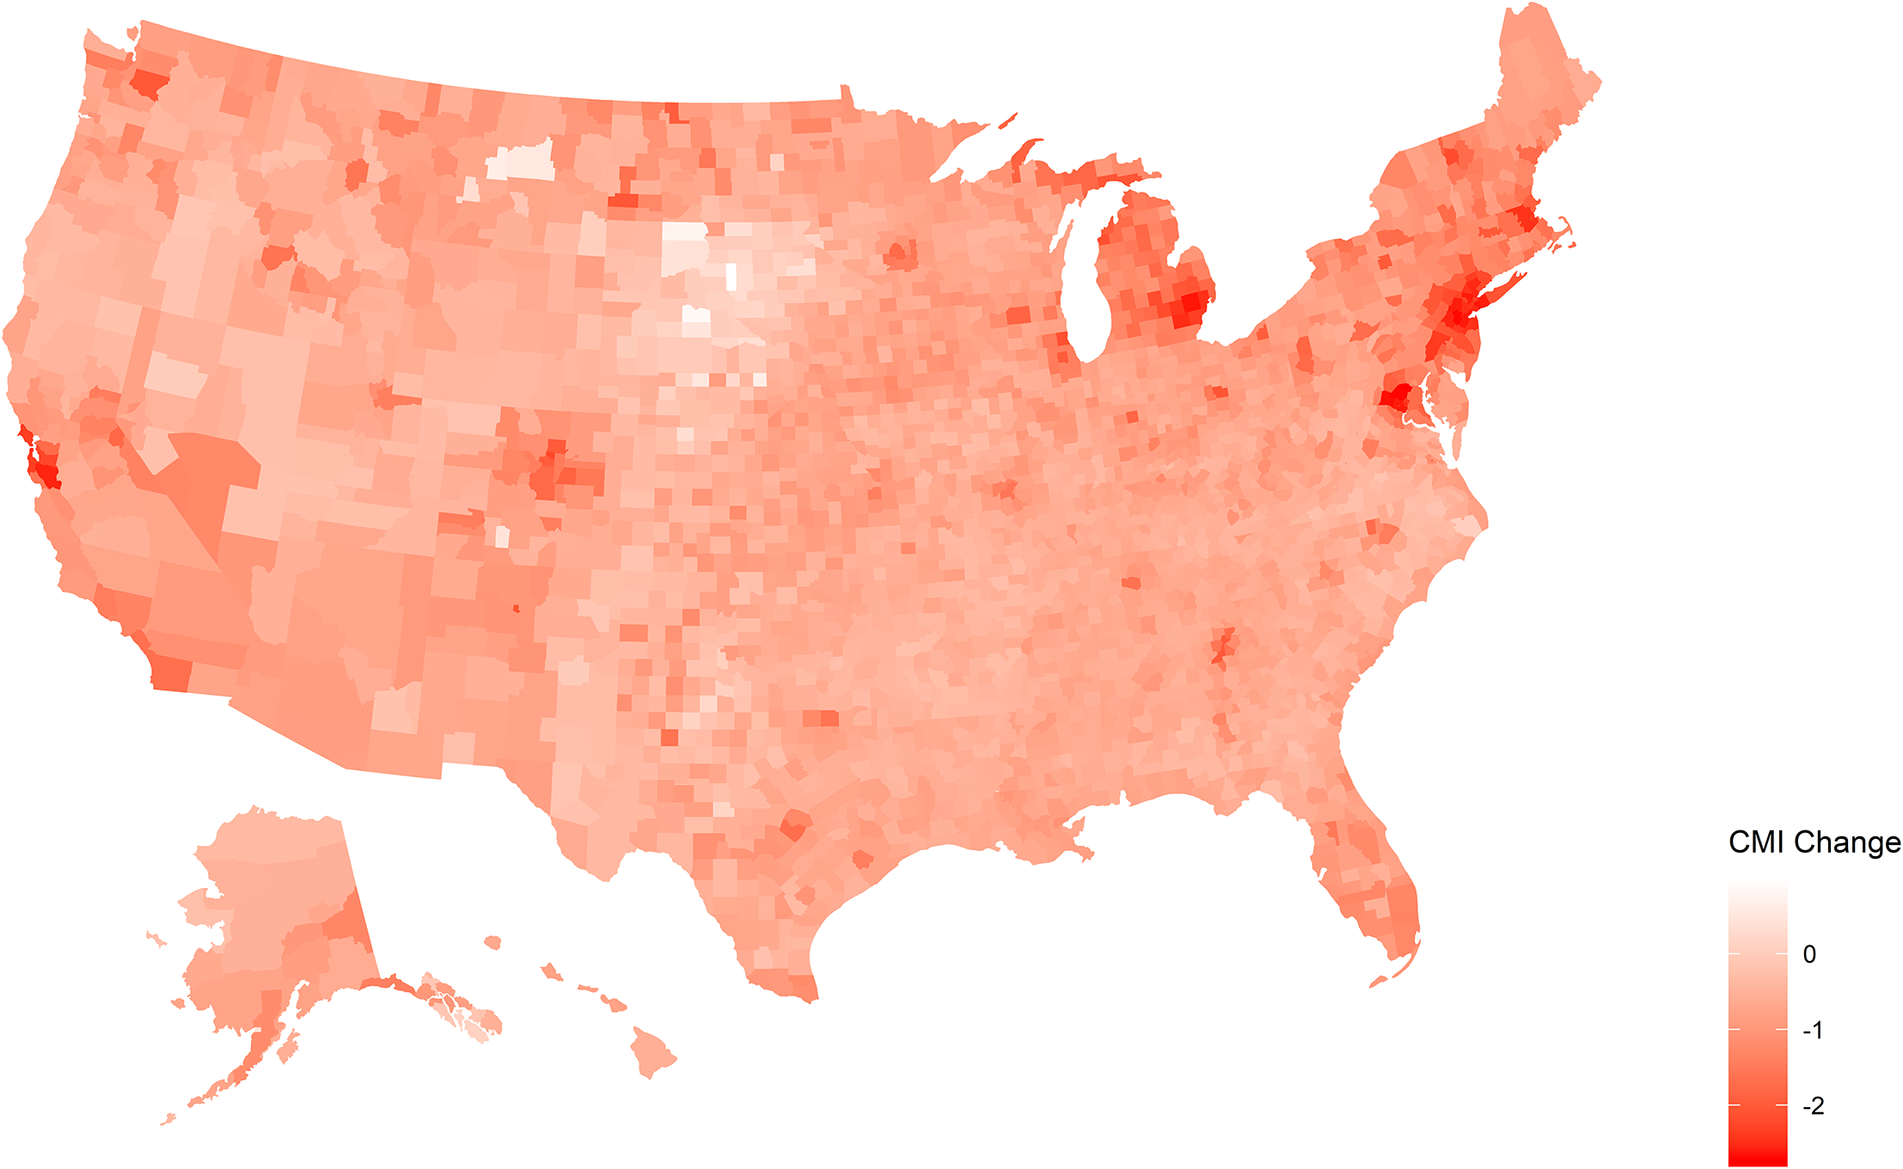
Figure 1 Mobility reduction by county
Note: Mobility reduction as measured by change in CMI between calendar week 15, 2019 and calendar week 15, 2020. Darker shades indicate larger changes in movement.
At different points across March and April, 2020, states mandated that their populations remain at home. Hence, we consider enactment of stay-at-home orders by state governments as our primary explanatory variable and label a state as “treated” when such a policy went into effect. Roll-out of stay-at-home orders is shown in figure 2 (Lee Reference Lee2020).Footnote 11 California was the first and only state to mandate a stay-at-home order during the twelfth calendar week (March 16–22). In contrast, several states never implemented an order during our time frame (in dark gray).
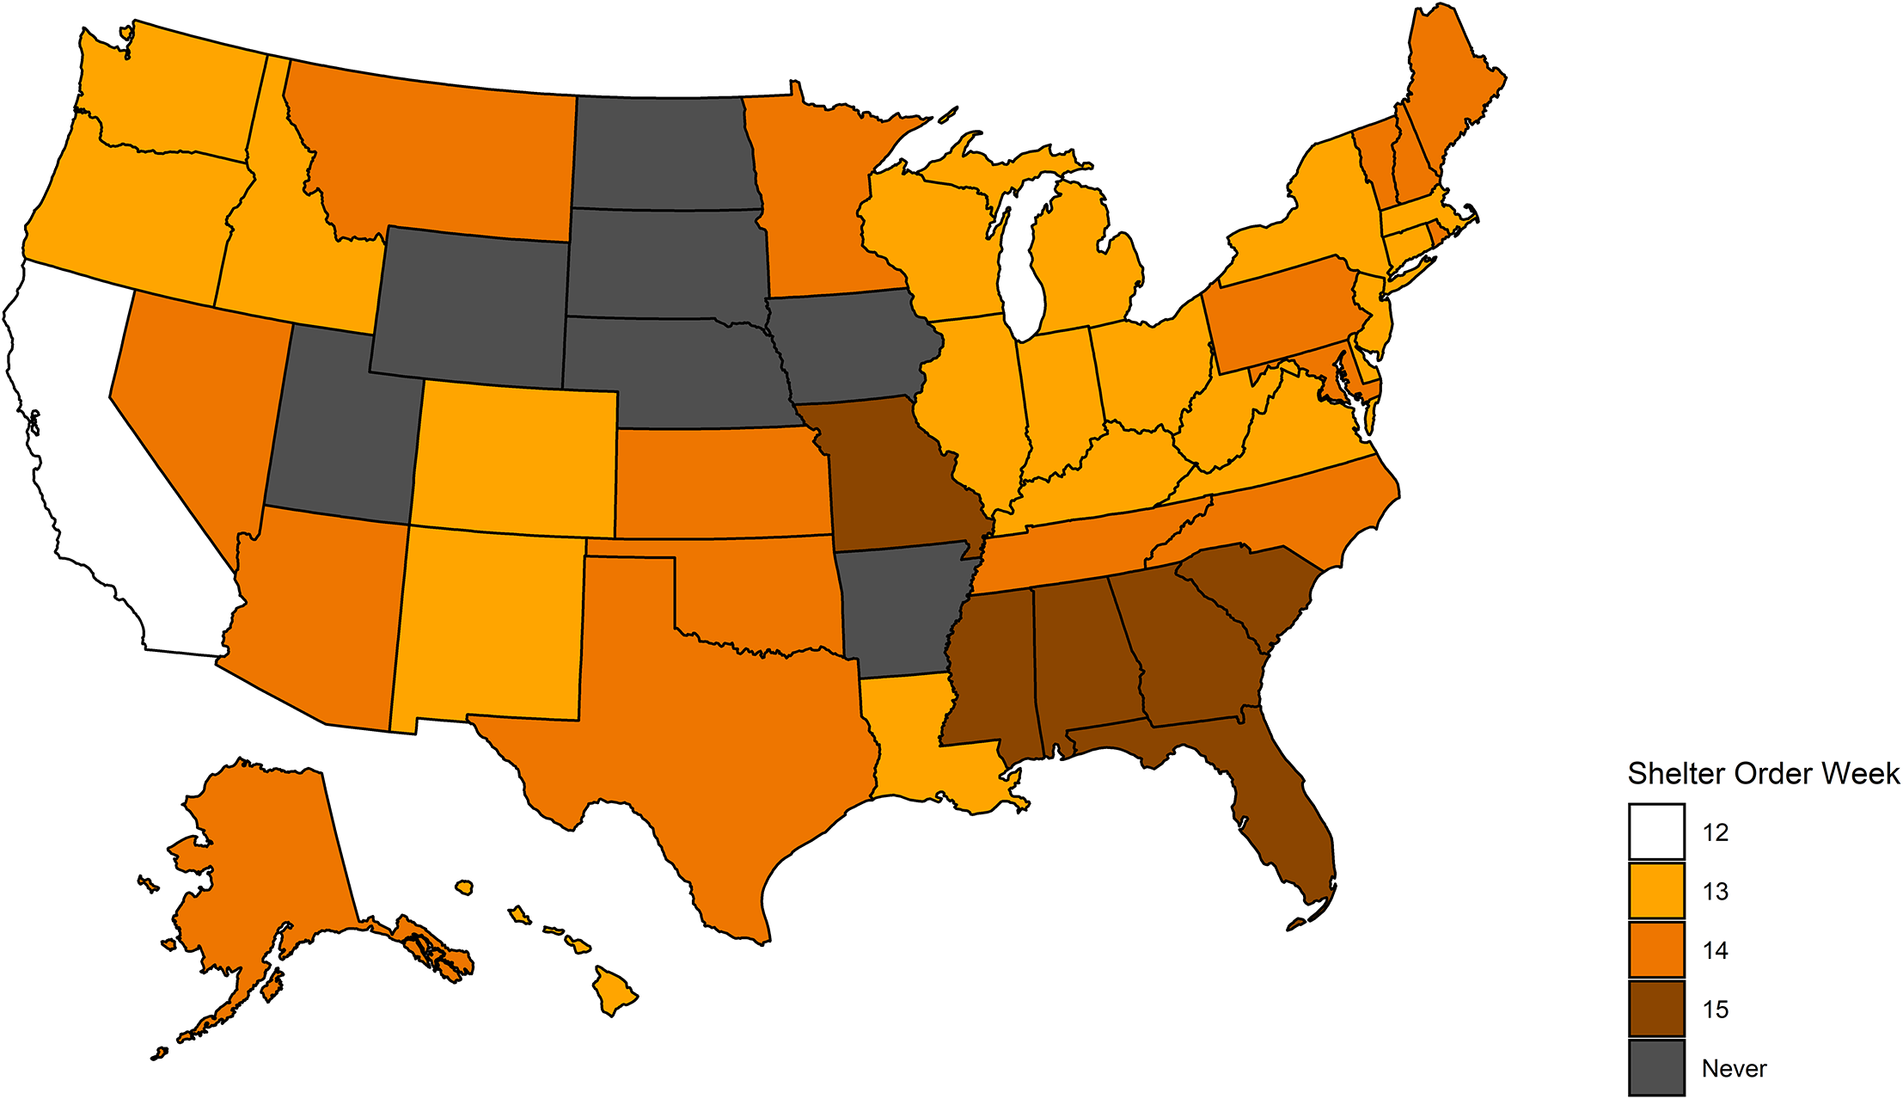
Figure 2 Calendar week of stay-at-home orders by state
Note: The darker the yellow shade, the later a given state has implemented a stay-at-home order. The dark-grey states did not mandate stay-at-home orders during the time frame of our study.
We capture county-level partisanship using results from the 2016 presidential election, which comes from the MIT Election Data Science Lab (MIT Election Data and Science Lab 2018). For social trust, we use the 2017 data and definition of social capital provided by the U.S. Congress Joint Economic Committee (United States Congress Joint Economic Comittee 2018). Their social capital index is composed of factors such as: turnout; response rate to the 2010 census; violent crimes; non-profits per capita; religious congregations per capita; and a family unity sub-index. Furthermore, for control variables, we rely on data from the Atlas of Rural and Small-Town America, provided by the U.S. Department of Agriculture (U.S. Department of Agriculture 2020).Footnote 12 This data captures population age and density; ethnic composition; income; unemployment; and education; economic sectors, as well as degree of ruralness.Footnote 13 , Footnote 14
In addition, we note that our approach comes with the drawback that we use aggregate measures in order to assess a theory based on individual-level behavior. Therefore, we acknowledge the potential for an ecological fallacy. However, we contend that the benefits of using real-world behavioral data to give insights into the importance of trust outweigh the drawbacks of this concern. Moreover, in our robustness section, we make use of multilevel regression and poststratification, which employs measures that are constructed based on individual-level surveys.
Design
In order to assess the effect of stay-at-home-orders on mobility, we employ a difference-in-differences design. This approach relies on a comparison between counties where a stay-at-home order was enacted—"treated counties”—to counties where no stay-at-home order was implemented—“untreated counties.” Then, this difference is contrasted with the difference between such counties before any stay-at-home orders were implemented. This methodology allows for the estimation of a causal effect under the “parallel trends” identification assumption that untreated counties may serve as a valid counterfactual for what would have occurred in treated counties had a stay-at-home order not been imposed. Thus, one must assume that, absent a stay-at-home order, the trajectory of county-level mobility in treated counties would have resembled the trajectory in untreated counties.
While the parallel trends assumption cannot be directly tested, it can be thought to hold should the mobility trend lines of treated and untreated counties prior to the roll-out of stay-at-home orders visually appear to be parallel. Figure 3 depicts mobility trends for three illustrative states (the geographical level where treatment occurs). Figure 4 groups data by roll-out week. In general, we find that, comparing the periods before the roll-out of stay-at-home orders, mobility trends in states with and without orders appear to be reasonably parallel. We argue that this provides validity for our research design (an extended discussion of this assumption may be found in the online appendix).Footnote 15
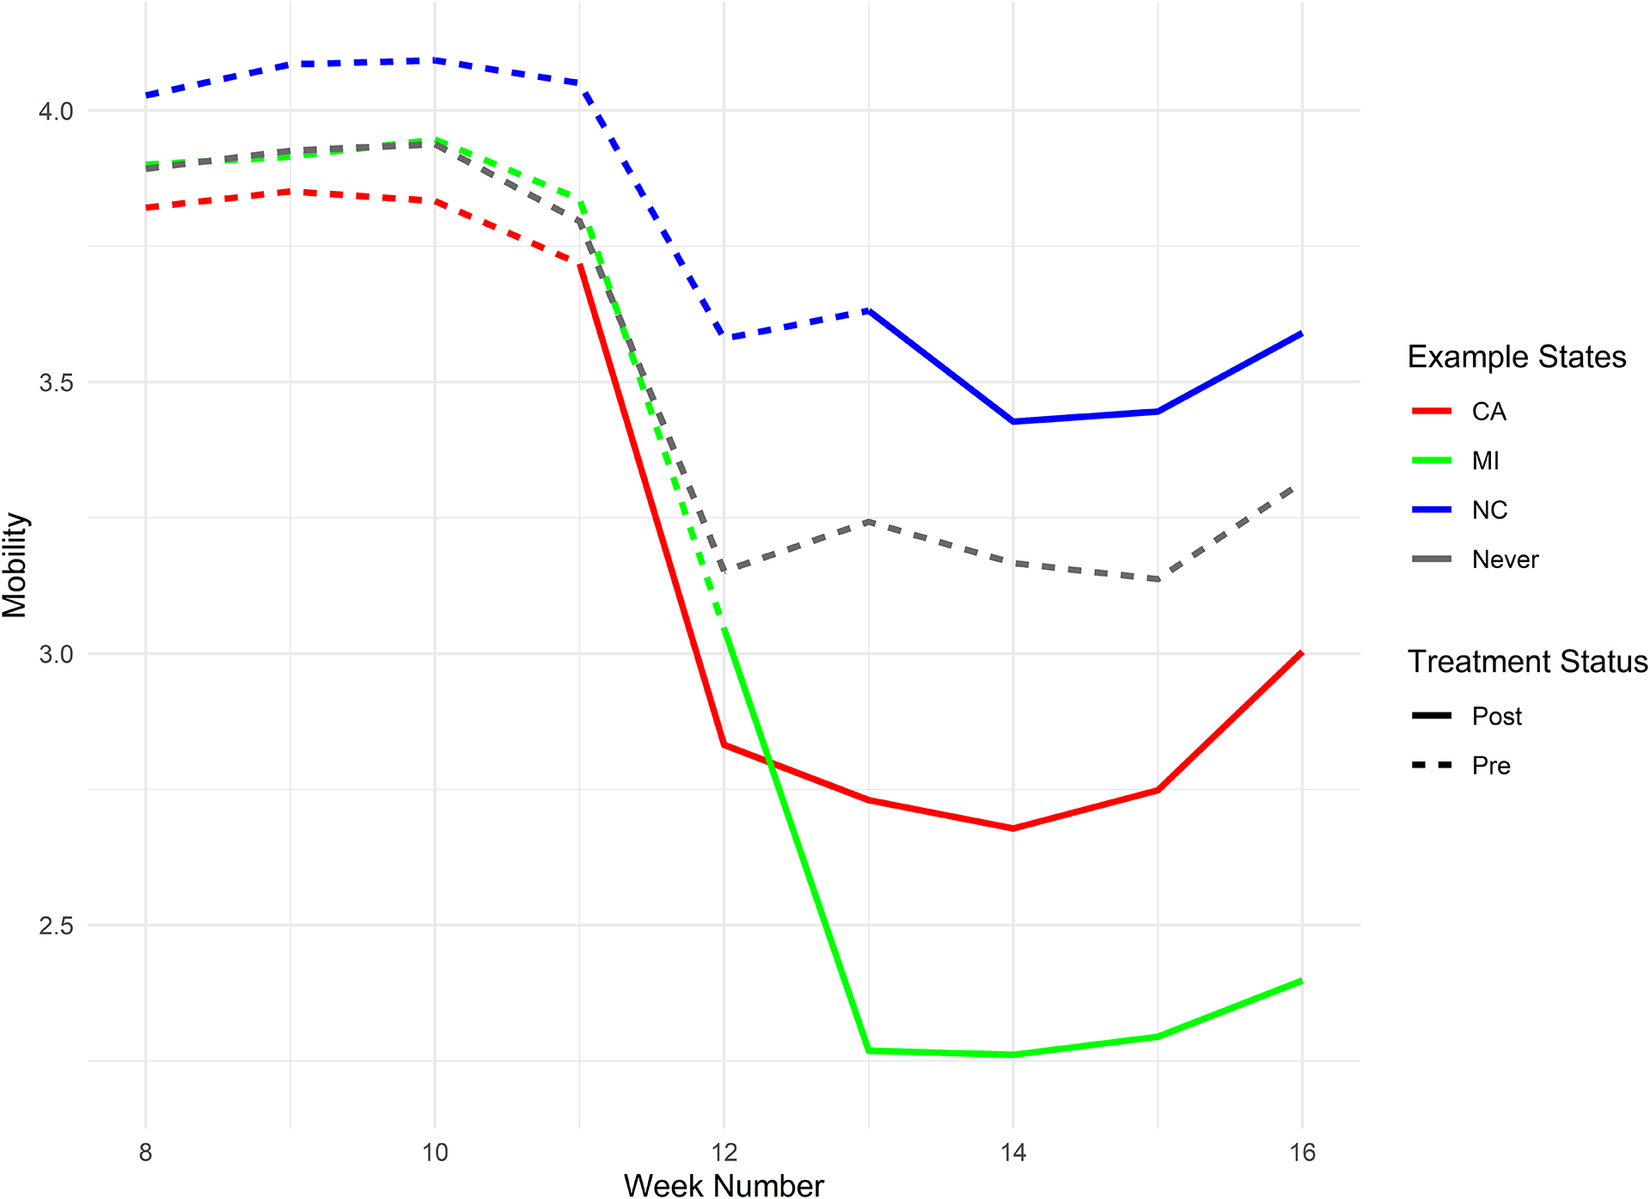
Figure 3 Mobility trends for select states
Note: Mobility trends for California, Michigan, and North Carolina. For pre-treatment weeks, the lines are dashed. They turn solid for the post-treatment weeks. The gray line represents the states that never implemented a stay-at-home order.
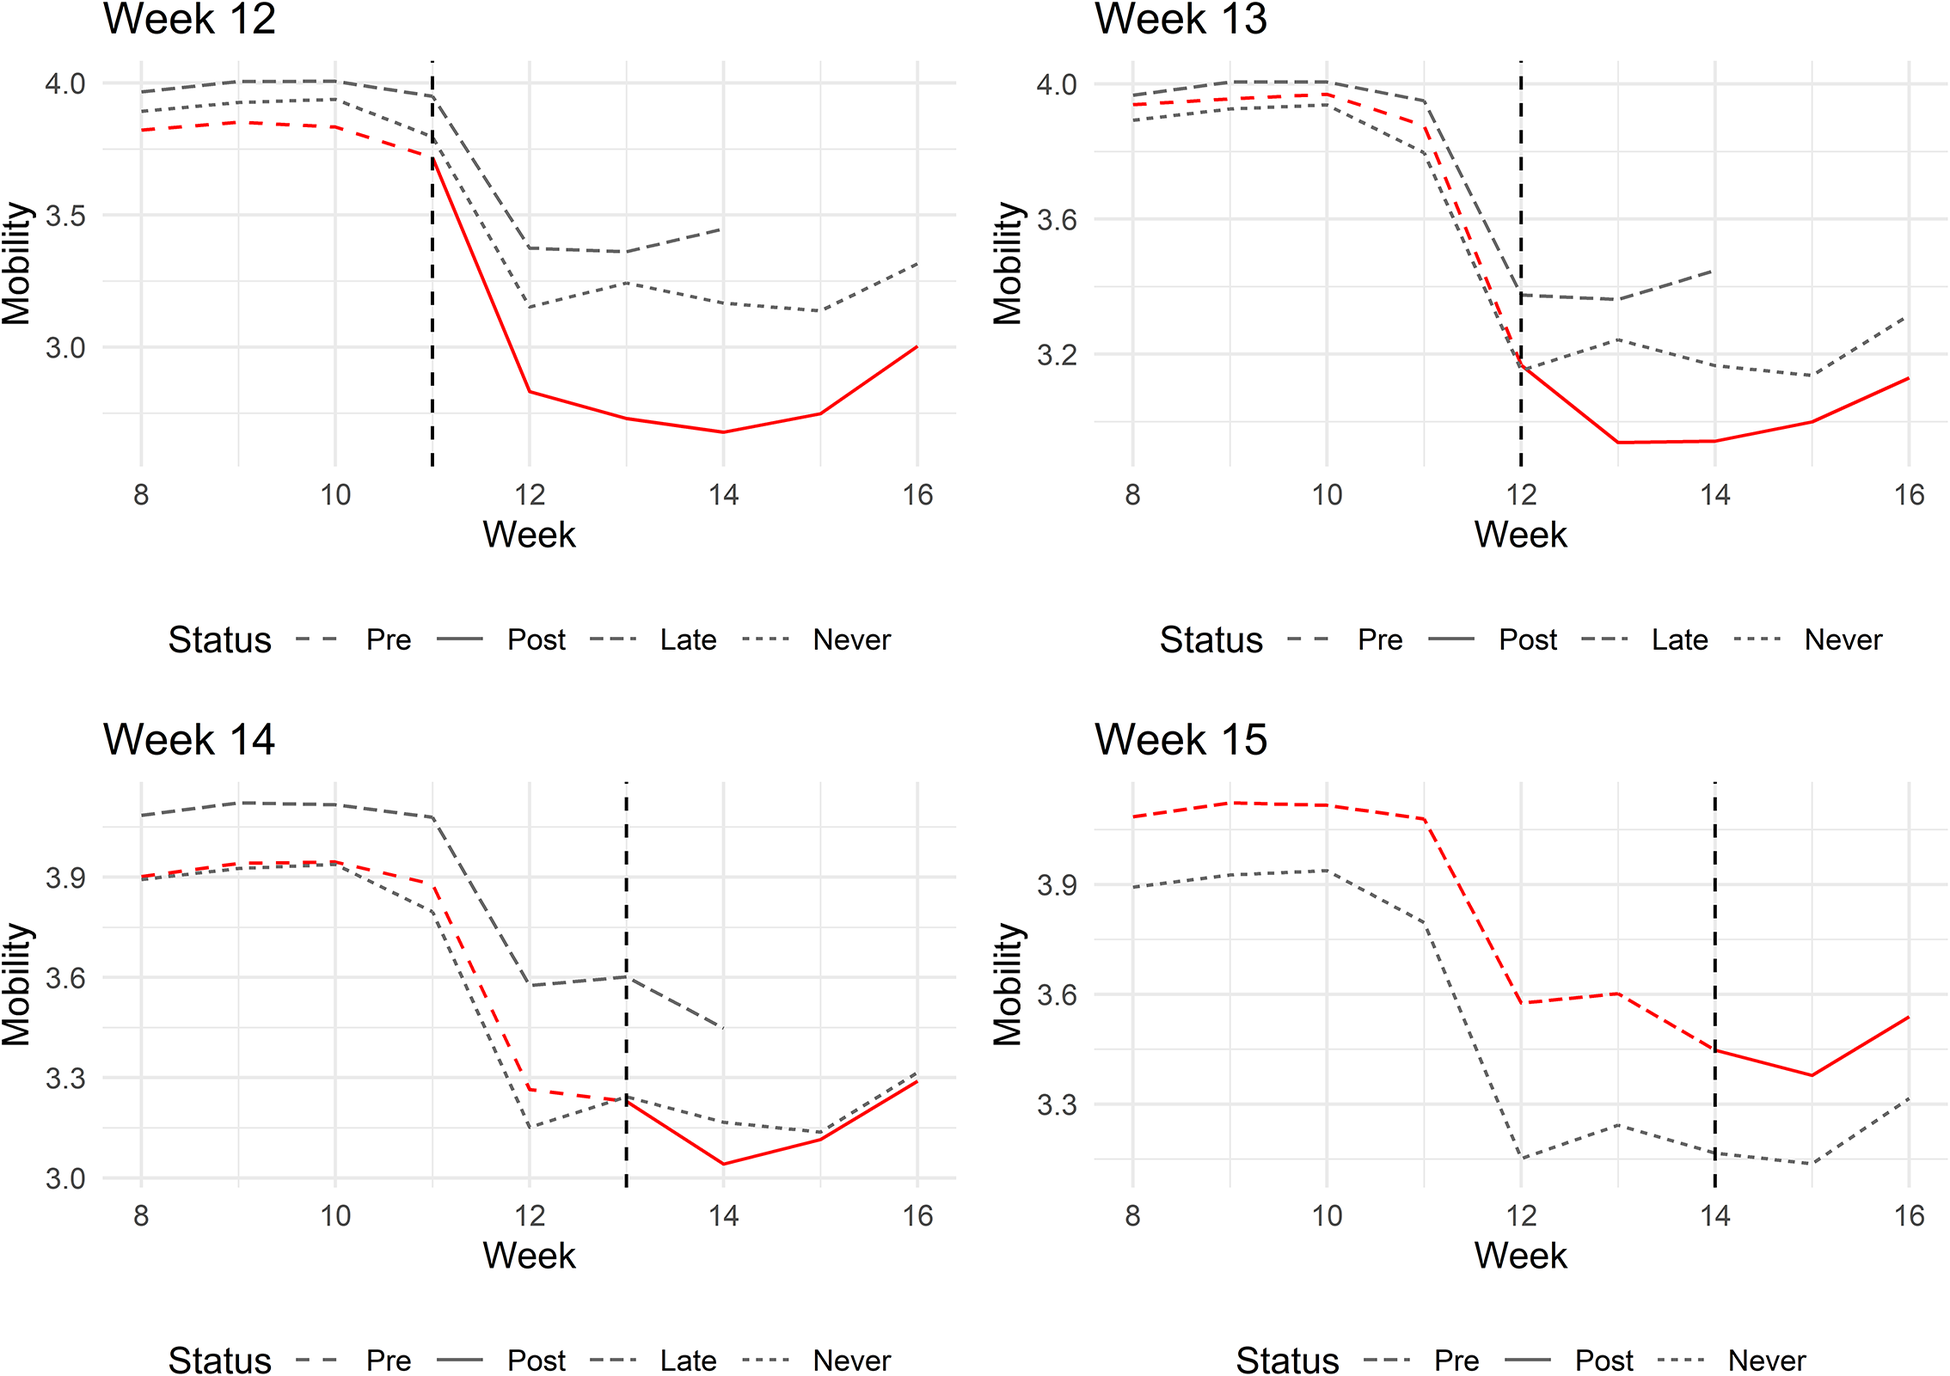
Figure 4 Mobility trends by treatment week
Note: Mobility trends by week in which states implemented stay-at-home orders. The gray lines represent trends for the states that implement orders late or not at all. The vertical dashed line is drawn at the last pre-treatment week.
Beyond estimating the direct effect of stay-at-home orders on mobility, we are interested in uncovering the impact of partisanship and social trust. To do so, we estimate interaction effects between a variable indicating enactment of stay-at-home orders (“Order” in the tables) as well as our given outcome of interest. Note that interaction coefficients capture a descriptive, rather than causal, effect.Footnote 16
In an attempt to mitigate omitted variable bias from factors potentially correlated with mobility and our outcomes of interest, we control for a set of demographic and economic covariates (see table 1). We also include one specification that controls for the mobility (CMI) of a given county and week exactly one year earlier. For example, for Los Angeles county in the fifteenth calendar week, 2020, we control for Los Angeles’s CMI from the fifteenth calendar week, 2019. We believe that this should further reduce the impact of potential unobserved confounders that differ across counties. Moreover, in the online appendix, we present a balance table with respect to stay-at-home order roll-out status. While there appears to be moderate imbalance, it is reassuring that our results generally are robust to several model specifications that take into account our covariates. Standard errors are clustered at the state-level, although they decrease when clustering by state and time (month). While our preferred specification takes counties as the unit of analysis, we also include population weighted models in our results.
Table 1 Effects of stay-at-home orders
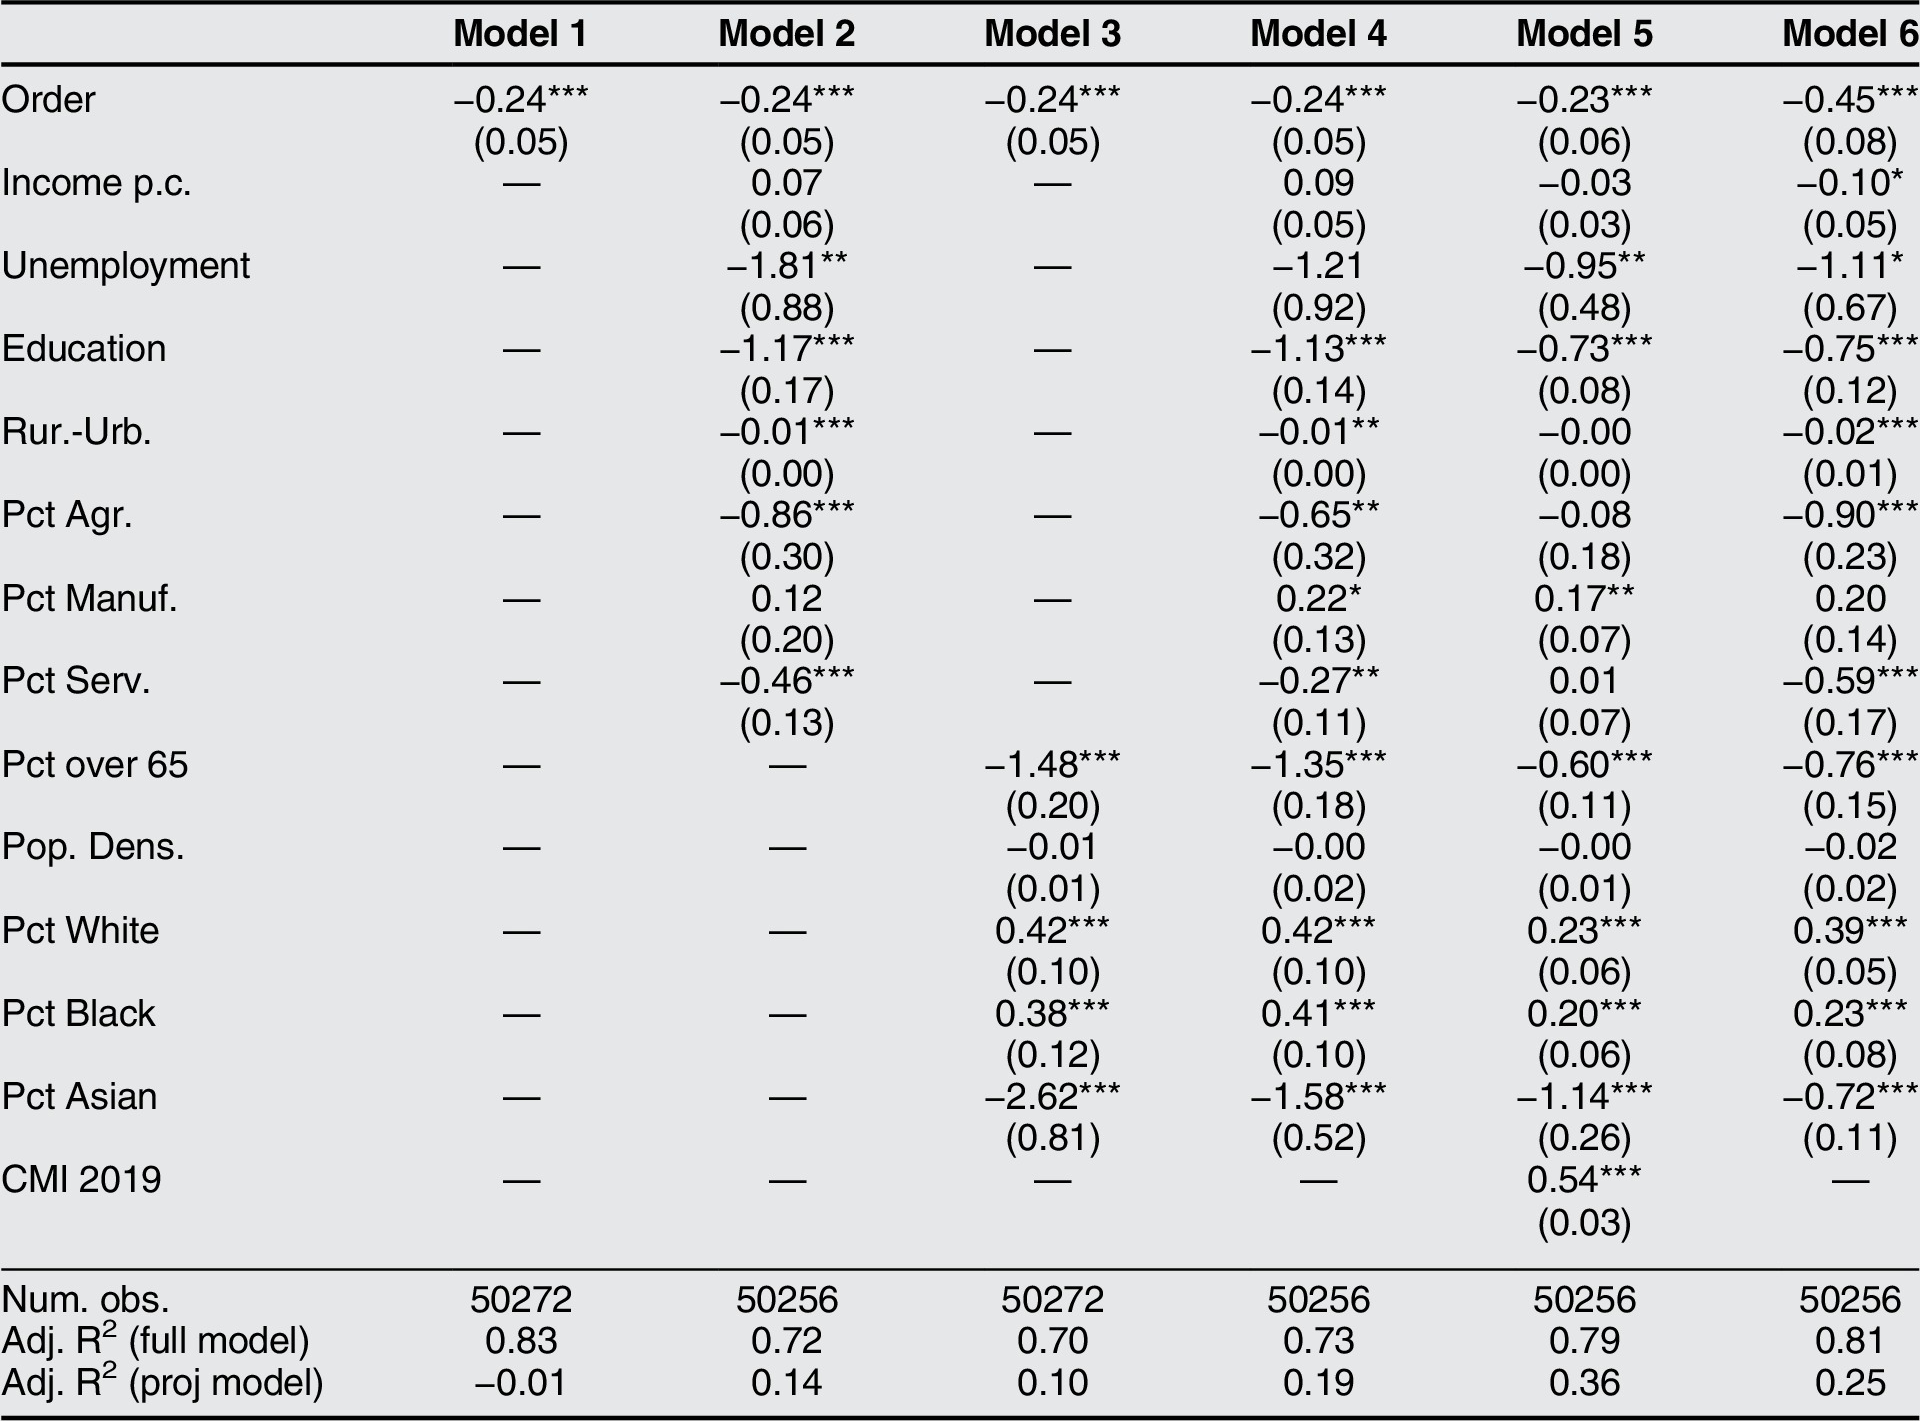
Note: The dependent variable is mobility (CMI). Model 1 includes county and week fixed effects. All other models include state and week fixed effects. Model 6 is weighted by population. Standard errors are clustered by state. The following applies to all tables (unless otherwise noted): ‘Order’ captures whether an order was in place in a county in a given week; ‘Income p.c.’ is income per capita (logged) in a county in 2018; ‘Unemployment’ is the unemployment rate in a county in 2018; ‘Education’ is the percentage of the population with at least a college degree in 2010; ‘Rur.-Urb.’ is a rural-urban continuum variable, recorded in 2010; ‘Pct Agr.,’ ‘Pct Manuf.,’ and ‘Pct Serv.’ capture the percentage of the population in the agricultural, manufacturing, and service sectors, respectively (all from the year 2010); ‘Pct over 65’ is the percentage of population over age 65 in 2010; and ‘Pct Black,’ ‘Pct White,’ and ‘Pct Asian’ capture the percentage racial composition of a county in 2010; ‘Pop. Dens.’ stands for logged population density in 2010; and ‘CMI 2019’ is the mobility for a county in a given week for the respective 2019 reference week. *** p < 0.01,** p < 0.05,* p < 0.1.
Results
Causal Effect of Stay-at-Home Orders
In table 1, we establish that stay-at-home orders have a statistically significant and substantively large causal effect on mobility.Footnote 17 Stay-at-home orders lead to a decrease in mobility of about half a standard deviation. Substantively, this may be interpreted as a 24% reduction in traveled distance. For the population weighted specification, this effect measures an even larger 45%. The effect is robust to the inclusion of economic and demographic controls. Note that the coefficients for the control variables generally point in the expected direction, for example, the percentage over 65 years old is associated with lower mobility. In the online appendix, we decompose and further discuss these effects utilizing a method proposed by Goodman-Bacon (Reference Goodman-Bacon2018).Footnote 18
Partisanship
In order to assess our hypothesis that partisanship affects compliance, we investigate the heterogeneous treatment effect of stay-at-home orders with respect to partisanship. That is, we examine if Republicans comply less strictly with stay-at-home orders, which we contend is due to their greater mistrust of science and government interventions.
We present mobility across time by partisanship in figure 5 (by state) and figure 6 (aggregated across states).Footnote 19 The figures show that Democratic-leaning counties generally appear to experience a larger mobility decrease. Note that, due to the logged nature of our mobility measure, differences between counties that may appear small can be of sizable magnitude. The dashed vertical line in these figures (as well as similar markings in other figures) denote the last pre-treatment week. The diverging lines after the treatment date suggest that there is a significant gap in compliance between Republican-leaning and Democratic-leaning counties. In addition, note that the two groups already display slightly diverging trends in the last week before roll-out. This may attenuate the extent to which our measured effects are due to difference in compliance across Republican-leaning and Democratic-leaning counties. However, we nonetheless find it reassuring that, before this point, the trends appear to be parallel.
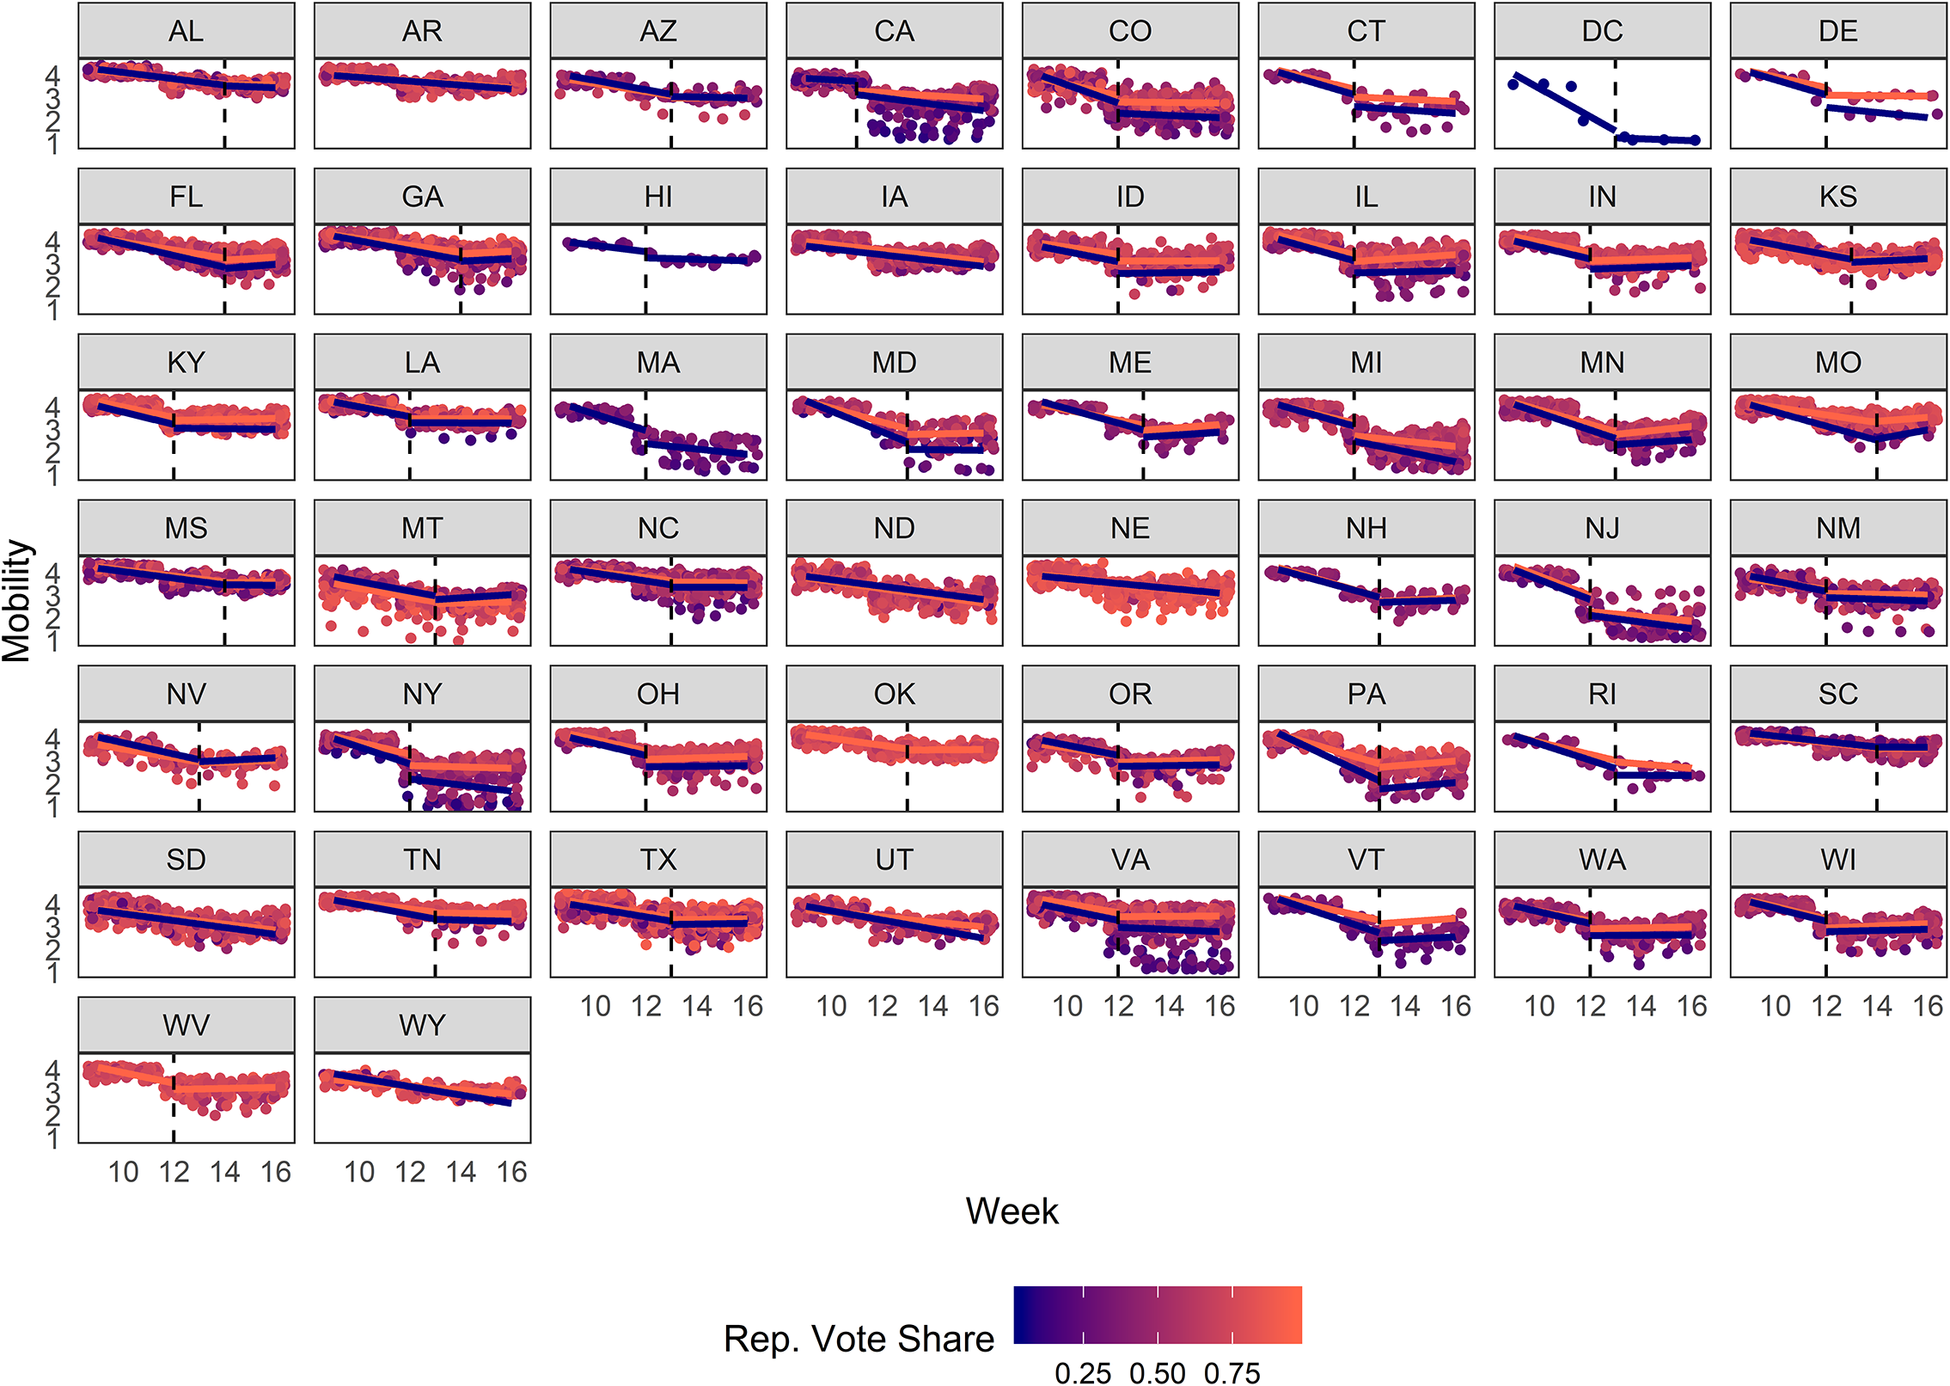
Figure 5 Mobility trends by state and partisanship
Note: Each dot represents a county. The shade between red and blue indicates a county’s vote share for the Republican Party. The red and the blue lines, respectively, represent the mobility trends for the counties where the majority voted for the Republican and Democratic candidate in the 2016 presidential election. Separate linear trend lines for the pre- and post-treatment periods are included; two single trend lines are included for never-treated states. The vertical dashed lines indicate the last pre-treatment week.
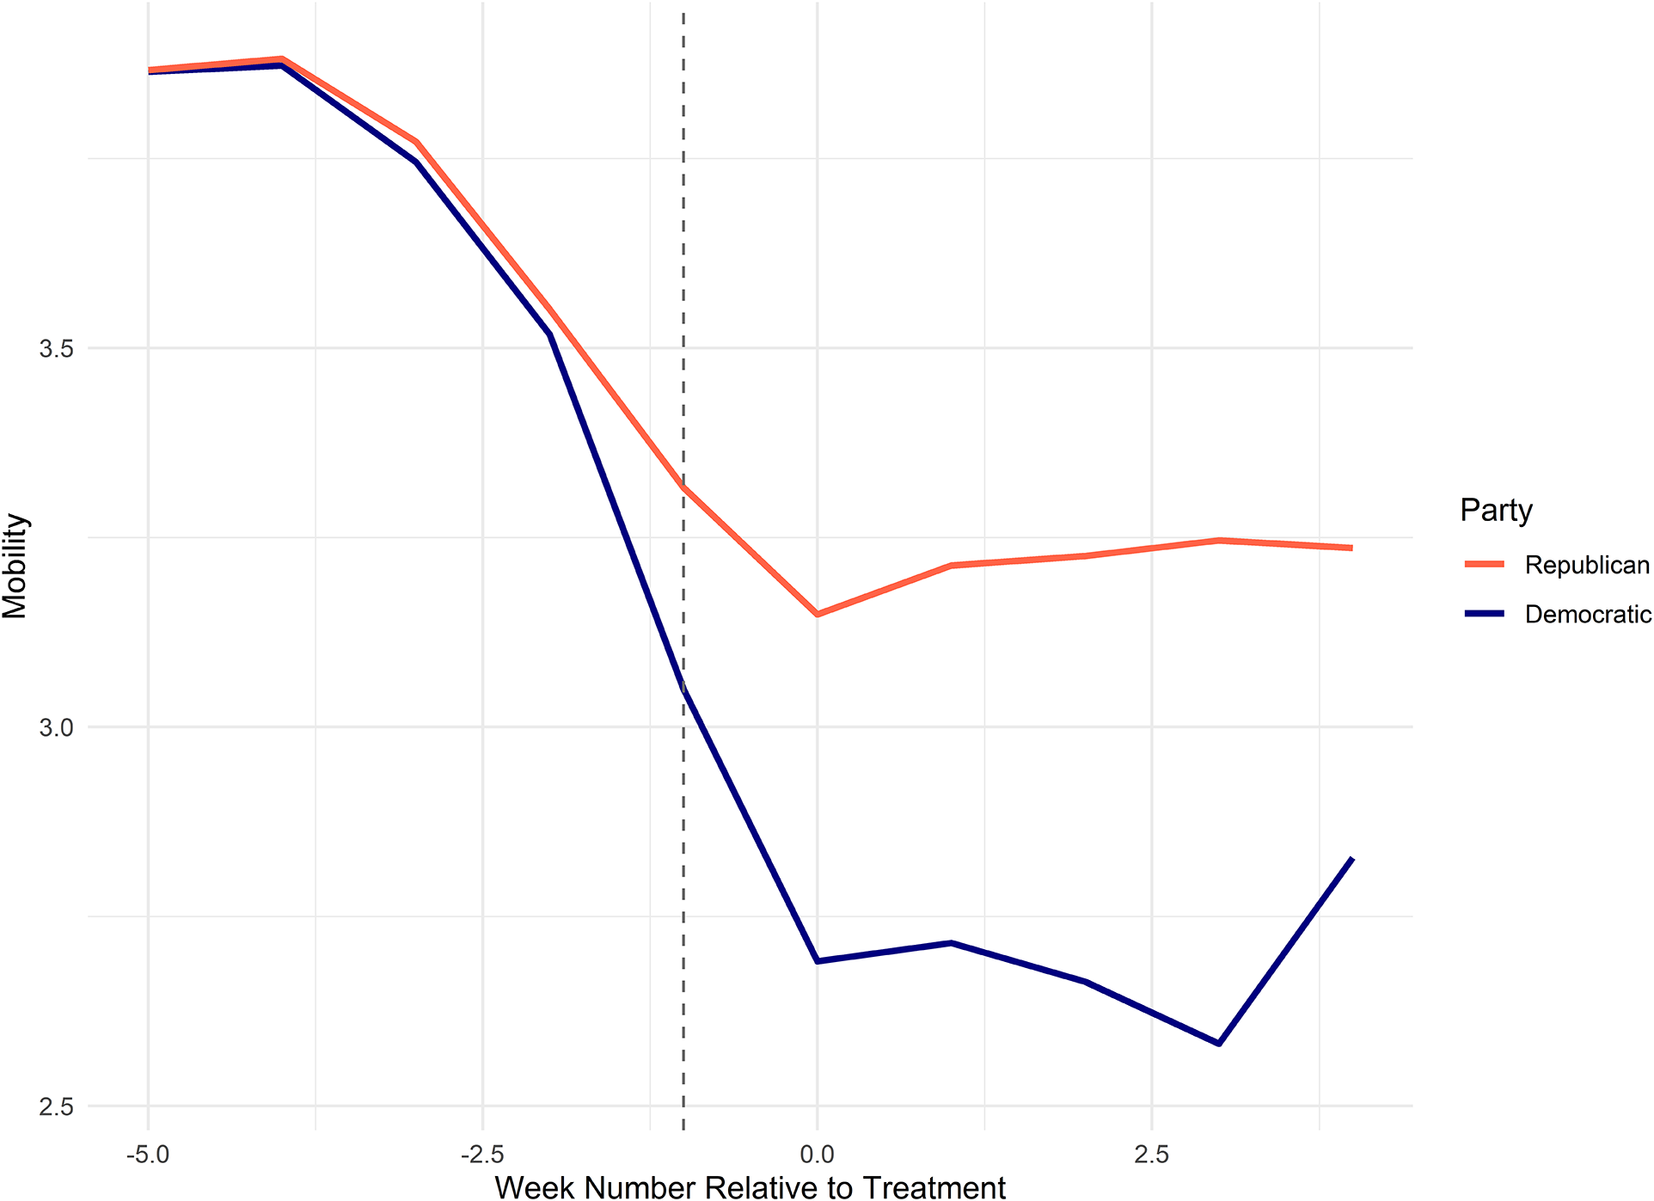
Figure 6 Mobility trends by partisanship
Note: Mobility trends for counties where the majority voted for the Republican candidate or Democratic candidate, respectively, in the 2016 presidential election. The vertical line marks the last pre-treatment week.
In table 2, we use regression analysis to reaffirm our graphical results. We find that Republican-leaning counties experience a lower reduction in mobility in response to stay-at-home orders compared to Democratic-leaning counties, which we interpret as Republicans complying less with mitigation orders. The effect is statistically significant at the 1% level in all specifications. Substantively, a 10% vote share increase for Republicans in a given county is associated with a 11%–12% decrease in the direct reductive effect of stay-at-home orders on traveled distance. Moreover, the effect is even stronger in the population-weighted specification. Overall, our results are supportive of our hypothesis that Republican-leaning counties appear to follow stay-at-home orders less than Democratic-leaning counties.
Table 2 Partisan effects of stay-at-home orders
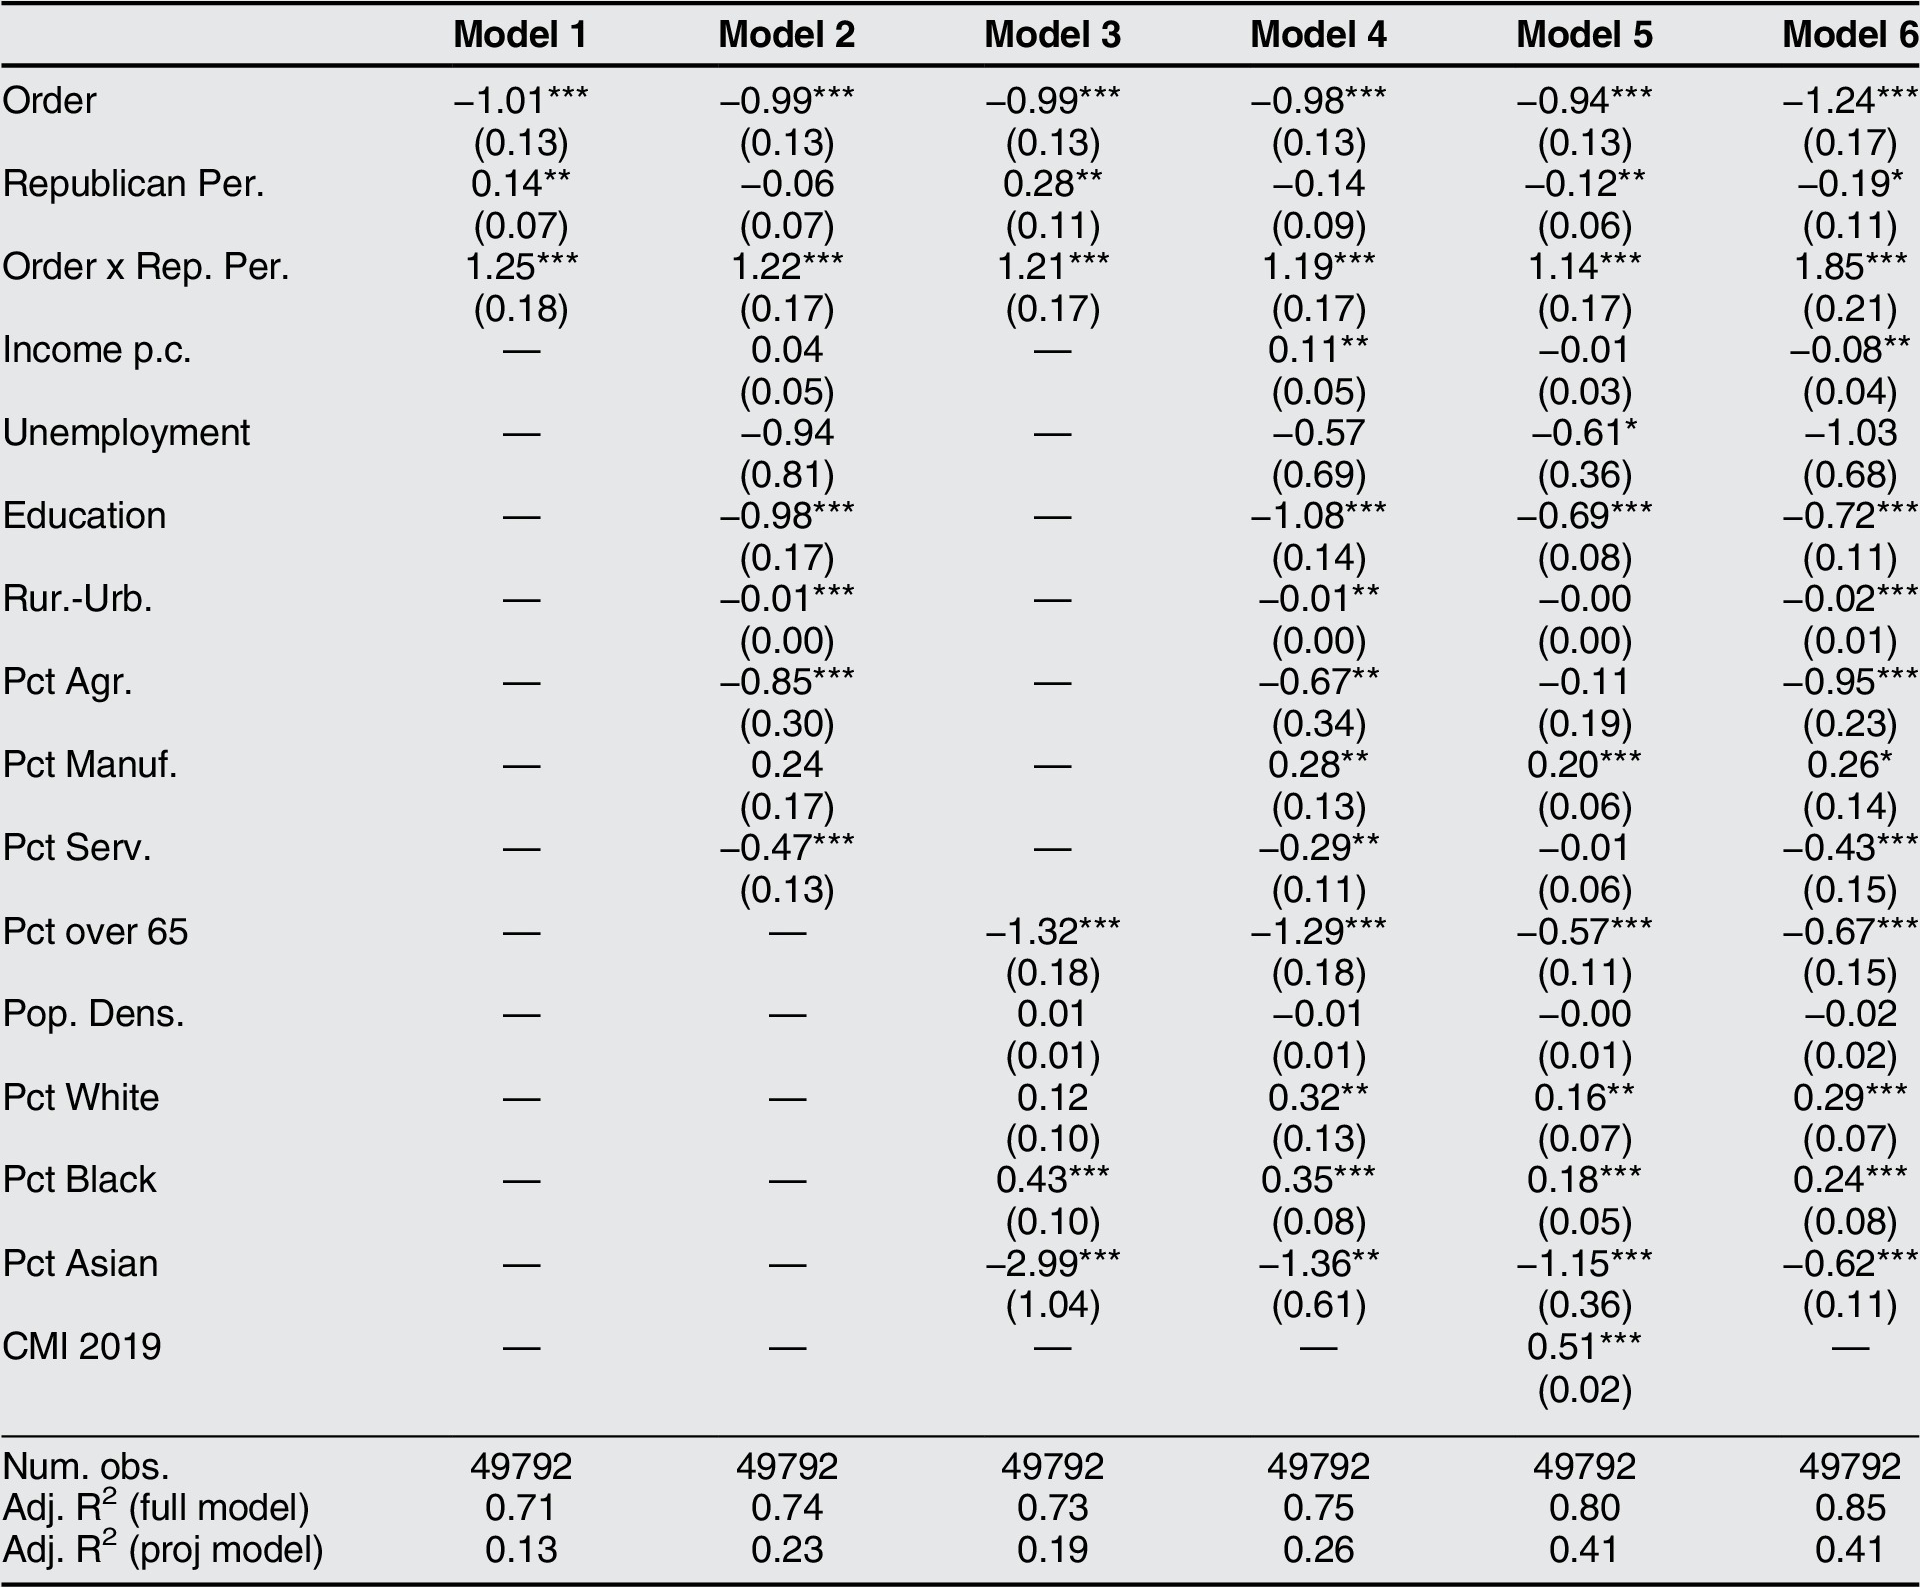
Note: The dependent variable is mobility (CMI). All models include state and week fixed effects. Model 6 is weighted by population. Standard errors are clustered by state. ‘Republican per.’ is the vote share for Republicans in the 2016 presidential election. ‘Order x Rep. Per.’ is the interaction effect of stay-at-home orders and Republican vote share. *** p < 0.01,** p < 0.05,* p < 0.1.
Co-Partisanship
We next test our hypothesis that individuals comply more with stay-at-home orders issued by a co-partisan politician. Returning to figure 5, consider the comparison of Pennsylvania, led by Democratic Governor Tom Wolf, and Ohio, led by Republican Governor Mike DeWine. Republican-leaning counties in Pennsylvania, where a political opponent is governor, appear to have reduced their mobility at considerably lower rates than Democratic-leaning counties. In comparison, following a stay-at-home order, Republican-leaning counties in Ohio, where a co-partisan is governor, appear to have curtailed movement at levels closer to those experienced in Democratic-leaning counties.
Turning to our regression analysis, table 3 shows that when stay-at-home orders were given by a Republican governor rather than a Democratic governor, the compliance gap between Republican-leaning and Democratic-leaning counties shrinks by about 5%–7% when comparing two counties whose Republican vote share differ by 10%. That is, comparing a county with Republican vote share of 55% with a county with Republican vote share of 45%, the difference in mobility reduction in response to stay-at-home orders is 5%–7% lower when the order has been given by a Republican governor instead of a Democratic one. This corresponds to closing about half the total compliance gap due to partisanship alone. However, we caution that the results fall short of statistical significance at conventional levels in some specifications.Footnote 20 Nevertheless, this result suggests that co-partisanship affects compliance with government orders and underscores the role of partisan trust for policy compliance.
Table 3 Co-partisan effects of stay-at-home orders
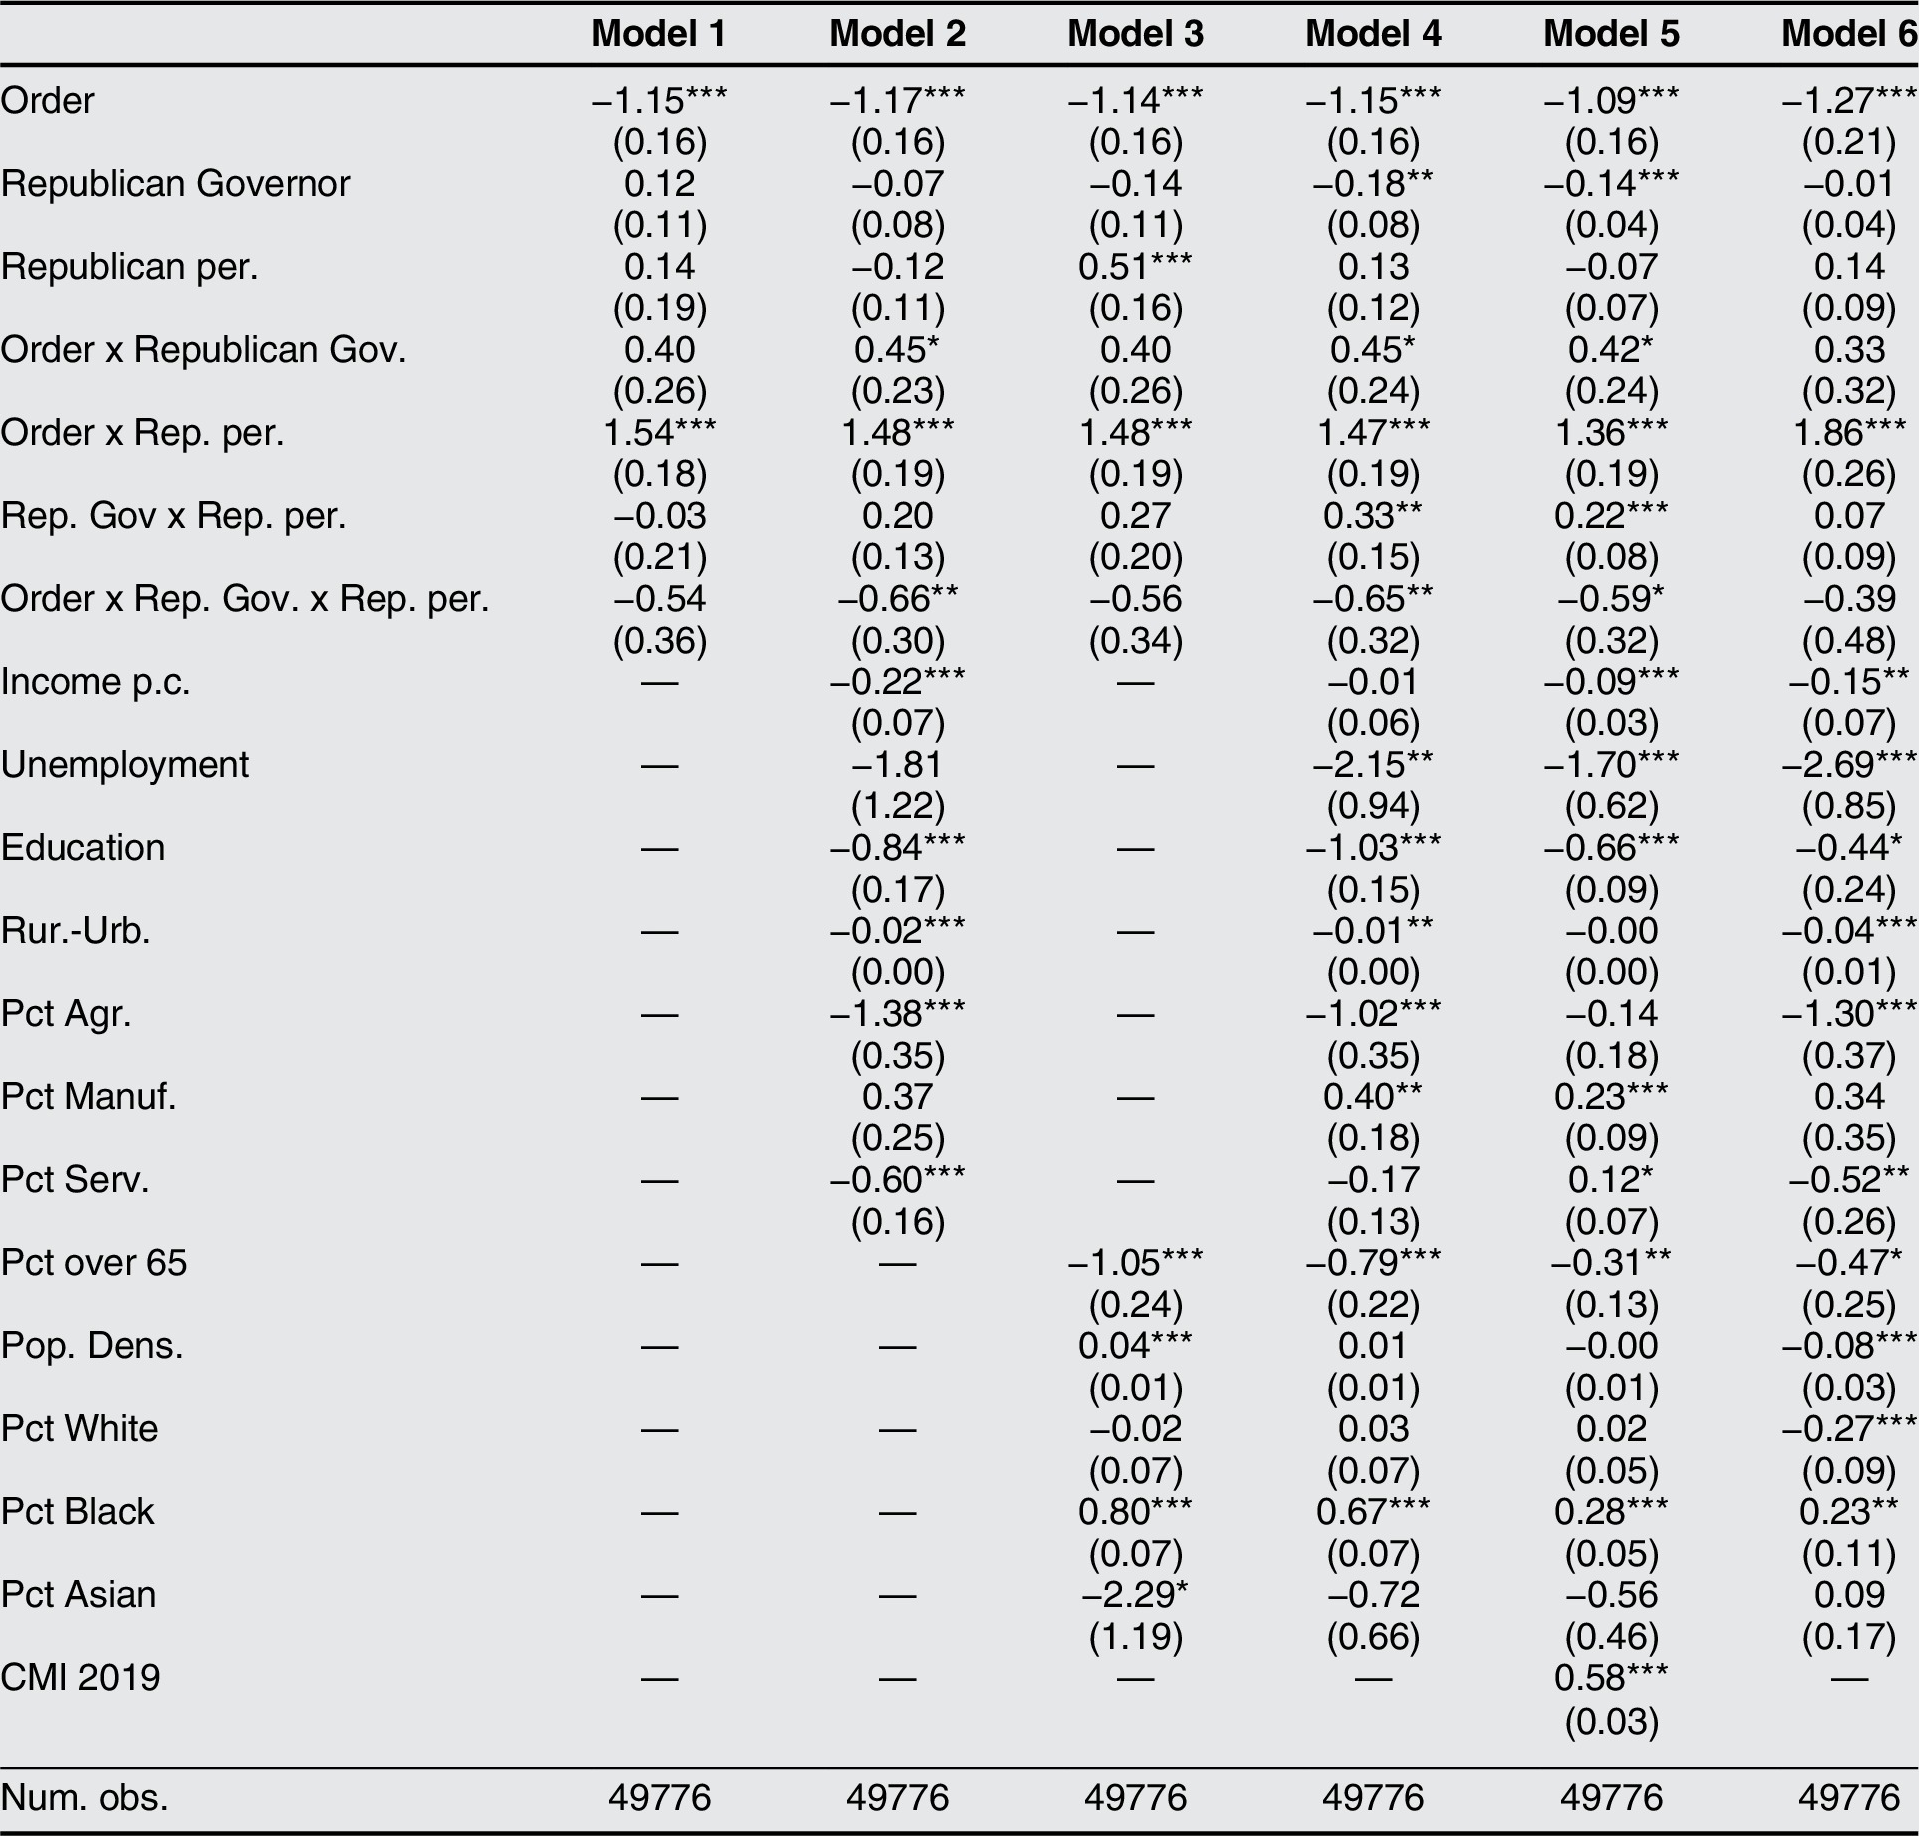
Note: The dependent variable is mobility (CMI). All models include week fixed effects. Model 6 is weighted by population. Standard errors are clustered by state. ‘Republican Governor’ takes the value 1 if a state is governed by a Republican and 0 otherwise. ‘Republican per.’ stands for Republican vote share in the 2016 presidential election. Rows 4 through 6 capture the two-way interaction effects among ‘Order’ and the partisanship variables. Row 7 captures the triple interaction effect. Adj. R-squared is omitted to save space. *** p < 0.01,** p < 0.05,* p < 0.1.
Social Trust
We argue that higher social trust may orient an individual towards helping society and, in the context of the COVID-19 pandemic, capture willingness to comply with stay-at-home orders. To analyze this hypothesis, we operationalize social trust via a measure of social capital. We visually present mobility across time by comparing counties with high and low levels of social capital (cut at the median value) in figure 7 (by state) and figure 8 (aggregated across states). High social capital counties appear to experience higher mobility declines after stay-at-home orders were mandated compared to counties with low social capital.
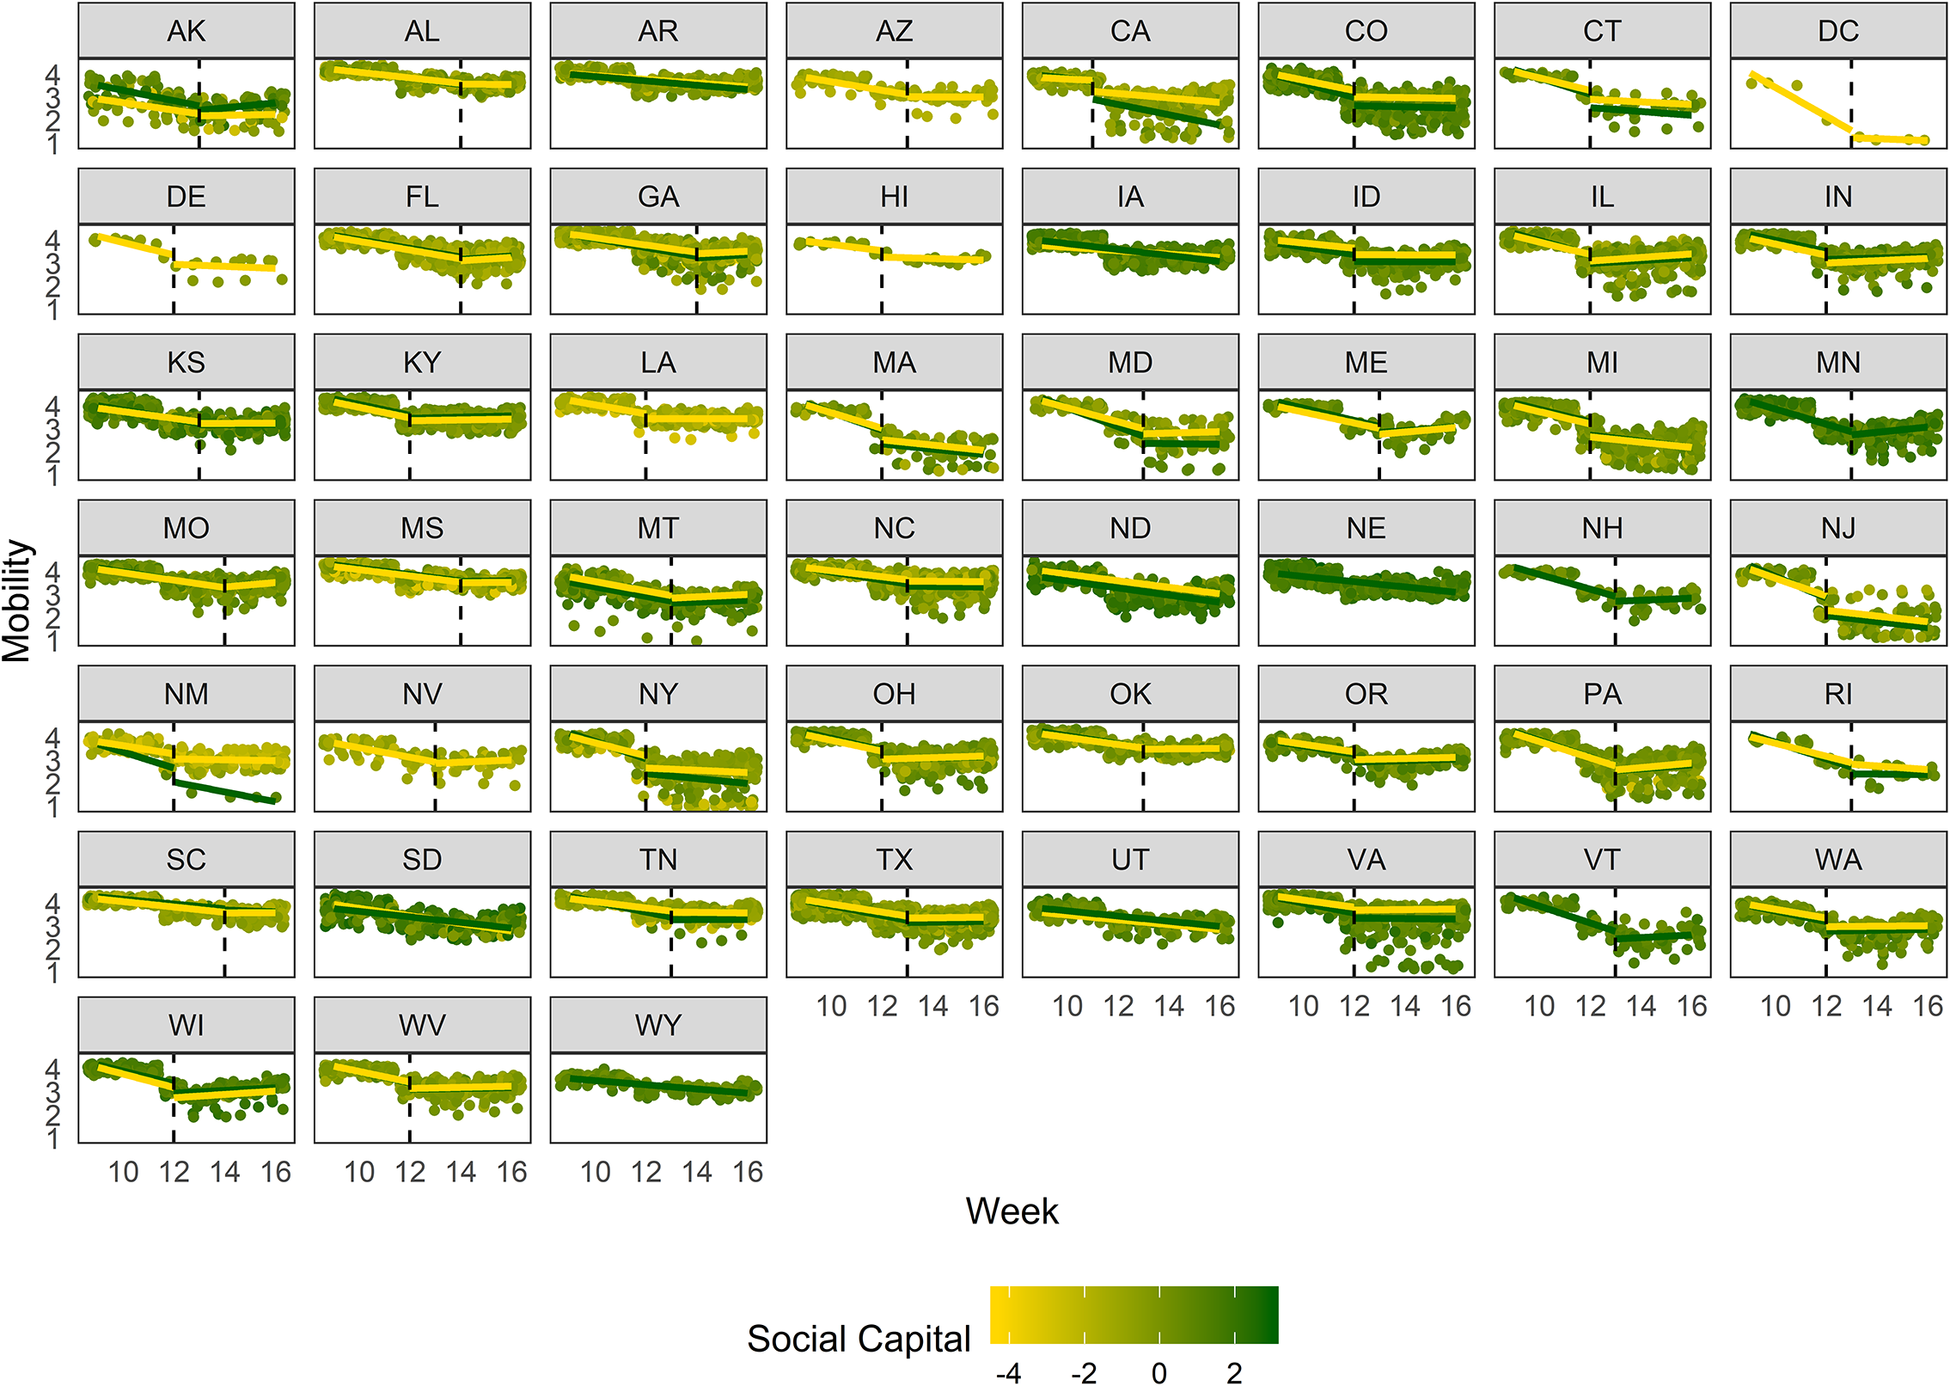
Figure 7 Mobility trends by state and social capital
Note: Each dot represents a county. The shade between yellow and green indicates a county’s social capital. The yellow and the green lines, respectively, represent mobility trends for high and low social capital counties (divided at the median value). Separate linear trend lines for the pre- and post-treatment periods are shown; two single trend lines are included for never-treated states. The vertical dashed line indicates the last pre-treatment week.
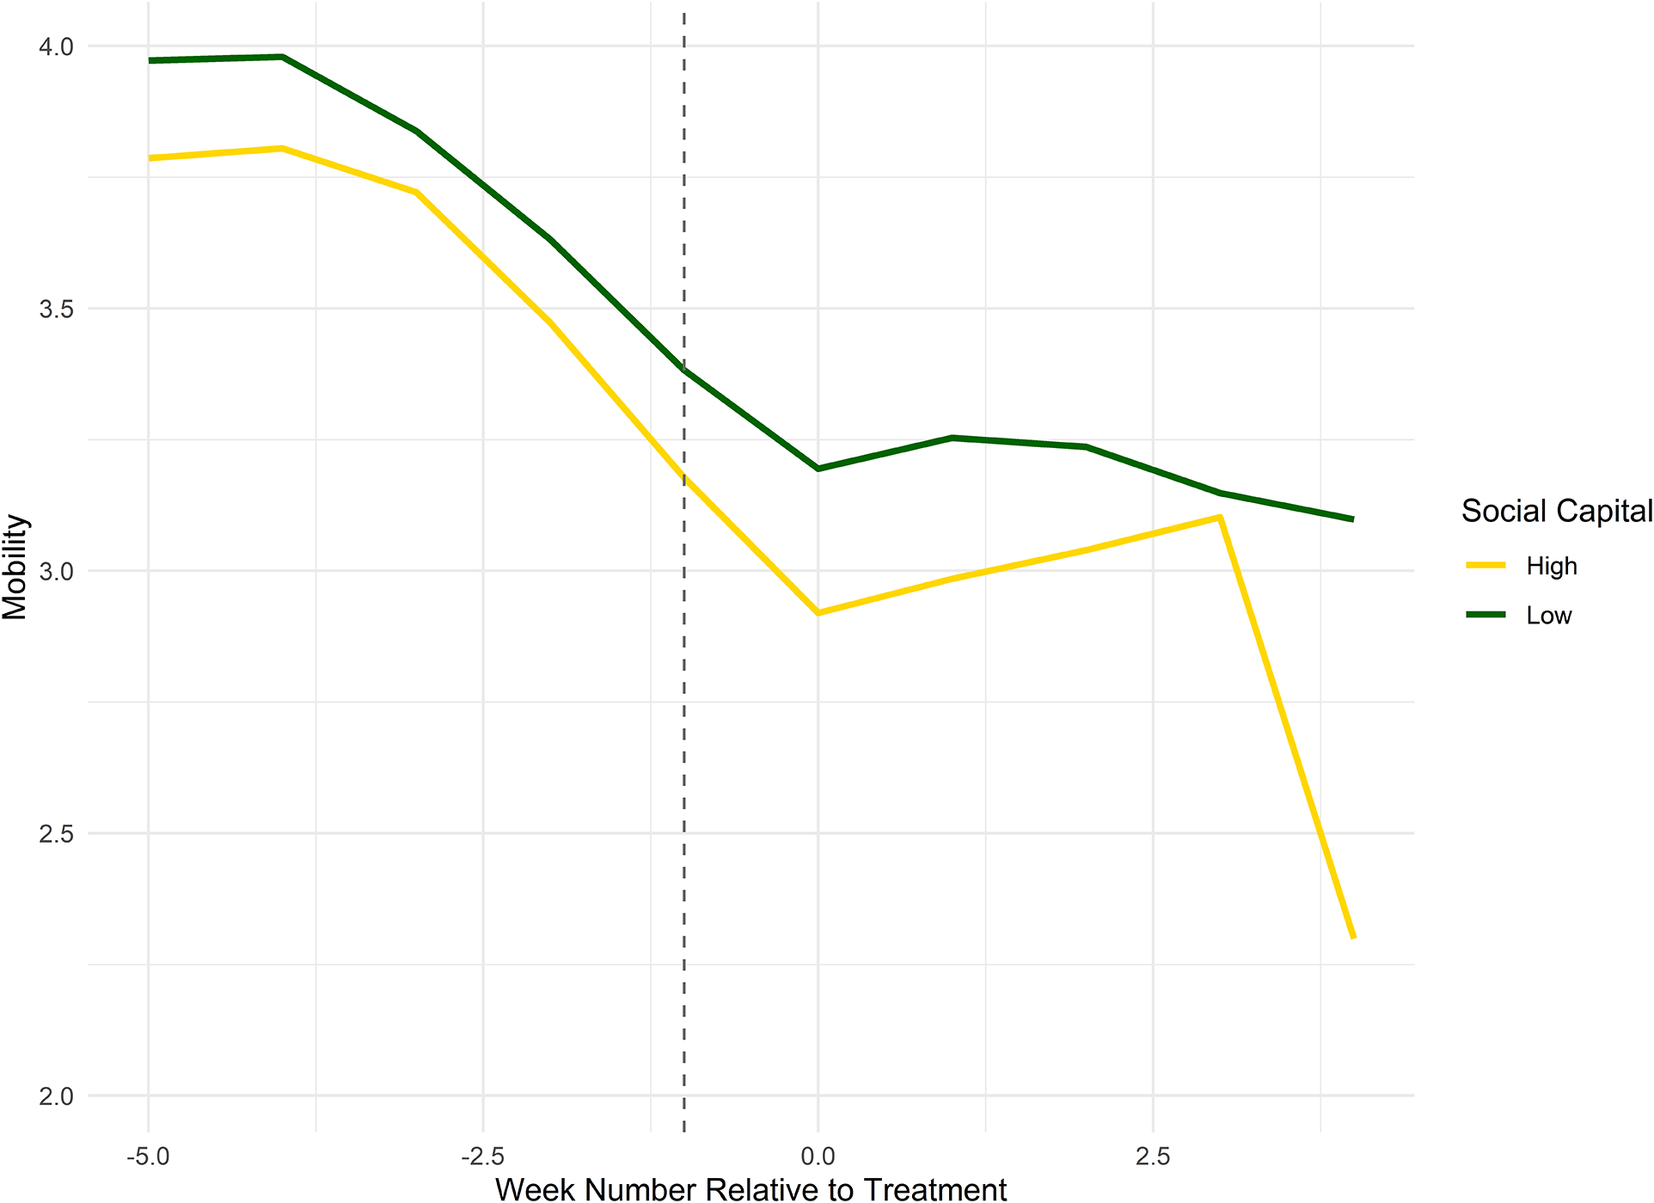
Figure 8 Mobility trends by social capital
Note: Mobility trends for counties with high and low social capital (split at the median value). The vertical line marks the last pre-treatment week.
The regression analysis in table 4 also suggests that social capital may bolster the effectiveness of stay-at-home orders.Footnote 21 A one standard deviation increase in social capital is associated with an additional reduction in traveled distance by 7%–12% following a stay-at-home order. The effect is statistically significant in all specifications. In addition, for robustness, we consider the model with respect to turnout. We find similarly significant effects, which we report in the online appendix.Footnote 22 , Footnote 23 Overall, the results are supportive of our hypothesis that social trust is associated with higher rates of compliance, although we note that its effects are an order of magnitude below those found for partisanship.
Table 4 Social capital effects of stay-at-home orders
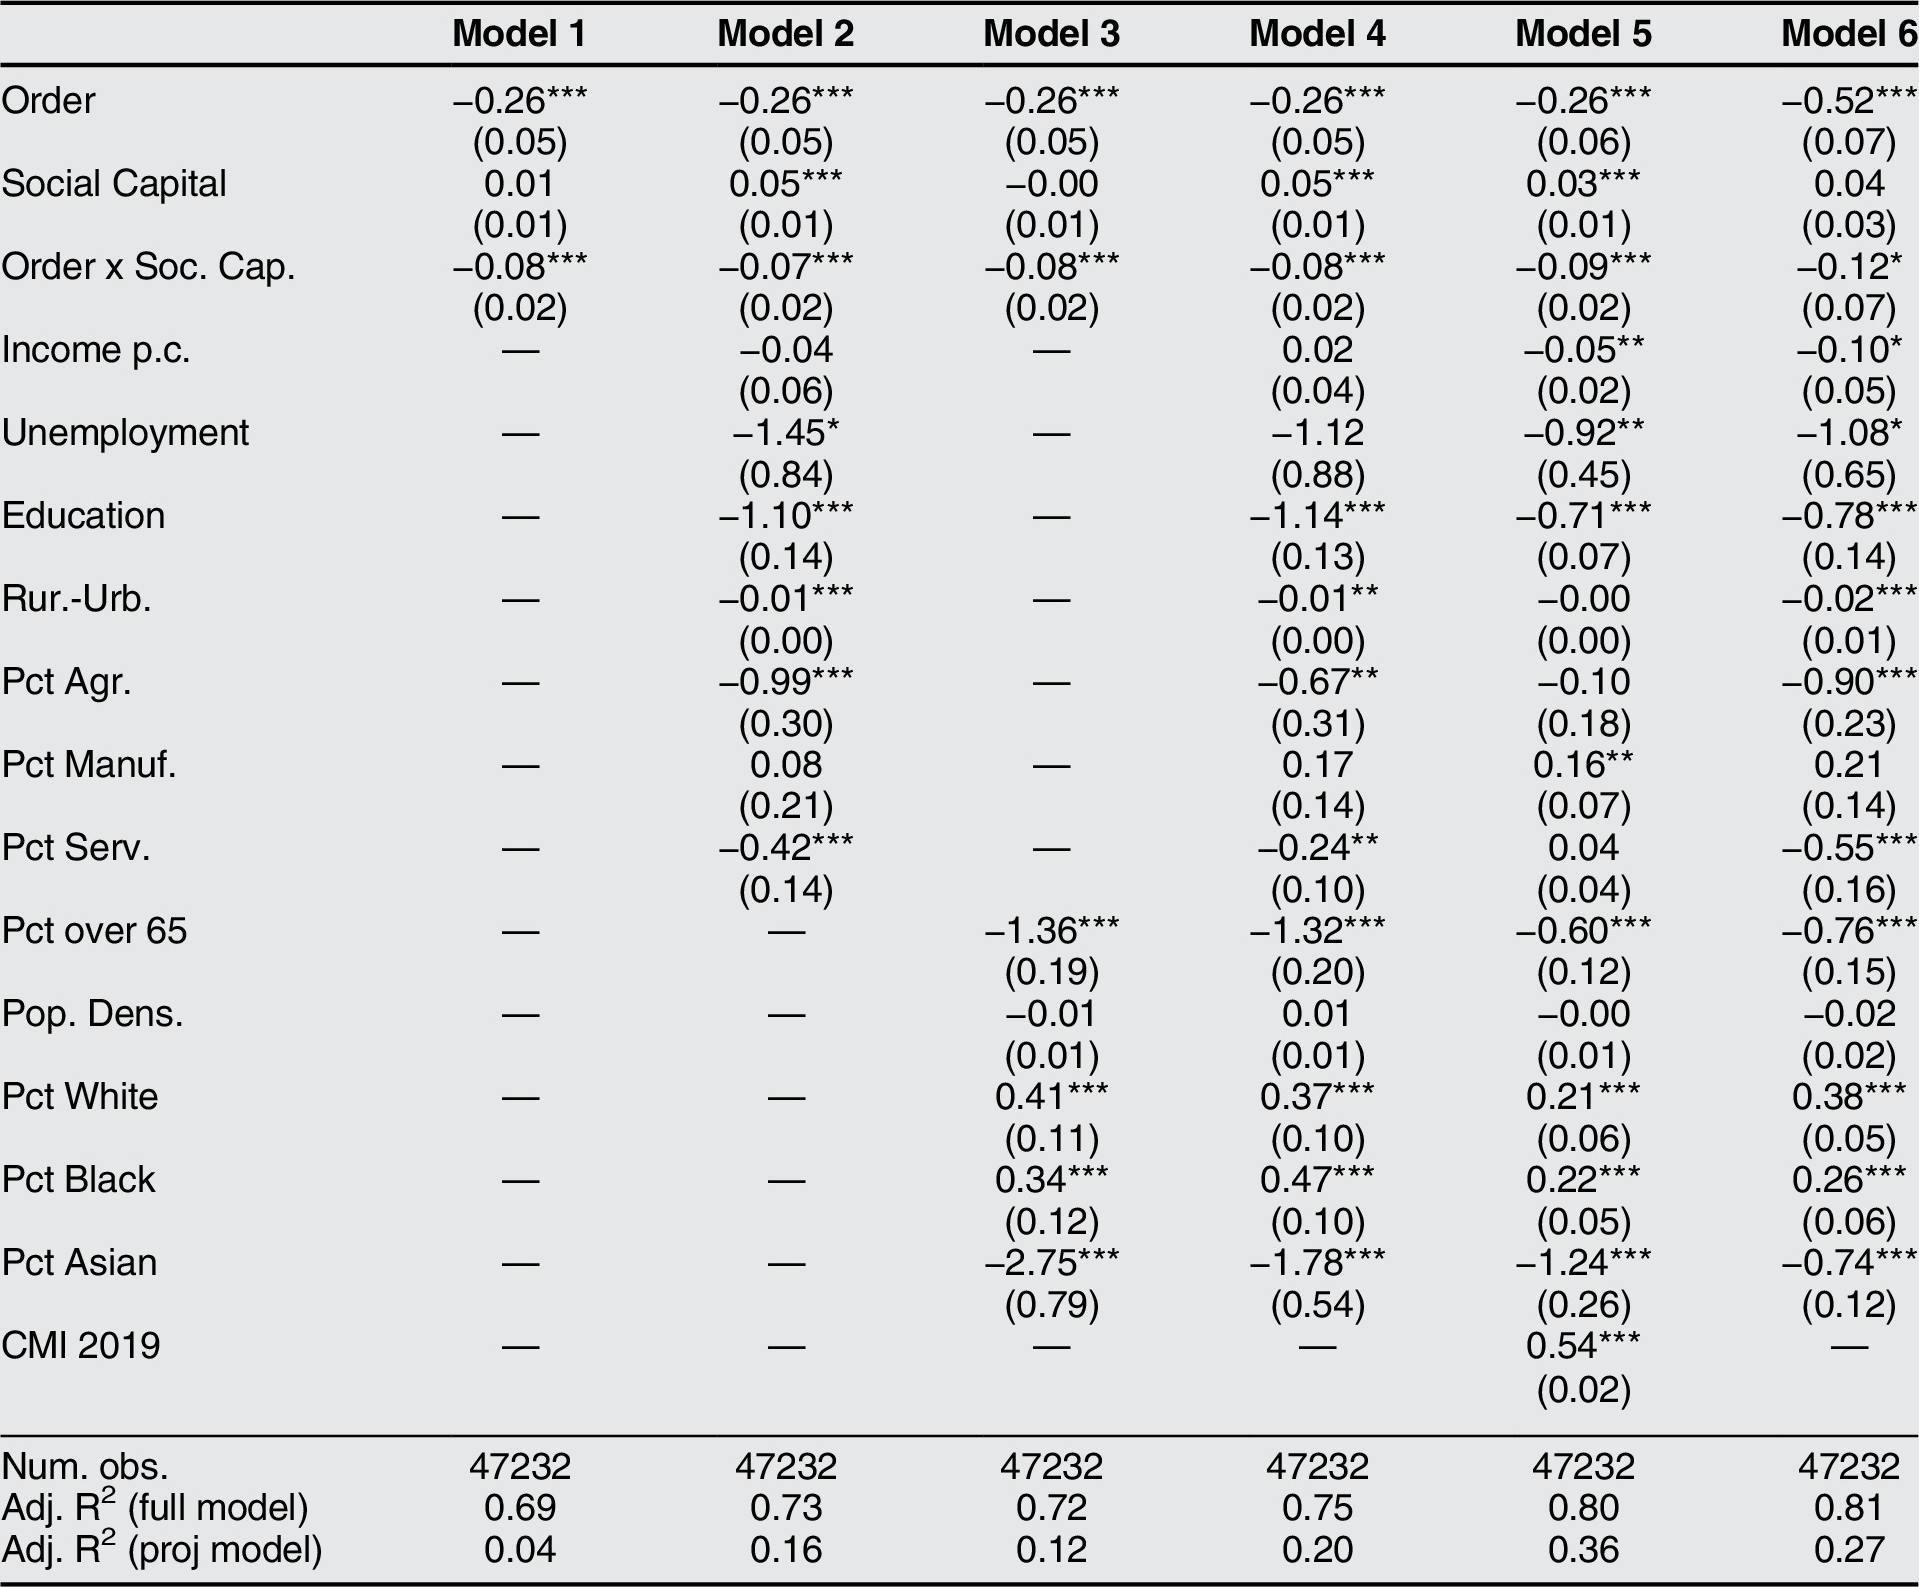
Note: The dependent variable is mobility (CMI). All models include state and week fixed effects. Model 6 is weighted by population. Standard errors are clustered by state. ‘Social Capital’ is our social capital measure (from 2017) and ‘Order x Soc. Cap.’ reports the interaction effect of stay-at-home orders and social capital. *** p < 0.01,** p < 0.05,* p < 0.1.
Partisan Social Trust
Lastly, we hypothesize that social trust may reinforce or undercut the effects of partisanship. In particular, we test whether social capital interacted with partisanship further weakens already diminished compliance in Republican-leaning counties. To investigate this hypothesis, we estimate a triple-interaction. Table 5 finds that the compliance gap between Republican-leaning and Democratic-leaning counties is further widened by the effect of social capital. To illustrate this result, consider two counties that differ by 10% with regard to their respective Republican vote shares. We find that the compliance gap between two such counties will increase by an additional 2%–3% if the social capital of the more Republican-leaning county were to increase by one standard deviation. Moreover, note that the estimated effect is statistically significant in specifications 1 through 5, but no longer appears for specification 6.
Table 5 Partisan social trust effects of stay-at-home orders
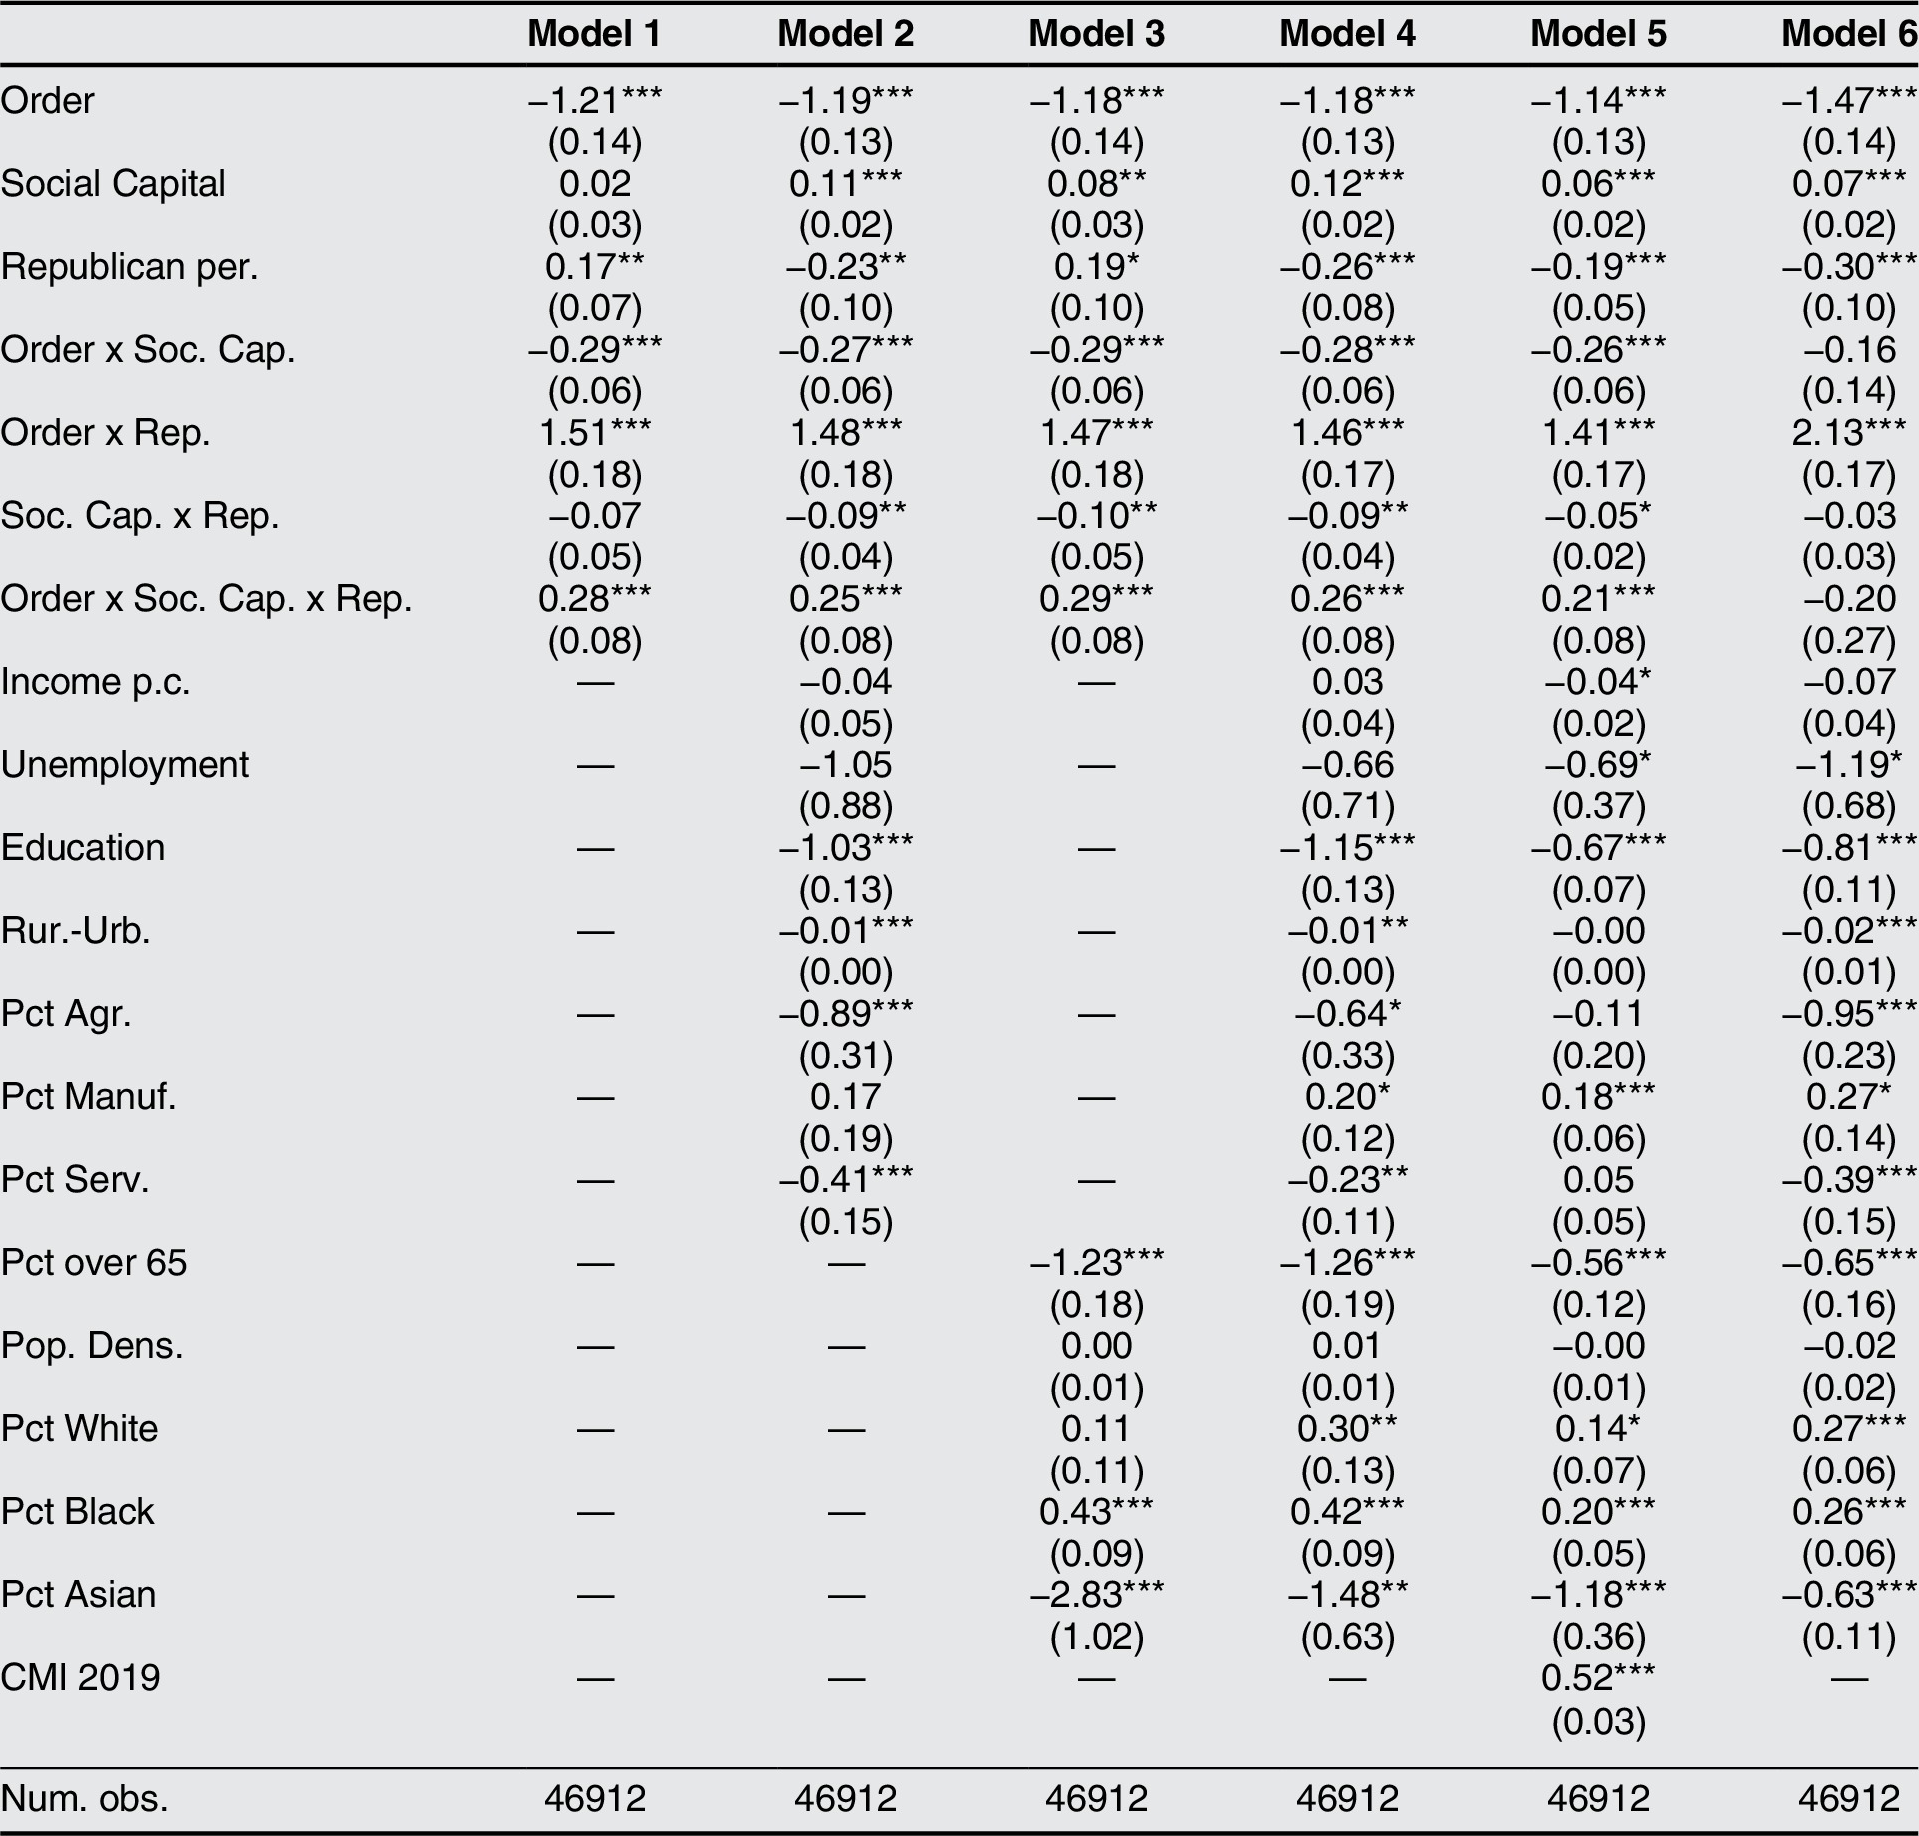
Note: The dependent variable is mobility (CMI). All models include state and week fixed effects. Model 6 is weighted by population. Standard errors are clustered by state. ‘Social Capital’ is our social capital measure, ‘Republican Per.’ stands for Republican vote share in the 2016 presidential election. The two-way interaction effects of these three variables are reported in Rows 4 through 6, Row 7 reports the triple interaction effect. Adj. R-squared is omitted to save space. *** p < 0.01,** p < 0.05,* p < 0.1.
While we establish that the unconditional social capital effect is associated with an additional reduction in mobility, we find that higher social capital may increase compliance or noncompliance depending on a county’s partisan alignment. This suggest that social trust, as captured by social capital, might indeed play a multifaceted role with respect to partisanship and, subsequently, policy compliance. Moreover, as we argue that our partisan effects are driven by Republican mistrust of science and large-scale government interventions, we contend that social trust appears to magnify this underlying mistrust. In addition, the partisan social trust result has found further anecdotal support as well-organized, right-wing protests against COVID-19 mitigation orders arose in the months following the initial implementation of stay-at-home orders (Slotkin Reference Slotkin2020).
Robustness
Measurement and Specifications
For robustness, we re-run our main results in the online appendix using as a dependent variable the percentage of people who stay at home by county, which is also provided by Cuebiq Inc, rather than mobility.Footnote 24 Our results are robust to use of this alternative dependent variable, except for the unconditional social capital effect, which loses significance.
In addition, in the online appendix, we implement two additional formal tests for the validity of the pre-treatment parallel trends assumption. We consider varying the “treatment week” of the orders and, reassuringly, find that the treatment effect is greatest on the week in which stay-at-home orders are implemented.Footnote 25 We also implemented a sensitivity analysis for the parallel trends and find that pre-trends would need to be very non-linear for our results to be substantively altered.Footnote 26 These results add to our confidence that compliance with the stay-at-home orders drive most of our uncovered effects.
Lastly, in the online appendix, we estimate our main model specifications for urban and rural counties separately to further account for fundamental differences due to ruralness. While the effect sizes are generally of lower magnitude for rural counties, they remain statistically significant.
Vaccination Rates
In order to more directly address the mechanism that we hypothesize underlies our partisanship result, we take flu vaccine rates as a proxy for trust in science. We utilize data on county-level influenza vaccination rates for the sub-population of Medicare and Medicaid recipients in 2017 and interpret higher uptake to confer greater trust in science (Centers for Medicare and Medicaid Services 2017). Table 6 provides supportive evidence: for the unweighted specifications, a 10% increase in flu vaccination rates is associated with a mobility decrease of about 10% after stay-at-home orders were given and 25% for the population-weighted model.Footnote 27
Table 6 Vaccination rate effects of stay-at-home orders
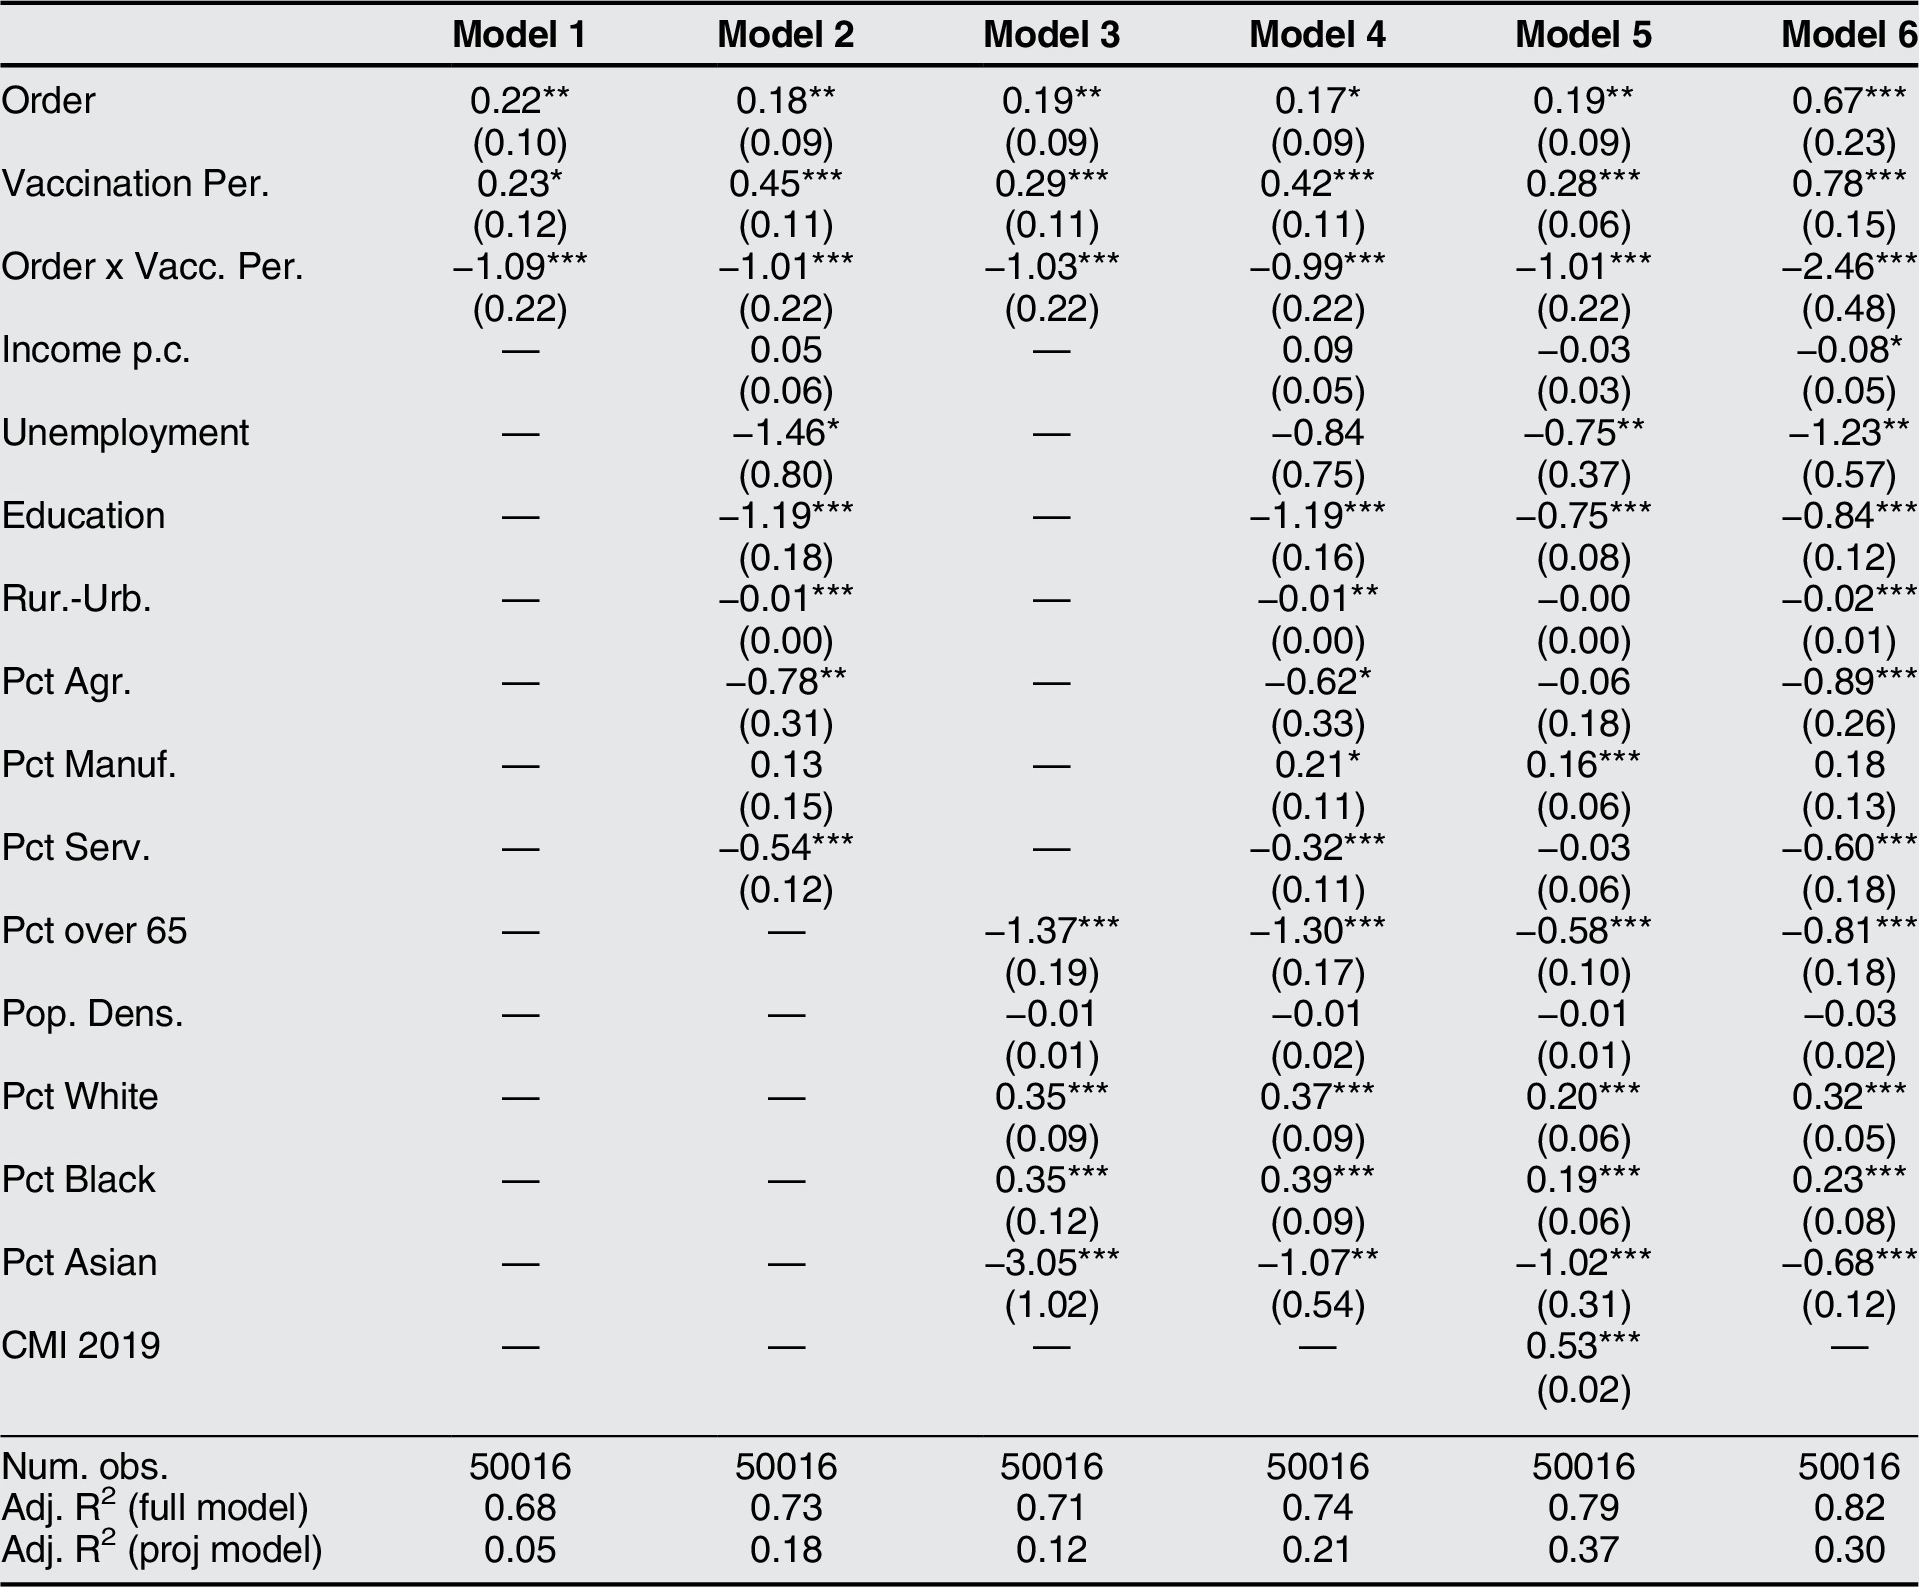
Note: The dependent variable is mobility (CMI). All models include state and week fixed effects. Model 6 is weighted by population. Standard errors are clustered by state. ‘Vaccination per.’ is the influenza vaccination rate amongst Medicare and Medicaid recipients in 2017, and ‘Order x Vacc. per.’ stands for the interaction effect of stay-at-home orders and vaccination rate. *** p < 0.01,** p < 0.05, * p < 0.1.
Multilevel Regression and Post-Stratification
A potential concern for our research design is that our data is measured at the county-level despite our interest in individual-level behavior. Moreover, we use social capital as an analog for social trust. To address these concerns, we utilize multilevel regression and post-stratification, which allows us to take a national-level survey on social trust and approximate representative results for lower geographical units (Buttice and Highton Reference Buttice and Highton2013).Footnote 28 We are unaware of other studies that have used MRP to extrapolate survey data on trust.
We use the 2016 American National Election Studies (ANES) survey on trust (ANES 2016) as well as census data from 2000 and state-level data, both from Kastellec, Lax, and Phillips (Reference Kastellec, Lax and Phillips2019). Due to data constraints, our unit of analysis is at the state-level.Footnote 29 We generate a social trust measure using MRP and then run a regression on state-level mobility (a population-weighted aggregation of the county-level CMI data) and include the same controls (on the state-level) as in our main analysis.Footnote 30 Table 7 shows that states with higher levels of social trust appear to display higher levels of compliance with stay-at-home orders, which is a statistically significant effect. In addition, in the online appendix, we show that our social capital measure appears reasonably correlated with the MRP measure of social trust. We caution the results are suggestive. Nevertheless, we argue they provide added validity to our primary analysis.
Table 7 Social trust effects of stay-at-home orders (MRP)
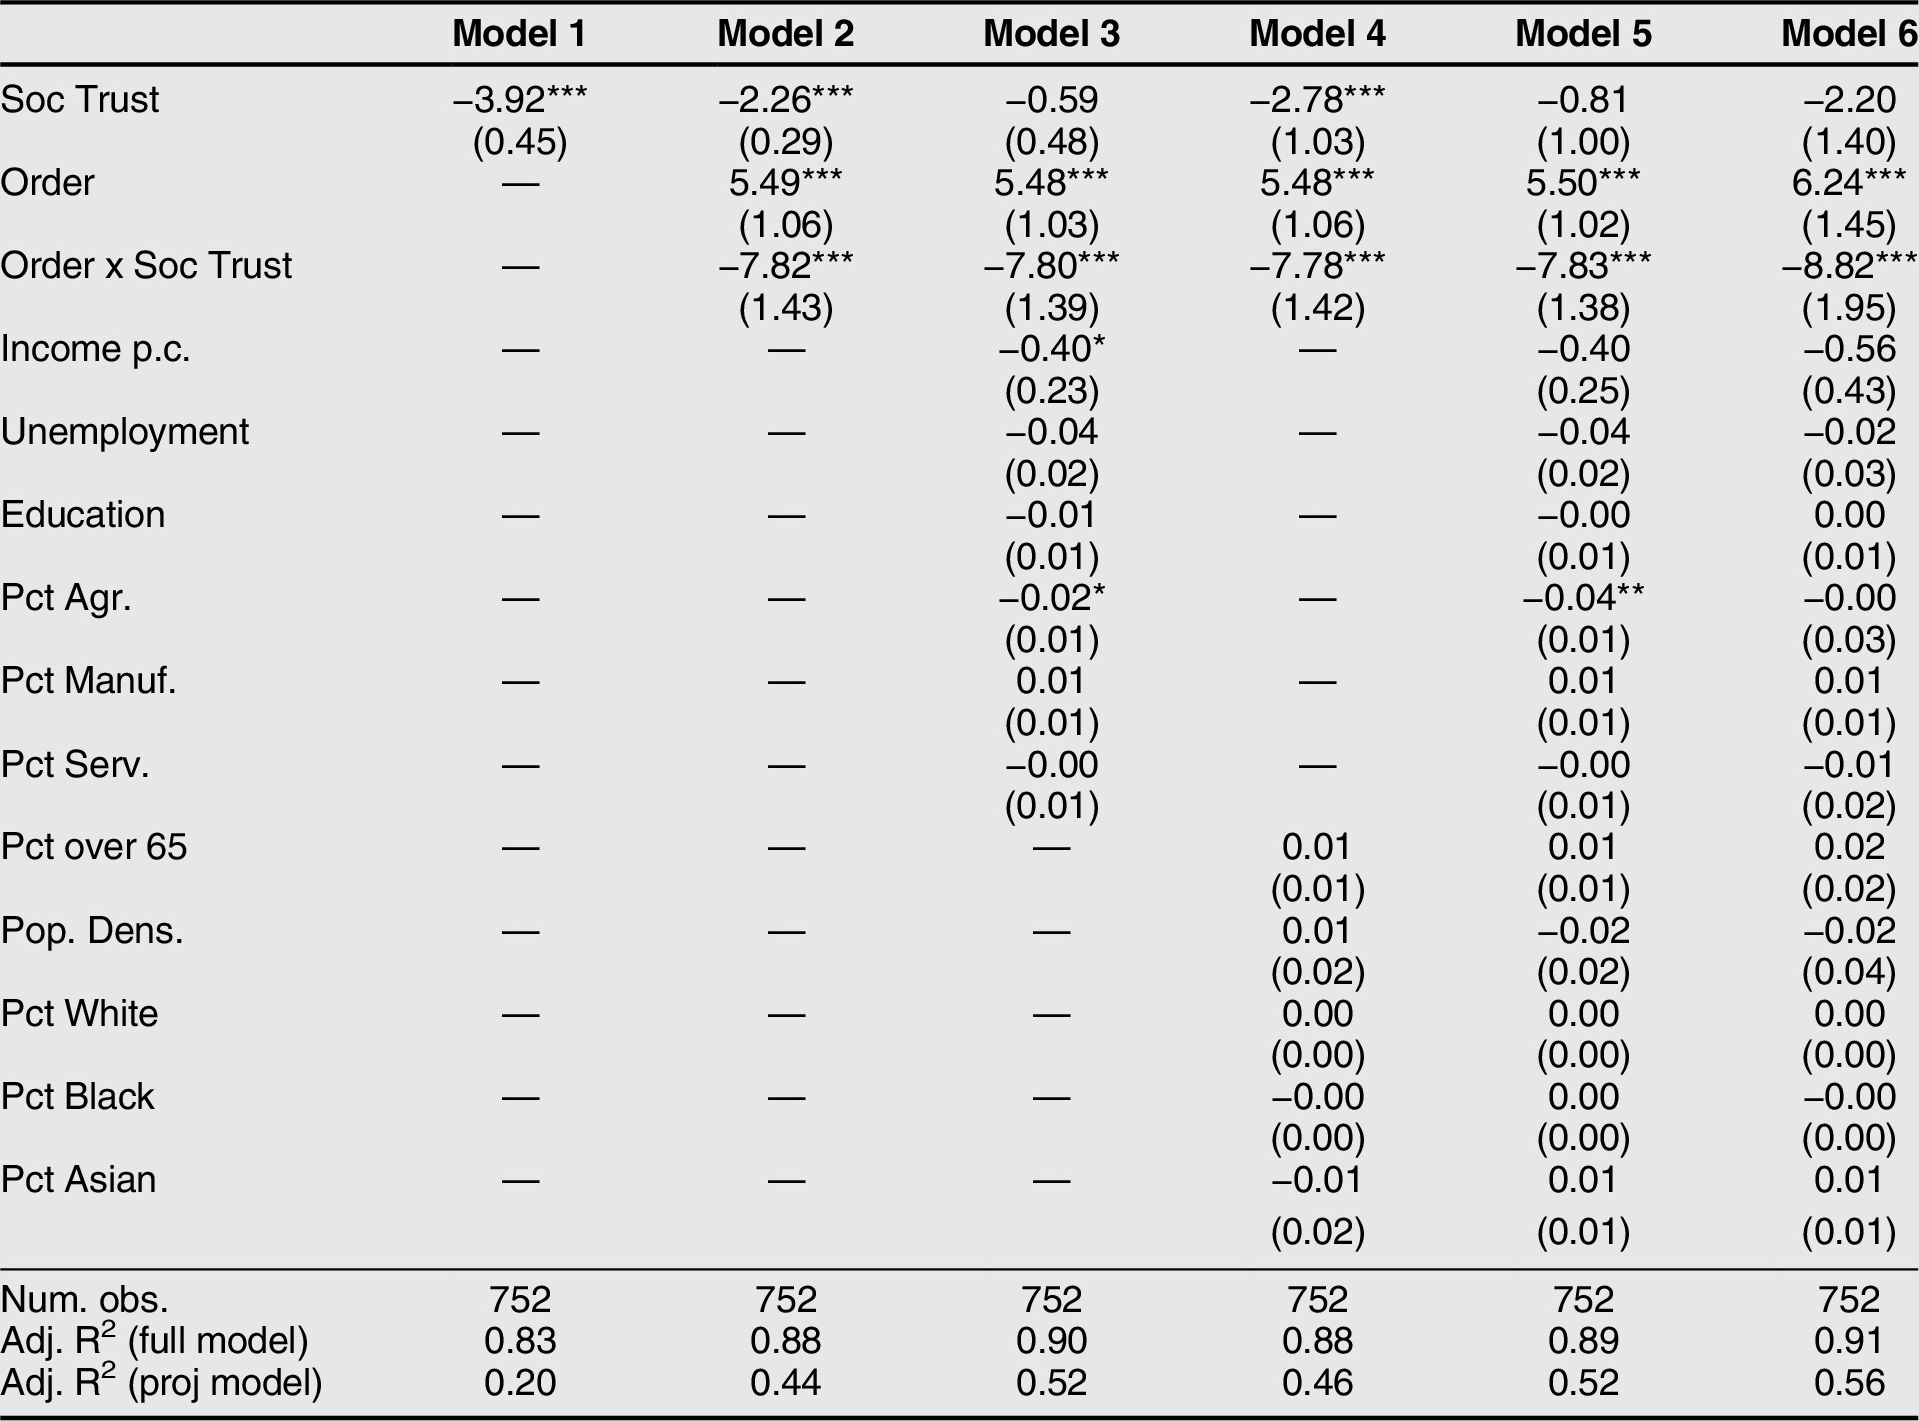
Note: The dependent variable is state-level mobility (a population-weighted average of county-level CMI). All models include week fixed effects. Model 6 is weighted by population. Standard errors are clustered by state. ‘Soc Trust’ is our state-level MRP social trust measure, ‘Order’ captures whether a stay-at-home order was in place in a state in a given week, and ‘Order x Soc Trust’ reports the interaction effect of social trust and stay-at-home orders. *** p < 0.01,** p < 0.05,* p < 0.1.
Alternative Explanations
We have argued that the uncovered partisanship and co-partisanship effects are driven by a citizen’s mistrust of science and government interventions or their particular trust of co-partisan leaders. Following the literature on partisan identity and motivated reasoning, especially Mason (Reference Mason2015) and Iyengar et al. (Reference Iyengar, Lelkes, Levendusky, Malhotra and Westwood2019), an alternative explanation could hold that our effects are due to citizens simply mimicking the actions of co-partisan elites, notably President Donald Trump. We concede that partisan identity and elite position-setting likely play a role in accounting for the co-partisan effect we have uncovered.Footnote 31 Nevertheless, we raise three points that we believe highlight why we find our trust argument to be more credible.
First, the evidence cited earlier makes clear that partisanship likely implies disparate attitudes towards science-based policy and government interventions, for example partisanship being predictive of attitudes toward climate change legislation and responsiveness to hurricane evacuations. Hence, the policy domain of COVID-19 mitigation policies was presumably already polarized according to partisanship prior to or, at a minimum, simultaneous with leaders taking a position on this particular policy. Second, President Trump became more openly opposed to mitigation measures only after our period of study (March–April 2020).Footnote 32 Finally, during our period of study, Republican leaders were not particularly consistent with regards to the pandemic. State governors were the political actors most directly responsible for mitigation measures in the United States, and governors across both parties implemented stay-at-home orders. To the degree that President Trump was openly skeptical of mitigation policies during this time, many Republican governors, notably Governor DeWine of Ohio, seemed to be signaling a countervailing stance by taking the pandemic seriously. Therefore, for the explanation to hold that individuals were simply emulating elite behavior, it must be the case that President Trump’s position on COVID-19 was significantly more impactful on the behavior of Republican supporters than that of Republican governors. However, surveys from May 2020 show that, compared to President Trump’s actions related to the pandemic, most Democrats and Independents trusted their governor’s decision-making to a markedly greater degree while Republicans trusted the president only marginally more (Fedor and Zhang Reference Fedor and Zhang2020).
Thus, we contend that it was differential trust in science as well as co-partisan trust which most significantly contributed to curtailed compliance, at least in our period of study. Nevertheless, we cannot rule out the possibility that the emulation of elite behavior played a role in our uncovered effects.
Implications for Political Trust
Returning to the introductory quote, a frequent line of inquiry has been whether trust in government, that is, political trust impacted compliance with mitigation orders. Political science has long stressed the importance of a culture of political trust in order for the state to effectively operate, particularly as it may facilitate compliance with the law (Almond and Verba Reference Almond and Verba2015; Hetherington Reference Hetherington1998; Norris Reference Norris2011). Moreover, past survey research has found that greater mistrust of government likely reduced compliance with government efforts during the Ebola outbreak (Blair, Morse, and Tsai Reference Blair, Morse and Tsai2017). However, similar to social trust, political trust is difficult to capture outside of a survey setting using real-world behavior due to the abstract nature of attempting to measure how citizens feel about government (Nannestad Reference Nannestad2008; Newton, Stolle, and Zmerli Reference Newton, Stolle, Zmerli and Uslaner2018). In light of this issue, we would like to underscore that our behavioral findings may hold implications for the impact of political trust on policy compliance.
Past literature has shown that political trust may be impacted by many factors, such as the politician, policy domain, or institution under consideration (Bianco Reference Bianco, Braithwaite and Levi2003; Hetherington and Rudolph Reference Hetherington and Rudolph2015; Citrin and Stoker Reference Citrin and Stoker2018). In the narrow sense that political trust varies by policy domain, we contend that partisanship connotes differential trust in the government’s ability to implement a science-driven, large-scale policy intervention. Thus, our uncovered partisanship results may be interpreted as implying that Republicans, as compared to Democrats, generally hold lower political trust regarding such large-scale, science-based government policy. Accordingly, we contend that our findings might serve as suggestive but, critically, behavioral evidence for the importance of political trust in compliance with mitigation policies.
Nonetheless, we concede that partisanship is, at best, a proxy for political trust. Therefore, as added evidence, we again apply the MRP method, which allows us to more directly consider the impact of political trust on compliance.Footnote 33 Table 8 provides evidence that political trust is strongly associated with additional lowered mobility after stay-at-home orders are implemented. In addition, the online appendix shows that our generated trust measure is highly correlated with partisanship: Republican-leaning states appear to display lower levels of our MRP political trust measure. This provides suggestive evidence that political trust also plays an important role in producing policy compliance.
Table 8 Trust in government effects of stay-at-home orders (MRP)
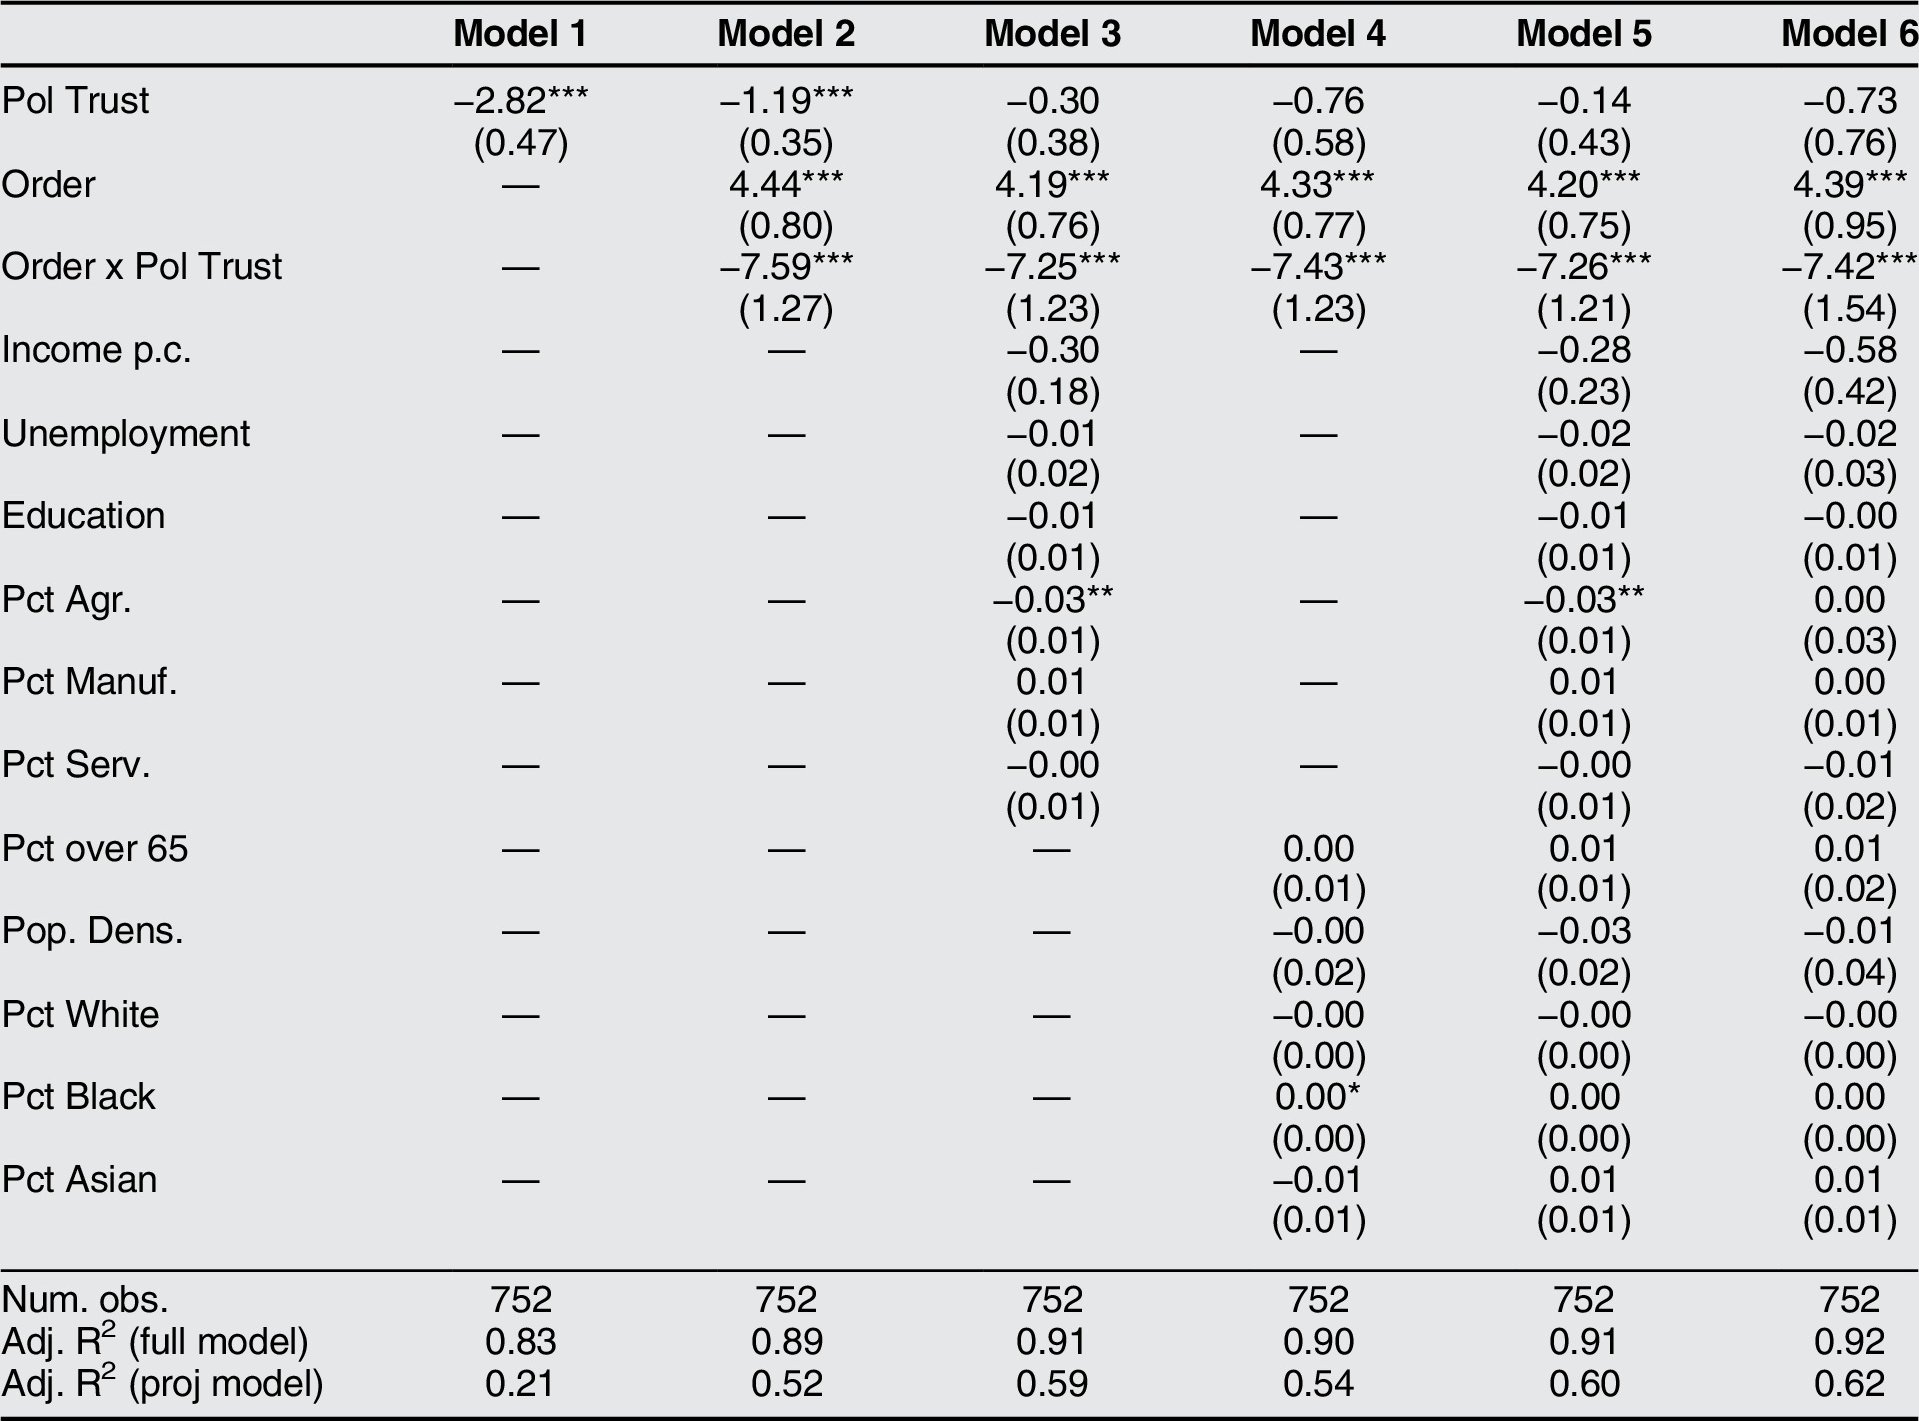
Note: The dependent variable is state-level mobility (a population-weighted average of county-level CMI). All models include week fixed effects. Model 6 is weighted by population. Standard errors are clustered by state. ‘Pol Trust’ is our state-level MRP political trust measure. ‘Order’ captures whether a stay-at-home order was in place in a state in a given week, and ‘Order x Pol Trust’ reports the interaction effect of stay-at-home orders and trust. *** p < 0.01,** p < 0.05,* p < 0.1.
Conclusion
Uniform compliance with public policy is critical to a well-functioning state. Yet, compliance is far from assured. The benefits of policy are frequently diffuse and citizens often hold strong incentives to free-ride. However, we argue that trust in scientific experts, co-partisan politicians, and others in society may alter the perceived net benefit of adherence and, thereby, impact policy compliance.
We have presented descriptive behavioral evidence that emphasizes the real-world stakes of several difficult to measure social phenomena. We documented how partisanship, co-partisanship, and social trust have played a key role in determining asymmetrical citizen responsiveness to the public health measures implemented to combat COVID-19. We found that Republican-leaning counties, which we argue are more mistrustful of science and government intervention, experienced suppressed compliance with stay-at-home orders. Conversely, greater trust between partisan-leaning counties and co-partisan state governors boosted compliance. Furthermore, we presented evidence that higher social trust also improved compliance. Yet when social trust was intertwined with underlying partisan sentiments, the gap in compliance due to partisanship expanded. Finally, we provided suggestive findings that higher political trust also may have amplified compliance.
One policy-relevant takeaway of our study is that in order to achieve greater rates of compliance, policymakers may need to take into account communities that are generally more mistrustful of science and government as well as less trusting of others. Druckman and Lupia (Reference Druckman and Lupia2016) emphasize the difficulty of communicating scientific findings in politically polarized environments. A potential answer is to enact policies aimed at enhancing trust (Freitag and Bühlmann Reference Freitag and Bühlmann2009), which has been shown to be effective in low-trust environments (Tsai, Morse, and Blair Reference Tsai, Morse and Blair2020). For example, one could give public demonstrations of the efficacy of mitigation policies. Moreover, as our results emphasize the importance of co-partisan trust, bipartisan policy implementation is likely critical to compliance. Thus, clear bipartisan communication to potentially skeptical communities may improve citizen welfare and, in the case of COVID-19, save lives.
Finally, we note that how political institutions operate throughout a crisis impacts future political trust (Ellinas and Lamprianou Reference Ellinas and Lamprianou2014). Successful implementation of policy in response to a crisis can improve citizen perceptions of government (Albertson and Gadarian Reference Albertson and Gadarian2015). It follows that effective performances by political leaders in response to COVID-19 could enhance political trust and, in the end, improve policy compliance during the next crisis.
Supplementary Materials
To view supplementary material for this article, please visit http://doi.org/10.1017/S1537592721000049.
Summary Statistics and Balance Table
Validity Check of Mobility Measure
Sensitivity Analyses of Parallel Trends Assumption
Alternative Dependent Variable (Sheltering Percentage)
Alternative Measure of Mistrust of Science (Vaccination Rates)
Alternative Measure of Social Trust (Turnout)
Further Sensitivity Analysis and Effect Decomposition
Multilevel Regression and Post-Stratification Analysis
Acknowledgments
The authors would like to thank Michael Bernhard and three anonymous referees for insightful suggestions. We thank Cuebiq for granting us access to their data. We are also grateful for useful feedback and advice from Alex Coppock, Daniel Goldberg, Nicolas Goldstein, Matthew Graham, Emily Novick, Collin Schumock, Frances Rosenbluth, Milan Svolik, Ebonya Washington, and Lukas Wiedemann. Wiedemann acknowledges financial support from the Baden-Wuerttemberg foundation. Lastly, we apologize to our English teachers in recognition that it should be ‘whom’ do you trust.

