Introduction
Common bean is the most important food legumes of the genus Phaseolus and accounts for about 85% of all the cultivated Phaseolus species grown over the world. In terms of economic importance it comes second after soybean (Singh et al., Reference Singh, Dukariya and Kumar2020). There are five cultivated species of Phaseolus including the common bean (P. vulgaris L.), the yearlong bean (P. polyanthus L.), the runner bean (P. coccineous L.), the temporary bean (P. acutifolius A Gray.) and the lima bean (P. lunatus L.). Among the five domesticated species, the common bean (P. vulgaris) accounts for more than 90% of the cultivated crop worldwide and is by far the most widely consumed grain legume in the world (Singh, Reference Singh2001; Singh et al., Reference Singh, Dukariya and Kumar2020). It is grown in subtropical or temperate regions throughout the world and during the cool, dry season in tropical areas. In 2020, global production of common bean stood at 27.71 million tonnes produced over an area of 35.92 million hectares with average productivity of 7716 kg/ha (FAO, 2022). In terms of regional contributions, Asia leads in dry bean production (43%) followed by the North, Central and South America (29%), and Africa (26%), with a small contribution from Europe and Oceania (2%) (FAO, 2022). Globally about 24 million tones are produced with yields of about 824 kg/ha (FAO, 2018). Sub-Saharan Africa and Latin America account for about half of the common bean production followed by South and South-East Asia (35%). Global exports of common bean stand at 4.23 million tones (31%), only next to pea among pulses (Rawal and Navarro, Reference Rawal and Navarro2019).
Common bean is distributed across Europe, Asia and Africa, represented by both Andean and Mesoamerican gene pools as well as their hybrid forms. However, the hybridization frequency has been reportedly higher in central Europe. In Africa, China, Turkey and India, the existing landrace diversity is mainly Andean and Mesoamerican gene pools with fewer introgressions (Kumar et al., Reference Kumar, Sharma, Sharma, Kumar, Sharma, Malik, Singh, Sanger and Bhat2008; Zhang et al., Reference Zhang, Blair and Wang2008; Asfaw et al., Reference Asfaw, Blair and Almekinders2009; Chavez-Servia et al., Reference Chavez-Servia, Heredia-García, Mayek-Perez, Aquino-Bolaños, Hernández-Delgado, Carrillo-Rodríguez, Vera-Guzmán and Goyal2016; Ozkan et al., Reference Ozkan, Haliloglu, Turkoglu, Ozturk, Elkoca and Poczai2022). The genetic diversity of common bean landraces is typically evaluated through morphological traits, seed physical, biochemical and nutritional traits, phaseolin type and DNA markers to elucidate the population structure, diversification pattern and geographic distribution (Zhang et al., Reference Zhang, Blair and Wang2008; Asfaw et al., Reference Asfaw, Blair and Almekinders2009).
In Jammu and Kashmir, two Phaseolus species are cultivated with P. vulgaris being the principal species and P. coccineus (Scarlet runner bean) found sporadically in some areas. However, due to its longer maturity period, indeterminate growth habit and leathery pods, it is not preferred as much. There is scanty information about the dissemination of common bean in India, especially in the Western Himalayan region which is the major hub of the genetic diversity of beans (Joshi and Rana, Reference Joshi and Rana1995; Sofi et al., Reference Sofi, Rana and Bhat2014a, Reference Sofi, Zargar, Razvi, Sheikh, Saba and Shafi2014b), even though many studies have hinted that common bean might have been brought to this region by Portuguese, English, Dutch and French travellers in early 16th century through Red Sea and Arabian Sea; as well as the Chinese travellers through Silk Route (Joshi and Mehra, Reference Joshi and Mehra1993). Consequently, the genetic diversity in beans in India significantly resembles European and Chinese types, comprising both Mesoamerican and Andean cultivated gene pools (Beebe et al., Reference Beebe, Rengifo, Gaitan, Duque and Tohme2001; Akbulut et al., Reference Akbulut, Karakurt and Tonguc2013).
Common bean genetic resources have contributed to the improvement of several traits through utilization of preserved germplasm and the development and dissemination of high-yielding, nutrient-dense and climate-resilient varieties. In view of the projected worst-case scenarios of climate change, the importance of genetic resources has been more seriously appreciated (Piergiovanni and Laghetti, Reference Piergiovanni and Laghetti1999; Sofi et al., Reference Sofi, Zargar, Mir, Salgotra, Zargar and Salgotra2019). The Himalayan state of Jammu and Kashmir State is known for its huge diversity of bean landraces, especially the small-seeded red beans, but over a period of time, only a handful of diverse seed classes exist. In Kashmir valley, substantial diversity in beans has been reported by various earlier workers (Sofi et al., Reference Sofi, Rana and Bhat2014a; Saba et al., Reference Saba, Sofi, Zeerak, Bhat and Mir2016; Choudhary et al., Reference Choudhary, Hamid, Singh, Khandy, Sofi, Bhat and Mir2017) for yield and quality traits. Across the world, farmers highly value their seeds, they are part of their cultural heritage and they like to grow and ‘conserve’ local varieties as the way to keep traditions (Lhome, Reference Lhome2005). These landraces have evolved under natural and farmer-driven selection process under diverse eco-geographies and have developed useful genes and alleles related to adaptability, fitness, resilience and quality. These are locally adapted and also possess co-adapted gene complexes with less linkage drag and as such can be easily mainstreamed in breeding programmes (Dwivedi et al., Reference Dwivedi, Ceccarelli, Blair, Upadhyaya, Are and Ortiz2016). In fact, the food value of small-seeded red common bean is largely confined to local consumer preferences and as such, traditional varieties and landraces offer great value to plant breeders as they possess better adaptability and quality. In Western Himalayan Kashmir valley, small-seeded red beans, invariably belonging to Mesoamerican gene pool with some of the Kashmir landraces traced back to Andean origin (Choudhary et al., Reference Choudhary, Hamid, Singh, Khandy, Sofi, Bhat and Mir2017) with plain seed coat and invariably indeterminate growth habits are predominant in bean-based farming systems especially in high altitudes of valley where they are intercropped with maize, potato as well as in bearing orchards. This study was the first attempt towards comprehensive characterization of small-seeded landraces of common bean to identify lines that could be used in future bean breeding programmes.
Materials and methods
Site of the experiment
The present study was conducted during 2016–2020 at the research fields of various constituent research stations of SKUAST-Kashmir. The main evaluation for most of the traits was carried out at research fields and greenhouse facility of Division of Genetics and Plant Breeding, Faculty of Agriculture Wadura, SKUAST-K, Sopore (34o 17′ North and 74o 33′ E at an altitude of 1594 masl), whereas disease screening was carried out at various locations (bean common mosaic virus (BCMV): Wadura, Shuhama, Saloora, Shalimar; anthracnose: Shalimar; angular leaf spot: Wadura, Gurez, Leh; Fusarium: Wadura; Ascochyta blight: Wadura). The locations were chosen based on occurrence of diseases and availability of facilities and resources for artificial screening. The soil of the main experimental site at Wadura is a typical inceptisol with clay loam texture. The pH was almost neutral (7.2), with organic carbon 0.65%, the electrical conductivity of 0.18 dS/m and CEC of 16 meq/kg. All the accessions were grown five row plots of 4 m length, with spacing of 15 cm × 30 cm for bush and 15 × 70 cm for pole types. Recommended crop management practices as per SKUAST-K package of practices were followed to ensure good crop.
Plant materials
A set of 40 red-seeded landraces of beans collected from nine districts of Jammu and Kashmir, including some potential areas of Kishtwar, Doda, Bhaderwah and Poonch from Jammu division, were used in the present study. The landraces represented diverse market classes based on growth habit, seed colour, shape and size. Out of these landraces, a few have been deposited in national gene bank and IC number received for some (WB-N-1 = IC-0642382, WB-1634 = IC-0642383, WB-1282 = IC-0642381, WB-2020-26 = IC-0642385 and WB-341 = IC-0643964) and some are under administrative processing for allotment of IC numbers.
Plant traits and data recording
All the genotypes were grown in randomized complete block design with three replications. The data were recorded for 16 traits that included six qualitative traits of economic importance (growth habit, pod colour, pod cross sectional shape, seed colour, seed shape and seed size) and eight quantitative traits viz. days to flowering (DF), days to maturity (DM), plant height (PH), pod length (PL), pods per plant (PPP), seeds per pod (SPP), seed length (SL), seed breadth (SB), 100-seed weight (100SW) and seed yield per plant (SYPP), measured on different scales from randomly selected five plants of each genotype. Observations were recorded using minimal descriptors for common bean characterization and evaluation available from PPVFRA (Protection of Plant Varieties and Farmers Rights Authority, India). The observations on days to flowering, days to maturity and seed yield per plant were taken on plot basis. The data on qualitative traits was analysed by frequencies and for quantitative traits various parameters were derived from ANOVA.
Biochemical properties
The main biochemical parameters recorded were protein content and phytic acid. The protein content was estimated using near infrared reflectance spectroscopy (CROP SCAN 2000G) facility available at Seed Technology Laboratory of SKUAST-K. It is a quick and non-destructive method for estimation of protein content. Phytic acid content was estimated according to modified Haug and Lantzsch (Reference Haug and Lantzsch1983) method. The determination was based on indirect spectrophotometric determination of phytic phosphorus in dry bean extracts. Phytic acid was precipitated by addition of ferric ammonium sulphate. Part of iron forms insoluble ferric phytate, and the remaining iron was determined spectrophotometrically at 519 nm. Calibration curve was prepared by a series of standard solutions of sodium salt of phytic acid.
Seed water imbibition and cooking quality
Seed water absorption parameters such as water absorption percentage (%), swelling coefficient (%), hydration coefficient (%), coat proportion (%) and hard shell (%) were calculated for each accession using ambient stored seed samples equilibrated to uniform moisture condition following standard methods of Bishnoi and Khetarpaul (Reference Bishnoi and Khetarpaul1993), Youssef (Reference Youssef1978) and Correa et al. (Reference Correa, Goneli, Júnior, De Oliveira and Valente2010). The procedure of cooking in an autoclave followed the method described by Revilla and Vivar-Quintana (Reference Revilla and Vivar-Quintana2008) with modifications. All these parameters were recorded using a completely randomized design with three replicates. Fifty soaked grains were placed in glass beaker filled with 200 ml of distilled water covered with watch glass and cooked under the conditions 110°C for 5 min. Revilla and Vivar-Quintana (Reference Revilla and Vivar-Quintana2008) scale (online Supplementary Table 1) was used for scoring cooking properties of bean genotypes. The classification of fast, medium and slow cooking was based on finger press test and hardness tester score using a scale of 1–5, where 1–2 are slow cooking, 3 is medium cooking and 4–5 are fast cooking. The electrical conductivity of soaked seeds was measured by a handheld conductivity meter.
Resistance to major diseases
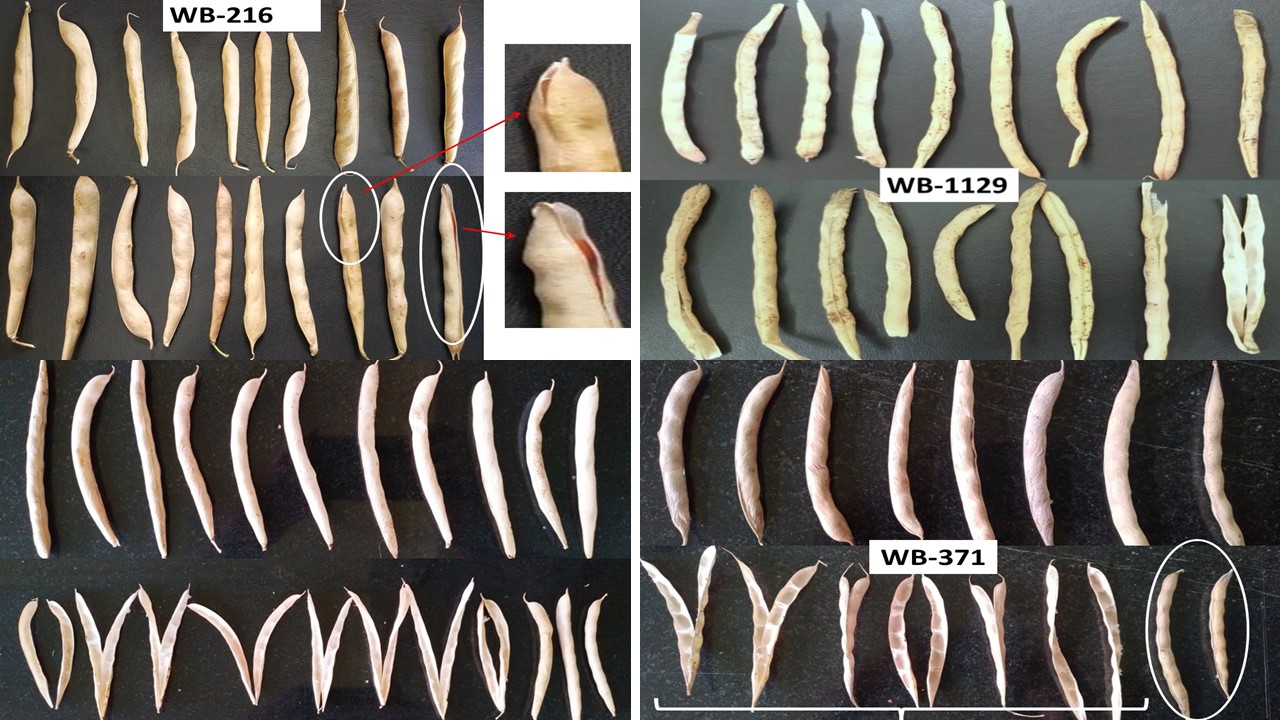
The landraces were screened for resistance response against five main diseases that are prevalent in Western Himalayan region viz., BCMV, anthracnose, angular leaf spot, Fusarium wilt and Ascochyta blight using both field as well as greenhouse screening methods at the main location as well as other research stations and locations based on disease incidence pattern and facilities for artificial inoculation. Resistant and susceptible checks were used for comparative scoring of genotypes. For BCMV, WB-216 and WB-1129 were used as resistant checks and SR-1 and WB-923 as susceptible checks. For anthracnose, WB-1634 and WB-966 were used as resistant checks and WB-46 and WB-1587 as susceptible checks. Similarly, for angular leaf spot, WB-371 and WB-1677 were used as resistant checks and WB-1492 and WB-1644 as susceptible checks. The response to BCMV was recorded in 2017–2020 at various locations across the valley using 1–9 scale (Horsfall and Barratt, Reference Horsfall and Barratt1959; Drijfhout et al., Reference Drijfhout, Silbernagel and Burke1978). The races NL-1, NL-1n, NL-7, NL-7n and NL4 have been reported to be prevalent in Kashmir Himalayan region (Hamid et al., Reference Hamid, Ahmad, Padder, Shah, Sofi and Mohaddin2016). The per cent disease incidence (PDI) was calculated as the ratio of total number of infected plants/plot to the total number of healthy plants/plot. Based on PDI, genotypes were categorized into four severity grades on a scale of 1–5 (1–2 resistant (0–10%), 3 moderately susceptible (11–20%), 4 susceptible (21–30%) and 5 highly susceptible (>30%)). Resistance response for anthracnose was recorded in sterilized growth chambers against five regionally prevalent races (3, 73, 87, 503 and 2017) and resistance response was measured on a 1–5 scale (Drijfhout and Davis, Reference Drijfhout and Davis1989) reported elsewhere (Banoo et al., Reference Banoo, Nabi, Rasool, Shah, Ahmad, Sofi and Padder2020). Resistance response against angular leaf spot was studied under field and greenhouse conditions against two prevalent races (Pg01 and Pg02) using 1–9 scale (Van Schoonhoven and Pastor-Corrales, Reference Van Schoonhoven and Pastor-Corrales1987). Similarly, the disease response of these landraces to Fusarium wilt (Fusarium oxysporium var. phaseoli) was recorded at seedling and reproductive stage using 1–5 scale given by Haware and Nene (Reference Haware and Nene1982). Similarly, the screening against Ascochyta blight was done using 1–9 disease scoring scale given by Schoonhoven and Corrales (Reference Schoonhoven, Corrales and Van Shoonhoven1987).
Shattering resistance
Shattering resistance was measured under laboratory. Ten representative pods from each genotype were dried in hot air oven at 800 °C for 4 days, and then using a cylindrical box measuring 20 cm in diameter with six steel balls of 12 mm diameter, the pods were manually shaken for 10 s and shattering was measured as per cent pods shattered. The evaluation of shattering included both type (fissured, splitted, opened and twisted) and degree of shattering (number of shattered pods).
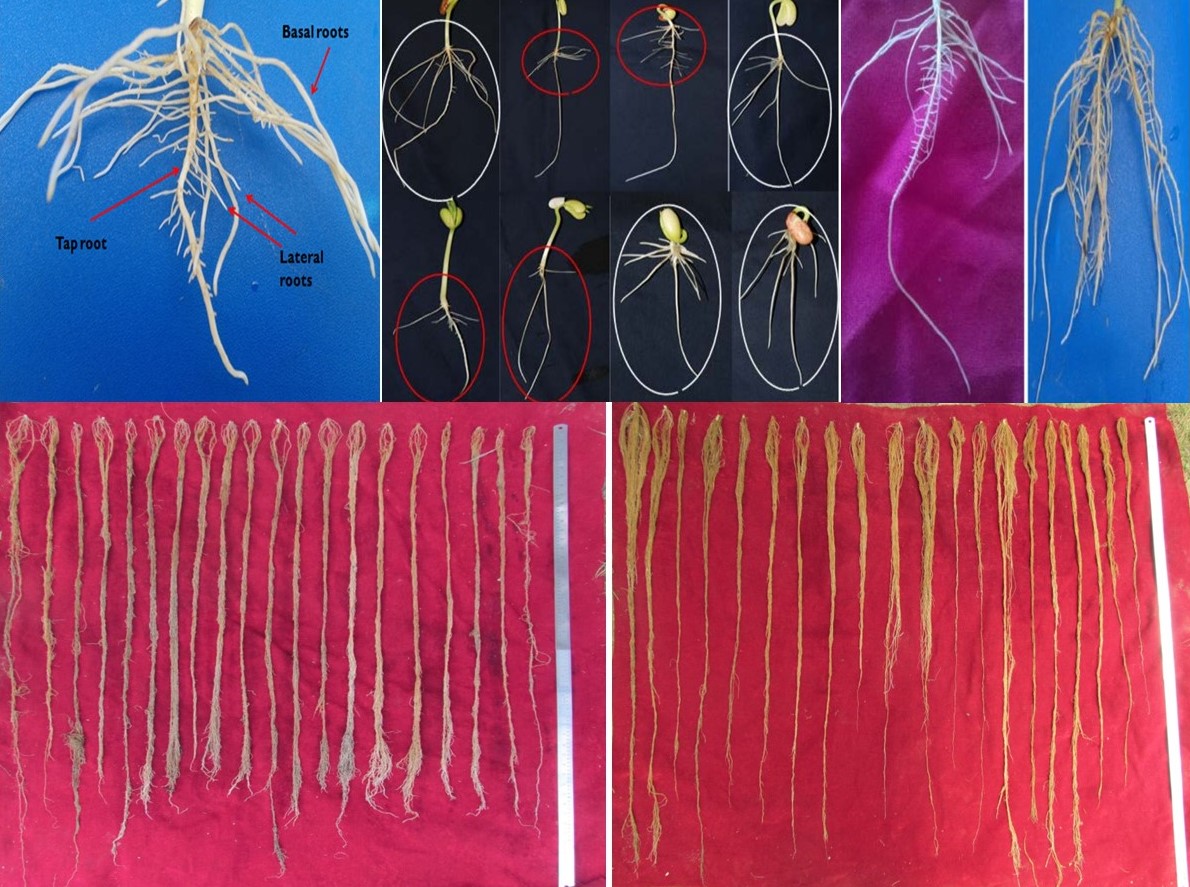
Resistance to water stress
The resistance to water stress was analysed under three screening systems viz., laboratory and green house conditions for root traits and physiological parameters (CTD and RWC) as well as in field conditions for traits related to yield. In the lab experiment, seeds of 40 bean genotypes were surface sterilized using 10% sodium hypochlorite for 5 min and then washed with deionized water for three times. The seeds were germinated in Petri plates using filter paper (Whatman No. 42) moistened with 5 ml of deionized water for 2 d. Sterilized agar (Sigma Himedia; 2% w/v) was poured into square Petri plates (12 × 12 × 1.7 cm, L × W × H) up to the rim and allowed to solidify. The Petri plates were sealed with cellophane tape (invisible tape). On day 3, uniform seedlings (radical emerged) were selected and oriented vertically with the radical facing downwards through the cut side of the square Petri plates containing agar and kept for 5 d in an incubator maintained at 25 ± 1 °C (Sofi et al., Reference Sofi, Djanaguiraman, Siddique and Prasad2018). Root angle data were taken on the first pair of basal roots, measured 3 cm from the seed relative to a vertical line passing through the stem base (Sofi et al., Reference Sofi, Djanaguiraman, Siddique and Prasad2018). After the measurement of root angle, the seedlings were removed from the agar, and the number of basal roots and basal root whorls were counted for each genotype.
In the greenhouse conditions, the crop was raised in 1.2 m long PVC columns with 20 cm diameter with soil and sand mixture (1:1). Osmocote, a slow-release fertilizer with 19:6:12 N:P2O5:K2O, respectively, was applied at 4 g per column before sowing by mixing with top soil. Similarly, Vermitech 1% G, a systemic insecticide (a.i.: Imidacloprid: 1–[(6–Chloro–3–pyridinyl) methyl]–N–nitro–2–imidazolidinimine) was applied at 1 g per column before sowing to control sucking pests (Narayanan et al., Reference Narayanan, Mohan, Gill and Prasad2014). From sowing to harvest, the irrigated plants were maintained at 100% field capacity by irrigating water on a daily basis, whereas for the drought treatment, plants were maintained under 100% field capacity upto the trifoliate stage. Drought stress was imposed by withholding water till pod development stage (50 d after sowing; DAS). The duration of the drought stress was around 40 d. The moisture content of the medium at the end of the drought treatment was 30%, which was quantified on a weight basis (Black, Reference Black1965). After 50 d, the roots were carefully harvested by gently inverting the columns at about 1400 to allow the contents (growing medium and plants with entire root system) to slip out. The intact roots were carefully separated from the soil–sand growing medium. The shoots were separated from the roots by cutting at the base of the stem. After removing the shoots, the roots were spread on a flat surface to measure their length (from the base of the stem to the tip of the root system) as an estimate of rooting depth. Canopy temperature depression was measured by a Fluke infrared thermometer (Fluke Corp USA) as the difference between air temperature and canopy temperature. Relative water content (RWC) was calculated using fresh, turgor and dry weight of leaves as per Barr and Weatherley (Reference Barr and Weatherley1962).
In the field experiment, the accessions were grown in 2016–17 in two replications with pairwise comparison where irrigated plots were regularly irrigated; whereas, in case of the water-stressed plots, irrigation was withheld 10 d before flowering as it is the most sensitive stage and implicates the reproductive fitness. The per se yield under stress as well as the per cent decrease was used to identify the tolerant genotypes.
Statistical analysis
The quantitative traits were analysed for various statistical parameters viz., mean, range, variance, correlation and principal component analysis (PCA). The phenotypic and genotypic coefficients of variation (PCV and GCV) for each trait were computed as PCV = (√Vp/mean) × 100, GCV = (√Vg/mean) × 100 as per Burton and Devane (Reference Burton and Devane1953). Heritability (broad sense) was estimated as h2 (bs) = Vg/Vp × 100 following Lush (Reference Lush1940). The significance of variances was tested at 5% probability level. Genetic advance was estimated as per the formula of Johnson et al. (Reference Johnson, Robinson and Comstock1955) as GA = k.h2.6p, where k is a constant having a value of 2.06 at 5% selection intensity. GA was classified as high (>20%), moderate (10–20%) and low (<10%). Before pooling the data, the homogeneity of variances was tested. PCA was done using Minitab version 13.31 (Minitab LLC, USA).
Results
Variability parameters for qualitative and quantitative traits
There was a substantial variation among 40 accessions evaluated for all the traits. Out of 40 accessions, only six genotypes were bush type and rest all were pole type with varying degree of twinning. Pods were predominantly green (39), except for WB-115 which had pods with reddish shades. Pods were mostly smaller in size and curved with lower ventral/dorsal length ratio and elliptical transverse section, except for WB-1634 where pods were straight and roundish in transverse section (Fig. 1). Seed colour was predominantly red (38) followed by light red (WB-341) and dark red (WB-83). In all these landraces, seeds had invariably plain seed coat (Fig. 1). In terms of seed size, most of the accessions (32) were medium sized (25–40 g), six had small seed size (<25 g) and only two genotypes (WB-6 and WB-147) were large seeded (>40 g). Out of 40 accessions, 37 had cuboidal seed, two were kidney-shaped (WB-1634 and WB-115) and one was oval (WB-6).

Figure 1. Representative variability for pod and seed characteristics in small-seeded red bean landraces.
Among quantitative traits, data were recorded for days to flowering, days to maturity, plant height, number of pods, pod length, seeds per pod, seed length, seed breadth, 100-seed weight and seed yield per plant. Based on the 5-year mean data, eight genotypes viz., WB-5, WB-341, WB-N-11, WB-N-10, WB-11, WB-6 and WB-1318 were early to flower (<45 d) whereas genotypes WB-241 and WB-245 were late to flower (>65 d). Genotypes WB-N-1, WB-242, N-10, WB-1634 and WB-N-11 were early to mature (<80 d) whereas WB-241 and WB-245 were late to mature (>100 d). In terms of plant height, a few genotypes including WB-N-1, WB-N-10, WB-6 and WB-N-11 were shorter in height with upright plant type whereas most of other landraces were typical indeterminate climbers with heights as high as 326.8 cm recorded in WB-241. In case of the yield components, number of pods was high in case of some genotypes such as WB-1318 (24.51) followed by WB-341 (23.51), WB-451 (23.37), WB-N-1 (21.55) and WB-1634 (21.25) but was very low (<10 pods) in case of WB-256, WB-243, WB-1587 and WB-241. Pod length ranged from 8.54 to 12.70 with longest pods recorded in WB-1318 (12.70 cm) followed by WB-236 (12.56 cm) and WB-1310 (12.52 cm). Seeds per pod ranged from 2.71 to 5.91 with largest seed number recorded in WB-256 (5.91) followed by WB-451 (5.49). One hundred seed had a broad range with largest seeds as large as 4.83 g (100-seed weight = 48.27 g) and lowest recorded for WB-240 (16.15 g). Seed length and breadth was highest in case of WB-6 (14.35 and 11.18 mm, respectively). Seed yield also had a very broad rang with genotypes WB-N-1 (35.19 g), WB-222 (33.12 g) and WB-341 (32.18 g) being the highest yielders.
The descriptive statistical analysis of variability parameters such as mean, range, GCV, PCV and genetic advance of 10 quantitative traits indicated substantial variability among the accessions (Table 1). Higher PCV and GCV values were recorded for plant height, seed yield per plant and number of pods per plant and low for days to maturity, seed length and pod length. High heritability was recorded for all the traits ranging from 78.72% for seed yield per plant to 94.87% for plant height. Genetic advance as per cent of mean was high in all traits except days to maturity and seed length with highest value recorded for plant height, number of pods per plant, seed yield, 100-seed weight and seeds per pod.
Table 1. Descriptive statistics

Trait legend: DF, days to flowering; DM, days to maturity; PH, plant height; PL, pod length; NOP, pods per plant; PL, pod length; SPP, seeds per pod; SL, seed length; SB, seed breadth; 100-SW, 100 seed weight; SYPP, seed yield per plant.
Principal component analysis
Principal component analysis based on 10 traits concentrated the variability in first four principal components. The criterion used based on Eigen value of >1 for first four PCs explained 73.73% (Table 2). Latent roots (Eigen values) for significant PCs ranged from 3.11 (PC1) to 1.15 (PC4). The first two PCs that were used for constructing PCA biplot (Fig. 2) graph explained 49.50% of total variation (PC1 accounted for 31.20% of the total variation while PC2 accounted for 19.70% variation) mainly contributed by number of days to flowering and days to maturity in PC1 and seed yield per plant number of pods per plant and seeds per pod in PC2. Thus, PC1 can be designated as component of maturity and PC2 can be designated as component of productivity (online Supplementary Table 1). The genotype-trait biplot indicated various trait correlations based on the proximity and angle of two vectors (Yan and Rajcan, Reference Yan and Rajcan2002). In a PCA biplot, close alignment of trait rays forming a small acute angle corresponds to strong positive correlation. In the present study, based on the factor loading graph, number of pods per plant, seeds per pod and pod length are strongly positively correlated with seed yield per plant. The genotype-trait graphs derived from PCA biplot enable the comparison of accessions on the basis of the multiple measured variables and as such can be effectively used as independent selection criteria in multiple trait evaluation trials (Yan and Rajcan, Reference Yan and Rajcan2002). Sofi et al. (Reference Sofi, Zargar, Razvi, Sheikh, Saba and Shafi2014b) evaluated a set of 300 common bean accessions and found that PC1 contained traits related to maturity while PC2 contained traits related to productivity such as pods per plant, pod length as well as seed yield per plant (Fig. 2).

Figure 2. GT biplot for 10 quantitative traits in small-seeded red bean landraces.
Table 2. Eigen values and variation accounted by first four principal components

Disease screening
There was significant variation in the lines for response to various diseases (Fig. 3) and several resistance sources for diseases were identified.

Figure 3. Symptoms and differential response to various diseases: (A) BCMV symptoms, (B) cultivars showing resistance to BCMV, (C) angular leaf spot, (D) anthracnose.
BCMV
Among the 40 landraces, the genotypes WB-N-1 and WB-N-11 showed highly stable resistance over screening environments under field and greenhouse conditions (mean PDI of 0.83 and 0.96, respectively), while as landraces WB-1318, WB-401, WB-451, WB-1634 and WB-6 were moderately resistant (mean PDI of 1.2. 1.33, 1.42, 1.47 and 1.75, respectively). The rest of the genotypes were susceptible to BCMV (mean PDI >3).
Anthracnose
Among the landraces, WB-1634 was resistant to all the races of anthracnose viz., 2407, 3, 73, 87 and 513 with a disease score of 0.05, whereas, the landraces that exhibited resistance against four races were WB-83 (2407, 3, 73, 87) with a disease score of 1.05, three races were WB-258 (3, 73, 87) with a disease score of 1.30, WB-92 (3, 87 and 513) with a disease score of 0.50, against two races were genotypes WB-1282, WB-1304, WB-242, WB-191 and WB-92 (3 and 87) with a disease score of 0.25, and WB-243 (3, 73), WB-1310 (2407, 3) with a disease score of 2.3. Rest of the genotypes were susceptible to most of the races of Colletotrichum lindimuthianum.
Angular leaf spot
We identified two major races of Psedocercospora griseola causing angular leaf spot (Pg01 and Pg02 with accession numbers MZ113342 and MZ452242, respectively, based on ITS sequencing). Among the landraces, WB-222 and WB-83 were highly susceptible to angular leaf spot, whereas the landraces WB-6, WB-1634, WB-258, WB-451, N-1 and N-10 were moderately resistant to ALS. Rest of the genotypes were susceptible to most of the races of P. griseola.
Fusarium wilt
Among the landraces, WB-341, WB-451, WB-N-1 and WB-1587 were reported as resistant while WB-1634 and WB-1318 were recorded as moderately resistant. WB-83 and GL-1 were highly susceptible to wilt, especially at seedling stage.
Aschochyta blight
Aschochyta blight caused by Phoma exigua desmaz.var. exiguadesmaz. (syn. Ascochyta phaseolorum Sacc.) is an emerging disease of beans in Kashmir Himalayas. A survey of important bean-growing areas revealed the disease intensity of Ascochyta blight ranging from 10.82 to 25.37% around flowering. The blight symptoms manifested by the crop revealed light to dark brown lesions on leaves with concentric zones. In germplasm screening programme, all the accessions, except WB-6, showed susceptibility under greenhouse conditions with typical blight symptoms when inoculated with P. exigua. WB-6 was moderately resistant to Aschochyta blight.
Biochemical properties
Protein content had a wide range of values in the landraces. Genotypes such as WB-92 and WB-5 had lower protein content (16.95 and 17.19%, respectively) while few genotypes had high protein content viz., WB-256 (23.21%) followed by WB-245 (21.87%) and WB-115 (21.23%). Phytic acid also had a wide range with some genotypes having <1% phytic acid in seed viz., WB-241 (0.37%), WB-243 (0.53%), WB-115 (0.73%) and WB-258 (0.98%), while few lines had higher phytic acid content including WB-245 (3.65%).
Water imbibition and cooking quality
Delayed cooking and hard-to-cook trait are important varietal attributes that have shaped up the adoption and persistence of landraces. Western Himalayan landraces are known for better cooking quality and organoleptic characteristics. In the present study, we evaluated the landraces for various water imbibition traits and cooking time score of the collected landraces. Water imbibition parameters viz., water absorption percentage, swelling coefficient, hydration coefficient and coat proportion were used in the present study as surrogates for cooking time (Fig. 4). Genotypes WB-245 absorbed the least amount of water when soaked overnight (24.76%), whereas WB-262 absorbed the largest quantity of water (270%). The swelling quotient ranged from 115.75% in WB-92 to 413.47% in (WB-261) while hydration quotient ranged from 124.76% (WB-245) to 370.21% (WB-262). Coat proportion was lowest in genotype WB-256 (5.83%) and highest (43.43%) in case of WB-245. For cooking time score, based on the scale used, eight genotypes (20%) were under-cooked (CTS = 1–2), 23 genotypes (57.50%) were average cooked (CTS = 3) and nine (20.43%) were over-cooked (CTS = 4–5). Among the accessions evaluated, WB-239, WB-222, WB-N-1, WB-1634, WB-241 and WB-258 were very easy to cook, whereas WB-240, WB-1282, WB-243 and WB-245 were difficult to cook.

Figure 4. Various parameters for assessing cooking quality in beans. (A) Seed swelling under soaking. (B) Testing seed hardness after cooking using durometer. (C) Alkali spreading test for cooking quality.
In order to develop a rapid and high-throughput method for assessment of cooking quality in beans, the Alkali Spreading Test was standardized at 3% KOH solution for 24 h (Fig. 4). The test was standardized using genotypes from the available diversity panel across various use categories. In the test, the easy to cook genotypes viz. WB-1634 was almost completely disintegrated as compared to WB-1282 that has longer cooking time. Similarly there was huge variation in hard shell percentage (seeds that do not imbibe water upon soaking) with a range of 5.13% (WB-115) to as high as 22.56% (WB-261).
Pod shattering resistance
The shattering resistance was measured in an in-house designed random impact apparatus made up of hard PVC cylinder of 20 cm diameter with six steel balls of 12 mm diameter. Out of the 40 landraces evaluated, only three landraces viz., N-2 with a shattering percentage of 20%, N-11 and WB-92 (30) were resistant in the random impact method while one genotype WB-401 was most susceptible with 100% shattering, followed by WB-6 (80%), WB-1634, N-10 and WB-341 (70%). The variability for shattering resistance in the genotypes is depicted in online Supplementary Figure 1
Water stress resistance
The landraces were screened for water stress under laboratory, green house as well as field conditions using paired comparison in 2016 and 2017. In the laboratory experiment, basal root angle, tap root length, basal root number and total root length were measured and wide variation was observed among the genotypes (online Supplementary Figure 2). The mean values for these traits were 42.39, 12.21 cm, 10.29 and 33.62 cm, respectively. Widest root angle was recorded for WB-1587 (56.670) and narrowest for WB-401 (32.120). Tap root length was highest in WB-1634 (15.65 cm) followed by WB-1587 (14.46 cm) and lowest in WB-258 (9.35 cm). Highest number of basal roots was recorded in WB-1587 (11.89) and lowest in WB-83 (9.11). Similarly, the total root length measured as sum of lengths of all roots was highest in WB-222 (51.32 cm) and lowest in WB-1304 (22.54).
In greenhouse, various root traits such as root depth, root biomass, root biomass partitioning, physiological traits such as canopy temperature depression, relative water content, membrane stability index as well as biochemical parameters such as chlorophyll stability, DAB assay and proline content were used to differentiate the lines for their plasticity under induced water stress. Among the genotypes, highest value for rooting depth under drought was recorded for WB-83 (114 cm) followed by WB-1634 (113.33 cm) and lowest was recorded for WB-451 (79 cm). In terms of root biomass partitioning, greater biomass (72.83%) was recorded at top under irrigated conditions against 45.99% at bottom under drought conditions with WB-401 having largest root biomass at top (87.71%) followed by WB-341 (77.66%) under irrigated conditions, while as under drought conditions, WB-222 had highest root biomass at top (47.21%) followed by WB-115 (46.26%). Similarly, root biomass at bottom was higher (54.01%) under drought conditions against 27.17% under irrigated conditions with WB-83 having largest root biomass at top (58.33%) followed by WB-1634 (55.86%) under drought conditions, while under irrigated conditions, WB-1634 had highest root biomass at bottom (38.01%) followed by WB-115 (30.71%).
Mean CTD across three stages (2, 3 and 4 weeks after stress imposition) was 0.82 and 2.45 °C, respectively, under drought and irrigated conditions, with highest CTD (coolest canopy) under drought stress recorded for WB-222 (1.49 °C) followed by WB-341 (1.15 °C) and lowest recorded for WB-1634 (0.35 °C). Mean RWC under drought and irrigated conditions was 58.38 and 69.49%, respectively, with WB-451 recording highest RWC under drought condition (71.07%) followed by WB-1634 (62.69%).
On the basis of field evaluation, WB-1634 exhibited lowest reduction in yield under water stress (11.33%) followed by WB-341 (17.88%) while genotypes such as WB-6 underwent highest reduction in yield under stress (55.09%) followed by WB-1587 (38.77%). There was substantial correspondence between various indirect surrogate traits used with yield as well as yield component performance of genotypes under stress (data not shown).
Discussion
Western Himalayan region is a rich repository of bean genetic resources evolved over generations of farmer selection. The present study was undertaken to assess the diversity of small-seeded red beans from various districts of Kashmir valley as well as Poonch, Rajouri and Bhaderwah areas of Jammu province which are world famous for their beans. Despite the fact that the bean diversity has arisen on account of varied selection pressures and farmer preferences for seed colour and plant type, nevertheless, among the lines studies, a number of desirable genotypes could be identified based on consistent performance between 2016 and 2020 for various quantitative traits such as maturity (WB-N-1, WB-242, N-10, WB-1634 and WB-N-11). For the first time, we identified an erect plant type in small-seeded red class viz., WB-N-1, WB-N-10 and WB-6, WB-N-11 that could be promoted under mono-cropping under plain areas of valley. Similarly for yield components, WB-1318, WB-341, WB-451, WB-N-1 and WB-1634 had high pod number; WB-1318, WB-236 and WB-1310 had higher pod length; WB-256 and WB-451 had high seed number; while WB-6 had large seeds. Seed yield also had a very broad range with genotypes WB-N-1, WB-222 and WB-341 being the highest yielders. Pole type climbing beans are invariably late maturing, but few early maturing lines have been identified in the present study. Based on the consistent performance at station trials, under AICRP MULLaRP as well as state minikit trials, two of the genotypes WB-341 and WB-1634 were identified for release at state level. In Kashmir valley, substantial diversity in beans has been reported by various earlier workers (Sofi et al., Reference Sofi, Rana and Bhat2014a; Saba et al., Reference Saba, Sofi, Zeerak, Bhat and Mir2016; Choudhary et al., Reference Choudhary, Hamid, Singh, Khandy, Sofi, Bhat and Mir2017) for yield and quality traits. The food value of common bean is largely confined to local consumer preferences and as such, traditional varieties and landraces offer great value to plant breeders as they possess better adaptability and quality.
Among variability parameters, higher PCV and GCV values were recorded for plant height, seed yield per plant and number of pods per plant and low for days to maturity, seed length and pod length. High heritability was recorded for all the traits ranging from 78.72% for seed yield per plant to 94.87% for plant height. Genetic advance as per cent of mean was high in all traits except days to maturity and seed length with highest value recorded for plant height, number of pods per plant, seed yield, 100-seed weight and seeds per pod. Similar results have been reported in earlier studies in bean collection from Western Himalayas by various workers (Rana et al., Reference Rana, Sharma, Tyagi, Chahota, Gautam, Singh, Sharma and Ojha2015; Saba, Reference Saba2016; Choudhary et al., Reference Choudhary, Hamid, Singh, Khandy, Sofi, Bhat and Mir2017; Sofi et al., Reference Sofi, Gul and Ara2020). Principal component analysis revealed that the first four PCs accounted for 73.73% variation. The GT biplot based on first two PCs explained 49.50% of total variation, mainly contributed by number of days to flowering and days to maturity in PC1 and seed yield per plant number of pods per plant and seeds per pod in PC2. Based on the factor loading graph, number of pods per plant, seeds per pod and pod length are strongly positively correlated with seed yield per plant. The genotype-trait biplot enables the comparison of accessions on the basis of the multiple traits and as such can be effectively used as independent selection criteria in multiple trait evaluation trials (Yan and Rajcan, Reference Yan and Rajcan2002). Sofi et al. (Reference Sofi, Zargar, Razvi, Sheikh, Saba and Shafi2014b) evaluated a set of 300 common bean accessions and found that PC1 contained traits related to maturity while PC2 contained traits related to productivity such as pods per plant, pod length as well as seed yield per plant. Rana et al. (Reference Rana, Sharma, Tyagi, Chahota, Gautam, Singh, Sharma and Ojha2015) have also reported similar results in 4274 accessions preserved in Indian bean bank (NBPGR) with three PCs accounting for about 80% of variation largely contributed by pods per plant, 100-seed weight, pod length and seed yield. Panchbhaiya et al. (Reference Panchbhaiya, Singh, Verma, Jatav and Maurya2017), Shama et al. (Reference Shama, Jabeen and Sofi2019) and Sofi et al. (Reference Sofi, Gul and Ara2020) also reported similar results in beans. Recently, Sofi et al. (Reference Sofi, Rehman, Gull, Kumari, Djanaguiraman and Prasad2021, Reference Sofi, Saba, Ara and Rehman2022) demonstrated the usefulness of a modified GYT biplot using the weighted relationship of trait performance in relation to grain yield and found similar results.
In Kashmir Himalayan region, many diseases occur with mild to severe intensities and cause appreciable damage to crop stand. Notable among the diseases that are prevalent in Jammu and Kashmir are BCMV, anthracnose, angular leaf spot, Fusarium wilt and Ascochyta blight. In the present study, various genotypes were found resistant to BCMV (WB-N-1, WB-N-11, WB-1318, WB-401, WB-451, WB-1634, WB-6); anthracnose (WB-1634 which was resistant to all the races of anthracnose viz., 2407, 3, 73, 87 and 513), whereas, the landraces that exhibited resistance against four races were WB-83 (2407, 3, 73, 87), three races were WB-258 (3, 73, 87), WB-92 (3, 87 and 513), against two races were genotypes WB-1282, WB-1304, WB-242, WB-191 and WB-92 (3 and 87), WB-243 (3, 73), WB-1310 (2407, 3); angular leaf spot (WB-6, WB-1634, WB-258, WB-451, N-1 and N-10 showed moderate resistance to ALS); Fusarium wilt (WB-341, WB-451, WB-N-1 and WB-1587) and Ascochyta blight (WB-6). Various earlier studies have reported similar or differential resistance response to various bean diseases under Kashmir Himalayas, especially BCMV (Wani et al., Reference Wani, Bhat, Mir, Dar and Sofi2017), anthracnose (Choudhary et al., Reference Choudhary, Bawa, Paliwal, Singh, Bhat, Mir, Gupta, Sofi, Thudi, Varshney and Mir2018; Banoo et al., Reference Banoo, Nabi, Rasool, Shah, Ahmad, Sofi and Padder2020), angular leaf spot (Dar et al., Reference Dar, Parrey and Khan2020; Ganie et al., Reference Ganie, Wani, Zargar, Sofi and Masoodi2020), Fusarium wilt (Amin, Reference Amin2018) and Ascochyta blight (Parveen et al., Reference Parveen, Yousuf, Bhat and Bhat2021). An encouraging observation across years and screening environments including hilly areas like Bhaderwah, Ladakh and Gurez is the stability of resistance response that allows us to premise that durable resistance can be achieved in beans. The accessions can be involved in planned crossing programme to combine high yield with disease resistance.
Cooking quality is a major varietal attribute in beans and determines the acceptability with end users. The issues related to energy requirements in bean value chain as well as implications of delayed cooking need more focus in breeding programmes. Despite the fact that red-seeded landraces are usually good in quality, there was substantial variability in cooking time score that provides opportunity for selection. However, a major impediment in screening large germplasm sets is the difficulty associated with cooking. In the present study, we used water imbibition parameters, coat proportion as well as alkali spreading test as effective surrogates for cooking quality. Saba et al. (Reference Saba, Sofi, Zeerak, Bhat and Mir2016) has also reported substantial variability in cooking quality parameters, organoleptic traits as well as established utility of surrogate traits for cooking quality in bean germplasm of Kashmir.
Shattering is an emerging issue in beans, especially the pole-type beans with sustained increase in summer temperatures in Kashmir Himalayas. This is accentuated by the curved pod structure with smaller ventral/dorsal length ratio of pods. In the present study, we made an attempt to identify shattering resistant genotypes as this problem is going to be more severe under increasing temperatures. We used a forced manual shattering protocol that overcomes any ambiguity in results obtained from field for shattering and found that while most of the genotypes were expectedly susceptible, WB-92 was highly resistant.
In view of looming threats of climate change, drought stress response has been incorporated as a major objective for selection, as the cultivars promoted for release are expected to encounter water stress in the field conditions. We improved our expertise and facilities for high-throughput phenotyping using an integrated approach based on root architecture, physiological and biochemical parameters to screen large germplasm sets for drought response (Sofi et al., Reference Sofi, Rehman, Gull, Kumari, Djanaguiraman and Prasad2021, Reference Sofi, Saba, Ara and Rehman2022). Given the substantial experimental evidence for roots as reliable adaptive traits under drought, it is imperative to have an in-depth understanding of their role in improving drought tolerance in bean (Rehman et al., Reference Rehman, Sofi, Nida and Bhat2015). An ideal root ideotype is expected to have a balanced distribution of root biomass in top and bottom strata to optimize the trade-off between water and nutrients such as N and P (Ho et al., Reference Ho, Rosas, Brown and Lynch2005; Sofi et al., Reference Sofi, Rehman, Gull, Kumari, Djanaguiraman and Prasad2021, Reference Sofi, Saba, Ara and Rehman2022). Among the evaluated lines, a wide diversity has been reported in root traits and physiological parameters that contribute to plasticity of a genotype under stress. The genotypes WB-341, WB-1634 and WB-N-1 have been found as consistent performers under water-stressed conditions both under naturally occurring rainfed as well as managed stress conditions.
Canopy temperature depression and relative water content are reliable indicators of plant water status under stress and are directly related to the efficiency of the root system in resource acquisition (Sofi et al., Reference Sofi, Zargar, Mir, Salgotra, Zargar and Salgotra2019). Differences in CTD are related to stomatal conductance that is reduced under stress as a plant response to water shortage and results in higher leaf temperature. However, there are physiologically efficient plant ideotypes that are called as water savers having lower CTD, higher RWC as well as higher yield. In the present study, WB-1634 had lower CTD under stress but consistently exhibited higher yield under stress (Sofi et al., Reference Sofi, Gul and Ara2020). Some of the lines identified in the present study viz. WB-341 and WB-1634 have performed well in national testing through AICRP system as well as state multi-location testing and have been identified for release in 2021.
Conclusion
North Western Himalayas, including Kashmir valley, is an important biodiversity hub of common bean in India. In view of the growing appreciation for the food and nutritional value of common bean, the efforts towards characterization and utilization of germplasm including local landraces have scaled up. Despite the fact that the genetic diversity in common bean in Kashmir is largely represented by local landraces that have adapted to lower yields under low input farming system, the accessions procured from NARS gene banks as well as CIAT have shown good adaptability and promise in terms of early maturity, disease and drought tolerance and better yield. We have observed useful variation for traits of economic importance and also developed cross-combinations that are at various stages of segregation.
Given the importance of Western Himalayan region in terms of crop biodiversity resources and food security and sustainability imperatives, local niche crops that have cultural value need to be conserved through promotion and large-scale cultivation which necessitates development of improved varieties that can favourably compete with cereals. Thus, phenotypic characterization, genetic and genomic studies can help harness the trait value of landraces and traditional varieties and help link gene banks and germplasm repositories with farmer's aspirations. Local biodiversity holds value in adaptive traits, organoleptic qualities and resilience to system bottlenecks. Red-seeded varieties are most prominent beans cultivated across whole Himalayan states and not only adds livelihood value to subsistence farming systems but also fetches better price on account of its quality.
In the present study, we evaluated a set of small-seeded red landraces for various traits related to morphological traits, disease resistance and water stress and cooking quality. We identified various genotypes for early maturity, pod and seed traits as well as disease resistance, water stress tolerance and cooking quality. WB-N-1 and WB-1634 were identified as resistant to BCMV, anthracnose, angular leaf spot and Fusarium wilt, whereas WB-1634 was tolerant to drought as well as had good cooking quality. These genotypes can be a valuable resource for developing bean varieties with broader resilience to biotic and abiotic stresses.
Supplementary material
The supplementary material for this article can be found at https://doi.org/10.1017/S1479262123000230.
Acknowledgements
The facility provided by Dean Faculty of Agriculture and data sharing and help provided in germplasm evaluation by various collaborators is acknowledged. Funding support from DST, India (Grant # SARTHI/JK/09) is also acknowledged.
Competing interest
None.