Introduction
The estuarine ecosystem in the Amazon region represents a highly complex and peculiar tropical environment, with several types of physiographic formations, such as mangroves, long tidal flats, islands and estuarine beaches (El-Robrini et al., Reference El-Robrini, Silva, Souza Filho, El-Robrini, Silva and França2006; Gregório and Mendes, Reference Gregório and Mendes2009). These estuarine beaches are situated inside a fluvial-marine ecosystem dominated by mangroves, controlled by meso- and macrotides, with waves of moderate energy and strong tidal currents (Sousa et al., Reference Sousa, Pereira, Costa and Jiménez2017). In the central zone of the Amazon coast, estuaries under the influence of large-scale rivers, as is the case of the Pará River, have a significant reduction in salinity (around zero) due to the high freshwater discharge they receive, especially during the rainy period (Gregório and Mendes, Reference Gregório and Mendes2009; Sousa et al., Reference Sousa, Pereira, Costa and Jiménez2017). Consequently, these estuaries have singular physiographic formations, such as freshwater estuarine beaches subject to semidiurnal mesotide regimes (3.6 m wide per amplitude) (El-Robrini et al., Reference El-Robrini, Silva, Souza Filho, El-Robrini, Silva and França2006).
In all Amazon regions, the variation of tidal regime, the large amount of sediments carried by rivers to the coast and the high hydrodynamics in shallow water favour the occurrence of beaches and tidal flat systems with different characteristics (Kjerfve and Lacerda, Reference Kjerfve, Lacerda and Lacerda1993; Rosa-Filho et al., Reference Rosa-Filho, Gomes, Almeida and Silva2011). These environments vary enormously in terms of sediment type and sorting, and previous studies showed that they may have cyclical modifications in morphology, with erosion processes dominating during the rainy months (associated with high fluvial discharge and strong tidal currents) and accretive processes occurring during the dry season (Pereira et al., Reference Pereira, Vila-Concejo and Short2013, Reference Pereira, Vila-Concejo, Short, Short and Klein2016). Considering these facts, the Amazon region with its peculiar estuarine ecosystem offers an interesting area to study the effects of sediment characteristics on aquatic fauna.
Some of the inhabitants of estuarine ecosystems are members of the meiofauna, which is a group of aquatic metazoans, characterized by their benthic habitat and body dimensions, which range from 0.044 to 0.5 mm (Mare, Reference Mare1942). In environments with running waters, such as estuaries, the complex interaction between properties of sediment particles and local hydrodynamics explains the distribution pattern at small and large scales, and it affects the abundance and diversity of organisms (Swan and Palmer, Reference Swan and Palmer2000; Traunspurger, Reference Traunspurger2000). The type of sediment, as well as the parameters linked to it (grain size and shape, surface area, porosity, water permeability, etc.), are key factors that determine interstitial habitat characteristics, thus affecting the availability of food for benthic fauna (Ingels et al., Reference Ingels, Santos, Hicks, Vazquez, Neres, Pontes, Amorim, Roman, Du, Stahl, Somerfield and Widdicombe2018).
Benthic communities differ from one another due to different types of sediment, with higher densities in muddy substrates, as they are rich in organic matter compared to sandy substrates, which are poor in organic matter (Ingels et al., Reference Ingels, Santos, Hicks, Vazquez, Neres, Pontes, Amorim, Roman, Du, Stahl, Somerfield and Widdicombe2018). Despite the wide variety of sediments providing a habitat for meiobenthos, a vertical profile predominates, which shows that the first few centimetres have oxygen supply and food particles, and therefore, provide more shelter to meiofauna organisms than deeper layers (Giere, Reference Giere2009). However, this pattern might be affected by tidal cycles (Boaden and Platt, Reference Boaden and Platt1971; Steyaert et al., Reference Steyaert, Herman, Moens, Widdows and Vincx2001). During low tide on marine sandy beaches, conditions on the sediment surface (temperature, salinity and water availability) are unfavourable, and thus, meiofauna tends to migrate to lower layers of the sediment column (Giere, Reference Giere2009). As for horizontal meiofaunal distribution, the highest abundance in sandy environments of marine beaches is frequently found in the middle intertidal zone, while in muddy sediments, which are less exposed, the highest species abundance and richness tend to occur closer to the water line (Giere, Reference Giere2009). However, estuarine beaches, particularly those located in the inner regions of estuaries, have no known pattern due to the limited amount of studies conducted in these environments.
Ecological studies on Nematoda in freshwater environments are scarce and most of them have been conducted in lentic ecosystems (Eyualem-Abebe et al., Reference Eyualem-Abebe, Andrássy and Traunspurger2006). In lotic ecosystems, quantitative composition and temporal and spatial distribution patterns are not well documented (Traunspurger, Reference Traunspurger2000). Studies on freshwater nematodes are based on data collected only in a few countries, with scarce data concerning South America (Traunspurger et al., Reference Traunspurger, Michiels, Eyualem-Abebe, Eyualem-Abebe, Andrássy and Traunspurger2006). In Brazil, the few ecological studies on meiofauna and freshwater Nematoda have been conducted only in freshwater environments, such as lakes, lagoons, streams, reservoirs or rivers with no influence of tides (Ferreira et al., Reference Ferreira, Gomes and López2008; Lisboa et al., Reference Lisboa, Silva and Petrucio2011; Flach et al., Reference Flach, Ozorio and Melo2012; Meira et al., Reference Meira, Moura and Garraffoni2013; Netto and Fonseca, Reference Netto and Fonseca2017; Pinto et al., Reference Pinto, Netto, Esteves, de Castro, Neres and Silva2021). An exception is Baia et al. (Reference Baia, Rollnic and Venekey2021), who studied Nematoda assemblages on an Amazon freshwater estuarine beach (environment subjected to tidal influence). Aside from this study, the taxonomic studies by Altherr (Reference Altherr1972, Reference Altherr1977) and Gerlach (Reference Gerlach1957) are the only ones on Nematoda in an Amazon estuary. However, neither evaluated the vertical distribution pattern of meiofauna and Nematoda.
Considering the peculiarity of estuarine beaches in the Amazon region, the present study investigated the meiofauna community (with special focus on Nematoda) on two sandy beaches and two muddy tidal flats in a freshwater estuary governed by mesotides, in order to compare the horizontal and vertical distributions of these organisms. Our hypotheses were: (H1) meiofauna community has higher densities in tidal flat areas with muddy sediment and higher richness in environments with sandy sediment; (H2) density and richness are higher in the upper layers of muddy sediments and in the lower layers of sandy sediments and (H3) these biological indicators are higher in the mid-littoral of sandy environments and in the lower mid-littoral of muddy environments.
Materials and methods
Study area
This study was conducted in Cotijuba Island (1°14′S and 48°32′W), an Amazon estuarine island that is part of a group of 39 islands comprising the insular area of the Municipality of Belém (Brazil) (Guerra, Reference Guerra2007) (Figure 1). The island is part of the Pará River estuary, central region of the Amazon coast, and is geographically located between the Marajó Archipelago and the Jutuba and Paquetá islands (Bello and Huffner, Reference Bello and Huffner2012). Cotijuba Island occupies an area of approximately 16 km2 and it has 12 freshwater beaches facing the Marajó Bay, comprising a 20 km long coast (Mascarenhas et al., Reference Mascarenhas, Guimarães, Santa Brígida, Pinto, Gomes Neto and Pereira2009). Tidal river currents are the driving factors of sedimentation processes in the Pará River estuary, resulting in regions where the river mouth is formed by sand banks or by compact or fluid mud deposits (Gregório and Mendes, Reference Gregório and Mendes2009). The existence of flat areas is common in the islands and river margins that comprise the Amazon estuary; they are subjected to daily floods due to tidal variation, and are comprised of clayish and silty sediments, called floodplain areas (El-Robrini et al., Reference El-Robrini, Silva, Souza Filho, El-Robrini, Silva and França2006). Part of the southern and southeastern margins of Cotijuba Island has soil and vegetation typical of these areas, with predominantly muddy soil.
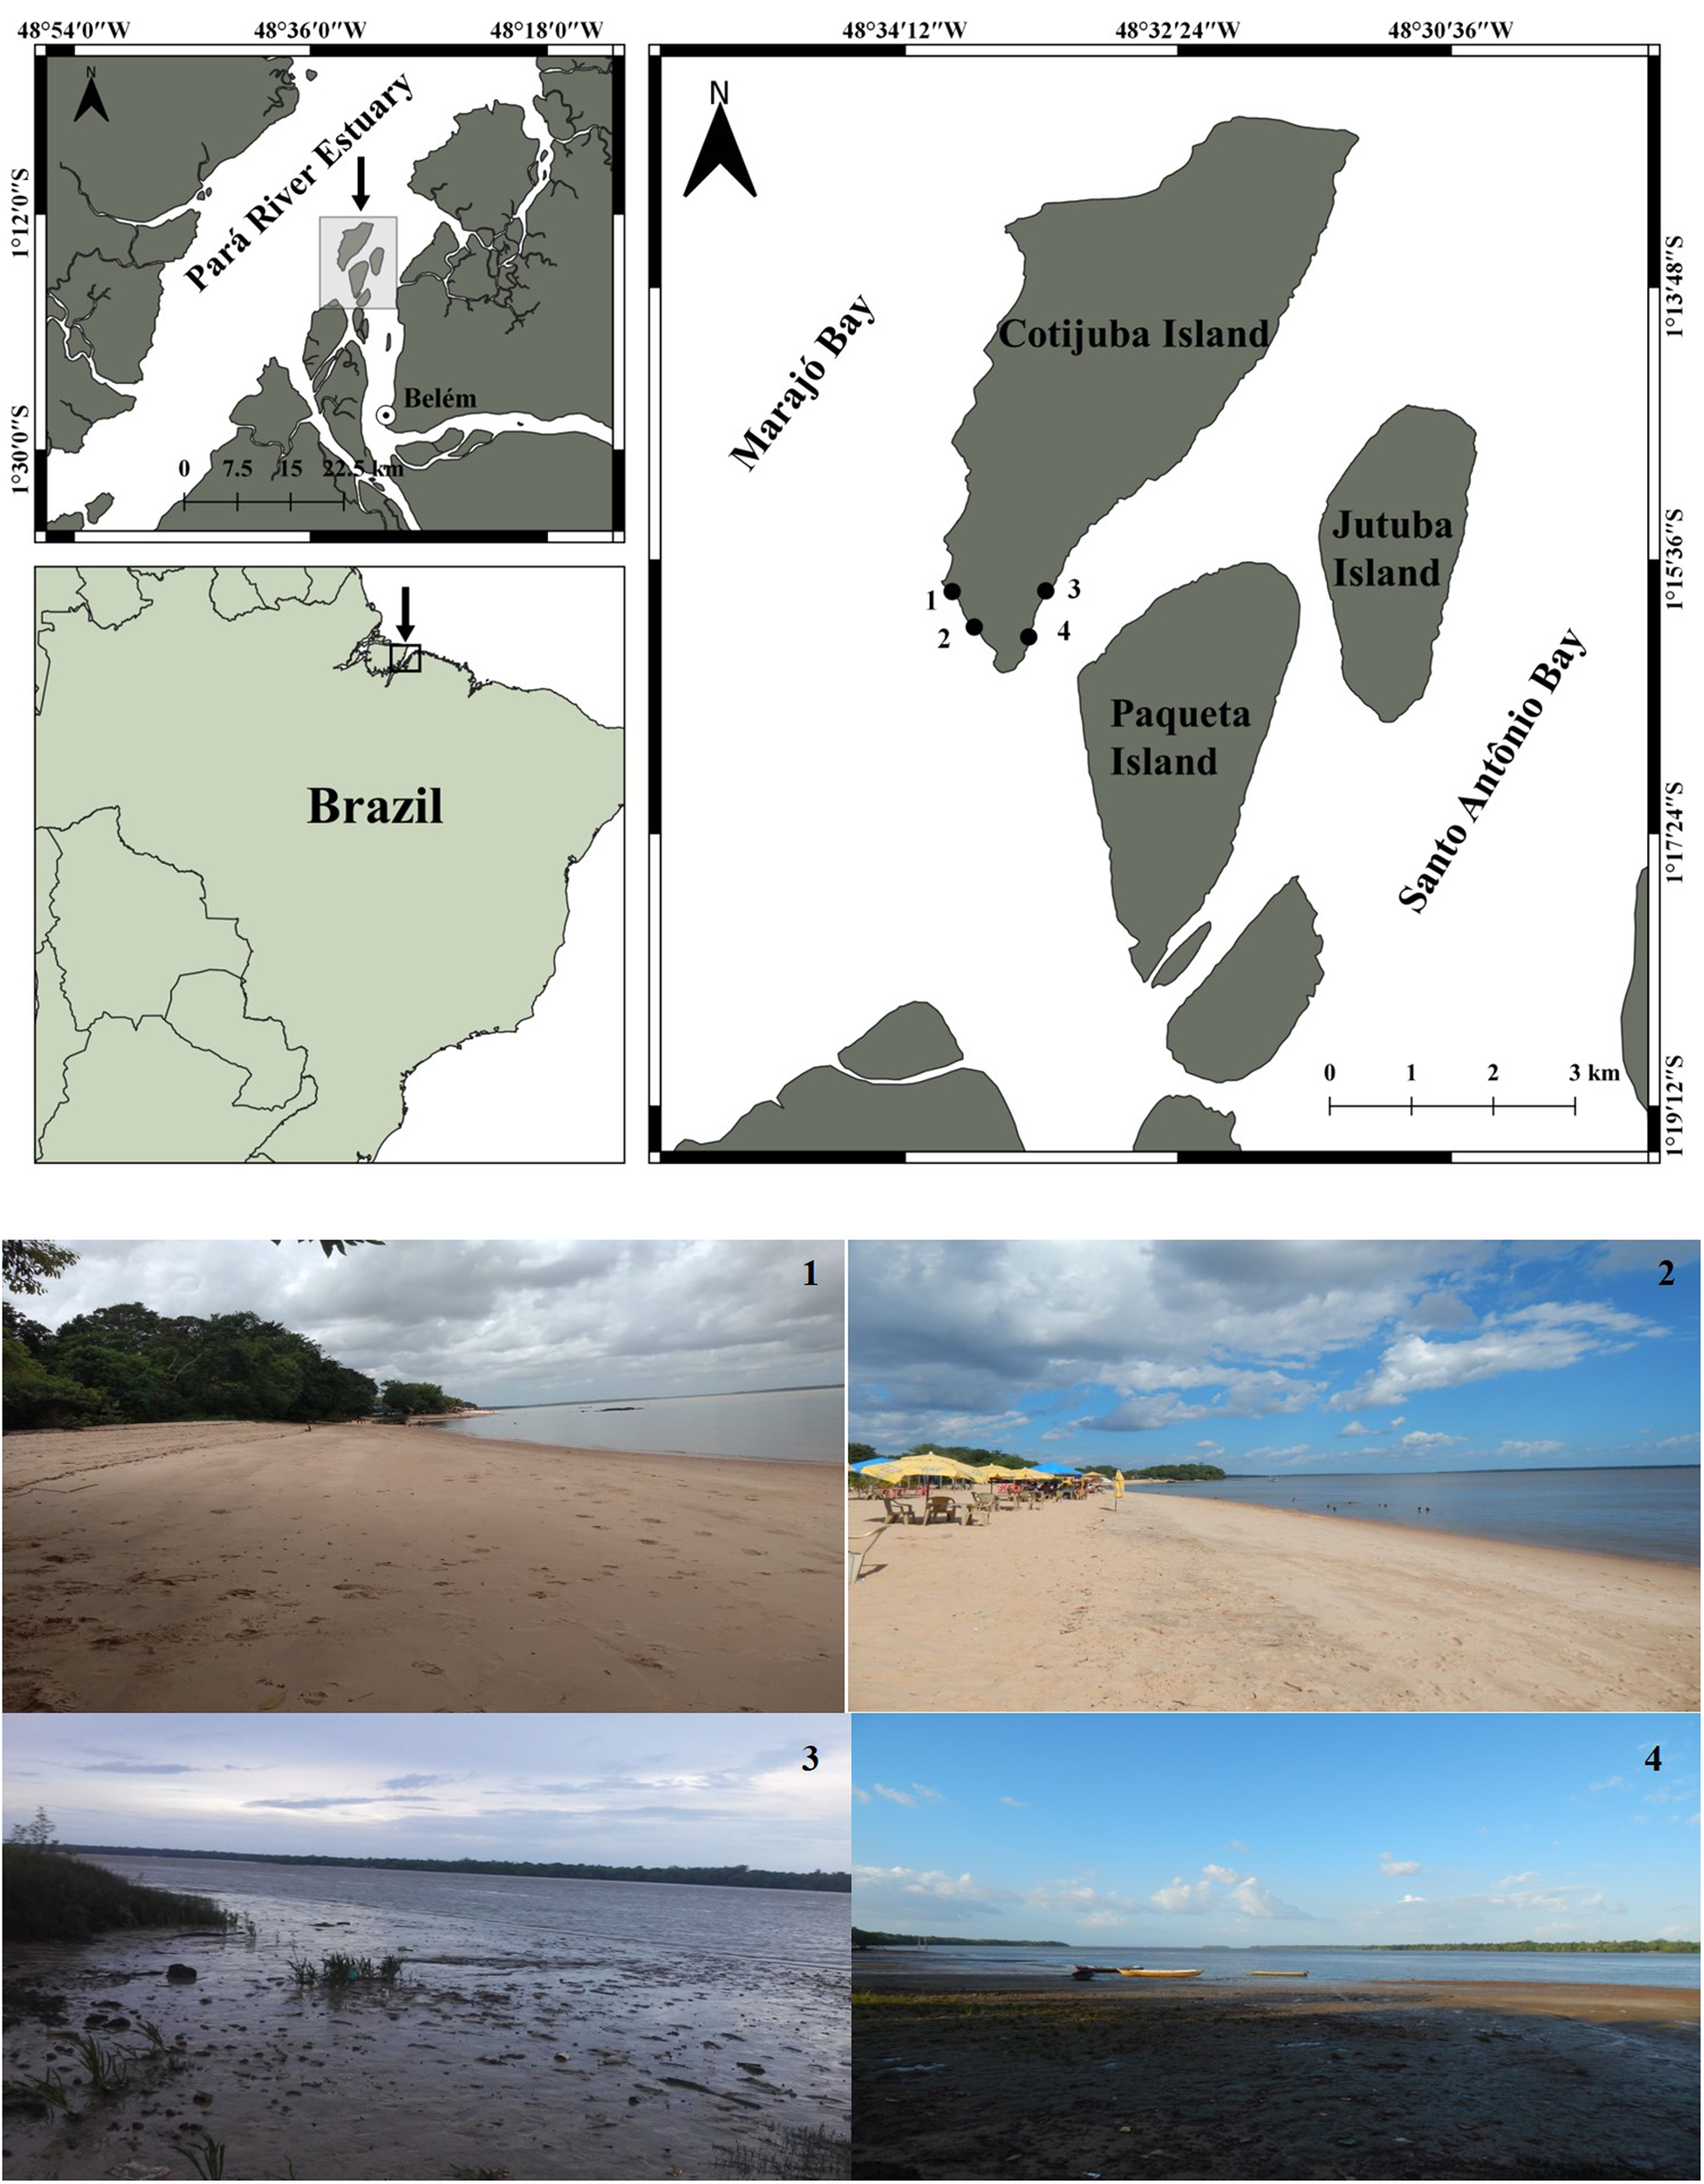
Figure 1. Location of sampling sites, indicated by points, in Cotijuba Island (Pará, Brazil): Praia do Amor − sandy A (1), Praia do Farol – sandy B (2) and tidal flats muddy A (3) and muddy B (4).
In the Pará River estuary, the tide decreases towards upstream, varying from macrotides in the coastal region to microtides in the inner part (Rosário et al., Reference Rosário, Borba, Santos and Rollnic2016). Cotijuba Island is located in a region governed by a mesotide regime (range 2–4 m) with predominance of semidiurnal variations. Climate in the region is tropical hot and super-humid, with a rainy period from December to June and a dry period from July to November (Mascarenhas et al., Reference Mascarenhas, Guimarães, Santa Brígida, Pinto, Gomes Neto and Pereira2009). Seasonal input from rainwater discharge generates a period with higher discharge, from January to May, and a period with lower discharge, from August to November (ANA, 2019). There is no salinity during the high discharge period in the estuarine region where Cotijuba Island is situated (freshwater condition), and salinity in this region might reach a maximum of 4 practical salinity unit during low discharge (Rosário et al., Reference Rosário, Borba, Santos and Rollnic2016).
Four environments were selected in Cotijuba Island for the present study, with different sedimentological features: Praia do Amor (Amor Beach) – sandy A (1°15′50″S and 48°33′54″W), Praia do Farol (Farol Beach) – sandy B (1°16′4″S and 48°33′46″W) and two muddy tidal flats parallel to these beaches, designated muddy A (1°15′49″S and 48°33′17″W) and muddy B (1°16′07″S and 48°33′24″W) (Figure 1). Farol and Amor beaches are located in the southern area of the island and face towards Marajó Bay. These beaches have sandy sediment, and Praia do Amor Beach also has rocky outcrops. Tidal flats with muddy sediments are located in the southern region, yet are in the opposite side of the island, on the margin facing towards Jutuba and Paquetá islands.
Sampling and sample processing
Samplings were conducted in July 2018, at salinity zero, which represents freshwater condition. A transect was marked perpendicularly to the spring high-tide line in each environment, and three sampling points were established along this transect, corresponding to the upper mid-littoral (P1), middle mid-littoral (P2) and lower mid-littoral (P3). For meiofauna and sediment sampling, a 0–2, 2–4, 4–6, 6–8 and 8–10 cm stratified sampling design was used (Figure 2). Using a 3 cm diameter corer, three meiofauna samples and one sediment sample were removed from each layer in each point of the mid-littoral (totalling 45 biotic samples and 15 sediment samples in each environment). Samples were stored in plastic flasks, and biological samples were fixed with 4% formaldehyde. Sediment temperature was measured in each layer using a soil thermometer with a bulb.
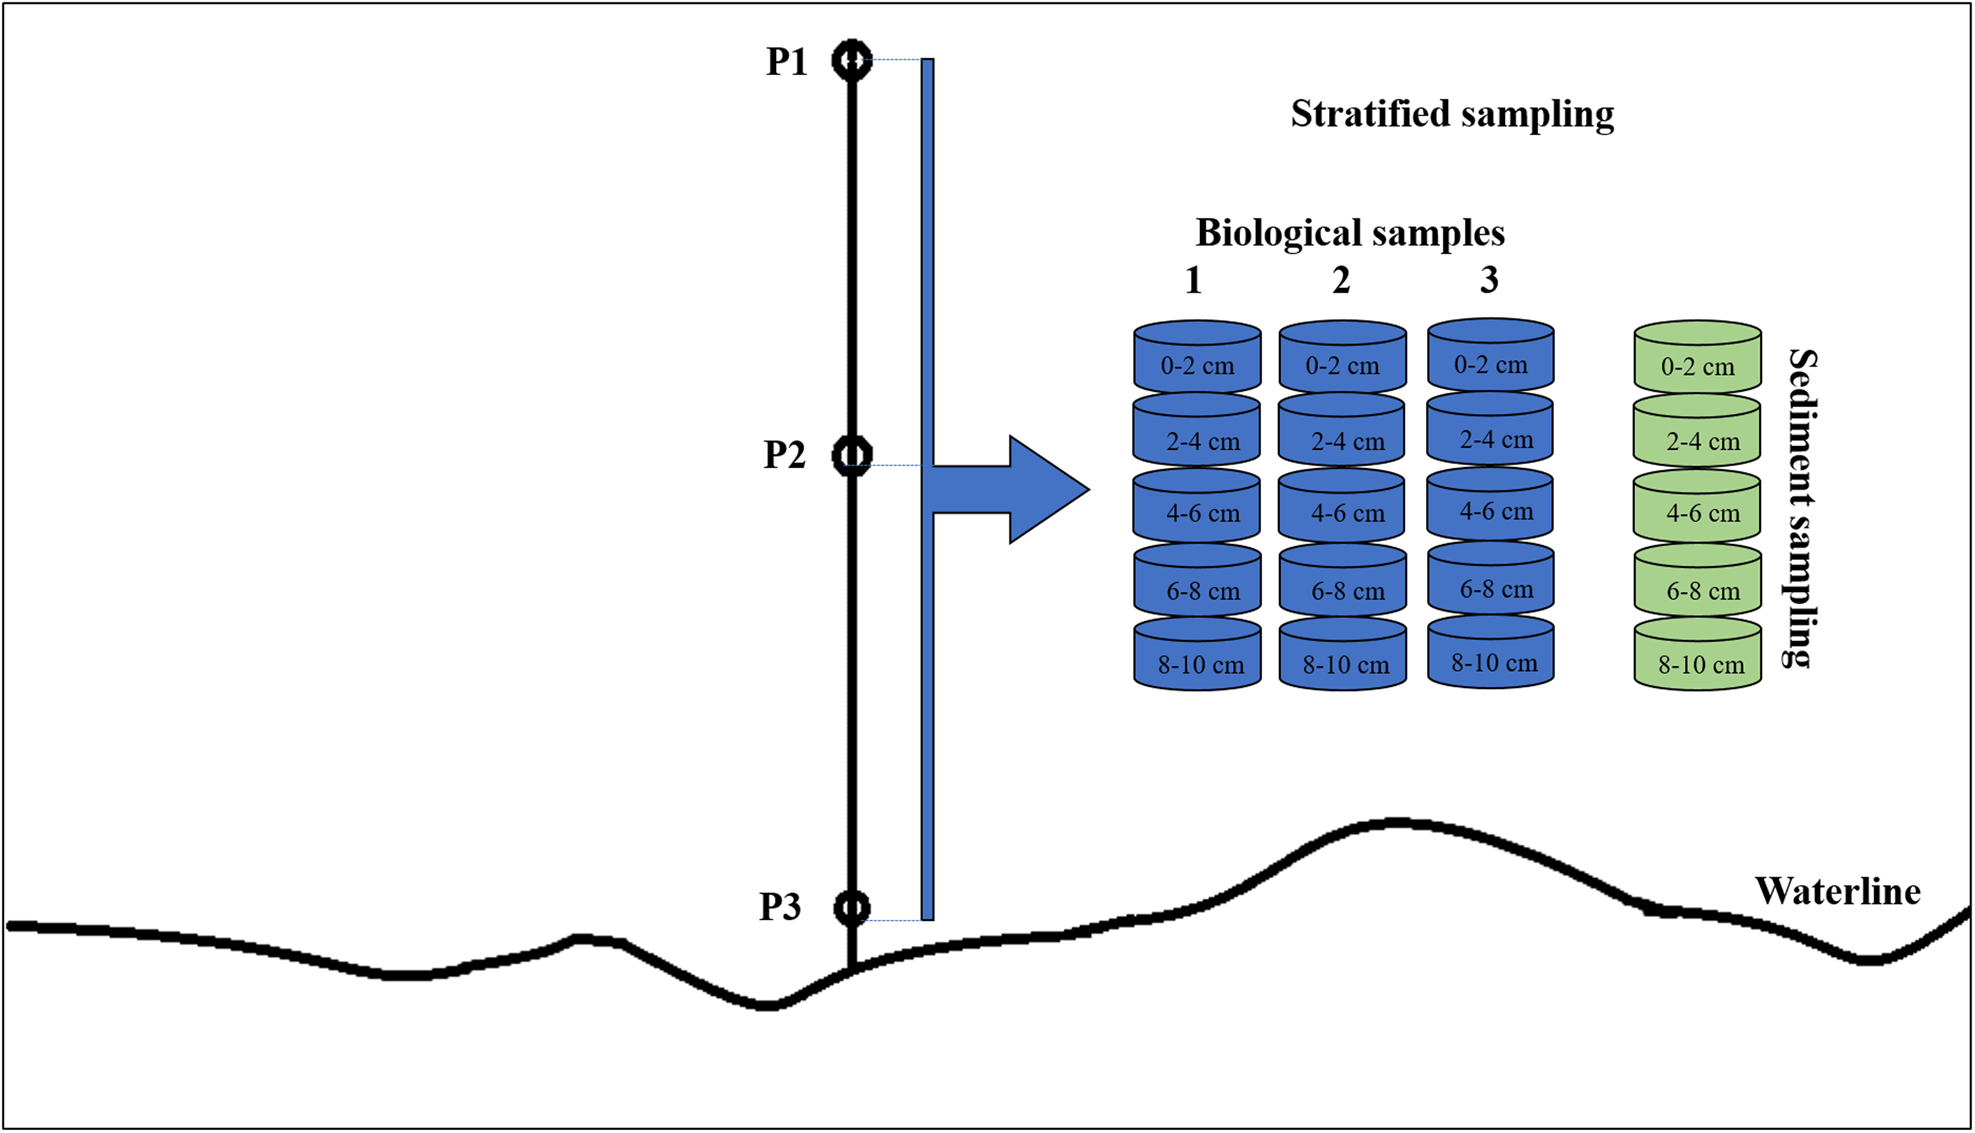
Figure 2. Schematic diagram showing the sampling design of meiofauna and sediment samples.
Meiofauna samples were sieved through 500 and 45 μm meshes and extracted through the flotation technique using a colloidal silica solution with a density of 1.18 g cm−3 (Somerfield et al., Reference Somerfield, Gee and Warwick2005). Subsequently, meiofauna was stored in plastic flasks containing 4% formaldehyde and stained with Bengal Rose. All animals present in each meiofauna sample were counted and classified to the level of large zoological groups, according to Giere (Reference Giere2009). Nematoda were removed from each sample (where possible) and placed in embryo dishes to undergo the diaphanization process (De Grisse, Reference De Grisse1969). Subsequently, nematodes were placed on permanent slides (Somerfield et al., Reference Somerfield, Gee and Warwick2005) and identified to the genus level based on picture keys by Warwick et al. (Reference Warwick, Platt and Somerfield1998) and Zullini (Reference Zullini2010), as well as on literature available at the website Nemys (Nemys eds, 2021). As it is a functional attribute of Nematoda assemblages, the animals were grouped according to the classification proposed by Traunspurger (Reference Traunspurger1997) for freshwater studies: (1) deposit feeders: generally without teeth, they feed on bacteria and single-cell eukaryotes, which are swallowed whole; (2) scrapers: they have a small tooth and feed on bacteria, single-cell eukaryotes and microalgae; (3) chewers: generally have a large, sclerotized buccal cavity with one or more teeth and denticles and (4) suckers: they have a stylet and are omnivores. Sediment granulometry was performed by sieving coarse sediment and by pipetting fine sediment (Suguio, Reference Suguio1973).
Data analysis
Meiofauna density (ind. 10 cm–2) and richness (number of groups) were calculated for each sample, as well as nematode density (ind. 10 cm–2) and richness (number of Nematoda genera). Cochran's test was used to check the homogeneity of variances, and where required, data were log-transformed (x + 1). To analyse differences in meiofauna density and richness, as well as in Nematoda density and richness among environments (sandy A, sandy B, muddy A and muddy B), intertidal zones (P1, P2 and P3) and sediment layers (0–2, 2–4, 4–6, 6–8 and 8–10 cm), an analysis of variance (factorial ANOVA) was used. A posteriori Tukey's test was used whenever significant differences were observed.
In order to describe and compare meiofauna community and Nematoda assemblage structure, a permutational multivariate analysis of variance (PERMANOVA) was used based on a similarity matrix, after data were log-transformed (x + 1), which was calculated using Bray–Curtis similarity index. Meiofauna community and Nematoda assemblage structure were observed using non-metric multidimensional ordination (nMDS) and the contributions of each taxon to the dissimilarity among environments, zones and sampling layers were analysed using the similarity percentage (SIMPER). Additionally, PERMANOVA was run for Nematoda trophic groups (according to the classification proposed by Traunspurger [Reference Traunspurger1997]).
Abiotic data (sorting degree, mean grain size, sand, clay, silt percentages and temperature) were log-transformed (log x + 1) and standardized to homogenize variances. To correlate the meiofauna community structure and Nematoda association structure and environmental variables, distance-based linear models (DistLM) were fitted (Anderson, Reference Anderson2001), using the same matrices described above. The best models in DistLM were chosen using a forward routine with 9999 permutations based on Akaike Information Criterion selection criterion (Anderson et al., Reference Anderson, Gorley and Clarke2008). A significance level of 0.05 was used for all analyses. STATISTICA 8, PRIMER 6.1.13 and PERMANOVA+ 1.0.3 (Anderson et al., Reference Anderson, Gorley and Clarke2008) were used for the statistical tests, and SYSGRAN 3.0 was used for granulometric data processing.
Results
Environmental characterization
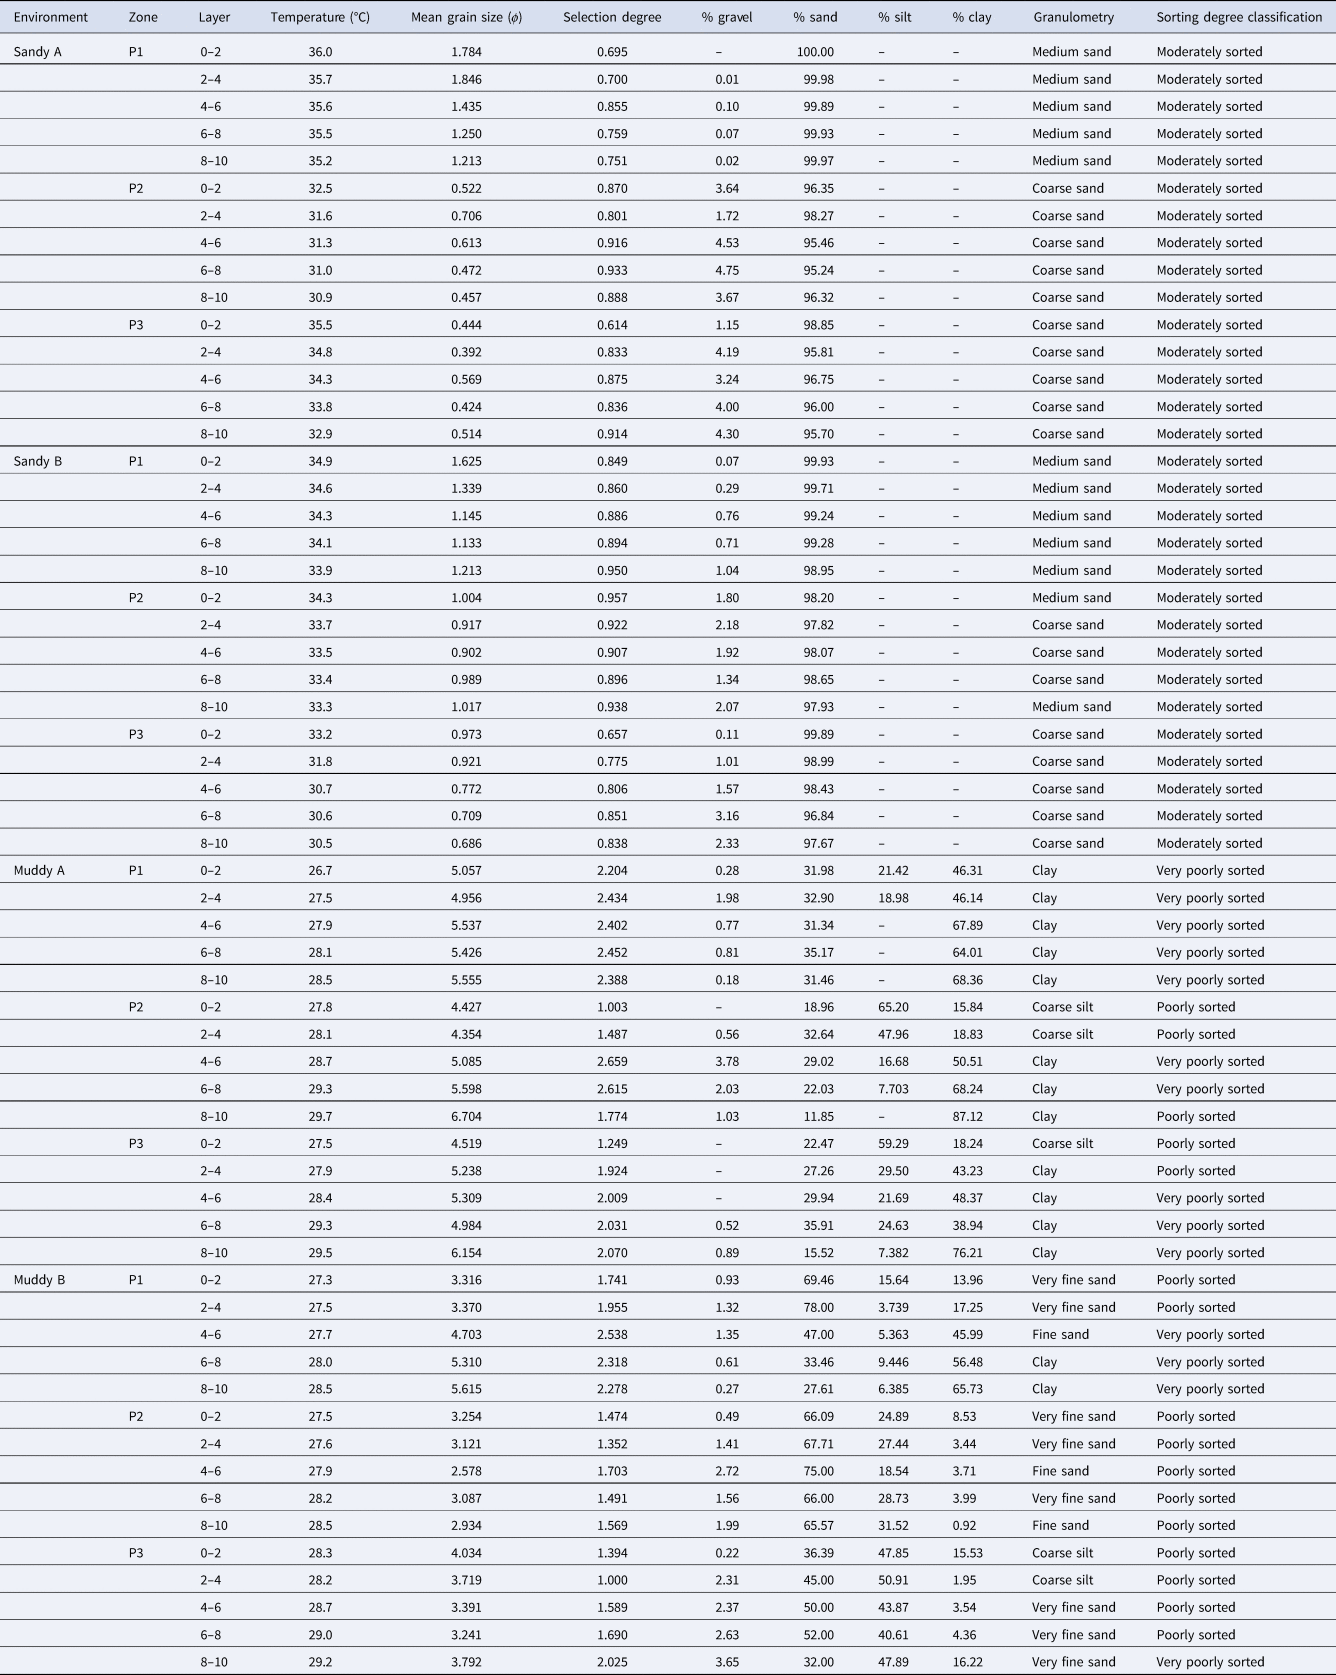
Sediment temperature varied from 30.9 to 36.0°C in sandy A, from 30.5 to 34.9°C in sandy B, from 26.7 to 29.7°C in muddy A and from 27.3 to 29.2°C in muddy B. The pattern of this variable was different among layers in the different types of environment. There was a subtle decrease in temperature from the upper layer to the lower layer. The pattern in tidal flats, on the other hand, was the opposite, with an increase in temperature from the upper layer towards the lower layer (Table 1).
Table 1. Environmental factors in sediment layers (cm) and mid-littoral zones in the studied environments in Cotijuba Island (Pará, Brazil)
–, represents zero; P1, upper mid-littoral; P2, middle mid-littoral; P3, lower mid-littoral.
Sandy A and B were characterized by medium sand in P1 layers and by coarse sand in all P2 and P3 layers (except for the 0–2 and 8–10 layers in P2 of sandy B, where medium sand was predominant). Most layers in the muddy A zone were characterized by having clay, and sediment composition in muddy B was quite heterogeneous among layers, with predominance of fine sand (4–6 cm in P1 and 4–6 and 8–10 cm in P2), very fine sand (0–2 and 2–4 cm in P1; 0–2, 2–4 and 6–8 in P2; and 4–6 to 8–10 cm in P3), coarse silt (0–2 and 2–4 cm in P3) or clay (6–8 and 8–10 cm in P1). Sediment was moderately sorted in all layers of all zones on both beaches. In muddy A, sediment was predominantly very poorly sorted, with few exceptions where it was poorly sorted (0–2, 2–4 and 8–10 cm in P2 and 0–2 and 2–4 cm in P3). In muddy B, sediment was predominantly poorly sorted, with a few exceptions where it was very poorly sorted (0–6, 6–8 and 8–10 cm in P1 and 0–2 and 2–4 cm in P3) (Table 1).
Meiofauna community
The 13 meiofauna groups found were Nematoda, Copepoda, Oligochaeta, Tardigrada, Acari, Rotifera, Turbellaria, Polychaeta, Cladocera, Gastropoda, Insecta larvae, Nauplii and Psocoptera. Turbellaria was only present in sandy environments while Gastropoda and Cladocera were only present in muddy environments (Supplementary Table S1). Copepoda was the most numerically abundant group both in sandy A and B (24 and 34%, respectively), followed by Nematoda (23%) and Acari (23%) in sandy A, and Oligochaeta (28%) and Nematoda (20%) in sandy B. In muddy environments, Nematoda was the dominant group, comprising over 90% of all meiofauna, both in muddy A and B.
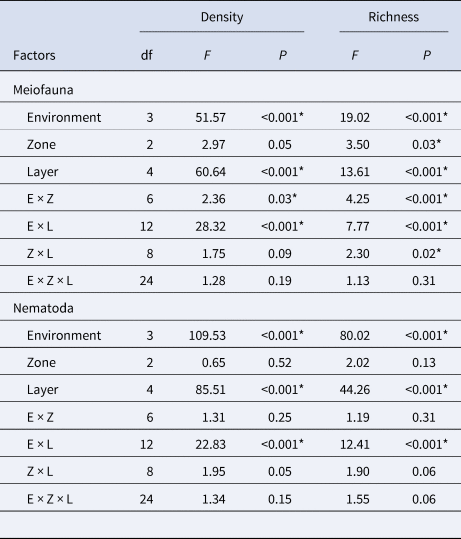
Mean total meiofauna density varied from 3.36 ind. 10 cm–2 in sandy B to 165.38 ind. 10 cm–2 in muddy A (Supplementary Table S2 and Figure 3). Density presented significant differences among environments; it was higher in muddy environments and lower in sandy environments (Table 2). In the intertidal zone of sandy A and B, density was higher in P3 (10.37 and 6.41 ind. 10 cm–2, respectively), decreasing in P2 and increasing again in P1. In muddy A, an inverse pattern was observed, with higher density in P2 (188.06 ind. 10 cm–2) and decreasing towards the edges of the intertidal zone. Density in muddy B was higher in P3 (90.49 ind. 10 cm–2) and it decreased gradually towards P2 and P1. However, values did not have a significant difference among zones in any of the environments (Table 2).
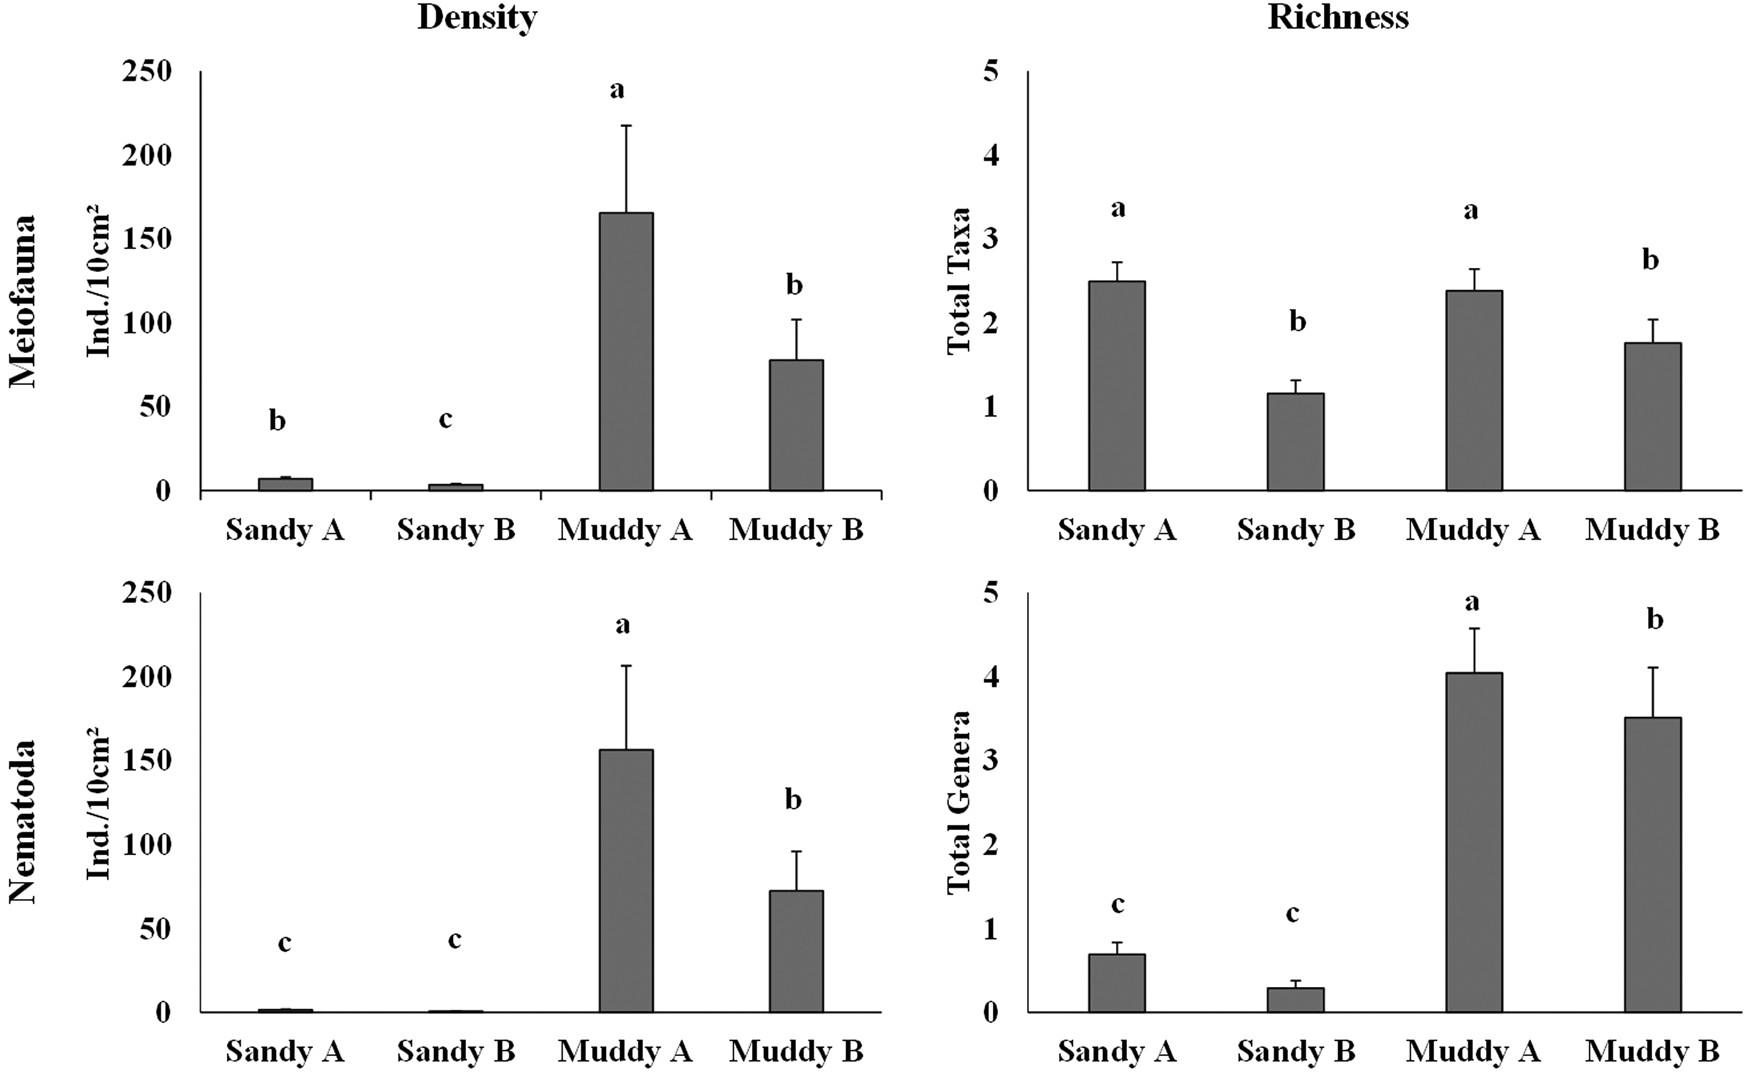
Figure 3. Mean total density (ind. 10 cm–2 ± standard error) and mean richness of meiofauna and Nematoda on the sandy beaches and muddy tidal flats studied. Different letters indicate significant differences (P < 0.05) between environments.
Table 2. Factorial ANOVA results of density and richness of meiofauna community and Nematoda assemblages in sandy and muddy environments in Cotijuba Island
E, environment; Z, zone; L, layer; df, degrees of freedom.
* Represents significant difference (P < 0.05).
Distribution of mean meiofauna density in sandy environments did not have a quite well-established pattern along the sediment column. The highest densities both in sandy A and B were observed in the lowest layers of P3; 6–8 (14.62 ind. 10 cm–2) and 8–10 cm (16.52 ind. 10 cm–2), respectively (Figure 4). On the other hand, mean meiofauna density in muddy A and B was higher in the upper layers, 0–2 cm (888.88 in P2 and 421.79 ind. 10 cm–2 in P3, respectively), and it decreased gradually towards the lower layer, 8–10 cm (Figure 4). In the 0–2 layer in P1 and 4–6 cm layer in P2 of sandy B, and 8–10 in P1 and 8–10 cm in P3 of muddy B, meiofauna density was 0 ind. 10 cm–2. There was no significant difference in density among layers of the several zones on both beaches. In muddy environments, meiofauna density was significantly higher in the upper layer, 0–2 cm, of all zones (except for P3, where 0–2 did not differ from 2 to 4 cm) (Table 2).
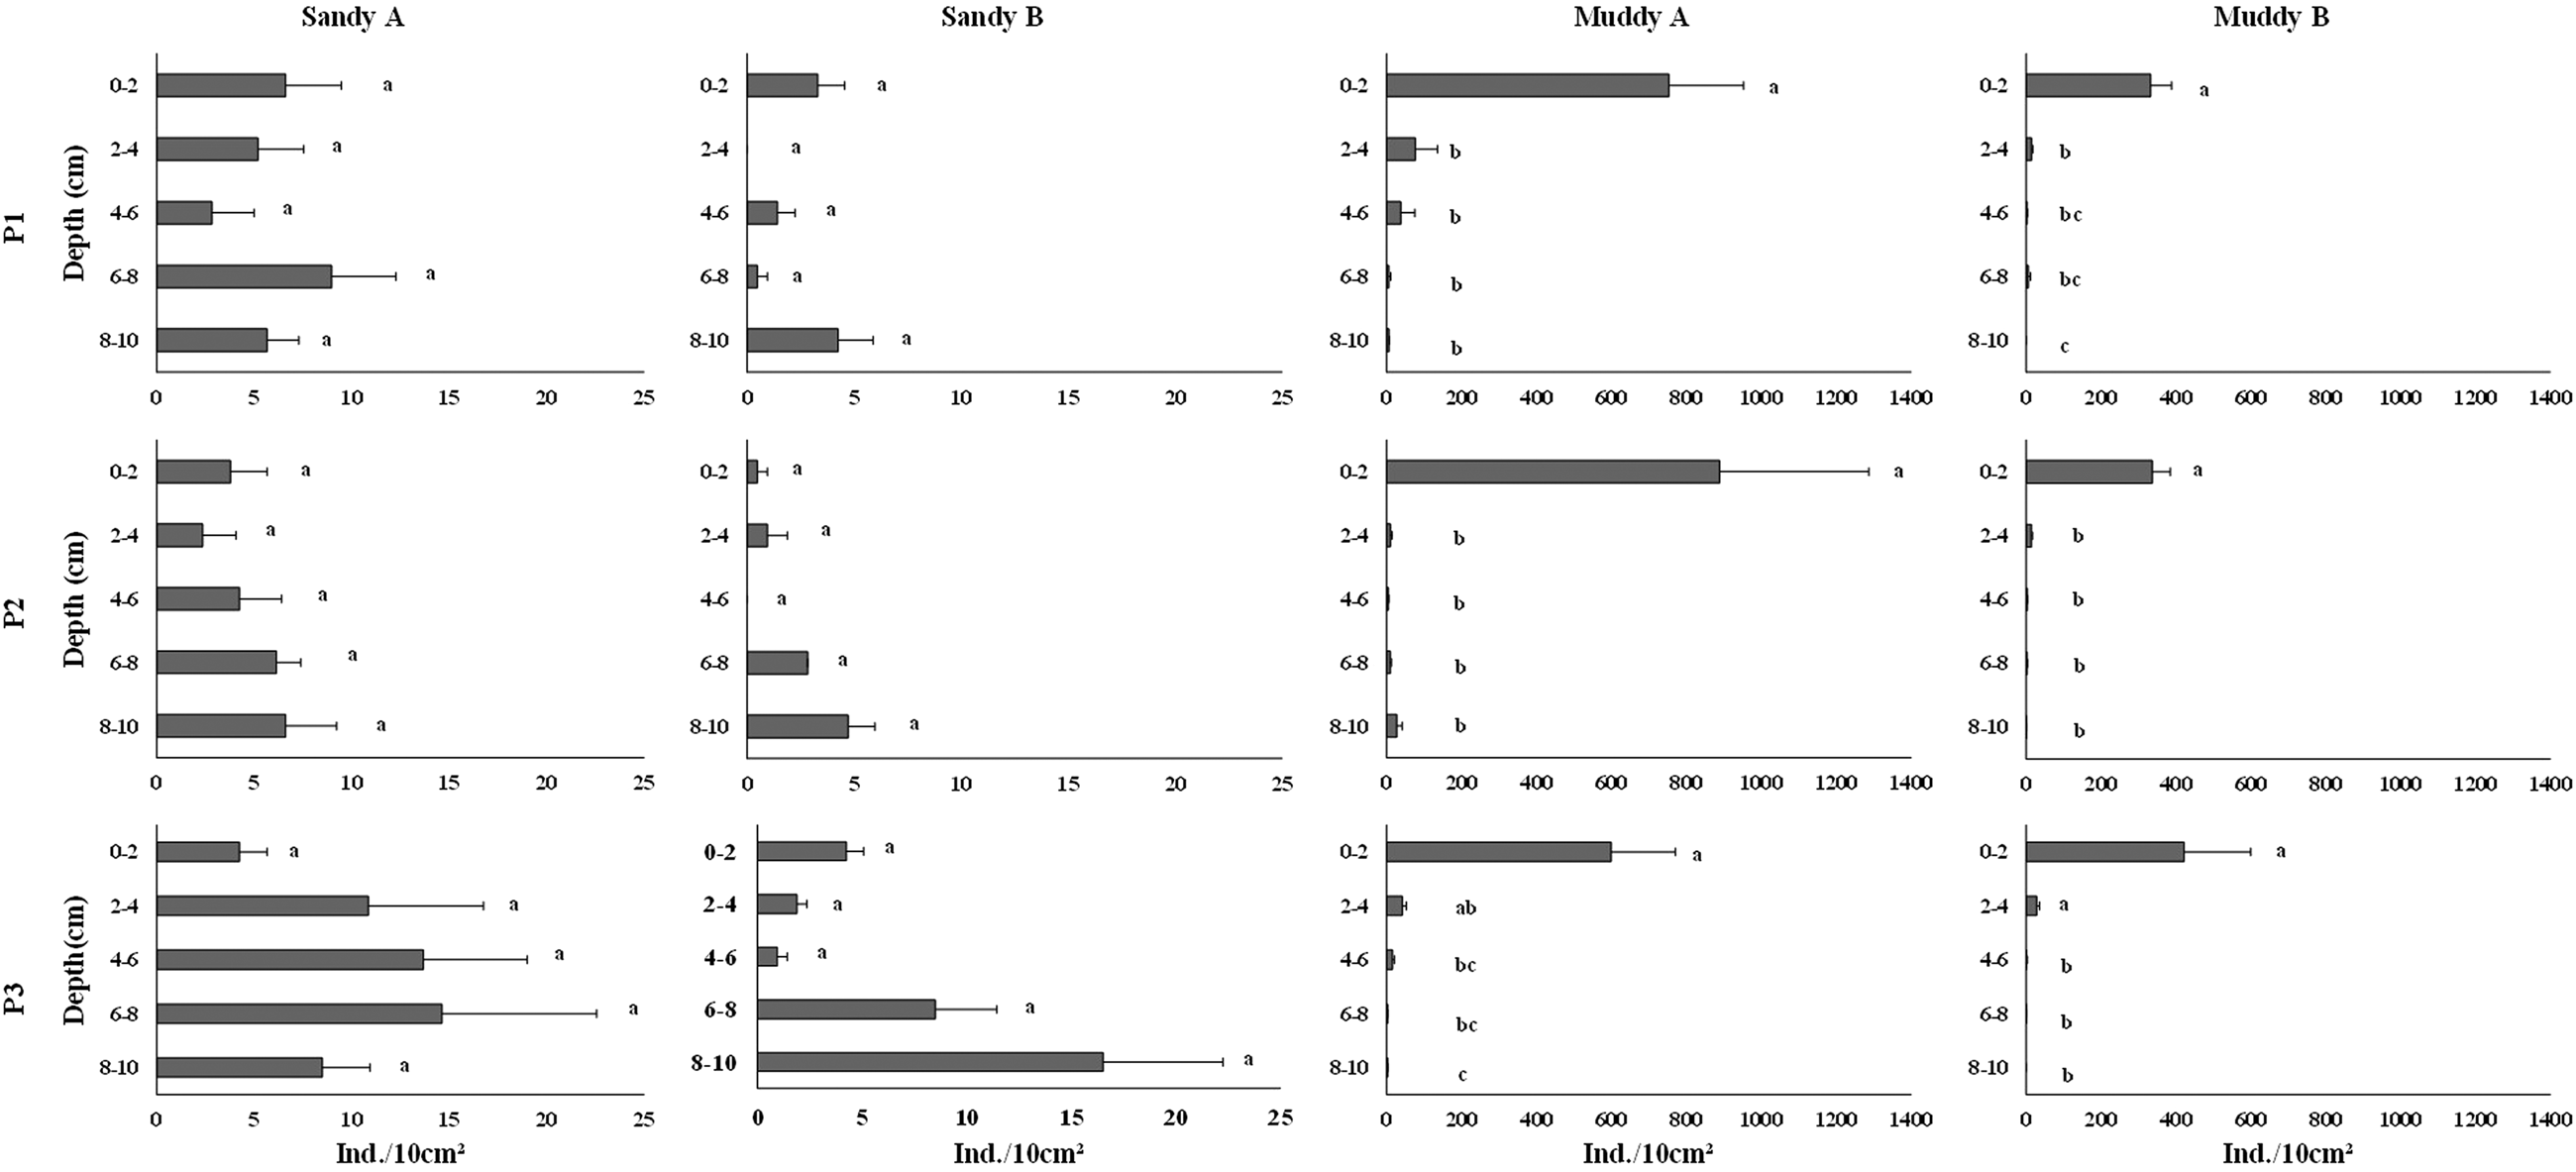
Figure 4. Mean density (ind. 10 cm–2 ± standard error) of meiofauna along the layers of each zone in the sandy and muddy environments studied. Different letters indicate significant differences (P < 0.05) between layers.
Mean meiofauna richness varied from 1.15 groups in sandy B to 2.48 groups in sandy A (Supplementary Table S2 and Figure 5). ANOVA showed that there was a significant difference in richness among environments, with richness in sandy A and muddy A significantly higher than that of sandy B and muddy B (Table 2). Along the intertidal zone, the highest mean richness in sandy A and B was in P3 (3.2 and 1.8 groups, respectively), decreasing towards P2 and increasing again in P1. In muddy A and B, the mean number of taxa was higher in P2 (2.73 and 2 groups, respectively), decreasing towards the edges of the intertidal zones of P1 and P3. However, only sandy B had a significant difference in the number of taxa among zones. Meiofauna richness in sandy environments did not have a well-established distribution pattern along the sediment layers; it was higher in the 6–8 cm layer (P3) of sandy A and in 0–2 cm (P3) of sandy B (4 and 2.66 groups, respectively). In muddy A and B, on the other hand, mean richness had a distribution pattern along the sediment column, with higher values in the upper layer, 0–2 cm, of P2 and P1 (5.33 groups in both), and decreasing gradually with depth (Figure 5). A significant difference among layers occurred only in muddy B, with the highest value in the upper layer, 0–2 cm, compared to the lower layers. ANOVA results showed that there was a significant difference in density and richness considering the interaction between factors (except for zone × layer for density and environment × zone × layer for both descriptors) (Table 2).

Figure 5. Mean meiofauna richness along the layers of each zone in the sandy and muddy environments studied. Different letters indicate significant differences (P < 0.05) between layers.
In sandy A, the relative participation of each group along layers was quite heterogeneous in P1 and P3, while Copepoda was dominant in all layers of P2. Nematoda was the dominant group in several layers of sandy B (0–2 and 8–10 cm in P1; 2–4 and 6–8 cm in P2; and 0–2 and 4–6 cm in P3), Copepoda dominated the 8–10 cm layer in P2 and P3 and Oligochaeta dominated in only one layer (6–8 cm in P3). In muddy environments, Nematoda was the numerically dominant group in all zones and layers (except for the 6–8 cm layer in P3 in both muddy environments) (Figure 6).

Figure 6. Relative participations of meiofauna taxa in the layers of each zone in both sandy and muddy environments studied on Cotijuba Island.
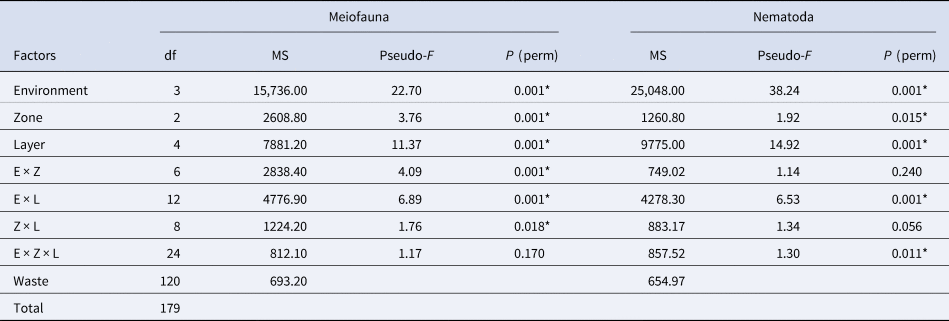
Meiofauna community structure differed among environments, zones and layers and in their interactions (except for the interaction environment × zone × layer) (Supplementary Table S3 and Table 3). There was a difference in sample clustering in muddy environments compared to sandy environments. Regarding only sandy environments, no clear clustering of samples from zones or layers was observed. In muddy environments, there was no clear clustering of samples from zones; however, samples from 0 to 2 and 2 to 4 cm layers clustered separately from each other and both separately from the other layers (Figure 7). The highest dissimilarity in the community occurred between sandy B and muddy B (87.52%), and Nematoda (48.82%), Copepoda (15.56%) and Oligochaeta (10.16%) were the groups that most contributed to this difference. Among zones, the highest dissimilarity occurred between the upper mid-littoral (P1) and middle mid-littoral (P2) (78.87%), due to the contribution of Nematoda (43.64%), Copepoda (20.31%) and Acari (17.80%). The highest dissimilarity within the community regarding sediment layers occurred between 4–6 and 8–10 cm (80.85%). Once again, Oligochaeta (39.42%), Copepoda (31%) and Acari (21.05%) were the groups that most contributed with the dissimilarity among layers. The best DistLM explained 11.75% of variation in meiofauna community structure (AIC = 1292, r 2 = 0.20), and this analysis also showed that all the investigated environmental variables influenced the variation in meiofauna community.
Table 3. PERMANOVA results of meiofauna community and Nematoda assemblage structure in sandy and muddy environments in Cotijuba Island
E, environment; Z, zone; L, layer; df, degrees of freedom; MS, mean squares.
* Represents significant difference (P < 0.05).
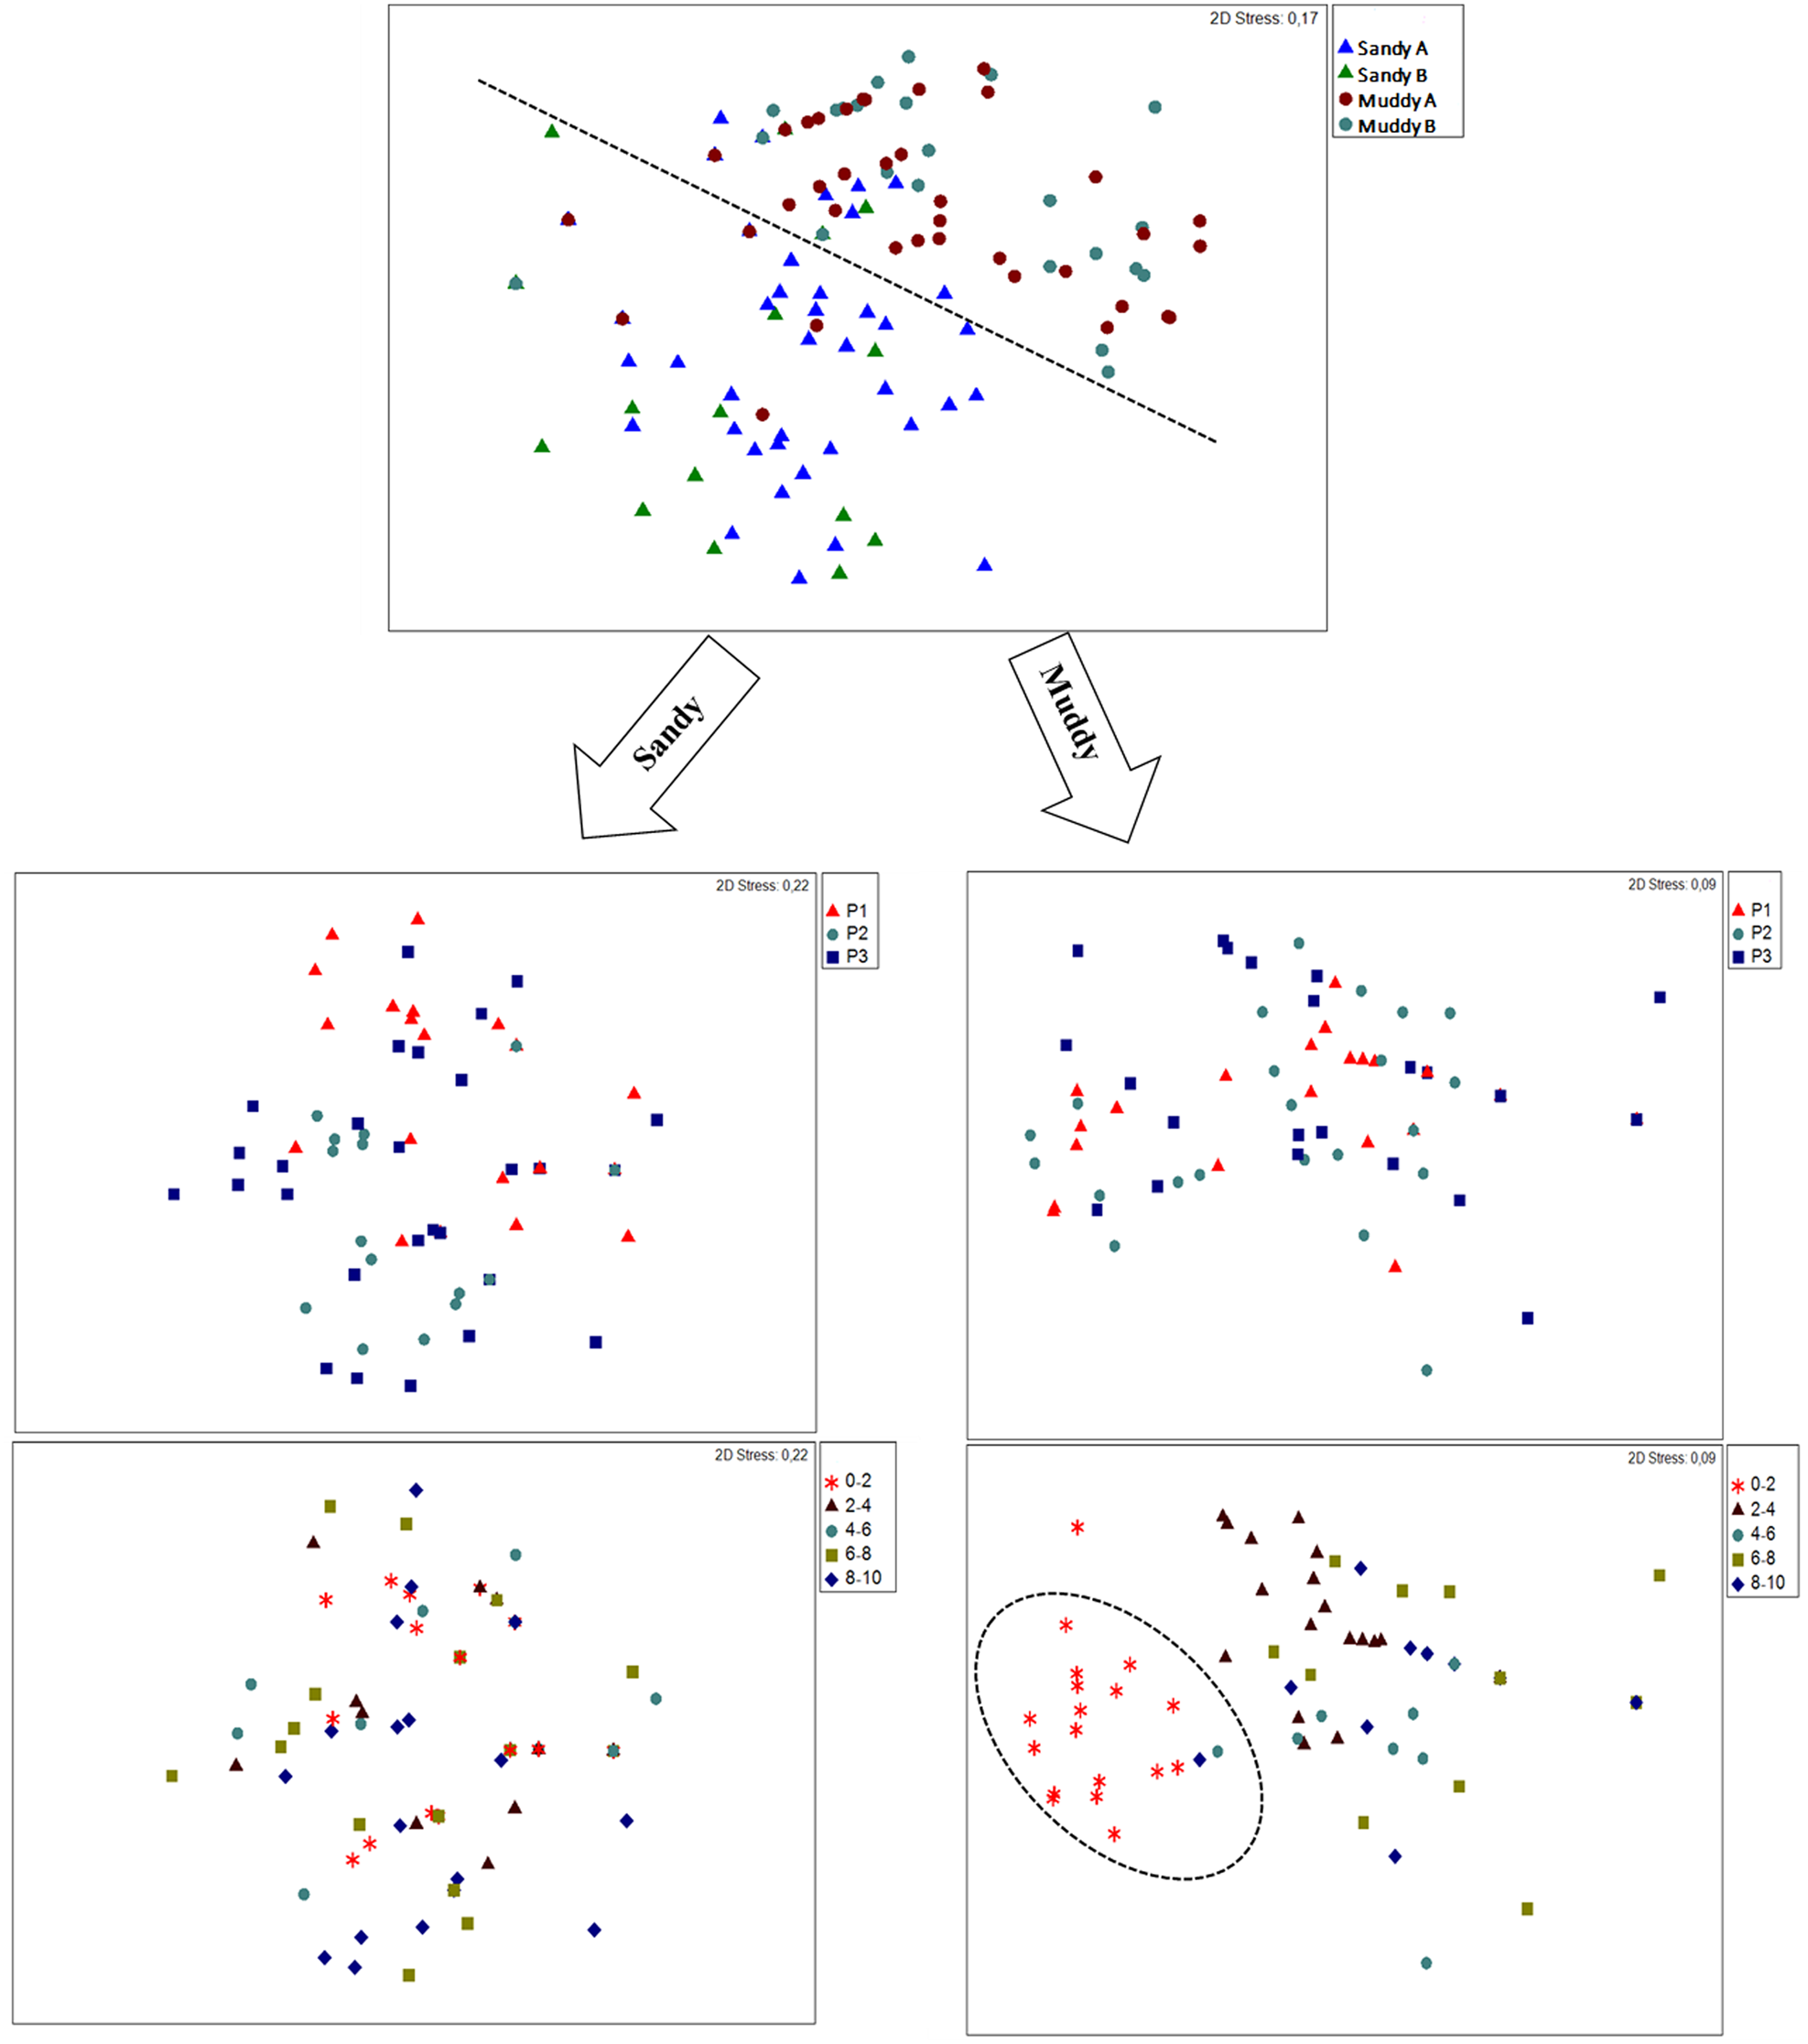
Figure 7. nMDS based on a Bray–Curtis similarity matrix, comparing meiofauna community among environments, intertidal zones and sediment layers.
Nematoda assemblages
Nematoda assemblages were comprised of 36 genera, belonging to two classes, nine orders and 22 families, of which Xyalidae had the highest richness, with six genera. Ten genera were exclusive to sandy environments and 19 genera were exclusive to muddy environments (Supplementary Table S4). The genera Oncholaimellus, Theristus, Daptonema and Prismatolaimus were present in the four sites. Four genera corresponded to 69% of total nematode density: Zygonemella (35%, Xyalidae family), Theristus (15%, Xyalidae family), Halalaimus (10%, Oxystominidae family) and Anonchus (9%, Aphanolaimidae family). Oncholaimellus was the most abundant genus in both sandy environments (24% in sandy A and 20% in sandy B) and Zygonemella was the most abundant in both muddy environments (41% in muddy A and 28% in muddy B).
Mean total nematode density varied from 0.62 in sandy B to 156.32 in muddy A (Supplementary Table S2 and Figure 3). There was a significant difference in nematode density among environments, and the highest value was observed in muddy environments (Table 2). In the intertidal zone of each environment, mean densities in sandy A and in muddy B were higher in P3 (2.73 and 18.49 ind. 10 cm–2, respectively), decreasing in P2 and increasing again in P1. In sandy B and muddy A, P1 was the zone with the highest mean density (0.94 and 26.61 ind. 10 cm–2, respectively), which decreased in P2 and increased again in P3. However, such differences were not significant in any of the environments. In sandy environments, Nematoda density did not have a quite well-established distribution pattern along the sediment layers. The maximum density in sandy A occurred in 2–4 cm in P3 and the maximum density in sandy B occurred in 8–10 cm in P1 (5.18 and 3.30 ind. 10 cm–2, respectively) (Figure 8). On the other hand, density in muddy A and B was higher in the 0–2 cm layer in P2 (840.29 ind. 10 cm–2) and in P3 (389.24 ind. 10 cm–2), respectively, gradually decreasing with increased sediment depth (Figure 8). Mean Nematoda density in some layers was equal to 0 ind. 10 cm–2 (2–4 cm in P2 of sandy A; 2–4, 4–6 and 6–8 cm in P1; 0–2, 4–6 and 8–10 cm in P2; 4–6 and 8–10 cm in P3 of sandy B; 8–10 cm in P1 and P3 of muddy B). Differences in Nematoda density between the layers of each zone were significant only in muddy environments; they were higher in the 0–2 cm layer of all zones in both muddy environments (except for P3 of muddy B, where the 0–2 and 2–4 cm layers did not differ).
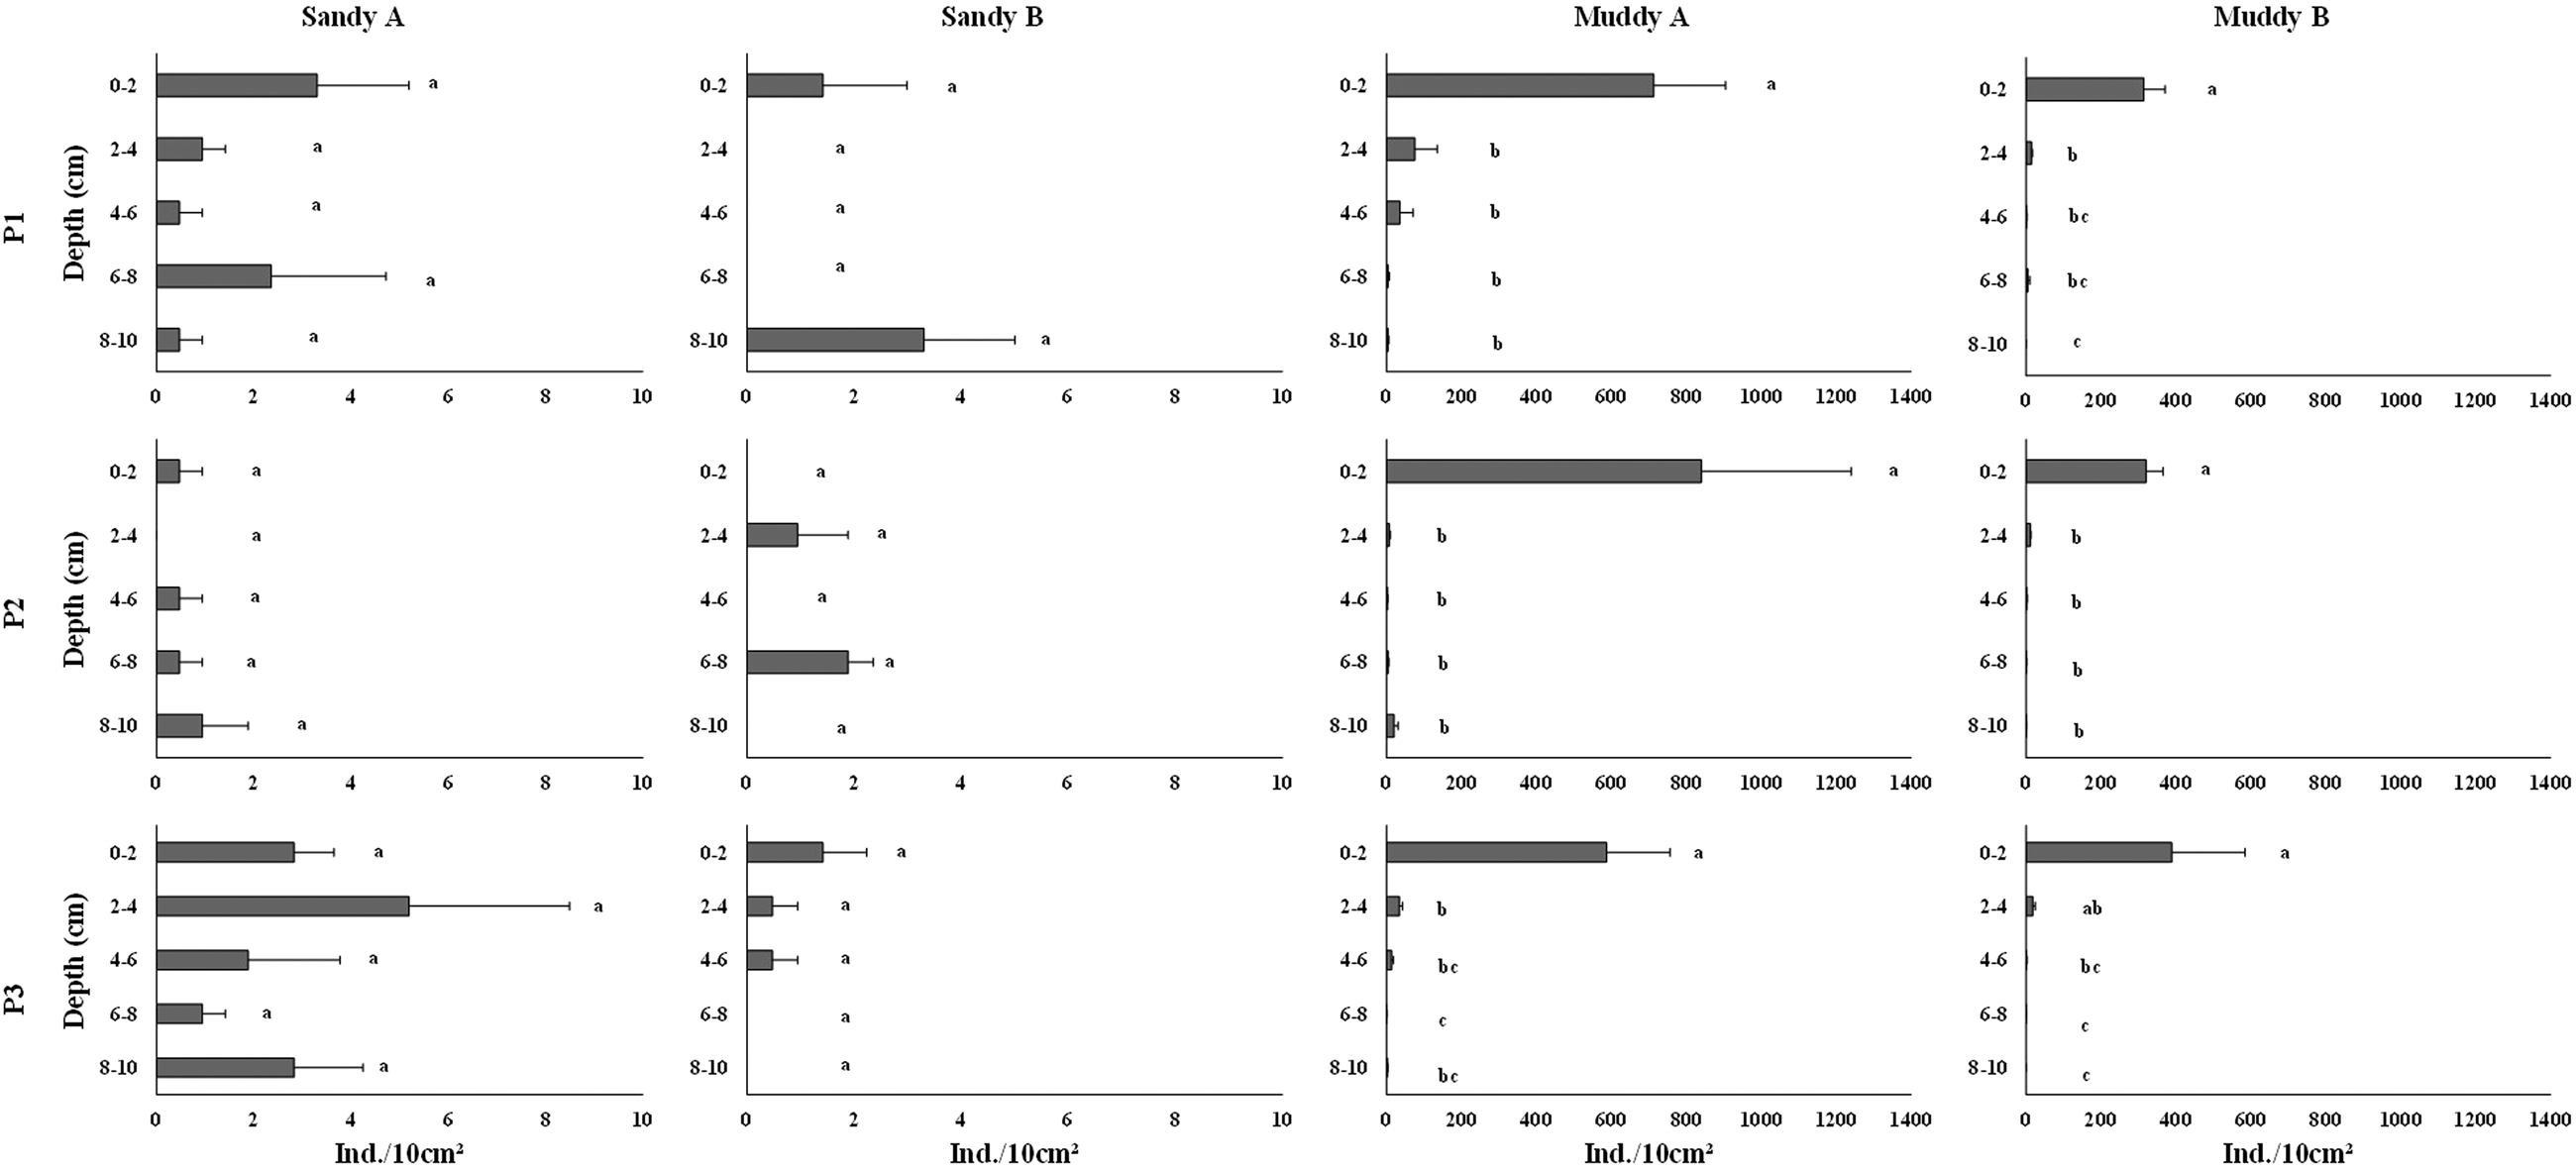
Figure 8. Mean density (ind. 10 cm–2 ± standard error) of Nematoda along the layers of each zone in the sandy and muddy environments studied. Different letters indicate significant differences (P < 0.05) between layers.
The highest mean genus richness occurred in muddy A (4.04 genera) and the lowest occurred in sandy B (0.28 genera) (Supplementary Table S2 and Figure 9). ANOVA showed that differences in mean Nematoda richness among environments were significant; muddy A was the richest environment, followed by muddy B. Sandy A and B had low richness of Nematoda genera. In sandy A, as well as muddy A and B, the highest richness was observed in P3 (1.2, 4.53 and 4 genera, respectively), decreasing towards P2 and increasing in P1. A different pattern was observed among the zones of sandy B, as the maximum mean richness was observed in P1 (0.4 genera), decreasing in P2 and increasing again in P3. Differences between zones, however, were not significant. In the muddy environments, mean genus richness did not have a well-established vertical pattern; its maximum value was observed in the 2–4 cm layer in P3 of sandy A and in the 8–10 cm layer in P1 of sandy B (2.33 and 1.33 genera, respectively) (Figure 9). On the other hand, muddy A and B had the highest mean richness in the upper layer, 0–2 cm, in P3 (10 and 10.66 genera, respectively), which generally decreased gradually with increased sediment depth (Figure 9). Only the muddy environments had a significant difference among layers, and richness was significantly higher in the 0–2 cm layer than in the others, with few exceptions. ANOVA results showed that environment × layer was the only interaction with a significant difference both in density and in richness (Table 2).

Figure 9. Mean Nematoda richness along the layers of each zone in the sandy and muddy environments. Different letters indicate significant differences (P < 0.05) between layers.
No genus was dominant along the layers of the zones in the different environments, except for muddy A, where Zygonemella dominated most layers in all zones (Figure 10). Nematoda assemblages were predominantly comprised of detritivorous genera (75%); Zygonemella was the most dominant one, followed by scrapers (22%), chewers (2.5%) and suckers (0.5%). In sandy environments, detritivores, scrapers, predators and suckers had a similar relative participation, and there was no predominant trophic group in most layers. On the other hand, detritivores were the dominant trophic group in most layers of muddy environments. Only in muddy B did scrapers also have a significant relative participation in some layers (Figure 11). Regarding Nematoda trophic groups, PERMANOVA showed significant differences among environments and layers (Table 4).

Figure 10. Relative participation of the most abundant Nematoda genera along the strata of each zone in the studied environments in Cotijuba Island.
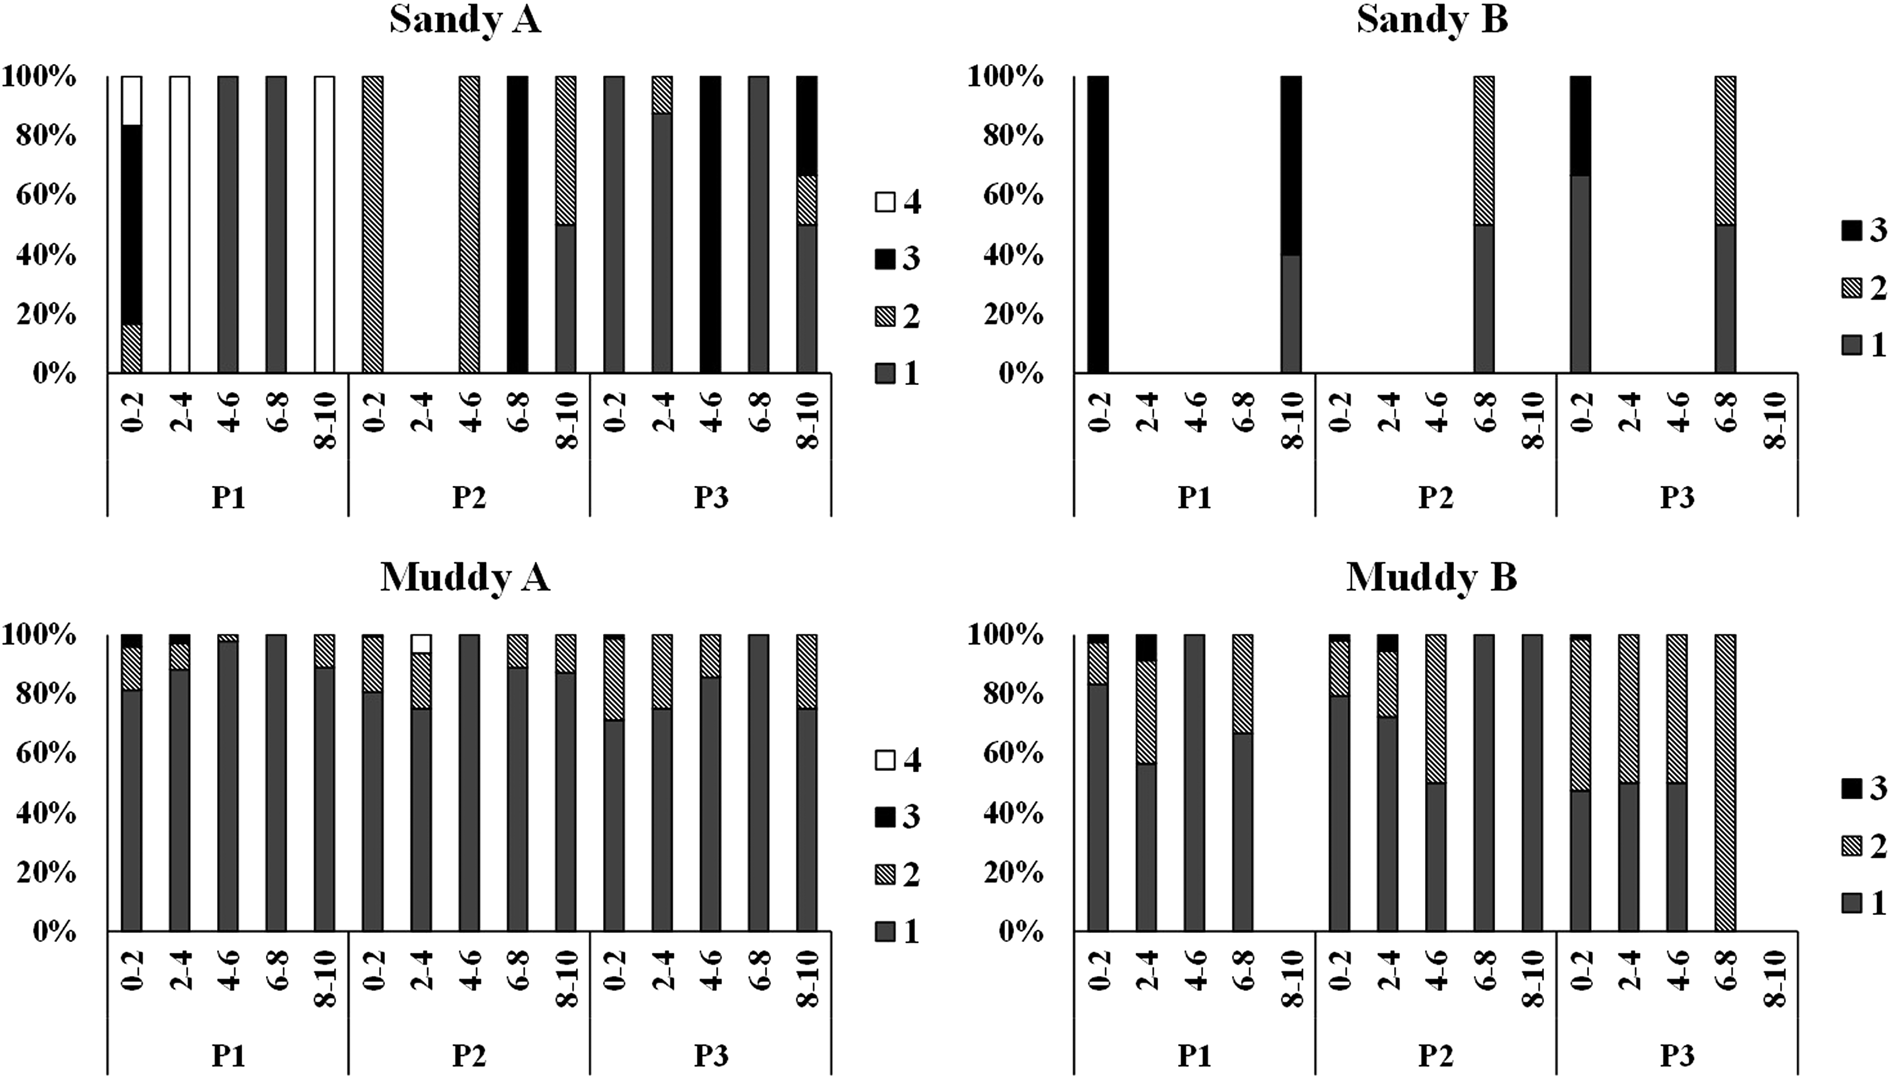
Figure 11. Vertical distribution of trophic types of Nematoda (Traunspurger, Reference Traunspurger1997) in the intertidal zones of the sandy and muddy environments studied (1 – deposit feeders, 2 – scrapers, 3 – chewers and 4 – suckers).
Table 4. PERMANOVA results of Nematoda trophic groups in sandy and muddy environments in Cotijuba Island
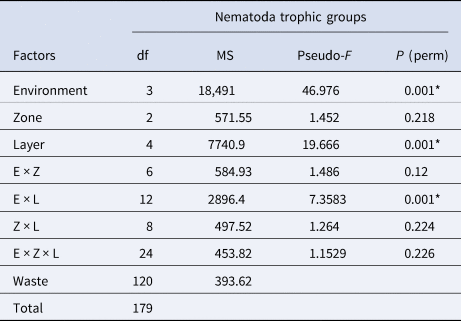
E, environment; Z, zone; L, layer; df, degrees of freedom; MS, mean squares.
* Represents significant difference (P < 0.05).
Nematoda assemblage structure varied among environments, zones and layers, as well as in the interaction between them (Supplementary Table S3 and Table 3). The samples from muddy A were clustered separately from the samples from muddy B and both were separated from the samples from sandy environments, which in turn did not have separate clusters (Figure 12). There was no clear clustering of samples from zones or layers of sandy environments. In muddy environments, similarly, there was no clear clustering of samples from the intertidal zones. On the other hand, samples of 0–2 and 2–4 cm layers had a clear clustering, while the other layers had no clear distinction (Figure 12).

Figure 12. nMDS based on a Bray–Curtis similarity matrix, comparing Nematoda assemblages among environments, intertidal zones and sediment layers.
The highest dissimilarity within Nematoda assemblages was between sandy B and muddy B (99.44%), similar to meiofauna community. Monhystrella (16.91%), Zygonemella (15.66%) and Theristus (8.26%) were the genera that most contributed with dissimilarity among environments. Among zones, the highest dissimilarity in Nematoda assemblages occurred between the upper mid-littoral (P1) and lower mid-littoral (P3) (94.5%), and Zygonemella (19.69%), Theristus (11.68%) and Halalaimus (7.61%) were the genera that most contributed with this result. Regarding vertical distribution, the highest dissimilarity was between the 0–2 and the 6–8 cm layers (96.71%). Zygonemella (17.34%), Theristus (10.29%) and Oncholaimellus (9.19%) were the genera that most contributed with this difference. The best DistLM explained 27.27% of variation in Nematoda assemblage structure (AIC = 1264, r 2 = 0.32). Among the investigated environmental variables, the DistLM indicated that temperature, gravel, sand, silt and clay percentage were the most influential factors of variation in Nematoda assemblages.
Discussion
Environmental factors
Sediment on the studied beaches was moderately sorted, with predominance of coarse or medium sand, while tidal flats were characterized by poorly sorted or very poorly sorted sediment, with predominance of clay, fine sand or very fine sand (the latter two only in muddy B). It is possible to relate these sediment parameters to the hydrodynamics which these environments are subjected to, because sediment in estuaries usually varies from sandy, in areas subjected to high energy, to muddy, in areas with low energy (Schubel and Carter, Reference Schubel, Carter and Kennedy1984; Wei et al., Reference Wei, Chen, Duan, Gu, Saito, Zhang, Wang and Kanai2007). Furthermore, Pejrup (Reference Pejrup, de Boer, Van Gelder and Nio1988) showed that hydrodynamics in estuaries is responsible for sand deposition in more exposed regions, and for silt deposition in more sheltered regions.
The granulometric results of beaches and tidal flats in the present study were similar to the results by Sutherland et al. (Reference Sutherland, Garcia-Hoyos, Poon, Krassovski, Foreman, Martin and Amos2018), who studied several regions in one estuary. These authors observed that high flux speed was responsible for the deposition and maintenance of a bottom comprised of well-sorted and sand-dominated sediment, while a slower flux was responsible for the deposition of very poorly sorted sediment, comprised predominantly of clay and silt. This occurs because sediments characterized by well-sorted sand result from the exposure to high-speed conditions, in which fine sediments are transported to calmer environments (Sutherland et al., Reference Sutherland, Garcia-Hoyos, Poon, Krassovski, Foreman, Martin and Amos2018). In the case of Cotijuba Island, the eastern and western sides of the island have opposite hydrodynamics, since the west coast is more exposed, washed by the Marajó Bay, and the eastern coast is more sheltered, washed by a narrow channel located between Cotijuba and two other islands situated in front of the eastern margin (Paquetá and Jutuba islands). These conformations lead to the formation of different physiographies in both sides of the island; the western coast is comprised of sandy beaches subjected to high-energy hydrodynamics and the eastern margin region is comprised of muddy flats subjected to low-energy hydrodynamics.
Although the studied beaches initially seemed to be different from each other due to the presence of rocky outcrops in sandy A, they had quite similar granulometry (grain composition and sorting degree). On the other hand, tidal flats had a higher differentiation in grain composition; muddy A is a de facto muddy flat, while muddy B is a sandy–muddy tidal flat.
Meiofauna
While Nematoda was the dominant group in muddy environments, Copepoda was the most abundant group on both beaches. This pattern was expected, since several studies have shown the dominance of Nematoda in estuaries or beaches characterized by fine sediments (Ansari and Parulekar, Reference Ansari and Parulekar1993; Gomes and Rosa Filho, Reference Gomes and Rosa Filho2009; Baia and Venekey, Reference Baia and Venekey2019), while Copepoda (in their adult or larval form) are more common organisms in environments characterized by coarse sediments, such as reflective beaches with high-energy hydrodynamics (McLachlan, Reference McLachlan1977; Martins et al., Reference Martins, Almeida and Domenico2015). This pattern occurs due to the high concentration of oxygen in sediments with coarser grains, and this is an ideal condition for Copepoda as they are highly sensitive to interstitial depletion of oxygen (McLachlan and Brown, Reference McLachlan and Brown2006; Armenteros et al., Reference Armenteros, Williams, Creagh and Capetillo2008). Additionally, Du et al. (Reference Du, Gao, Liu, Wang, Zhang and Ingels2018) suggested that sediments that undergo erosion more easily, such as sandy environments, favour the high abundance of Copepoda, because they allow these crustaceans to move through the sediment–water interface. On the other hand, Nematoda is more associated to muddy substrates as they positively respond to finer sediments, which are organically enriched (Leduc and Probert, Reference Leduc and Probert2011). Furthermore, Noguera and Hendrickx (Reference Noguera and Hendrickx1997) observed decreased Copepoda density in environments influenced by mangroves, while Nematoda density increased in these environments, as observed in the present study.
Even in the environment with the highest density, meiofauna was less abundant in the present study compared to the standard value observed in other tropical estuaries (Ansari and Parulekar, Reference Ansari and Parulekar1993; Dupuy et al., Reference Dupuy, Hien, Mizrahi, Jourde, Bréret, Agogué, Beaugeard and Bocher2015; Baia and Venekey, Reference Baia and Venekey2019). These studies, however, were conducted in estuaries with a wide salinity variation, and therefore, differ from the patterns found in the present study, as the estuary here is characterized by the predominance of freshwater, especially in the period of the year when sampling was conducted. Meiofauna density is known to be lower in freshwater compared to a marine environment; this descriptor tends to decrease from seawater towards freshwater (Coull, Reference Coull, Higgins and Thiel1988). However, even in comparison with meiofauna studies in lotic environments (Palmer, Reference Palmer1990; Beier and Traunspurger, Reference Beier and Traunspurger2003; Radwell and Brown, Reference Radwell and Brown2008), the density values observed in the present study are considered low, which might be related to the fact that the environments studied in Cotijuba Island are quite different from other lotic environments due to the influence of tides. Similar to the present study, a low density of meiofauna organisms was also observed in a study conducted on Vai-Quem-Quer Beach, another lotic environment under the influence of tides located in Cotijuba Island (Baia et al., Reference Baia, Rollnic and Venekey2021). The influence of tides causes periodical changes in several factors (temperature, wave action, currents, organic matter inflow, interstitial water percolation, light intensity, sediment compaction, etc.) and renders the environment unstable for benthic organisms (Steyaert et al., Reference Steyaert, Herman, Moens, Widdows and Vincx2001), likely contributing to the low densities found.
Considering the different environments studied, as expected, meiofauna density was significantly higher in muddy environments than in sandy environments. The positive correlation between the amount of organic matter and silt is well established (Dankers and Beukema, Reference Dankers and Beukema1983), and studies on tropical estuaries show that these environments are richer in organic matter than sandy flats or beaches (Schrijvers et al., Reference Schrijvers, Van Gansbeke and Vincx1995; Dittmann, Reference Dittmann2000). Therefore, the meiofauna densities found in the muddy sediments here are believed to be related to the higher food availability in these environments. Noguera and Hendrickx (Reference Noguera and Hendrickx1997) reported high meiofauna densities in stations that were rich in nitrogen and carbon, characterized by muddy sediments and low-speed tidal currents; on the other hand, lower densities were found at stations characterized by sandy substrate and low amount of carbon and nitrogen. According to that knowledge, the muddy environments studied in Cotijuba Island might be considered low-energy environments, subjected to low-speed tides, as they are located in a sheltered margin, protected from the higher hydrodynamics by the two islands located ahead (Paquetá and Jutuba).
Overall, meiofauna density and richness did not significantly differ among zones in the environments studied (only richness between zones of sandy B). The lack of a clear environmental separation related to the intertidal zone might be due to the extension of the mid-littoral, which is relatively small in all the environments (measuring between 18 and 35 m according to personal observation in loco). Similarly, there was no significant difference in meiofauna density among the layers on both beaches studied. Martins et al. (Reference Martins, Almeida and Domenico2015), who studied reflective beaches with quite similar sedimentological characteristics to those of Cotijuba beaches (predominance of coarse or medium sand, moderately sorted), observed that the highest densities occurred at intermediate depths of 10–30 cm, while densities were lower in the first 10 cm from the surface. These results explain the low densities and the absence of a vertical distribution pattern for meiofauna on the beaches studied in Cotijuba, since samplings were conducted only in the first centimetres of sediment. This suggests that individuals might have migrated to deeper layers in order to avoid the resuspension that occurs in the upper layers by the energy of waves (Martins et al., Reference Martins, Almeida and Domenico2015).
On the other hand, the highest densities in muddy environments occurred in the upper layers. The same pattern was observed in several meiofauna studies conducted in tidal flats with muddy sediments, whether they were in marine, estuarine (Armenteros et al., Reference Armenteros, Williams, Creagh and Capetillo2008) or freshwater environments (Reinicke, Reference Reinicke2000). In freshwater tidal flats, environmental conditions are similar to those of marine muddy flats, at least in terms of grain size composition, temperature and oxygen availability (Reinicke, Reference Reinicke2000). These studies associate this trend towards decreasing meiofauna density from the upper layers to the lower layers to the higher vertical gradient in physical and chemical sediment properties. In fine sediments, oxygen penetration is limited to the few first centimetres of sediment (0–2 cm) and the concentration of hydrogen sulphide (H2S), a gas that causes damaging effects on the fauna, also increases with increased depth (Armenteros et al., Reference Armenteros, Williams, Creagh and Capetillo2008). The presence of this gas becomes evident by the darkening of the sediment, a fact that was observed in loco in the sediment samples of deeper layers (4–6 to 8–10 cm) of the tidal flats studied. Another possible reason that explains the vertical distribution pattern of meiofauna is that the availability of food (amount of organic matter, algae and bacteria) is higher in the surface sediment layers and tends to decrease with depth (Reise and Ax, Reference Reise and Ax1979).
Meiofauna richness was significantly higher in sandy A and muddy A, and lower in sandy B and muddy B. Since a higher richness was expected in sandy environments, as well as lower richness in muddy environments, these results indicate that diversity in these environments is controlled and potentially affected positively by specific local conditions. In sandy A, there are some rocky outcrops present in a distance of few metres from the sampling points. As for muddy A, all intertidal zones have grasslands scattered in small groups (Figure 1). Richness in both muddy flats was expected to be higher in the upper layers; however, this pattern was only observed in muddy B. In other words, in muddy A, a wide array of biotic and abiotic factors (thiobiotic capacity, predation, presence of mucus or biofilm and sediment permeability), whether they were occasional or not, might have contributed with the occurrence of several meiofauna groups also in the lower layers (Giere, Reference Giere2009). Regarding the relative participation of meiofauna groups along the layers, Nematoda dominated all layers in all zones of both muddy environments, thus confirming the high ability of these organisms to tolerate reduced oxygenation conditions within the sediment, as they might even complete their entire life cycle in the presence of hydrogen sulphide (Heip et al., Reference Heip, Vincx and Vranken1985; Armenteros et al., Reference Armenteros, Williams, Creagh and Capetillo2008).
Meiofauna community structure differed among environments, zones and layers, and these differences are mostly due to the patterns observed in muddy environments. These differences seem to be intrinsic to each environment, as the interaction environment × zone × layer was not significant. Differences intrinsic to each environment can be explained by change in composition and grain size of each sediment (between muddy environments), as well as by the peculiarities of each local, such as the presence of rocky outcrops in sandy A or vegetation grasslands in the intertidal zone of muddy A. Meiofauna communities tend to be aggregated spatially in the sediments either horizontally or vertically leading to patchiness but their distribution can be influenced by the variety of local microhabitats (Giere, Reference Giere2009). Biogenic structures as seagrass or hard substrates as rocky shores can have increasing effects on abundance and richness of meiofauna (Fonseca et al., Reference Fonseca, Hutchings and Gallucci2011; Gallucci et al., Reference Gallucci, Christofoletti, Fonseca and Dias2020).
Nematoda
Studies about freshwater Nematoda in Brazil are scarce, and with few exceptions, they are only taxonomic studies with genera and species descriptions. This fact makes it difficult to compare the richness of our list of genera. Pinto et al. (Reference Pinto, Netto, Esteves, de Castro, Neres and Silva2021) provided a checklist of 144 free-living freshwater genera of Brazil based in literature and several new localities sampled by them. In their study, they compared the similarity of Brazilian regions but they did not sample in the Amazon region, only included ten genera in the list based on literature (Altherr, Reference Altherr1972, Reference Altherr1977; Riemann, Reference Riemann1972; Andrássy, Reference Andrássy1985). Also they did not consider two other studies (Gerlach, Reference Gerlach1957, Reference Gerlach1966) that contain some genera of the Amazon region and neither included the recent study of Baia et al. (Reference Baia, Rollnic and Venekey2021). The latter was the first and only study about ecology of freshwater nematodes in Amazon region until ours. Considering all these studies and the revisions by Venekey et al. (Reference Venekey, Fonseca-Genevois and Santos2010) and Venekey (Reference Venekey2017) for marine habitats, two of the genera found in the present study are new occurrences in Brazil for aquatic environments: Adenolaimus and Diplogasteritus. These genera are considered inhabitants of either freshwater or terrestrial environments (Nemys eds, 2021). In the present study, they were exclusive to muddy sediments.
Pinto et al. (Reference Pinto, Netto, Esteves, de Castro, Neres and Silva2021) results pointed out the south region of Brazil (Santa Catarina state, 27–28°S/48–49°W) as the richest region for freshwater nematodes, with 58 genera recorded from 11 different sampling localities. In the present study, we found 36 genera, a similar richness comparing with the record of Baia et al. (39 genera), the only ecological study in the Amazon region, but our list differed in 65% from their work. Considering all previous studies in Amazon region (Gerlach, Reference Gerlach1957, Reference Gerlach1966; Altherr, Reference Altherr1972, Reference Altherr1977; Riemann, Reference Riemann1972; Andrássy, Reference Andrássy1985; Baia et al., Reference Baia, Rollnic and Venekey2021), this region has now a record of 78 genera and our study added several new records for freshwater habitats in Brazil (Adenolaimus, Antomicron, Amphimonhystrella, Diplogasteritus, Halalaimus, Listia, Neochromadora, Portmacquaria and Sinanema).
The genus Oncholaimellus, a predator from the family Oncholaimidae, was the most abundant in both sandy environments. In fact, sandy beaches with coarse sediment grains tend to have high densities of predatory Nematoda (Moens et al., Reference Moens, Braeckman, Derycke, Fonseca, Gallucci, Gingold, Guilini, Ingels, Leduc, Vanaverbeke, Van Colen, Vanreusel, Vincx and Schmidt-Rhaesa2014). On the other hand, Xyalidae, family of the most abundant genus in muddy environments (Zygonemella), is frequently associated with estuarine environments with clayish or silty sediment, where this group occurs in high densities (Meurer and Netto, Reference Meurer and Netto2007; Netto and Pereira, Reference Netto and Pereira2009; Costa and Netto, Reference Costa and Netto2014). Despite this clear preference, both Oncholaimellus and Theristus, as well as Daptonema (also belonging to Xyalidae), were the genera shared by all environments. Genera from Xyalidae are found in nearly all types of environments, primarily occurring in marine environments (Venekey et al., Reference Venekey, Gheller, Maria, Brustolin, Kandratavicius, Vieira, Brito, Souza and Fonseca2014). However, some Theristus and Daptonema species do occur in freshwater environments (Coomans and Eyualem-Abebe, Reference Coomans, Eyualem-Abebe, Eyualem-Abebe, Andrássy and Traunspurger2006).
Several studies indicate that Nematoda species diversity is lower in fine sediments with high amount of clay and organic matter, while a high diversity is expected in coarse sediments (Moens et al., Reference Moens, Braeckman, Derycke, Fonseca, Gallucci, Gingold, Guilini, Ingels, Leduc, Vanaverbeke, Van Colen, Vanreusel, Vincx and Schmidt-Rhaesa2014; Du et al., Reference Du, Gao, Liu, Wang, Zhang and Ingels2018; Maria et al., Reference Maria, Silva Filho, Souza, Vanaverbeke, Vanreusel and Esteves2018; Baia and Venekey, Reference Baia and Venekey2019; Venekey et al., Reference Venekey, Melo and Rosa Filho2019). The results of the present study were different, as the environments muddy A and B differed significantly from both beaches in having higher densities and richness of genera. However, Nematoda studies in freshwater show that species composition is more variable under conditions of high nutrient enrichment than under conditions of low nutrient concentration (Ristau et al., Reference Ristau, Faupel and Traunspurger2013). This explains the significantly low richness and density of Nematoda genera on the beaches, which were probably poorer in nutrients, and the high genus richness and density in the muddy environments, especially in muddy A.
There was no significant difference in Nematoda density and richness between zones in any environment. Vieira and Fonseca (Reference Vieira and Fonseca2013), studying the vertical and horizontal Nematoda distribution in estuaries, found that the deeper sediments with reduced space are inhabited by a group of more restricted species regarding their mobility, while the superficial fauna has a greater chance of being resuspended and redistributed, leading to a broader distribution of these species, and therefore, generating a lower variability in the horizontal distribution. Nematoda distribution in the beach zones and tidal flats studied here probably follows this pattern, considering that the four environments have a narrow mid-littoral with a maximum extension of 35 m (personal observation in loco).
Nematoda density and richness among layers in each zone had a significant difference only in muddy environments, and it was significantly higher in the upper layer 0–2 cm of all zones in both environments. This vertical distribution pattern, which shows high densities in the first centimetres of sediment, decreasing sharply with depth, is quite well established in silty sediments (Heip et al., Reference Heip, Vincx and Vranken1985). Once again, oxygen availability and the occurrence of sulphide are the factors most frequently associated with this pattern (Heip et al., Reference Heip, Vincx and Vranken1985; Steyaert et al., Reference Steyaert, Vanaverbeke, Vanreusel, Barranguet, Lucas and Vincx2003).
All trophic types of Nematoda are expected to be positively affected by nutrient enrichment (Ristau et al., Reference Ristau, Faupel and Traunspurger2013). Nevertheless, abiotic factors on beaches, such as physical disturbances, tend to provide a higher contribution to Nematoda assemblage structuring than the availability of resources (food amount and quality) (Moens et al., Reference Moens, Braeckman, Derycke, Fonseca, Gallucci, Gingold, Guilini, Ingels, Leduc, Vanaverbeke, Van Colen, Vanreusel, Vincx and Schmidt-Rhaesa2014). It is believed that due to this fact, the distribution of trophic types in sandy environments was more balanced, and no group dominated throughout the layers. On the other hand, deposit feeders were more abundant along all layers in muddy A and B, especially the latter. In tidal flats, high concentrations of silt, organic matter and phytopigments tend to favour the occurrence of genera from this trophic group (Wu et al., Reference Wu, Vanreusel, Hauquier and Moens2019). Environments characterized by intermediate amounts of nutrients favoured the occurrence of omnivore and predatory genera; that is why the participation of detritivorous genera was less evident in muddy B than in muddy A. In the latter, the higher organic enrichment, which might be inferred due to the higher percentage of clay and silt, favoured organisms of lower trophic levels, such as deposit feeders. Predatory and sucker genera do not seem to have been affected by the variation in amount of nutrients (Ristau et al., Reference Ristau, Faupel and Traunspurger2013), and thus, both trophic types were present both in sandy A, an environment which is poorer in nutrients, and in muddy A, an environment rich in nutrients.
Nematoda assemblages differed between muddy A and B, and both differed from the beaches. In sandy environments, there was no difference in Nematoda assemblages. This result might be explained by the type of interstitial habitat these environments offer to the fauna, as sediment is quite similar between beaches in terms of sorting degree and grain composition. Regarding the muddy environments, on the other hand, while muddy B had higher heterogeneity of grain types and sizes, muddy A was more uniform. These differences are mostly due to high densities and richness in muddy environments; additionally, layers 0–2 and 2–4 cm are separated in these environments. Clustering between zones, on the other hand, was not explicit in sandy and muddy environments, likely because the action of waves and exposure to tides is similar throughout the intertidal zone due to its extension, leading to a small differentiation between zones (Wu et al., Reference Wu, Vanreusel, Hauquier and Moens2019).
Conclusions
The effect of sediment on meiofauna community and Nematoda assemblage structure occurred mostly due to the relationship of this factor with oxygenation and food availability. The first hypothesis of the present study was accepted, as the muddy flats sheltered the highest meiofauna densities due to the high organic matter enrichment in these environments. As oxygen and food availability are limited particularly in the first centimetres of the sediment column in muddy environments, meiofauna was limited particularly to the first centimetres of depth. This result partially confirms the hypothesis of differentiation in vertical meiofauna distribution, as no clear distribution pattern was observed for these organisms between the layers in the sediment column on the beaches. Finally, the hypothesis of meiofauna community differentiation among zones was rejected, as the short extension of the mid-littoral and the low variation in environmental factors did not favour the high variability of groups between different points in the intertidal zone. As this is a pioneer study on meiofauna of Amazon freshwater environments subjected to the influence of tides, further studies are required to understand, for instance, what effect do variations in tide have on the meiofauna that dwells in the substrate of environments such as these in Cotijuba Island.
Supplementary Material
The supplementary material for this article can be found at https://doi.org/10.1017/S0025315423000656.
Data
Data will be made available on reasonable request.
Acknowledgements
The authors wish to thank T. B. L. Santos, T. M. T. Santos and D. C. M. Silva for their help in the fieldwork.
Author contributions
T. B. L. d. S: conceptualization, methodology, formal analysis, investigation, data curation, writing – original draft. E. B.: formal analysis, data curation, writing – review and editing. V. V.: conceptualization, methodology, resources, writing – review and editing, supervision, funding acquisition.
Financial support
The first and second authors are grateful to CNPq (Conselho Nacional de Pesquisa) for granting post-graduation research scholarships.
Competing interest
None.
Ethical standards
Collection and preservation of organisms were conducted according to all applicable institutional, local and international regulations.


