


How do economic inequalities affect the transition toward democracy and its consolidation? This question is of prime importance but it still lacks empirical investigations. Theoretically, it has been argued that the threat of revolution induced by high inequalities increases the probability of franchise extensions and democratization (Acemoglu and Robinson Reference Acemoglu and Robinson2000; Conley and Temimi Reference Conley and Temimi2001; Aidt and Franck Reference Aidt and Franck2015, Reference Aidt and Franck2019; Dasgupta and Ziblatt Reference Dasgupta and Ziblatt2015). However, larger inequalities are also likely to play against the consolidation of democracy. Following the ideas developed in the Meltzer-Richard model (Meltzer and Richard Reference Meltzer and Richard1981), the redistribution imposed after a democratic transition has been described as an increasing function of inequality, which can give the elite an incentive to mount a coup (Acemoglu and Robinson Reference Acemoglu and Robinson2001). Highly unequal societies may therefore be characterized by a higher level of political instability and oscillate between authoritarian and democratic regimes.
Empirical investigations on the relationship between inequality and democratization have distinguished between the effects of income and landholding or “rural” inequality. Higher-income inequalities, associated with the rise of a middle class, have generally been considered as influencing positively the transition towards a democratic regime (Ansell and Samuels Reference Ansell and Samuels2010), but paradoxically jeopardizing the consolidation of democracy as more inequalities lead to stronger distributional conflicts (Przeworski et al. Reference Przeworski, Alvarez, Cheibub and Limongi2000; Houle Reference Houle2009; Krieckhaus et al. Reference Krieckhaus, Son, Mukherjee Bellinger and Wells2013).Footnote 1 On the contrary, landholding inequalities appear to be detrimental to both the democratization and consolidation of democracy. It has been documented that countries with a higher proportion of family farms over the rural population tended to democratize more (Boix and Stokes Reference Boix and Stokes2003; Ansell and Samuels Reference Ansell and Samuels2010). For example, the move toward the extension of the franchise in early twentieth-century Prussia was thwarted by landholding inequalities (Ziblatt Reference Ziblatt2008), while the Junkers impeded the development of democratic institutions and increased the weakness of the Weimar Republic in Germany (Gerschenkron Reference Gerschenkron1989).Footnote 2 Several transmission channels may account for this negative association. Firstly, when assets are highly specific, as is the case with land, the elites cannot easily evade the potential redistribution through heavy taxation imposed by the new democratic regime. Their best interest therefore lies in undermining the democratic transition (Boix and Stokes Reference Boix and Stokes2003). Departing from redistributivist theories,Footnote 3 Ziblatt (Reference Ziblatt2008) insists on the role played by social control and social norms at odds with democratic values in explaining the negative impact of landholding inequalities on democracy. A more equal distribution of land is also associated to a greater number of landowners willing to avoid expropriation by an autocratic elite and therefore asking for a representative political system that protects property rights (Ansell and Samuels Reference Ansell and Samuels2010).
In this paper, I investigate the democratic transition in France during the nineteenth century and exploit the results of two sets of elections to the lower house of Parliament. The first set is constituted by the 1849 general election, the first implemented after the adoption of universal male suffrage in 1848 and the advent of the Second Republic, which lasted between 1848 and 1851.Footnote 4 The second set gathers the first six general elections (1876, 1877, 1881, 1885, 1889, 1893) of the Third Republic (1870–1940). During the 1849 election, the Republicans lost to the Parti de l’Ordre, which was composed of Monarchists. The coalition of republican parties won all the elections of the Third Republic against opponents favorable to the abolition of democracy and a return to a monarchist or authoritarian regime. These elections were generally contested, as the Republicans grabbed around 55 percent of the votes in 1876, 1877, and 1885, and 40 percent in 1849.
I examine the influence of landholding inequalities on the vote shares of republican parties at the level of départements.Footnote 5 I consider two measures of inequality: the share of landless workers among all agricultural workers alongside the share of small or medium, and large landholdings. I rely on exogenous variations in the average terrain ruggedness of departments to instrument the level of rural inequality. By making the exploitation of large landholdings more difficult and by reducing the appropriation of land by local elites, a higher ruggedness favored the concentration of small tenures and increased the share of workers exploiting their own piece of land. Crucial for this study, I also provide indications that the average ruggedness was not significantly linked to several development indicators, such as literacy rate, urban population, industrial production, or total and agricultural income, alongside variables on violent events and rebellions against the gendarmes (police officers) in France. The effect of landholding inequality is therefore not confounded with that of agricultural wealth or a potential shift of the workforce toward the industrial sector.
The results indicate a negative effect of rural inequality on the republican vote share in all general elections considered. For example, a 1 percentage point increase in the proportion of landless agricultural workers is associated with a decrease of between 0.6 and 1 percentage point in the support for Republicans in 1849. The corresponding effect of the elections in the Third Republic oscillates between 0.2 and 1.1 percentage points. I, however, find no clear impact of landholding inequalities on the turnout level in the parliamentary elections. I also provide evidence that large landowners influenced voters through direct political pressure. Indeed, this influence was stronger when landowners lived in contact with the workers they employed. As the secret ballot was only introduced in 1913 in France, large landowners could easily know which party agricultural workers voted for, and therefore influence their choice. Their political influence could therefore consist of modifying votes or reducing electoral participation. The estimations suggest that they rather chose the first option.
This article adds several contributions to the existing literature on the determinants of the consolidation of democracy. A large share of the empirical literature has focused on the positive correlation between economic wealth and democracy (Lipset Reference Lipset1959; Huntington Reference Huntington1991). More recently, the impact of economic growth on democratization at the country level has been investigated with mixed results (Barro Reference Barro1999; Acemoglu et al. Reference Acemoglu, Johnson, Robinson and Yared2008, Reference Acemoglu, Johnson, Robinson and Yared2009), while transitory negative income shocks opened a window of opportunity for democracy (Berger and Spoerer Reference Berger and Spoerer2001; Burke and Leigh Reference Burke and Leigh2010; Brückner and Ciccone Reference Brückner and Ciccone2011). This paper adds to this literature by focusing on the impact of landholding inequalities on democratization, which has been the subject of less empirical investigation.
Compared to the existing studies that already deal with landholding inequalities (Boix and Stokes Reference Boix and Stokes2003; Ziblatt Reference Ziblatt2008; Ansell and Samuels Reference Ansell and Samuels2010), using average land ruggedness as an instrument for rural inequalities should lead to a better estimation of their impact. This is also true when considering studies relying on soil composition instruments, such as Easterly (Reference Easterly2007) or Cinnirella and Hornung (Reference Cinnirella and Hornung2016). Indeed, this composition is very likely to influence directly agricultural productivity and production while ruggedness appears to be unrelated to these factors in nineteenth-century France. This paper also contributes to the literature on the economic and social control of elites on voters and elections. This literature has notably pointed out the clientelist or violent methods implemented by the elites to influence voters’ behavior (Baland and Robison 2008; Anderson, Froncois, and Kotwal 2015), alongside disenfranchisement policies based on poll taxes and literacy tests (Naidu Reference Naidu2012). This paper shows that political pressures associated to an economic dependence negatively affected the consolidation of democracy in France.
Finally, this paper contributes to the history of the French Republic and democracy. The existing literature has pointed out the importance of secularization and economic poverty to explain the republican vote in 1849 and the support for the Second Republic (Bouillon Reference Bouillon1956; Salmon Reference Salmon2001). The same determinants also played a significant role in shaping the support for the Third Republic in France (Goguel Reference Goguel1951), along with the absence of negative income shocks in the departments where the Republicans had the largest support (Franck Reference Franck2016). The consistent ideological platform of Republicans is also essential in explaining the consolidation of the Third Republic (Hanson Reference Hanson2010), while the departments occupied by the Prussians between 1870 and 1873, were characterized by a large increase in republican support (Salmon Reference Salmon2001). For the western part of France, Siegfried (Reference Siegfried1913) also established that the granite composition of the soil contributed to favoring a scattered settlement, the presence of large landholdings, and the implementation of Catholicism, which in turn influenced the support for right-wing parties during the Third Republic. On the contrary, limestone was associated to small landholdings, urbanization, and a higher support for the Republicans. This paper generalizes the analysis of landholding inequality for the entire country over two democratic political transitions, pointing out its importance in explaining the consolidation of democracy in France.
The rest of the article is organized as follows. The second section presents some historical facts about the democratization process in nineteenth-century France. The third section introduces the data used, and the fourth section describes the empirical strategy. The fifth section presents the results of this paper, and the sixth section concludes.
THE HISTORY OF DEMOCRACY IN NINETEENTH-CENTURY FRANCE
From the fall of Napoleon I in 1815 to the establishment of the Third Republic in 1870, which lasted until 1940, several political regimes succeeded in France. The Bourbon Restoration, which lasted from 1815 to 1830, saw the accession to the throne of two brothers of the executed Louis XVI. Louis XVIII reigned between 1815 and 1824, when he was replaced by Charles X, who was eventually overthrown in 1830 during a three-day revolution in July, known as the “Trois Glorieuses” (Three Glorious). This revolution was triggered by the will of Charles X to restore the institutions of the Ancien Régime, while most of the Monarchists wanted to implement more liberal policies. With the fall of Charles X, the senior branch of the Bourbon family was removed from power, as his successor King Louis-Philippe I belonged to the cadet Orléans branch of the family. This gave rise to an opposition between Legitimists and Orléanists, respectively supporters of the senior or cadet branch of the Bourbon family. Alongside the Bonapartists, the supporters of the Bonaparte family, they constitute the three right-wing factions of nineteenth-century France.
Louis-Philippe was overthrown in 1848. The overthrow started with a series of political meetings, the Campagne des banquets (banquet campaign), which took place in several French towns from July 1847 to February 1848. Seventy banquets were organized, and 17,000 people attended. The moderate left-wing opposition, known as the dynastic opposition, used these banquets to claim a reform of the electoral law and a larger enfranchisement. Originally, their aim was to amend the ruling monarchy, but by no means to end it. However, the republican opposition took advantage of this opportunity to express their ideas, organize themselves, and gain popularity. The prohibition of the last banquet, which was supposed to take place on 22 February in Paris, triggered the three-day February revolution, which constrained Louis-Philippe to abdicate.
The Second Republic was then proclaimed on 24 February 1848. It rapidly instituted universal male suffrage and organized general elections in April. The task of the newly elected National Constituent Assembly was to write the Constitution of the Republic. Three main political parties competed: the conservative Parti de l’Ordre composed of Legitimists and Orléanists; the moderate Republicans; and the Montagne or Démocrates-socialistes (Democrats-Socialists), who represented the left-wing fringe of the Republicans. The moderate Republicans gathered around 68 percent of the votes for the general election, the Conservatives 23 percent, and the Démocrates-socialistes 9 percent. In December, the first presidential election in France brought Louis-Napoléon Bonaparte, Napoléon I’s nephew, who was supported by the right-wing Monarchists and who benefited from the divisions among the Republicans, into power. He managed to gather around 74 percent of the votes, while the candidate of the moderate Republicans, Louis Eugène Cavaignac, only grabbed around 20 percent of them. The general elections of May 1849 confirmed this trend, as around 50 percent of the votes went to the Parti de l’Ordre. Four hundred and fifty right-wing representatives were elected, against 180 for the Montagne and 75 for the moderate Republicans. These elections revealed geographical political divisions that globally lasted during more than 100 years in France. As displayed in Figure 1, the Parti de l’Ordre dominated in the Orléanist northern and northeastern parts of France, alongside the Catholic and Legitimist West. The Bonapartist Aquitaine and the Languedoc also constituted right-wing strongholds. The Démocrates-socialistes and the Republicans gathered a high vote share in the central part of the country, from the Alps to the Provence, as well as in the Pyrenees and the central-western departments.Footnote 6
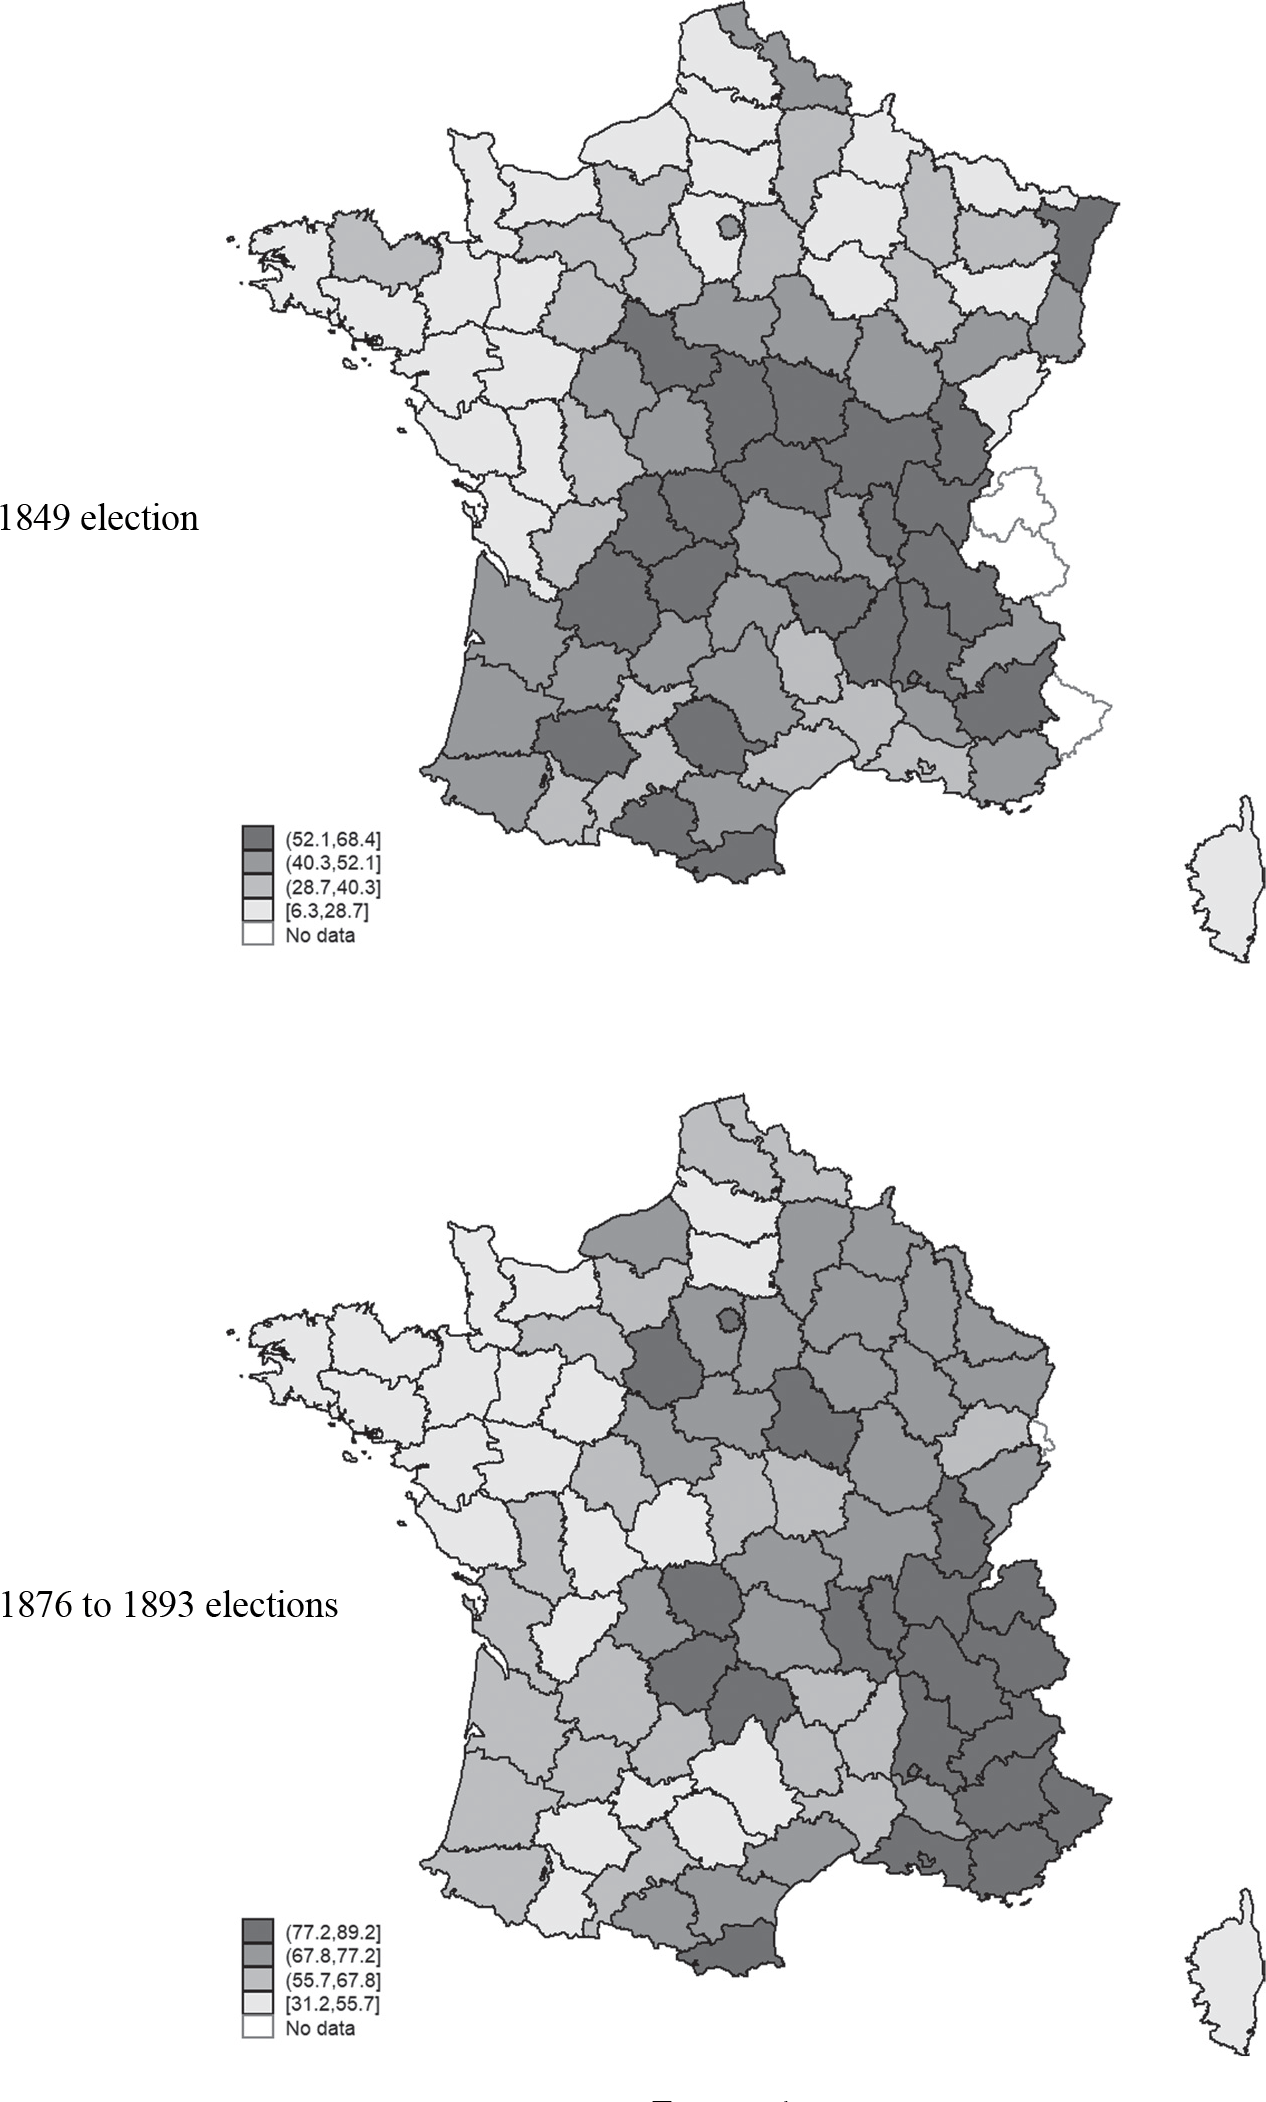
Figure 1 REPUBLICANS VOTE SHARE IN 1849 AND IN THE EARLY THIRD REPUBLIC
Notes: The Republican vote share at the department level is displayed for the 1849 election. Its average value over the 1876, 1877, 1881, 1885, 1889, and 1893 elections is represented on the second map.
Source: See main text.
In the wake of these two consecutive victories, Louis-Napoléon Bonaparte quickly began to stage a coup against the institution of the Second Republic, which eventually took place on 2 December 1851. The Second Empire was officially proclaimed exactly a year later. The rule of Napoléon III came to an end with the defeat of the French army during the Franco-Prussian war, at the battle of Sedan on 1 September 1870. Demonstrations followed the news of the defeat in Paris, which eventually led to the proclamation of the Third Republic in Paris city hall on 4 September 1870. The institutions of the Third Republic took a long time to be established. The provisional French government, with Adolphe Thiers at its head, organized elections under universal male suffrage in February 1871 to elect a National Assembly, whose aim was to define the new institutions of the regime. However, a majority of Monarchists opposing the establishment of a republic were elected. The countryside massively supported the Monarchists, notably because the Republicans led by Léon Gambetta refused to surrender to the Prussian army. An insurrection in Paris, known as La Commune and led by socialists and anarchists opposed to peace with Prussia, followed these elections in March. This insurrection was eventually contained in May 1871 after severe repression. But the Legitimists and Orléanistes disagreed on the type of Monarchy that should be restored, the latter being in favor of a more liberal constitutional monarchy. Despite the election of a monarchist president in 1873 by the members of Parliament, Patrice de Mac Mahon, their projects of restoration did not succeed. Henri d’Artois, the Count of Chambord, grandson of Charles X and heir to the throne, refused to accept the ceremonial role that the constitution of the new regime was to offer him (Duc de Castries Reference de Castries1970). This disagreement crushed the hopes of a monarchist restoration in 1873. Various debates on the institutions of the new regime also agitated the Republicans. They finally agreed to create an upper house of Parliament (the Senate) alongside a lower house called the Chambre des députés (chamber of representatives). The final institutions of the Third Republic were eventually established by three constitutional laws in 1875, put forward by the centrist representative Henri Wallon.
The first elections that followed the adoption of the Third Republic’s institutions were crucial for the consolidation of the regime. Indeed, the Monarchists had not given up on their dream to restore a monarchy in France. The first elections to the lower house of Parliament were held on 20 February and 5 March 1876. The Republicans won the elections, as they elected 393 representatives against 208 for the Monarchists and Bonapartists. New elections were called in 1877 as Mac Mahon could not govern with a republican majority in Parliament. They were held on the 14th and 28th of October 1877 and returned another republican majority, with 323 representatives against 208 for the anti-Republicans. Mac Mahon finally resigned in 1879 and was replaced by a republican politician, Jules Grévy.
Reaching the conservative rural electors proved to be essential to the republican victory, which the Republicans managed to do by sticking to less revolutionary and belligerent ideas. After two consecutive failures, the discouraged Monarchists did not file candidates in the 252 or the 541 constituencies in the 1881 general elections (Franck Reference Franck2016). This led to a landslide republican victory, with 457 representatives against 88 for the Monarchists and Bonapartists. These latter remobilized and elected 201 representatives in 1885 against 303 Republicans. The Third Republic therefore appeared to be strongly consolidated after these elections.
However, growing dissatisfaction with the regime’s capacity to prepare for revenge against the German Empire brought a new politician to light, General Ernest Boulanger, Minister of War between 1886 and 1887. He managed to gather some of the bonapartist and radical electorate and to win a by-election in Paris in 1889. He, however, refused to attempt any coup against the regime and had to flee to Belgium after the Republicans prosecuted him for conspiracy. His political movement did not manage to significantly affect the 1889 general elections, as the republican coalition obtained 366 seats against 168 anti-Republicans and 42 Boulanger representatives. The final blow to the Monarchists’ hope of restoration was delivered by Pope Leo XIII in 1892, when he invited Catholics to rally the Republic in his encyclical, Au milieu des sollicitudes (In the midst of solicitude). This ralliement (rallying) policy, progressively prompted French Catholics into supporting republican movements. Monarchists and Bonapartists then slowly disappeared from the political sphere.
The average republican vote share for the Third Republic elections is depicted in Figure 1, alongside the republican support in 1849. As it appears clearly on the maps, the geographical political distinctions revealed by the 1849 election were long-lasting. The major change is the increased support for the Republicans in the northeastern part of France, which was occupied by the Prussian army between 1870 and 1873 (Salmon Reference Salmon2001). The republican strongholds remained located in the central and southeastern parts of the country.Footnote 7
DATA
Republican Vote and Turnout
The data on turnout and the election results are taken from Avenel (Reference Avenel1894) for the Third Republic general elections of 1876, 1877, 1881, 1885, 1889, and 1893. I do not consider more recent elections as democracy was strongly implemented and consolidated after the 1893 election. The corresponding data for the 1849 election have been provided by Frédéric Salmon. Taking the 1849 election into account permits a study of all legislative elections during which the consolidation of democracy was at stake during the nineteenth century.Footnote 8 I focus on elections to the lower house of Parliament since members of the upper house were elected by politicians with a local mandate, for example, mayors, but not directly by the people. I also select only the first round of each election, as there were too few elections with a second round to conduct reliable quantitative analysis. Political preferences are also more truthfully revealed in the first round, as “useful” voting or abstention are less likely. As in Franck (Reference Franck2016), I consider two measures of turnout. One relates the number of voters to the number of registered people, and the second relates the number of voters to the population eligible to vote, that is, the adult male population over 21. The number of registered voters is taken from Franck (Reference Franck2016) for the Third Republic elections, except in 1893 when it is taken from Avenel (Reference Avenel1894), and has been provided by A. Salmon for the 1849 election. As regards the second measure, I take the adult male population from the census closest to the election year.
The main dependent variable is the share of votes obtained by republican parties in the first round of each election, excluding blank or invalid votes. For the Third Republic elections, the opposition to the Republicans was constituted of Monarchists and Bonapartists, alongside Boulanger supporters in 1889. For the 1849 election, I consider two outcome variables: the share of votes obtained by the Démocrates-socialistes and the one obtained by this party and the moderate Republicans. This last variable represents the support for left-wing parties in 1849, which I refer to as the percentage of vote for the Republicans in the estimation tables. The opposition was represented by the right-wing and conservative Parti de L’Ordre, which was composed of Legitimists and Orléanists.Footnote 9
Landholding Inequality
The share of landless workers in 1851 and 1872, which constitutes the main dependent variable of interest, is taken from the national census of the corresponding years. These censuses specify the number of sharecroppers, tenant farmers, day workers, and landowners. The first three categories of workers did not own the land they were working on. Indeed, tenant farmers paid an annual rent to the landowners to exploit the land, while sharecroppers used an in-kind payment to do so. Day workers were paid each day for their work on the property. Therefore, I consider the share of landless agricultural workers to be the proportion of share-croppers, tenant farmers, and day-workers over all agricultural workers. I take this information from the source that is closest to the election years. It was unfortunately unavailable before the mid-nineteenth century, which explains the choice to rely on the 1851 census for the election of 1849.
The second measure of landholding inequality is represented by the share of medium and large, or small landholdings in each department. This information is absent from the censuses and is therefore taken from the 1862 agricultural survey. I am forced to rely on this survey for two reasons: the 1852 one does not provide this information, and the 1872 agricultural survey was not conducted because of the Franco-Prussian War. I therefore only use this measure of rural inequality for the Third Republic elections. The 1862 survey specifies the share of farms smaller than 5 hectares and bigger than 10, 20, 30, and 40 hectares. The first case constitutes a good approximation of landholdings that could be exploited by a single family and should therefore be positively correlated to the concentration of individual landowners. Around 55 percent of all landholdings were smaller than 5 hectares across French departments. I also consider landholdings bigger than 10 hectares as being medium or large ones, in compliance with previous historical studies (Mayeur Reference Mayeur1973; Duby and Wallon Reference Duby and Wallon1976). They represented, on average, only 25 percent of all holdings. Exploiting them required the employment of workers from outside of the family sphere, and therefore implied a relationship of economic dependence between landowners and workers. Considering larger holdings in the estimations would lead to similar results but decrease the strength of the instrument used. This is due to the lower variation in holdings of 20, 30, or 40 hectares between departments, as they represented only 14, 8, and 5 percent of all holdings in 1862.
Agriculture was the sector gathering the largest share of the labor force in nineteenth-century France. The 1851 census indicates, for example, that 53.2 percent of the total population belonged to a farming family. In 1881, 47.5 percent of the labor force was concentrated in agriculture, against 26.7 percent in industry and 24.9 percent in services. France has long been described as a country of small landholdings (Young Reference Young1794). The average surface area of holdings was 12 hectares in the mid-nineteenth century, but in half of the departments, more than half of the farms were less than 5 hectares (Demonet Reference Demonet1990). Figure 2 depicts the distribution of rural inequality over French departments. Landless workers were mostly concentrated in the north-western and north-central parts of France, the same departments where the concentration of small landholdings was low and where medium and large landholdings were more numerous. Therefore, agricultural workers more often owned their land and worked on small holdings in the central-eastern part of France, the Alpine region, and the Mediterranean basin.Footnote 10

Figure 2 SHARE OF LANDLESS AGRICULTURAL WORKERS
Notes: The share of landless workers is computed as the share of agricultural workers who do not own the land they are working on.
Source: See main text.
Terrain Ruggedness
Elevation data used to compute terrain ruggedness are the same as in Nunn and Puga (Reference Nunn and Puga2012), the GTOPO30 data set developed by the U.S. Geological Survey’s Center for Earth Resources Observation and Science (EROS) (Land Process Distributed Active Archive 2004). The terrestrial areas of the world are divided into identical 30 arc seconds (1x1 km) squares for which elevation is computed. Then, the terrain ruggedness index corresponds to the absolute elevation change between each grid-square and all contiguous grid-squares, computed following the method developed in Riley, Degloria, and Elliot (Reference Riley, Degloria and Elliot1999). More formally, let X r,c be the elevation for a square located in row r and column c in the grid of elevation squares. The terrain ruggedness index for this square is:
 $${\left[ {\mathop \sum \limits_{i - 1}^{i + 1} \mathop \sum \limits_{j - 1}^{j + 1} {{({X_{i,j}} - {X_{r,c}})}^2}} \right]^{{1 \over 2}}}$$
More concretely, the ruggedness of any given 1 km2 area is determined by measuring how the elevation of that area differs from all those of its neighboring 1 km2 areas. These differences are then squared so that positive and negative elevation changes contribute equally to the ruggedness measure. The sum of these differences is then normalized by taking the square root. Finally, the ruggedness index for all departments corresponds to the average ruggedness computed over all grid cells in the department. The unit for the index is therefore meters of elevation difference for the 30 arc seconds grid-squares.
The ruggedness index is higher for the central and eastern parts of France, which gather the main mountain chains, such as the Massif du Jura, Massif des Vosges, Massif central, and the Alps. The ruggedness is also high in the Pyrenees and Corsica. These are the only areas of France where the index exceeds 75, with a peak at 627 for the department of Savoie, while 85 percent of the departments are characterized by an average ruggedness lower than 200.Footnote 11
Economic and Demographic Controls
Most of the economic and demographic controls are coming from the Statistique générale de la France, the ministerial body created in 1833 and in charge of collecting and analyzing statistics for the government. The data taken from the population censuses derive from this body, along with the level of taxes in 1848, the literacy of men and women in 1854 and 1871–1875, the area of departments, and the urban population in 1846 and 1876. The industrial production in 1873 is also taken from this body, while its level in the first part of the century is derived from the industrial survey of 1839–1847. The share of the workforce in industry is taken from Franck (Reference Franck2016). The disposable income per inhabitant and the agricultural income per hectare in 1864 are from Delefortrie and Morice (Reference Delefortrie and Morice1959), while any agricultural variable measured in 1852 is from the agricultural survey conducted that year. Data on total income are computed as the total amount of taxes collected by departments. They are collected from publications by the Ministry of the Interior entitled La Situation Financière des Communes de France et de l’Algérie.
Descriptive Statistics
Descriptive statistics are reported in Table 1. Over the seven elections considered in this article, the Republicans got around 62 percent of all the votes. The turnout over the registered voters was 73.6 percent on average, 67.4 percent over the adult male population. The republican share of votes and turnout rates for all election years are available in Table A1 in the Online Appendix. They indicate that the elections were generally contested, as the Republicans grabbed around 55 percent of the votes during the 1876, 1877, and 1885 elections, and 40 percent during the 1849 election.Footnote 12 Landholding inequalities decreased in the second half of the nineteenth century in France, as the share of landless agricultural workers varied from 63 percent to 51 percent between 1851 and 1872. The share of small landholdings is quite coherent with the percentage of landless workers, as it amounted to 55 percent on average.
Table 1 SUMMARY STATISTICS

Notes: All variables are reported at the department level. The support for republican parties and the turnout variables are reported over the seven general elections present in the data set. The turnout over registered voters is defined as the percentage of effective voters over all people registered on the voting list. The equivalent over the adult male population is the other measure of turnout reported.
Source: See main text.
EMPIRICAL STRATEGY
The baseline estimation equations are the following:
 $$Ine{q_d} = {\alpha _d} + {\beta _{\rm{1}}}Rugge{d_d} + {\beta _{\rm{2}}}Ec{o_d} + {\beta _{\rm{3}}}Literac{y_d} + {\beta _{\rm{4}}}Dem{o_d} + { \in _d}$$
 $$Politica{l_d} = {\alpha _d} + {\beta _{\rm{1}}}Ine{q_d} + {\beta _{\rm{2}}}Ec{o_d} + {\beta _{\rm{3}}}Literac{y_d} + {\beta _{\rm{4}}}Dem{o_d} + { \in _d}$$
where Equation (1) corresponds to the first-stage equation and Equation (2) to the second-stage. In the first stage, I rely on Rugged, the average terrain ruggedness index at the department level d as an instrument for the landholding inequality Ineq. Ruggedness is a fixed measure, while the inequalities are measured as the share of landless workers in 1851 and 1872 or the share of medium and large or small landholdings in 1862. Eco stands for the economic controls, Literacy for the literacy controls, and Demo for the demographic controls. Political is the outcome variable, that is to say, the republican share of the vote or the turnout levels in 1849, 1876, 1877, 1881, 1885, 1889, and 1893.
Two sets of controls are used in the estimations and vary with the election periods. The first set was used for the 1849 election, while the second one applied to the Third Republic elections. In the first case, the economic controls are the industrial production per inhabitant in 1839–1847, the taxes on land, on the number of doors and windows, and the personal property tax in 1848. These taxes were created by the Assemblée Constituante during the revolutionary period, in 1791 and 1798. Alongside a patente tax on industrial and commercial resources, they are known as the Quatre vieilles, the four direct contributions entering the state and municipalities budgets. The patente tax is not included in the estimations as the volume of industrial production is directly available, which makes resorting to taxes to approximate economic resources unnecessary. The land tax was based on net incomes coming from the use of lands. The personal property tax was based on the rental value of personal residential buildings. The tax on doors and windows was positively related to their number and size and was supposed to reflect the wealth of the owners of the corresponding buildings.
For the Third Republic elections, I also control by the industrial production per inhabitant, measured in 1873. I include direct measures of the average economic resources within departments by controlling for the disposable income of people and the agricultural income per hectare in 1864. The disposable income is computed as the sum of all incomes (industrial, commercial, agricultural, wages, and pensions) net of the four direct taxes (Delefortrie and Morice Reference Delefortrie and Morice1959).
The literacy controls are the men and women literacy in 1854 for the 1849 elections, and in 1871–1875 for the Third Republic ones. Literacy rates are proxied by the percentage of men and women who were able to sign their marriage certificates. This proxy correlated very well with other literacy indicators such as the number of schools or the enrollment rate in primary education (Montalbo Reference Montalbo2021). Demographic controls are the area of departments and the share of the urban population in 1846 or 1876.
Controlling by these factors is important as they may have influenced the turnout levels and the support for the Republicans. For example, the concentration of industrial activities, associated with the modernization of the economy, negatively influenced the support for Napoléon III at the end of the Second Empire (Lacroix Reference Lacroix2017). On the contrary, the countryside massively supported the Second Empire in association with rising agricultural incomes during the reign of Napoléon III. Therefore, a higher agricultural income could be linked to a lower republican share of the vote during the second set of elections considered. The same thing is expected for the 1849 election (Agulhon Reference Agulhon2016). Controlling for urbanization is also important, as the Republicans were most often successful in gathering a high share of votes in towns (Salmon Reference Salmon2001).
Estimating Equation (2) by OLS only would make it problematic to identify the effect of rural inequality on the consolidation of democracy in France because a third factor could influence both the rural inequalities and the voting outcomes. Agricultural wealth, for example, might have shaped the support for the Republic and contributed to determining the share of agricultural workers capable of buying their own piece of land. The estimation of the relation between inequalities and the election results is therefore subject to a potential omitted variable bias.
Moreover, rural inequalities could also affect agricultural productivity and wealth. In this case, any relationship between inequalities and voting behavior may be due to their effect on wealth. Arthur Young already claimed that the high fragmentation of holdings was the cause of rural poverty and agricultural inefficiency in eighteenth-century France (Young Reference Young1794). More recent studies have also exhibited a negative association between land redistribution during the revolutionary period and agricultural productivity (Finley, Frank, and Johnson 2020).
To tackle these issues, I select the average terrain ruggedness of departments as an instrument for landholding inequalities. The rationale behind the instrumental variable strategy used is that a higher terrain ruggedness deterred local elites from cornering large proportions of land. Several studies identified that this characteristic of the land served as a protection for populations in various historical contexts. For example, it reduced the impact of raids during the slave trade (Nunn and Puga Reference Nunn and Puga2012) or of the famines following Mao Zedong’s Great Leap Forward in rural China (Gooch Reference Gooch2019). Scott (Reference Scott2009) also documents how a large part of the southeastern Asian territories, known as Zomia, benefited from a rugged terrain to avoid the domination of the elites and the constitution of the state. Therefore, terrain ruggedness is likely to have reduced the appropriation of land by the local elite in France and to have contributed to the dissemination of small landholdings.
This idea finds strong and long-term empirical support. Indeed, terrain ruggedness favored the concentration and the stability of land property from the Middle Ages to the nineteenth century in France. It contributed first to protecting landowners from the expansion of feudalism and the attacks of feudal lords against free property. The geographically differentiated distribution of land ownership, which resulted from this confrontation, remained stable after the revolutionary period and during the following century. Indeed, the regions with higher rural inequalities in the nineteenth century, and therefore a lower proportion of individual landowners appear to be the same as those in which free land ownership was already scarce during the Middle Ages. The reader can refer to the Online Appendix on page 9 for more precise developments on free property during the Middle Ages and its association with terrain ruggedness.
The association between ruggedness and landholding inequality is depicted in Figure 3. The relationship is positive as regards the proportion of small holdings and negative for medium and large tenures, along with the proportion of landless workers. OLS estimations indicate that a 1 standard deviation increase in terrain ruggedness is related to a 10 percentage points decrease in the share of landless workers, a 2.6 percentage points decrease in the share of medium and large landholdings, and a 4 percentage points increase in the share of small holdings. This relationship remains strong even when potential outlier values in terrain ruggedness are dropped from the analysis, as Figure B9 in the Online Appendix shows. Robustness checks on OLS and IV estimations will also confirm that the association between ruggedness, landholding inequalities, and the consolidation of democracy is not affected by excluding the very high values of terrain ruggedness.Footnote 13

Figure 3 SCATTER-PLOTS OF TERRAIN RUGGEDNESS, LANDLESS AGRICULTURAL WORKERS, AND LANDHOLDINGS SIZE
Notes: Each category of landholding is taken as the percentage over the whole number of holdings in a given department. The share of landless workers is computed as the share of agricultural workers who do not own the land they are working on.
Source: See main text.
Another important assumption of the estimation strategy concerns the validity of the ruggedness instrument. There are several transmission channels that could break the exclusion restriction. Terrain ruggedness could firstly be associated to a lower agricultural productivity due to higher transportation costs and stronger difficulties to irrigate and farm the land (Nogales, Archondo-Callao, and Bhandari Reference Nogales, Archondo-Callao and Bhandari2002). This might have increased the support for Republicans, in association with a higher rural poverty (Salmon Reference Salmon2001). This potential lower agricultural productivity could also have induced more people to look for better working opportunities and engage in industrial activities. Terrain ruggedness could therefore influence the consolidation of democracy through a reallocation of the labor force in the industrial sector. Urbanization may also have been negatively correlated with ruggedness because of a lack of flat terrain where cities could expand. Finally, ruggedness may have contributed to creating a culture of resistance by providing protection to local populations from feudal lords, which in turn might have affected electoral outcomes without being linked to rural inequalities. To test this fact, I took data on violent events that took place in France from 1830 to 1860 from Tilly and Zambrano (2006) and on rebellions against the gendarmes (police officers) from 1800 to 1859 from Lignereux (Reference Lignereux2008).
In Table 2, I regress literacy rates, urbanization, industrial production, the share of the workforce in industry, total income, agricultural income, and the indicators of violent events and rebellions against the gendarmes on the terrain ruggedness index. Reassuringly, rugged terrain is not significantly associated with these variables. This instrument is therefore most likely valid, as its effect on the support for the Republic is not due to a decrease in urbanization, literacy, agricultural productivity, to an expansion of industrial activities, or the formation of a culture of resistance. Even if it is impossible to rule out every potential factor through which ruggedness may influence democratization, these estimations indicate that it constitutes a satisfying instrument to approach causality.
Table 2 EXCLUSION RESTRICTION ON TERRAIN RUGGEDNESS

t statistics in parentheses
*p < 0.1, ** p < 0.05, *** p < 0.01
Notes: Women and men literacy is defined as the percentage of grooms able to sign their marriage contract. The industrial production is reported in francs per year, as well as the agricultural income. The share of workforce in industry is computed over the electoral period of the Third Republic considered in the analysis (1876–1893). Violent events are those which involved at least 50 persons, while the rebellions against the gendarmes involved at least three persons. Total income is computed as the total amount of taxes collected by departments.
Source: See main text.
The absence of a significant effect on agricultural productivity may seem odd at first sight. However, the mechanization of agriculture was still very low and the exploitation of land was highly “traditional” in mid-nineteenth-century France (Demonet Reference Demonet1990; Beltran and Griset Reference Beltran and Griset1994). Technical improvements were very limited, and the most advanced innovations were slow to generalize, as there were, for example, only 9,000 steam-powered threshing machines in France in 1882 (Braudel and Labrousse Reference Braudel and Labrousse1976). A rugged terrain was less likely to strongly affect agricultural productivity when its level was globally low and when ruggedness did not prevent important technological innovations from being implemented. This intuition is confirmed by the fact that terrain ruggedness was not significantly associated with the number of plows, scarifiers, steam-powered threshing machines, and the total number of agricultural machines in mid-nineteenth-century France.Footnote 14
LANDHOLDING INEQUALITY AND THE CONSOLIDATION OF DEMOCRACY
The 1849 Election and the Second Republic
The estimated outcomes for the 1849 election are displayed in Table 3.Footnote 15 Either within the OLS or the IV estimations, the percentage of landless agricultural workers is always negatively associated to support for the Démocrates-socialistes or the Republicans. The impact is always higher in the first case. A 1 percentage point increase in rural inequality is linked to a 0.4 percentage points decrease in support for the Démocrates-socialistes in the OLS estimations and between a 0.6 and a 1 percentage point decrease in the IV ones. The corresponding decreases for all the Republicans are 0.3 percentage points with the OLS and between 0.5 and 0.9 percentage points with the IV. Considering the IV estimates indicates that a 10 percentage points increase in rural inequality could have changed the majority in favor of the anti-republican coalitions in around 12 percent of the departments.
Table 3 LANDHOLDING INEQUALITY AND THE 1849 ELECTION

t statistics in parentheses
* p < 0.1, ** p < 0.05, *** p < 0.01
Notes: Démocrates-socialistes stands for the people belonging to the political party called the Montagne. Moderate republicans are included alongside the Démocrates-socialistes in the Republicans variable. The share of landless workers is computed as the share of agricultural workers who do not own the land they are working on.
Source: See main text.
Therefore, landholding inequalities contributed to strongly reducing the support for the Republicans, with this effect being stronger for the most left-wing republican coalition. In departments with a higher level of inequality, the Parti de L’Ordre, composed of Monarchists hostile to the new regime, received higher support. This coalition’s short-term goal was to implement conservative policies in France and, eventually, restore the Monarchy. Moreover, finding a stronger negative effect of rural inequalities on the share of the vote for the Démocrates-socialistes in 1849 compared to the Republicans constitutes an indication that the fear of redistribution played a role in shaping the opposition of large landowners to the Republic. Indeed, the members of this left-wing fringe of the Republicans were derided as partageux (sharers) in 1849 by their political adversaries, on account of their socialist ideas. Therefore, the negative effect of rural inequalities was stronger for the Republicans, who were the most in favor of the redistribution.
As displayed in Table 4, landholding inequalities did not prompt more people to go vote. These results, along with the equivalent ones for the Third Republic that return the same outcome, are important as they show that the influence of large landowners on the democratic consolidation worked through a change in the composition of electoral outcomes, but not through voter suppression. This is most likely due to the historical French context. Indeed, the secret ballot was instituted only in 1913 in France. To this date, it has been easy to know which party agricultural workers supported and voted for. Therefore, large landowners were most likely successful in influencing the vote of workers. This method appears to have been less costly than preventing people from voting, which would have required more men and could have been more easily spotted by police forces. Also, as explained in Garrigou (1912), the laws of 1913–4, which established the secret ballot, extended the notion of political corruption. To this date, the candidates could not be pursued if one of their partisans tried to buy votes or to economically influence voters in any fashion, as they were not deemed responsible for the actions of their supporters. In this context, candidates could try and change the vote of people with no fear of the judicial institutions as soon as they were not doing it themselves. This impunity certainly reinforced the idea that changing somebody’s vote was the best way to proceed.
Table 4 LANDHOLDING INEQUALITY AND THE 1849 ELECTION—TURNOUT

t statistics in parentheses
* p < 0.1, ** p < 0.05, *** p < 0.01
Notes: Turnout registered voters is defined as the share of voters over all registered people. Turnout adult male population stands for the share of voters over the adult male population (older than 21 years old). The share of landless workers is computed as the share of agricultural workers who do not own the land they are working on.
Source: See main text.
The effect of landholding inequalities on the consolidation of democracy remains significant under several robustness checks. Firstly, one could fear that extreme values of terrain ruggedness would drive the results. Dropping the top 25 percent of the departments in terms of terrain ruggedness does not affect the outcomes, which remain significant and have a similar magnitude. I also control by the influence of religion, which has most likely been strong in reducing the support for the Republicans in 1849 (Agulhon Reference Agulhon2016; Salmon Reference Salmon2001). I add to the baseline estimations the share of the French clergy who agreed to sign the 1790 Civil Constitution of the Clergy as a proxy for the secularization of society. This proxy, taken from Tackett (Reference Tackett1986), remains valid all along the nineteenth century (Squicciarini Reference Squicciarini2020). The outcomes remain significant, with a slightly lower magnitude.Footnote 16 I also control by the soil composition of departments, more precisely the concentration of silt and coarse sand taken from the Base de Données d’Analyses des Terres, which has been related to landholding inequalities in previous studies (Easterly Reference Easterly2007; Cinnirella and Hornung Reference Cinnirella and Hornung2016). To go further on this point, I control by the share of cropland and pastures over the total agricultural land. As ruggedness is correlated to the type of agricultural activities, favoring pastoral agriculture, one might fear that this would affect the magnitude of the estimations. I show that these additional controls only affect the first stage, as cropland or pastures are not strongly linked to support for the Republicans. I also add to the estimations the share of people who emigrated during the revolutionary period in France, taken from Greer (Reference Greer1951). Indeed, this emigration was mostly composed of landowners, which tended to reduce rural inequalities in the departments with a high proportion of émigrés (Franck and Michalopoulos Reference Franck and Michalopoulos2017). The outcomes remain significant under each specification.Footnote 17 Finally, to avoid having a few outlier departments driving the effect, a very common problem of IV estimations on small samples (Young Reference Young2022), I bootstrap the standard errors and restrict the sample by dropping the bottom and top 5 percent of the departments as regards their republican support. Despite a lower magnitude, the outcomes remain significant.Footnote 18
The maps of landholding inequalities and electoral outcomes also display a potentially strong spatial correlation that needs to be accounted for (Kelly Reference Kelly2019). Moran tests for spatial dependence of OLS residuals return high statistics, which indicates that the effect of landholding inequalities on democratic consolidation is likely to be subject to an issue of spatial correlation. Using the same restrictions on ruggedness and potential electoral outliers that I also apply in the robustness checks reduces this issue, while the estimates remain strongly significant. The same is true when controlling for longitude in the regressions.Footnote 19
The Third Republic Elections
The Third Republic election outcomes are analyzed in Table 5.Footnote 20 The outcomes indicate a negative effect of rural inequalities on the support for the Republicans in each election, from 1876 to 1893. A 1 percentage-point increase in the share of landless workers is associated to a fall in the republican share of vote, of between 0.25 and 1.1 percentage points. This corresponds to around 8 percent of the departments in 1877 (lowest effect) to 35 percent in 1885 (highest effect), experiencing a change in majority in favor of the anti-republican coalitions after a 10 percentage points increase in rural inequality. Quite interestingly, the effect increases from 0.5 percentage points in 1876 to 1 in the 1881 election. This magnitude should however be interpreted with some caution as the anti-Republicans did not file candidates in all the constituencies in 1881. It then remains at this level for three elections before going back to 0.5 in 1893. Therefore, landholding inequalities reinforced the anti-republican coalition more strongly in the three crucial elections of 1881, 1885, and 1889, during which the Third Republic consolidated. Then, after the instigation of the ralliement of French Catholics to the Republic, this effect decreased, along with the general support for Monarchists and Bonapartists.Footnote 21 This is consistent with the hypothesis that rural inequalities worked through the political pressure exercised by landowners who feared a potential redistribution by the Republic. This fear most likely increased during the three elections that saw its consolidation and when the possibility of a monarchist restoration slowly faded away.
Table 5 LANDHOLDING INEQUALITY AND THE THIRD REPUBLIC ELECTIONS

t statistics in parentheses
* p < 0.1, ** p < 0.05, *** p < 0.01
Notes: Each year corresponds to a legislative election. The share of landless workers is computed as the share of agricultural workers who do not own the land they are working on.
Source: See main text.
These estimations are robust to all the restrictions applied to the 1849 election. As additional robustness checks, I control for the departments of France that were occupied by the Prussian army between 1870 and 1873. Indeed, it is within these departments that the support for the Republicans increased the most between 1849 and 1876 (Salmon Reference Salmon2001). From Flechey (Reference Flechey1877), I consider a dummy variable for each of the 33 departments with at least one municipality occupied between 1870 and 1873. I also control for the level of per capita taxes, which positively influenced republican support during the first elections of the Third Republic (Franck Reference Franck2016). The estimation outcomes remain negative and significant under these various specifications, with a similar magnitude. Moran p-values indicate that OLS residuals are not spatially correlated and, therefore, that spatial correlation does not constitute a threat to the reliability of the estimations.Footnote 22
Reassuringly, the estimations remain significant when considering alternative measures of land-holding inequality. Using the share of landless workers coming from the 1851 census does not modify the estimation outcomes. This is also true when inequalities are measured as the share of small, medium, and large landholdings. The first case is represented in Table 6.
Table 6 SMALL LANDHOLDINGS AND THE THIRD REPUBLIC ELECTIONS

t statistics in parentheses
* p < 0.1, ** p < 0.05, *** p < 0.01
Notes: Each year corresponds to a legislative election. Each category of landholdings is taken as the percentage over the whole number of holdings in a given department.
Source: See main text.
Holdings smaller than 5 hectares, typically farmed by a single family, are positively associated with republican support. An increase of 1 percentage point in the proportion of small tenures is indeed related to an increase of between 0.5 and 2.3 percentage points in the republican share of the vote. The corresponding negative figures for the share of holdings bigger than 10 hectares are –0.8 and –3.4 percentage points.Footnote 23 It is also worth noting that the share of landless agricultural workers in 1851 and 1872 was negatively linked to the 1870 plebiscite that Napoléon III organized and is documented in Lacroix (Reference Lacroix2017). On the contrary, the concentration of small landholdings in 1862 is positively associated to the opposition to Napoléon III. These results, displayed in Table A26 in the Online Appendix, confirm the outcomes of the paper. Finally, as it appears in Table A27 and Table A28 in the Online Appendix, the effect of rural inequality on the consolidation of the Third Republic is not related to a change in the turnout level.Footnote 24
The Dynamic Effect of Landholding Inequalities
The previous estimations, however, remain static and do not help investigate the dynamic nature of democratic consolidation. If landholding inequalities did affect this consolidation, one would expect that variations in the share of landless workers within a given department would impact support for the Republic. Therefore, I also estimate the following model:
 $$Ine{q_d} = {\alpha _d} + {\beta _{\rm{1}}}Rugge{d_d} + {\beta _{\rm{2}}}Ec{o_d} + {\beta _{\rm{3}}}Literac{y_d} + {\beta _{\rm{4}}}Dem{o_d} + { \in _d}$$
I introduce department (Dep) and year (Year) fixed effects by considering two periods (t): the first one corresponds to the 1849 general election, while the second corresponds to the Third Republic elections. I am forced to do so as the measure of rural inequality has not varied across the elections of the Third Republic. The year fixed effect, therefore, corresponds rather to a period effect. The sample used is constituted of the 81 departments common to both periods and for which all data are available. I only keep control variables that vary between the periods, namely the literacy rate, the urban population share, and the industrial production per inhabitant. I also add a measure of economic wealth by introducing the amount of taxes per capita. The standard errors are clustered at the department level.
As the second period corresponds to the Third Republic, the measure of Republican support during this period is taken over the six elections considered in the main estimations. I consider three specifications, taking alternately the minimum, average, and median values of the Republican share of the vote between 1876 and 1893. I do so to ensure that the effect will not be driven by a single election. The estimation outcomes are reported in Table 7. They show that a within-department increase in rural inequalities was significantly associated with a decrease in support for the Republic, as a 1-percent increase in inequality is linked to a 0.2 percentage points decrease in the Republican vote share. The effect is significant when taking either the minimum, average, or median value of Republican support. These estimations show that the impact of rural inequality remains significant when controlling for departments and time fixed effects, that is, for unobserved changes over time that affect all departments and for unobserved time-invariant department characteristics. It also provides an additional piece of evidence that the consolidation of democracy was directly dependent on variations in the level of rural inequality. The departments that supported more strongly the Republicans were those where this level decreased throughout the period under scrutiny in the article.
Table 7 LANDHOLDING INEQUALITY AND THE CONSOLIDATION OF DEMOCRACY: WITHIN-DEPARTMENTS ESTIMATIONS

t statistics in parentheses
* p < 0.1, ** p < 0.05, *** p < 0.01
Notes: The share of landless workers is computed as the share of agricultural workers who do not own the land they are working on.
Source: See main text.
Transmission Channels
Why did landholding inequalities negatively affect the consolidation of democracy? The scholars who documented a negative relationship between rural inequalities and the support for democracy in the French case insisted on the economic dependence of agricultural workers and the pressure exercised by the elite. For Siegfried (Reference Siegfried1913), Lavisse and Seignobos (Reference Lavisse and Seignobos1920), and Duby and Wallon (Reference Duby and Wallon1976), sharecroppers, tenant farmers, and day workers could not easily support the Republicans and run the risk of upsetting the landowners because of their economic dependence. They could indeed be laid-off and be unable to find another landowner willing to employ them on account of their democratic ideas. Any debt due to the landowner, which was common at that time, also reinforced this economic dependence. This threat was increased by the fact that the secret ballot was not established in France until 1913, which made it easy for a large landowner to collect information on the votes. For the 1849 election, the threat was also higher as the voting took place in the chief town of the cantonFootnote 25 and not in the municipality. Electors coming from the same municipality walked together to the chief town and voted at the same time, which reinforced the collective dimension of the electoral participation and any potential political pressure (Garrigou Reference Garrigou1992). Candidates also often negotiated directly with the large landowners to secure the votes of their employees.
The transmission channel related to an economic and social control of landowners can be tested with the data from the agricultural survey of 1852. Indeed, this survey reports both the number of landowners who did not live on their land and the number who did live on their land but did not exploit them directly. The former corresponds to owners who typically chose to delegate the exploitation and live in towns. The latter did live on their land, which was also exploited by tenant farmers, sharecroppers, or day workers. Both categories therefore correspond to rich landowners with large properties that were exploited by employees. Their higher concentration in a given department, concomitant with a higher number of landless workers, is thus expected to decrease support for democracy.Footnote 26 However, both categories of landowners should not have been able to exert the same level of political pressure. In his study of western France, Siegfried (Reference Siegfried1913) hypothesized that only landowners living on their land could efficiently influence the voters and significantly affect the electoral outcomes. The argument is simple: by living close to the workers, these landowners could impose stronger political pressure on them as they could easily know their electoral opinions and choices. To check for this assumption, I constructed two variables from the 1852 survey, namely, the proportion of “present” and “absent” landowners over the total number of agricultural workers. Finding a negative and stronger relationship between the republican share of the vote and the proportion of present landowners, compared to the absent ones, would provide evidence that rural inequalities negatively influenced the consolidation of democracy in France through the economic and social control of owners.
In Table 8, I investigate this transmission channel in the Third Republic elections. I stick to OLS estimations as the instrument used cannot help distinguish between the two types of landowners. The correlations obtained are nonetheless very instructive, as the proportion of absent landowners was never significantly associated to the republican vote share, while present owners were negatively linked to this electoral outcome from 1876 to 1885. An increase of 1 percentage point in the proportion of present landowners over the total number of agricultural workers was indeed associated with a decrease between 0.7 and 1.3 percentage points of the republican vote share. These outcomes tend to confirm the assumption that rural inequalities affected the consolidation of democracy through the economic dependence of agricultural workers and the political pressure of large landowners.Footnote 27
Table 8 LANDOWNERS’ TYPE AND THE THIRD REPUBLIC ELECTIONS

t statistics in parentheses
∗ p < 0.1, ∗∗ p < 0.05, ∗∗∗ p < 0.01
Notes: Present landowners correspond to landowners who live on their lands without exploiting them directly. Absent landowners are those who do not live on the lands they possess. Both are expressed in percentage over the total number of agricultural workers.
Source: See main text.
CONCLUSION
Landholding inequalities may be detrimental to the democratization process and to the consolidation of democracy. Historically, countries characterized by a higher level of rural inequalities tended to democratize more slowly. In the case of France, the concentration of landless agricultural workers or of medium and large landholdings was associated with lower support for republican coalitions during the Second and Third Republics. Landless agricultural workers were economically dependent on landowners, which reduced their political freedom and contributed to aligning their positions with those of their employers, who were most often against the establishment of the Republic. This delayed and weakened the consolidation of democracy in nineteenth-century France. Indeed, the Second Republic ended soon after the defeat of the Republicans in the 1849 general elections, while the Third Republic was politically firmly established only after the 1893 elections. Therefore, landholding inequalities constituted a strong barrier against the democratic consolidation of France.


