


Introduction
Lung cancer remains the second leading cause of cancer death in Canada, and it is responsible for approximately 25% of all cancer deaths. 1,Reference Brenner, Poirier and Woods2 Furthermore, an estimated 30,000 new cases of lung cancer are expected to be diagnosed in 2022, which accounts for 13% of all newly diagnosed cancer cases. 1,Reference Brenner, Poirier and Woods2 Lung cancer is generally categorised as small-cell lung cancer or non-small cell lung cancer (NSCLC), with the latter usually starting in the glandular or squamous cells and accounts for approximately 85% of all cases. Reference Molina, Yang, Cassivi, Schild and Adjei3 For early-stage NSCLC, surgery is considered the primary treatment option with a 5-year overall survival rate of 25–75%. Reference Lang-Lazdunski4,Reference Cortés, Urquizu and Cubero5 However, late-stage or advanced disease could render patients unsuitable for surgery, mainly because of the extent of the disease. The current standard of care for patients with locally advanced NSCLC includes external beam radiation to treat the primary site and chemotherapy to treat any metastatic diseases.
Stereotactic body radiation therapy (SBRT) is a well-established treatment technique for patients with inoperable small NSCLC (<5 cm). Reference Lee, Lee and Verma6,Reference Yu, Xu, Sinclair, Zhang, Langner and Mak7 The technique enables the conformal delivery of high doses of radiation (i.e., 45–60Gy) to the target, resulting in increased local tumour control (>80% at 2 years) while maintaining a relatively low toxicity rate. Reference Lee, Lee and Verma6,Reference Sun, Brooks and Komaki8–Reference Schonewolf, Heskel and Doucette10 For bulky NSCLC, conventional hyper-fractionated scheme in addition to chemotherapy is commonly used. Reference Bezjak, Temin and Franklin11–Reference De Ruysscher, Vansteenkiste, Belderbos, Decaluwé and Dingemans13 Concurrent radiation therapy has been delivered using three-dimensional conformal radiation therapy (3DCRT), intensity-modulated radiation therapy (IMRT) or volumetric-modulated arc therapy (VMAT). The VMAT technique has been widely used to achieve high conformal dose distributions to the target with better sparing of organs at risk (OARs). Reference Jiang, Li and Liu14 This technique allows the delivery of the treatment plan with a continuous rotation of the gantry and simultaneous variation of the dose rate. Numerous studies have been published reporting the potential of the VMAT techniques to reduce the treatment time without compromising plan quality. Reference Yu, Xu, Sinclair, Zhang, Langner and Mak7,Reference Bedford, Nordmark Hansen and Mcnair15–Reference Holt, Van Vliet-Vroegindeweij, Mans, Belderbos and Damen17 A prescription of 60–63Gy in 30–35 fractions for patients with NSCLC was initially recommended by the Radiation Therapy Oncology Group (RTOG) 7301 trial. Reference Perez, Stanley, Brady, Brown, Rotman and Seydel18 A randomised phase III trial by Bradley et al. Reference Bradley, Paulus and Komaki19 comparing the standard dose (60Gy/30 fractions) to the high dose (74Gy/37 fractions) in patients with stage IIIA/IIIB NSCLC, reported that dose escalation beyond 60Gy has not been associated with increased clinical benefits, especially with regards to overall survival. Thus, it is recommended that the standard radiation dose with concurrent chemotherapy for patients with NSCLC should remain 60 Gy. Reference Bradley, Paulus and Komaki19–Reference Iyengar, Zhang-Velten and Court22
Radiation therapy of NSCLC is being used clinically at different centres around the world; however, locally developed treatment plan’s acceptability criteria in terms of target coverage and OARs dose constraints may be lacking. Published clinical trials usually resolve this issue by providing well-defined criteria for a treatment plan’s acceptability within the trial; however, there is still a need for the development of local site-specific treatment plan acceptability criteria based on local resources to minimise potential variations in patient treatment plans acceptability and to improve planning consistency. This retrospective study aimed at establishing institutional criteria for non-SBRT volume-based lung treatment plans acceptability based on our current experiences and resources. In that regard, the performance of the AcurosXB (AXB) Reference Antonella, Giorgia, Alessandro, Eugenio, Pietro and Luca23 and the Anisotropic Analytical Algorithm (AAA) Reference Sievinen, Ulmer and Kaissl24,Reference Breitman, Rathee and Newcomb25 dose calculation algorithms in the eclipse TPS are compared to Monte Carlo (MC) simulations.
Materials and Methods
Patients’ characteristics
The CT dataset of 20 previously treated lung cancer patients treated between 2016 and 2021 with a prescription of 60 Gy in 30 fractions was included in this retrospective study. This study was approved by the local Tri-Hospital Research Ethics Board. All patients were treated with the VMAT technique via RapidArc (Varian Medical Systems, Palo Alto, CA, USA). Exclusion criteria included any lung tumours that were non-NSCLC or patients treated with SBRT. Table 1 shows the summary of patient’s characteristics and tumour locations and sizes.
Table 1. Summary of patients’ characteristics

Abbreviations: GTV, gross tumour volume; CTV, clinical target volume; PTV, Planning target volume; post, posterior; and ant, anterior.
Treatment simulation and planning
At our institution, lung VMAT is routinely performed with 4DCT technique for motion management. The local standard protocol for CT scan of all NSCLC patients consists of a 4DCT and a slice thickness of 3 mm. All scans are then exported to the Eclipse Treatment Planning System (TPS v.15·5, Varian Oncology Systems, Palo Alto, CA, USA) to generate the required plan. For full details of the patient positioning and treatment simulation for lung patients at the centre, the reader is referred to Osei et al. Reference Osei, Darko and Swanson26 For purposes of this study, the selected patient’s CT dataset were all anonymised and re-plan keeping all structures as contoured by the radiation oncologist for the actual patient treatment plans to ensure plan consistency.
Target and OARs delineation
Target and OARs are contoured based on institutional guidelines and included the delineation of gross tumour volume (GTV), internal target volume (ITV), clinical target volume (CTV), planning target volume (PTV), bilateral lung, spinal canal, heart and oesophagus. Other OARs such as skin, ribs and brachial plexus are delineated on a case-by-case basis. The GTV was contoured on a free-breathing CT scan in addition to three breathing phases: 0, 50 and 100 phases, which were combined to form the ITV. For this study, the ITV was expanded isotropically by 5 mm to form the CTV, which was then expanded by another 5 mm to generate the PTV contour. Ring structures around the GTV were also created for optimisation purposes to ensure the dose conforms to the PTV. In order to evaluate the low-dose spillage in the treatment plan Reference Osei, Darko and Swanson26 , a 2-cm ring was contoured around the PTV to determine the maximum dose to any point 2 cm away from the PTV in any direction (D2cm).
Treatment planning
Treatment re-planning was performed for all the 20 patients in the Varian Eclipse Treatment Planning System versions 15·5 (Varian Oncology Systems, Palo Alto, CA, USA). All treatment plans were generated using 2–3 VMAT arcs and 6 MV photon beams. The dose calculation was carried out using the AXB and AAA v15·6·06 with heterogeneity corrections and a dose grid of 2 mm. All the plans were normalised such that the PTV-V100% = 95% Reference Bradley, Paulus and Komaki19,Reference Bradley, Hu and Komaki20 and PTV-V95% = 95%. Reference Li, Wang and Tan27,Reference Bourbonne, Lucia and Jaouen28 and were evaluated to make sure that they meet the criteria for plan acceptability for the PTV and OARs dose–volume constraints as shown in Table 2. Reference Bradley, Paulus and Komaki19 The spinal canal dose constraint is considered the highest priority, and therefore, all efforts are made to meet the constraint (Dmax ≤ 50Gy).
Table 2. Planning target volume (PTV) and organ at risks (OARs) dose constraints based on PTV V100% = 95% and PTV V95% = 95% plan normalisations criteria

Monte Carlo simulation
The EGSNRC Monte Carlo (MC) code together with DOSXYZNRC Reference Walters, Kawrakow and Rogers29 , which is a three-dimensional voxel dose calculation module, were used to carry out Monte Carlo simulations of radiation transport for all the patients’ plans. With the Monte Carlo code, the transport of each radiation particle is carried out in the given inhomogeneous medium according to the probabilities or cross-sections of the allowed interactions. The trajectory of each particle is traced until it is absorbed or escapes from the phantom and the discrete energy deposition steps are accumulated. The final dose distribution is the result of millions of accumulated energy deposition events. In this simulation, the number of photon histories was chosen such that the statistical uncertainty in the dose calculation is less than 1%. For full details on MC simulation, the reader is referred to Behinaein et al. Reference Behinaein, Osei, Darko, Charland and Bassi30
Plans evaluation
Dosimetric parameters for the target volumes (GTV, ITV, CTV and PTV) and OARs (bilateral lung, spinal canal, oesophagus and heart) were calculated. Data are reported as mean ± SD, minimum, maximum and range (minimum–maximum) doses to the target volumes and the OARs. The dosimetric analysis was stratified into two groups based on the plan normalisation method: (i) PTV-V100% = 95% and (ii) PTV-V95% = 95% normalisation criteria. The plan's quality was also evaluated using the heterogeneity index (HI5/95), conformity index (CI), R50% index and the mean and maximum dose to any point 2 cm from the PTV in any direction (i.e., D2cm). The PTV HI5/95 and CI assess the dose distribution and conformity within the PTV, while R50% and D2cm evaluate the dose spillage and fall-off gradient beyond the PTV. The following definitions were implemented in this study: Reference Osei, Darko and Swanson26,Reference Weyh, Konski, Nalichowski, Maier and Lack31–33
 $$H{I_{5/95}} = \;{{{D_{5\% }}} \over {{D_{95\% }}}}$$
 $$CI = \;{{{V_{RI - X\% }}} \over {TV}}$$
 $${R_{50\% }} = \;{{{V_{RI - 50\% }}} \over {TV}}$$
Where D5% and D95% represent the doses received by 5% and 95% of the PTV-Volume. VRI-X% represent the volumes of tissue covered by the reference (‘X’) isodose line (in this case 100% for PTV-V100% = 95% or 95% for PTV-V95% = 95% plan normalisations). VRI-50% represent the volume of tissue covered by the 50% isodose. TV is the PTV-Volume in cc. Values of HI5/95 and CI closest to 1 indicate greater homogeneity and better conformity of dose within the target. Lower R50% ratios and D2cm doses show greater dose fall-off and better plan conformity. Reference Weyh, Konski, Nalichowski, Maier and Lack31
Results
We used the CT dataset of 20 previously treated patients at our centre and re-generated the treatment plans to derive local plan acceptability criteria. We compared the impact of different dose calculation algorithms and plan normalisation criteria on target and OAR dose distribution. A summary of the statistical analysis of the target (PTV, ITV and GTV) dose using AAA, AXB, and MC for VMAT plans for the 20 patients are shown in Tables 3 and 4 for PTV-V100% = 95% and PTV-V95% = 95% plans normalisation criteria, respectively. The PTV, ITV and GTV are assessed by the mean, maximum and minimum doses, V60Gy, V57Gy, V54Gy and D0·03cc. The plan quality was also quantitatively assessed by calculating the HI5/95, CI, R50% and D2cm,max and D2cm,mean for the PTV for all patients (Tables 3 and 4). We evaluated the doses of the OARs including the bilateral lung, spinal canal, oesophagus and heart and a summary of the statistical analysis is shown in Tables 5 and 6. The dose to the bilateral lung was indexed by the mean dose, V20Gy and V5Gy (i.e., the percentage volume of the bilateral lung receiving the indicated dose). The dose to the spinal canal was indexed by the mean and maximum doses and the dose to the oesophagus was indexed by the mean dose and V60Gy. The dose to the heart was indexed by the mean dose, V60Gy, V45Gy and V40Gy. Figure 1 shows a correlation of the PTV with the GTV equivalent sphere diameters (ESD) for all patients. The average PTV ESD was 10 ± 3 cm (range, 4–14 cm), while the average GTV ESD was 7 ± 3 cm (range, 2–11 cm). The DVH of the PTV, bilateral lung and spinal canal for all 20 patients’ plans normalised to PTV-V100% = 95% and PTV-V95% = 95% are shown in Figures 2 and 3, respectively. Figure 4 shows the mean dose volume histogram (DVHs) of the PTV, bilateral lung, spinal canal and oesophagus for the PTV-V100% = 95% normalisation and PTV-V95% = 95% criteria, respectively. The results show the comparisons of the three-dose calculation algorithms evaluated in this study: AAA, AXB and MC.
Table 3. A summary of the statistical analysis of the target dose for plans normalised to PTV V100% = 95%

Abbreviations: PTV, Planning Target Volume; ITV, Internal Target Volume; GTV, Gross Tumour Volume; AAA, Anisotropic Analytic Algorithm; AXB, AcurosXB; MC, Monte Carlo.
Table 4. A summary of the statistical analysis of the target dose for plans normalised to PTV V95% = 95%
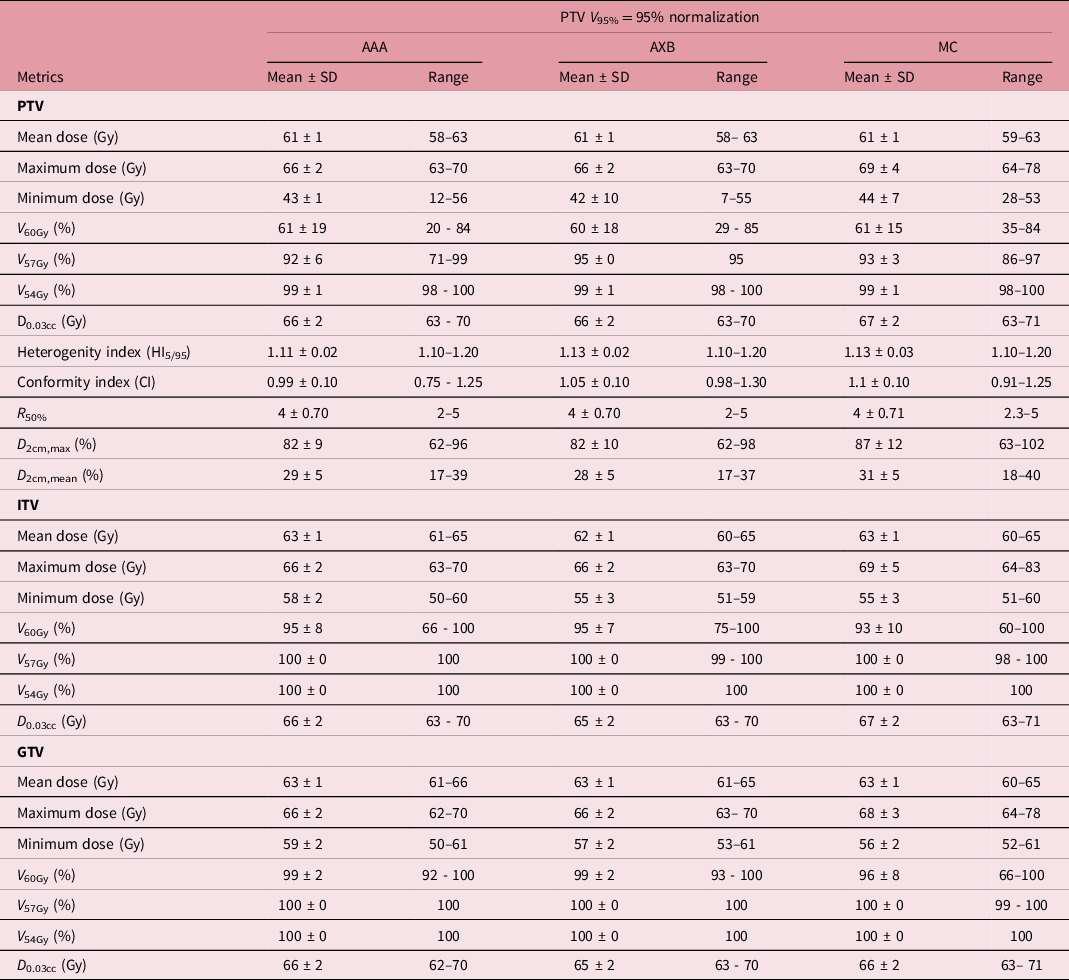
Abbreviations: PTV, Planning Target Volume; ITV, Internal Target Volume; GTV, Gross Tumour Volume. AAA, Anisotropic Analytic Algorithm; AXB, AcurosXB; MC, Monte Carlo.
Table 5. A summary of statistical analysis of OARs for plans normalised to PTV V100% = 95%

AAA, Anisotropic Analytic Algorithm; AXB, AcurosXB; MC, Monte Carlo.
Table 6. A summary of statistical analysis of OARs for plans normalised to PTV V95% = 95%

AAA, Anisotropic Analytic Algorithm; AXB, AcurosXB; MC, Monte Carlo.

Figure 1. Scatter plot showing the correlation between PTV and GTV equivalent sphere diameters (cm). Abbreviations: GTV, gross target volume; PTV, planning target volume.

Figure 2. Dose volume histogram (DVH) of PTV, bilateral lung and spinal canal for the 20 patients for PTV V100% = 95% normalisation and for the three different dose calculation algorithms: AAA, AXB and MC. The mean DVHs are also shown (red lines). Abbreviations: PTV, planning target volume; AAA, Anisotropic Analytic Algorithm; AXB, AcurosXB; MC, Monte Carlo.

Figure 3. Dose volume histogram (DVH) of PTV, bilateral lung and spinal canal for the 20 patients for PTV V95% = 95% normalisation criteria and for the three different dose calculation algorithms: AcurosXB, AAA and Monte Carlo (MC) simulation, respectively. The mean DVHs are also shown (red lines). Abbreviations: PTV, planning target volume; AAA, Anisotropic Analytic Algorithm; AXB, AcurosXB; MC, Monte Carlo.

Figure 4. Dose volume histogram (DVH) of PTV, bilateral lung, spinal canal, oesophagus and heart averaged over 20 patients. Results are shown for both normalisation methods and the three different dose calculation algorithms: AAA, AXB and MC. Abbreviations: PTV, Planning Target Volume; AAA, Anisotropic Analytic Algorithm; AXB, AcurosXB; MC, Monte Carlo.
Discussion
Evaluation of plan quality
The quality of the plans was quantitatively evaluated by calculating the HI5/95, CI, D2cm and R50% for each of the plans.
Heterogeneity index
We assessed the heterogeneity of all the plans with the heterogeneity index (HI5/95). The mean HI5/95 for the PTV when plans are normalised to PTV-V100% = 95% are 1·13 ± 0·02, 1·11 ± 0·02 and 1·13 ± 0·03 for AAA, AXB and MC calculation algorithms, respectively (Table 3). The corresponding mean HI5/95 for the PTV when plans are normalised to PTV-V95% = 95% are 1·13 ± 0·02, 1·13 ± 0·02, and 1·13 ± 0·03 for the AAA, AXB and MC calculation algorithms, respectively (Table 4). A two-tailed Student’s t-test of the mean HI5/95 indicates a significant difference between AAA and AXB (p < 0·05) regardless of plan normalisation method. According to RTOG 0813 Reference Papiez, Kong, Co-Chair and Timmerman34,Reference Bezjak, Paulus and Gaspar35 , when HI5/95 < 1·2 (considered ideal) or HI5/95 < 1·5 (considered minor deviation), it indicates greater heterogeneity within the target volume. Thus, our data show great heterogeneity for all plans regardless of dose calculation algorithm and plan normalisation protocol. Several studies Reference Osei, Darko and Swanson26,Reference Li, Wang and Tan27,Reference Weyh, Konski, Nalichowski, Maier and Lack31,Reference Lu, Lin, Lin and Huang36–Reference Chen, Qu, Yang, Weiss, Sim and Liao39 have compared the dosimetric parameters for treatment plans for lung tumours using 3DCRT, IMRT and VMAT techniques and have reported similar HI5/95 values. Weyh et al. Reference Weyh, Konski, Nalichowski, Maier and Lack31 compared IMRT and VMAT treatment plans to determine optimal treatment modality for the delivery of SBRT to peripheral lung tumours and reported HI5/95 of 1·15 ± 0·02 and 1·14 ± 0·02 for IMRT and VMAT plans, respectively. Similarly, Osei et al. Reference Osei, Darko and Swanson26 reported HI5/95 values of 1·3 ± 0·1 for 3DCRT and 1·2 ± 0·0 for VMAT plans. Chen et al. Reference Chen, Qu, Yang, Weiss, Sim and Liao39 evaluated plan quality and dosimetric differences of clinically deliverable IMRT lung plans generated with Tomotherapy, Pinnacle and RayStation™ treatment planning systems (TPS). They reported HI5/95 of 1·07 ± 0·02, 1·07 ± 0·02 and 1·03 ± 0·01 for plans generated with Tomotherapy, Pinnacle and RayStation TPS, respectively.
Dose conformity
The dose conformity to the PTV for all plans was assessed with the CI. The mean CI for the PTV when plans are normalised to PTV-V100% = 95% are 0·99 ± 1, 1·04 ± 0·05, and 1·1 ± 0·08 for AAA, AXB and MC calculation algorithms respectively (Table 3). The corresponding mean CI when plans are normalised to PTV-V95% = 95% are 0·99 ± 0·10, 1·05 ± 0·10 and 1·10 ± 0·10 for the AAA, AXB and MC calculation algorithms, respectively (Table 4). When CI values are close to 1, it indicates better conformity of dose to the target (i.e. PTV). Thus, our data show greater dose conformity to the PTV for all plan normalisations and calculation algorithms. A two-tailed Student’s t-test of the mean CI indicates no significant difference (p > 0·05) between AAA and AXB dose calculation algorithms irrespective of plan normalisation method. Several studies Reference Osei, Darko and Swanson26,Reference Li, Wang and Tan27,Reference Lu, Lin, Lin and Huang36–Reference Chen, Qu, Yang, Weiss, Sim and Liao39 have investigated the CI to PTV for lung treatment plans and have reported similar results. Osei et al. Reference Osei, Darko and Swanson26 , retrospectively, analysed and compared lung SBRT treatment plans of 263 patients treated with either a 3DCRT non-coplanar or with 2–3 VMAT arcs technique and reported mean CI of 1·1 ± 0·1 for 3DCRT and 1·0 ± 0·1 for VMAT plans. Similarly, Weyh et al. Reference Weyh, Konski, Nalichowski, Maier and Lack31 reported mean CI of 1·36 ± 2·9 and 1·29 ± 2·2 for IMRT and VMAT plans, respectively. Matsuoka et al. Reference Matsuoka, Araki, Ohno, Sakata and Tominaga38 investigated the dependence of volume dose indices on dose calculation algorithms for VMAT SBRT plans to treat peripheral lung tumours and also compared with MC calculations. They reported CI of 1·14 ± 0·26, 1·38 ± 0·23 and 1·24 ± 0·24 for MC, AAA and AXB, respectively. Ong et al. Reference Ong, Ang and Soh37 compared the 3DCRT and VMAT SBRT treatment plans for 20 NSCLC patients’ calculated with AAA and AXB and reported median CI of 1·07 and 1·02 for AAA and AXB, respectively.
D2cm and R50%
The dose fall-off beyond the PTV extending into normal tissue structures in all direction was assessed in this study using both the D2cm and R50%. According to ROTG 0813 Reference Papiez, Kong, Co-Chair and Timmerman34,Reference Bezjak, Paulus and Gaspar35 , the maximum dose to any point 2 cm (D2cm, max) away from the PTV in any direction (D2cm) should be less than 50–77% (considered ideal) or 57–94% (considered minor deviation) of the prescription dose for PTV-Volumes ranging from 1·8cc to 163cc. Furthermore, the protocol recommended R50% < 2·9–5·9 (considered ideal) or R50% < 3·7–7·5 (considered minor deviation) for PTV-Volumes ranging from 1·8cc to 163 cc. We used both D2cm and R50% to evaluate the intermediate dose spillage in the plans. The global mean D2cm, max are 86 ± 10%, 87 ± 10%, and 91 ± 12%; and the R50% are 4·0 ± 0·8, 4·0 ± 0·8 and 4·0 ± 0·82 for AAA, AXB and MC, respectively, when plans are normalised to PTV-V100% = 95% (Table 3). When plans are normalised to PTV-V95% = 95%, the corresponding global mean D2cm, max is 82 ± 9%, 82 ± 10% and 87 ± 12%; and the R50% is 4·0 ± 0·7 for AAA, AXB and MC, respectively (Table 4). Thus, our data show greater dose fall-off from the PTV for all plan normalisations and calculation algorithms according to the RTOG 0813 recommendations. Reference Papiez, Kong, Co-Chair and Timmerman34,Reference Bezjak, Paulus and Gaspar35 A two-tailed Student’s t-test of the mean D2cm, max and R50% indicate no significant difference (p > 0·05) between the AAA and AXB calculation algorithms; however, both algorithms show significantly lower D2cm, max (p < 0·05) in comparison to MC. Osei et al. Reference Osei, Darko and Swanson26 reported D2cm, max of 65·5 ± 9·4% for 3DCRT plans and 60·0 ± 7·2% for VMAT and R50% of 4·7 ± 0·5 for 3DCRT and 4·7 ± 0·7 for VMAT plans. Similarly, Weyh et al. Reference Weyh, Konski, Nalichowski, Maier and Lack31 reported D2cm, max of 75·65 ± 12·7% and 67·34 ± 10·5% for IMRT and VMAT plans, respectively, and R50% values for IMRT and VMAT are 7·1 ± 1·9 and 6·53 ± 1·2. Matsuoka et al. Reference Matsuoka, Araki, Ohno, Sakata and Tominaga38 reported R50 of 5·74 ± 2·14, 4·53 ± 0·74 and 5·08 ± 1·32 for MC, AAA and AXB dose calculation algorithms, respectively.
Evaluation of target dose
The DVH plots for the PTV, ITV and CTV in each treatment plan are used to quantitatively assess the acceptability of each treatment plan by examining the extent to which each plan achieved the target dose coverage indicated in Table 2. The DVH plots (Figures 2–4) and data in Tables 3 and 4 show that acceptable target coverage was achieved for all plans irrespective of the plan normalisation and dose calculation algorithm used.
PTV-V100% = 95% normalisation
The PTV mean global mean dose (Dmean) when plans are normalised to PTV-V100% = 95% is 64 ± 1Gy for all three calculation algorithms. A two-tailed Student’s t-test of the mean Dmean of the PTV indicates no significant difference (p > 0·05) between the dose calculation algorithms. Muñoz-Montplet et al. Reference Muñoz-Montplet, Fuentes-Raspall, Jurado-Bruggeman, Agramunt-Chaler, Onsès-Segarra and Buxó40 investigated the dosimetric effect of switching from AAA to AXB (with dose-to-medium (AXB-Dm) and dose-to-water (AXB-Dw) reporting modes) in 55 lung SBRT patients plans with a prescription of 60Gy in 5 or 8 fractions and PTV-V100% = 95%. They reported Dmean of 65·8 ± 1·9Gy for AAA, 66·4 ± 1·9Gy for AXB-Dm and 66·4 ± 1·9Gy for AXB Dw. Similarly, Li et al. Reference Li, Wang and Tan27 compared IMRT, single arc VMAT (SA-VMAT), partial–arc VMAT (PA-VMAT) and 2 partial arcs VMAT (2PA-VMAT) treatment for 14 lung cancer patients and reported mean PTV Dmean of 63·5 ± 0·06Gy, 66·2 ± 0·06Gy, 65·6 ± 0·06Gy and 65·6 ± 0·06Gy for IMRT, SA-VMAT, PA-VMAT and 2PA-VMAT, respectively. We observed that the AAA algorithm generated plans with mean global PTV minimum dose that are 2% higher than AXB and Liang et al. Reference Liang, Penagaricano and Zheng41 have also reported that AAA overestimates lung PTV minimum doses up to about 8% when compared to AXB. Furthermore, the AAA produced plans with mean ITV minimum dose 5% higher and mean GTV minimum dose 3% higher than both AXB and MC, respectively. Thus, the AAA calculation algorithm consistently overestimates the minimum doses to the PTV, ITV and the GTV for lung treatment plans. This observation agrees with other studies that have reported that AAA algorithm overestimates lung target dose coverage including the minimum doses to PTV, ITV and GTV. Reference Iyengar, Zhang-Velten and Court22,Reference Ong, Ang and Soh37,Reference Matsuoka, Araki, Ohno, Sakata and Tominaga38,Reference Kroon, Hol and Essers42–Reference Zhang, Jiang and Su44 The mean PTV-V60Gy are 92 ± 6%, 95 ± 0·0%, and 94 ± 3% for AAA, AXB and MC, respectively. A two-tailed Student’s t-test of the mean PTV-V60Gy indicates that AAA produced plans with PTV-V60Gy that are significantly (p < 0·05) lower compared to AXB and MC. Webster et al. Reference Webster, Tanny and Joyce45 performed a retrospective analysis of 30 lung patients treated with SBRT to investigate the difference between AAA and AXB calculation algorithms. Plans were prescribed to 40–60Gy, and they reported that AAA produced plans with significantly (p < 0·05) lower V100% up to about 4% compared to AXB.
PTV-V95% = 95% normalisation
The PTV mean global mean dose (Dmean) when plans are normalised to PTV-V95% = 95% is 61 ± 1 Gy for all three calculation algorithms. A two-tailed Student’s t-test of the mean Dmean of the PTV indicates no significant difference (p > 0·05) between AAA and AXB calculation algorithms. Li et al. Reference Li, Wang and Tan27 compared IMRT and VMAT treatment plans prescribed at 60Gy and normalised to PTV-V95% = 95%) in 14 lung cancer patients. They reported PTV Dmean of 65·61 ± 0·06Gy for 2-partial arcs VMAT plans and 66·20 ± 0·06Gy for a single arc VMAT. Similar to plans normalised to PTV-V100% = 95%, we observed that the AAA algorithm generated plans with mean global ITV minimum and GTV minimum doses that are 5·5% and 3·5% higher than AXB and 5·5% and 5·4% higher than MC. Thus, the AAA calculation algorithm consistently overestimates the minimum doses to the ITV and the GTV for lung treatment plans. The mean PTV-V57Gy are 92 ± 6%, 92 ± 6%, and 93 ± 3% for AAA, AXB and MC, respectively. A two-tailed Student’s t-test of the mean PTV-V57Gy indicates no significant difference (p > 0·05) between the three algorithms. Bourbonne et al. Reference Bourbonne, Lucia and Jaouen28 investigated the use of VMAT-based adapted planning in 44 plans to decrease PTV mean dose and to evaluate its impact on the risk of acute pulmonary toxicity. Plans were prescribed to 60–66Gy to the PTV with 95% of the dose covering 95% of the prescription volume (PTV-V95% = 95%), and they reported a mean PTV-V95% of 94·9%. Zhang et al. Reference Zhang, Jiang and Su44 investigated the dosimetric difference between AXB and AAA algorithm in SBRT plan for NSCLC prescribed at 50Gy. They reported V100% of 93·44 ± 2·03% and 95·54 ± 0·47%, Dmin of 40·48 ± 3·27Gy and 43·65 ± 2·31Gy, Dmax of 58·97 ± 2·45Gy and 58·04 ± 2·40Gy, and Dmean of 53·32 ± 1·16Gy and 53·30 ± 1·32Gy for AXB and AAA, respectively, and concluded that for SBRT plan of NSCLC, AAA algorithm overestimate target coverage.
Evaluation of OAR dose
The DVH plots for the OAR including bilateral lung, spinal canal, oesophagus and heart in each treatment plan are used to quantitatively assess the acceptability of each treatment plan by examining the extent to which each plan achieved the OAR dose constraints.
Spinal canal dose analysis
According to ROTG 0617, the spinal canal is one of the primary dose-limiting organs when treating lung cancer, therefore, could influence the target dose coverage and plan quality. Reference Bradley, Paulus and Komaki19,Reference Bradley, Hu and Komaki20,Reference Chun, Hu and Choy46 The dose metrics used to evaluate the dose to the spinal canal include the mean and maximum doses. The mean maximum spinal canal dose when plans are normalised to PTV-V100% = 95% for AAA, AXB and MC are 34 ± 7Gy, 33 ± 7Gy and 34 ± 8Gy respectively. The corresponding values for PTV-V95% = 95% plan normalisation for all three algorithms are 32 ± 7Gy, 32 ± 7Gy, and 32 ± 7Gy. All plans irrespective of the calculation algorithm and plan normalisation met the spinal canal dose constraint criteria of Dmax ≤ 50·5Gy as recommended in RTOG 0617. Reference Bradley, Paulus and Komaki19,Reference Bradley, Hu and Komaki20 Using the PTV-V95% = 95% normalisation for patients can further reduce the dose to the spine. Bourbonne et al. Reference Bourbonne, Lucia and Jaouen28 reported a mean spinal cord Dmax of 34·1Gy for 44 VMAT plans normalised to PTV-V95% = 95%. Zhao et al. Reference Zhao, Yang, Wang, Zhang and Li47 reported mean maximum spinal cord doses of 41·5 ± 10·0, 35·7 ± 10·5 and 35·9 ± 9·0 for IMRT, VMAT and Hybrid IMRT/VMAT plans, respectively, prescribed at 66Gy and normalised to PTV-V100% = 95%. Li et al. Reference Li, Wang and Tan27 reported a maximum spinal cord dose of 40·1 ± 0·04Gy, 43·9 ± 0·04, 43·0 ± 0·04 and 38 ± 0·4Gy for IMRT, single arc VMAT, partial arc VMAT and double partial arcs VMAT plans for treating centrally located lung cancer with 60Gy prescribed as the median dose applied to the PTV. Differences in mean maximum spinal cord doses could be related to differences in tumour location (centrally located and near the spinal cord), dose prescription, plan normalisation and planning technique employed.
Lung dose analysis
According to ROTG 0617 Reference Bradley, Paulus and Komaki19,Reference Bradley, Hu and Komaki20 , the bilateral lung is one of the primary dose-limiting organs when treating lung cancer and thus can influence the target dose coverage and plan quality. Most published data have reported that the lung V20Gy is the best metric for determining the risk of radiation pneumonitis, which can lead to severe respiratory dysfunction or even death. Reference Chen, Wu and Ning48–Reference Inoue, Kunitoh, Sekine, Sumi, Tokuuye and Saijo50 Inoue et al. Reference Inoue, Kunitoh, Sekine, Sumi, Tokuuye and Saijo50 reported that radiation-induced pulmonary pneumonitis is a common complication in patient with lung cancer treated with radiation therapy and has an average incidence rate of 49%. In a more recent study by Chen et al., Reference Chen, Wu and Ning48 they reported an average incident rate of 16–28%. The incidence of radiation pneumonitis is reported to decrease if the lung V20Gy is kept below 37% of the prescribed dose. In this study, the lung V20Gy for all plans irrespective of the plan normalisation and calculation algorithms are all below 22Gy (Tables 5 and 6). The average lung V20Gy when plans are normalised to PTV-V100% = 95% for AAA, AXB, and MC are 20 ± 8%, 20 ± 8% and 21 ± 8%, respectively. The corresponding values when plans are normalised to PTV-V95% = 95% for all three algorithms are 19 ± 7Gy, 19 ± 7Gy and 20 ± 7Gy for AAA, AXB and MC, respectively. Li et al. Reference Li, Wang and Tan27 compare IMRT and various VMAT plans of 14 patients. They reported mean lung V20Gy of 4·6 ± 0·0Gy, 5·8 ± 0·01Gy, 5·5 ± 0·01Gy and 5·5 ± 0·01Gy and V5Gy of 20·9 ± 0·02Gy, 22·7 ± 0·02Gy, 13·6 ± 0·02Gy and 15·7 ± 0·02Gy for IMRT, single arc VMAT, partial arc VMAT and double partial arcs VMAT plans, respectively, for treating centrally located lung cancer with 60 Gy prescribed as the median dose applied to the PTV. Osei et al. Reference Osei, Darko and Swanson26 reported lungs mean V20Gy and V5Gy of 3·4 ± 2% and 13·1 ± 5·3% for patients treated with 48Gy/4 and 5 ± 2·4% and 18·3 ± 8·1% for patients treated with 50Gy/5 using the VMAT technique. Zhao et al. Reference Zhao, Yang, Wang, Zhang and Li47 reported mean lung doses of 14·2 ± 2·2Gy, 15·2 ± 2·6Gy and 14·6 ± 2·3Gy and V20Gy of 25·4 ± 4·9%, 25·2 ± 6·1% and 25·5 ± 5·6% for IMRT, VMAT and Hybrid IMRT/VMAT, respectively, plans at 66Gy and normalised to PTV-V100% = 95%.
Oesophagus dose analysis
Oesophagitis is a common local acute toxicity that can develop in patients who receive radiation therapy to the chest area, and the contributory factors include size of irradiated volume, total dose, dose per fraction, treatment time and delivery technique. Reference Baker and Fairchild51–Reference Nieder, Pawinski and Andratschke53 The dose to the oesophagus was evaluated using the mean and V60Gy (Tables 5 and 6). The average mean dose when plans are normalised to PTV-V100% = 95% are 22 ± 10Gy, 21 ± 10Gy and 23 ± 11Gy for AAA, AXB and MC, respectively, which are below-suggested recommendations of Dmean < 34Gy. Reference Bentzen, Constine and Deasy54,Reference Emami55 These values are further reduced by approximately 1–2% when plans are normalised to PTV-V95% = 95%. Zhao et al. Reference Zhao, Yang, Wang, Zhang and Li47 reported mean oesophagus doses of 22·9 ± 9·9Gy, 23·0 ± 9·6Gy and 22·4 ± 9·7Gy and mean maximum dose of 67·0 ± 5·7Gy, 66·2 ± 6·9Gy and 63·7 ± 7·9Gy for IMRT, VMAT and Hybrid IMRT/VMAT, respectively, plans at 66Gy and normalised to PTV-V100% = 95%. RTOG 0617 Reference Bradley, Paulus and Komaki19,Reference Bradley, Hu and Komaki20 recommend to calculate the volume of oesophagus receiving at least 60Gy (V60Gy) for patients and according to Bentzen et al. Reference Bentzen, Constine and Deasy54 the oesophagus V60Gy should be kept below ∼30% to minimise the risk of oesophagitis. In this study, the mean oesophagus V60Gy for plans normalised to PTV-V100% = 95% are 10 ± 13%, 10 ± 12% and 11 ± 14% for AAA, AXB and MC, respectively. These values are lowered when plans are normalised to PTV-V95% = 95% to 4 ± 6%, 3 ± 5% and 4 ± 6% for AAA, AXB and MC, respectively. Both normalisation methods show that the oesophagus V60Gy values are below the suggested constraint. Reference Bentzen, Constine and Deasy54
Heart dose analysis
The dosimetric metrics used to evaluate the cardiac dose include mean dose and heart V60Gy, V45Gy and V40Gy (Tables 5 and 6). The average mean dose to the heart when plans are normalised to PTV-V100% = 95% are 12 ± 9Gy, 12 ± 9Gy and 13 ± 9Gy for AAA, AXB and MC, respectively. The corresponding values when plans are normalised to PTV-V95% = 95% are 11 ± 8Gy, 11 ± 8Gy and 12 ± 8Gy for AAA, AXB and MC, respectively. All plans regardless of normalisation and dose calculation algorithm show low heart mean doses and met the plan acceptance criteria and published tolerances. Reference Bentzen, Constine and Deasy54,Reference Emami55 Bourbonne et al. Reference Bourbonne, Lucia and Jaouen28 reported an average mean dose to the heart of 10·2Gy for 44 VMAT plans normalised to PTV-V95% = 95%. Zhao et al. Reference Zhao, Yang, Wang, Zhang and Li47 investigated 5-field IMRT, two partial arcs VMAT and Hybrid IMRT/VMAT techniques for the treatment of NSCLC for 15 patients with NSCLC. The prescribed dose to the PTV was 66Gy in 33 fractions and plans were normalised to PTV-V100% = 95%. They reported heart mean dose of 8·5 ± 8·8Gy, 7·4 ± 7·1Gy and 7·8 ± 7·8Gy and V60Gy of 1·1 ± 2·0%, 0·9 ± 1·6% and 0·8 ± 1·5% for IMRT, VMAT and Hybrid IMRT/VMAT, respectively. It is important to note that heart dose is largely dependent on the prescription, location of the tumour (i.e., left lung) and mediastinal lymph nodes involvement. The risk of long-term cardiac failure is correlated with the mean and maximum dose to the heart Reference Ming, Feng, Liu, Zhang, Zhou and Deng56 , thus it is essential to limit heart doses to the minimum to avoid or control cardiac toxicity.
In this retrospective study, we have established an institutional criteria for non-SBRT volume-based lung treatment plans acceptability based on our current experiences and resources. The study showed that predefined dose–volume constraints and objectives for VMAT technique for NSCLC can be achieved, resulting in improved dose optimisation and coverage of target volume, reduction in OARs volume receiving high doses and therefore with the potential to reduce the rate of toxicity, decrease pain and improve the quality of life for lung cancer patients. Thus, the objectives developed in this study can be adopted by institutions to ensure consistency among different individuals with regard to what is considered an acceptable treatment plan in terms of target coverage and doses to the OAR. Whereby any plan fulfilling the criteria is considered acceptable, whereas any plan not fulfilling all the criteria may be considered unacceptable. The use of such criteria may potentially lessens the stress on dosimetrists, as they can present treatment plans to radiation oncologists, which are less likely to be rejected and therefore could potentially improve confidence in dosimetrists, reduce variation in treatment plans acceptability and improve workflow and patient care.
Conclusion
The use of VMAT is an efficient and reliable radiation therapy technique for achieving greater target dose conformity, heterogeneity and dose fall-off from the PTV for NSCLC treatment with minimal doses to the OARs. Based on the mean values of our current data, using AXB algorithm and plans normalisation of PTV V100%=95%, it is possible to develop NSCLC treatment plans that aim to achieve PTV dose coverage of V60Gy and V57Gy to at least 95% and 99% of the PTV volume respectively and V60Gy to at least 100% of the ITV. The criteria for the lung should aim to achieve V20Gy of 20% and V5Gy of 50%, for spinal canal mean dose of 16Gy and maximum dose of 33Gy, for oesophagus mean dose of 21Gy and V60Gy of 10Gy and for heart mean dose of 12Gy, V60Gy of 2%, V45Gy of 6% and V40Gy of 7%. Occasionally, plan normalisation of PTV-V95% = 95% may be required to ensure that the OAR dose tolerances are further reduced. Thus, it is possible to aim to achieve PTV dose coverage of V57Gy and V54Gy to at least 95% and 99% of the PTV volume, respectively, and V57Gy to at least 100% of the ITV using AXB and normalised to PTV V95% = 95% with further reduction of dose to the OARs. However, using AAA algorithm for dose calculation could consistently overestimate the minimum dose to the target. The clinical implementation of this technique for NSCLC cancer patients can be achieved with minimal or no imposition on resources and time constraints.
Acknowledgements
The author Amani Shaaer would like to acknowledge with gratitude the support received from all the Medical Physicists, Electronic Technologists, Medical Physics Associate, Radiation Therapists and Radiation Oncologists in the Radiation Oncology Program at the Grand River Regional Cancer Centre during the time of her residency programme at the Medical Physics Department.
Financial Support
The author Amani Shaaer would like to acknowledge the King Faisal Specialist Hospital and Research Centre (KFSH&RC) for funding her residency program.
Conflicts of Interest Statements
The authors declare that the research was conducted in the absence of any commercial or financial relationships that could be construed as a potential conflict of interest.


