Subsistence farming households in developing countries are among those most vulnerable to food insecurity. Because food production is presumably a key determinant of their food security, these households face two major challenges. First, given the seasonal nature of agricultural production(Reference Sibhatu and Qaim1, Reference Tibesigwa, Visser and Copllinson2), food insecurity may be exacerbated by increasingly unpredictable weather patterns and increased frequency of floods and droughts that disrupt agriculture(Reference Tibesigwa, Visser and Copllinson2–Reference Patterson, Berrang-Ford and Lwasa6). In particular, rain-fed, subsistence farming systems are especially vulnerable to these consequences of climate change(Reference Wheeler and von Braun7). Second, access to land, seeds and the tools needed to prepare, plant and harvest crops can be a limitation. Interventions that provide improved seeds and agricultural tools and that train farmers in water and soil conservation and pest reduction can improve agricultural production(Reference Karki, Sah and Thapa8), but few studies have considered whether such interventions reduce the experience of food insecurity(Reference Gaihre, Kyle and Semple9). Additionally, it is unclear whether the choice to grow specific crops or a greater diversity of crops or livestock improves food security in subsistence farming households.
In addition to home production of food, income has also been shown to be positively associated with food security in rural, farming households(Reference Naja, Hwalla and Fossian10), often resulting from the sale of livestock and/or vegetables produced by the household(Reference De Cock, D’Haese and Vink11–Reference D’Haese, Vink and Nkunzimana14). This is particularly true during lean seasons(Reference Sibhatu and Qaim1). Cash shortages are known to impact food insecurity(Reference Tibesigwa, Visser and Copllinson2–Reference de Janvry and Sadoulet5) and even limited cash can buffer subsistence farming families against crop failures due to bad weather(Reference Baiphethi and Jacobs15, Reference Shrestha and Nepal16). Furthermore, maintaining some food production capacity can buffer households during the transition from subsistence agriculture into paid labour(Reference Ghattas, Barbour and Nord17). Moreover, the link between food insecurity and poverty holds true even in contexts where income is irregular and therefore a weak measure of actual household cash flow(Reference Knueppel, Demment and Kaiser18, Reference Tsai, Bangsberg and Emenyonu19). In such situations, durable asset-based household wealth indices (HWI) are a more appropriate economic indicator(Reference Filmer and Pritchett20–Reference Balen, McManus and Li24) and have been inversely related to food insecurity in rural pastoralists(Reference Knueppel, Demment and Kaiser18) and subsistence farming families(Reference Tsai, Bangsberg and Emenyonu19).
Food insecurity in both urban and rural settings generally falls along a continuum from mild experiences such as worrying about running out of food, to more severe experiences such as limiting servings and meals, to the most severe experiences of adults and children going without food for days(Reference Swindale and Bilinsky25, Reference Radimer, Olson and Greene26). Usually, the questions on experience-based food security questionnaires refer to ‘lack of cash’ and only recently has the broader phrase ‘lack of food or resources’ been used(Reference Rossi, Ferre and Curutchel27). To our knowledge, factors that constrain agricultural production have not been explicitly considered in previous food security questionnaires even though they may be particularly relevant in subsistence farming settings where households rely almost entirely on home-grown foods.
The government of Panama has recognized that food insecurity is a concern in subsistence farming communities and is attempting to understand the modifiable factors that might be contributing to this situation(28). Of particular interest has been constraints on agricultural production due to droughts and floods, and availability of seeds and tools. Panama has developed a food security questionnaire specifically for subsistence farming communities that is based on a Venezuelan questionnaire that used Likert-type scaled responses permitting more nuanced responses to items rather than an unqualified ‘yes’ or ‘no’(Reference Lorenzana and Mercado29, Reference Lorenzana and Sanjur30). The Panama Food Security Questionnaire (FSQ) includes two items directly related to subsistence agricultural production: (i) lacking food because the household does not have enough water, land, seeds or other things needed to grow crops; and (ii) lacking food because of floods, droughts or other similar situations.
The objectives of our study were to determine if constraints on agricultural production were a novel construct in the Panama FSQ and to characterize agricultural and economic determinants of food insecurity during the planting, growing and harvesting time periods in subsistence farming communities.
Methodology
Study site
The study was conducted in fifteen rural communities that, at the time of the study, were participating in VERASAN (Proyecto para el Mejoramiento del Consumo y la Disponibilidad de Alimentos en Comunidades de la Provincia de Veraguas), a multisectoral food security and agricultural intervention coordinated by the Panama Ministry of Health. Communities were accessible only by four-wheel drive vehicle along unpaved roads and were 45 min to 2 h from Santiago, the provincial capital of Veraguas. All households practised subsistence agriculture using manual labour on rain-fed plots (approximately 0·9 ha) that were a 30 min to 2 h walk from the home and that were not connected to a regular market. Common crops were rice, maize, cassava, plantains, a variety of local tubers and vegetables including cucumbers, tomatoes, squash and peppers. Often land is cleared using slash-and-burn methods. Staples and the bulk of other crops are typically planted in March–April and some minor vegetable crops may be planted later in the year. Harvesting of staple crops occurs in September–October, prior to the heaviest rainfall in late October–early December.
Study design
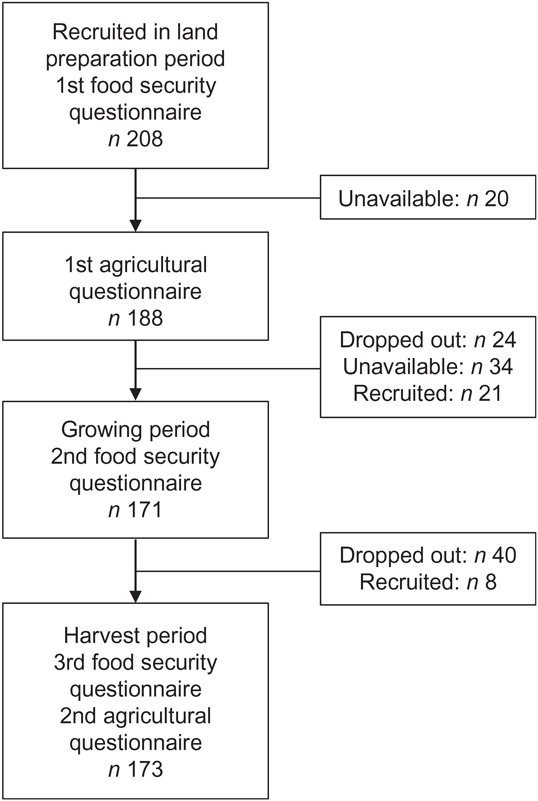
The longitudinal observational study of households with at least one pre-school child was conducted between February and October 2012 during three agricultural periods: (i) land preparation prior to planting (February–March); (ii) the growing period for staple crops and the majority of other crops (June–July); and (iii) the harvest months for staple crops (September–October). A total of 237 households were selected using convenience sampling (Fig. 1). Trained nutrition students from a local university administered questionnaires to the primary caregiver. The questionnaire addressed household demographics and household assets at the beginning of the study, agricultural production including types and quantities of crops and livestock and income during the growing and the harvest months, and food security during all three agricultural periods. Responses recorded on paper questionnaires were entered electronically and verified. Agricultural extension workers and nutritionists from the Panama Ministry of Health who already had a relationship with community members held informational visits with communities prior to the study.
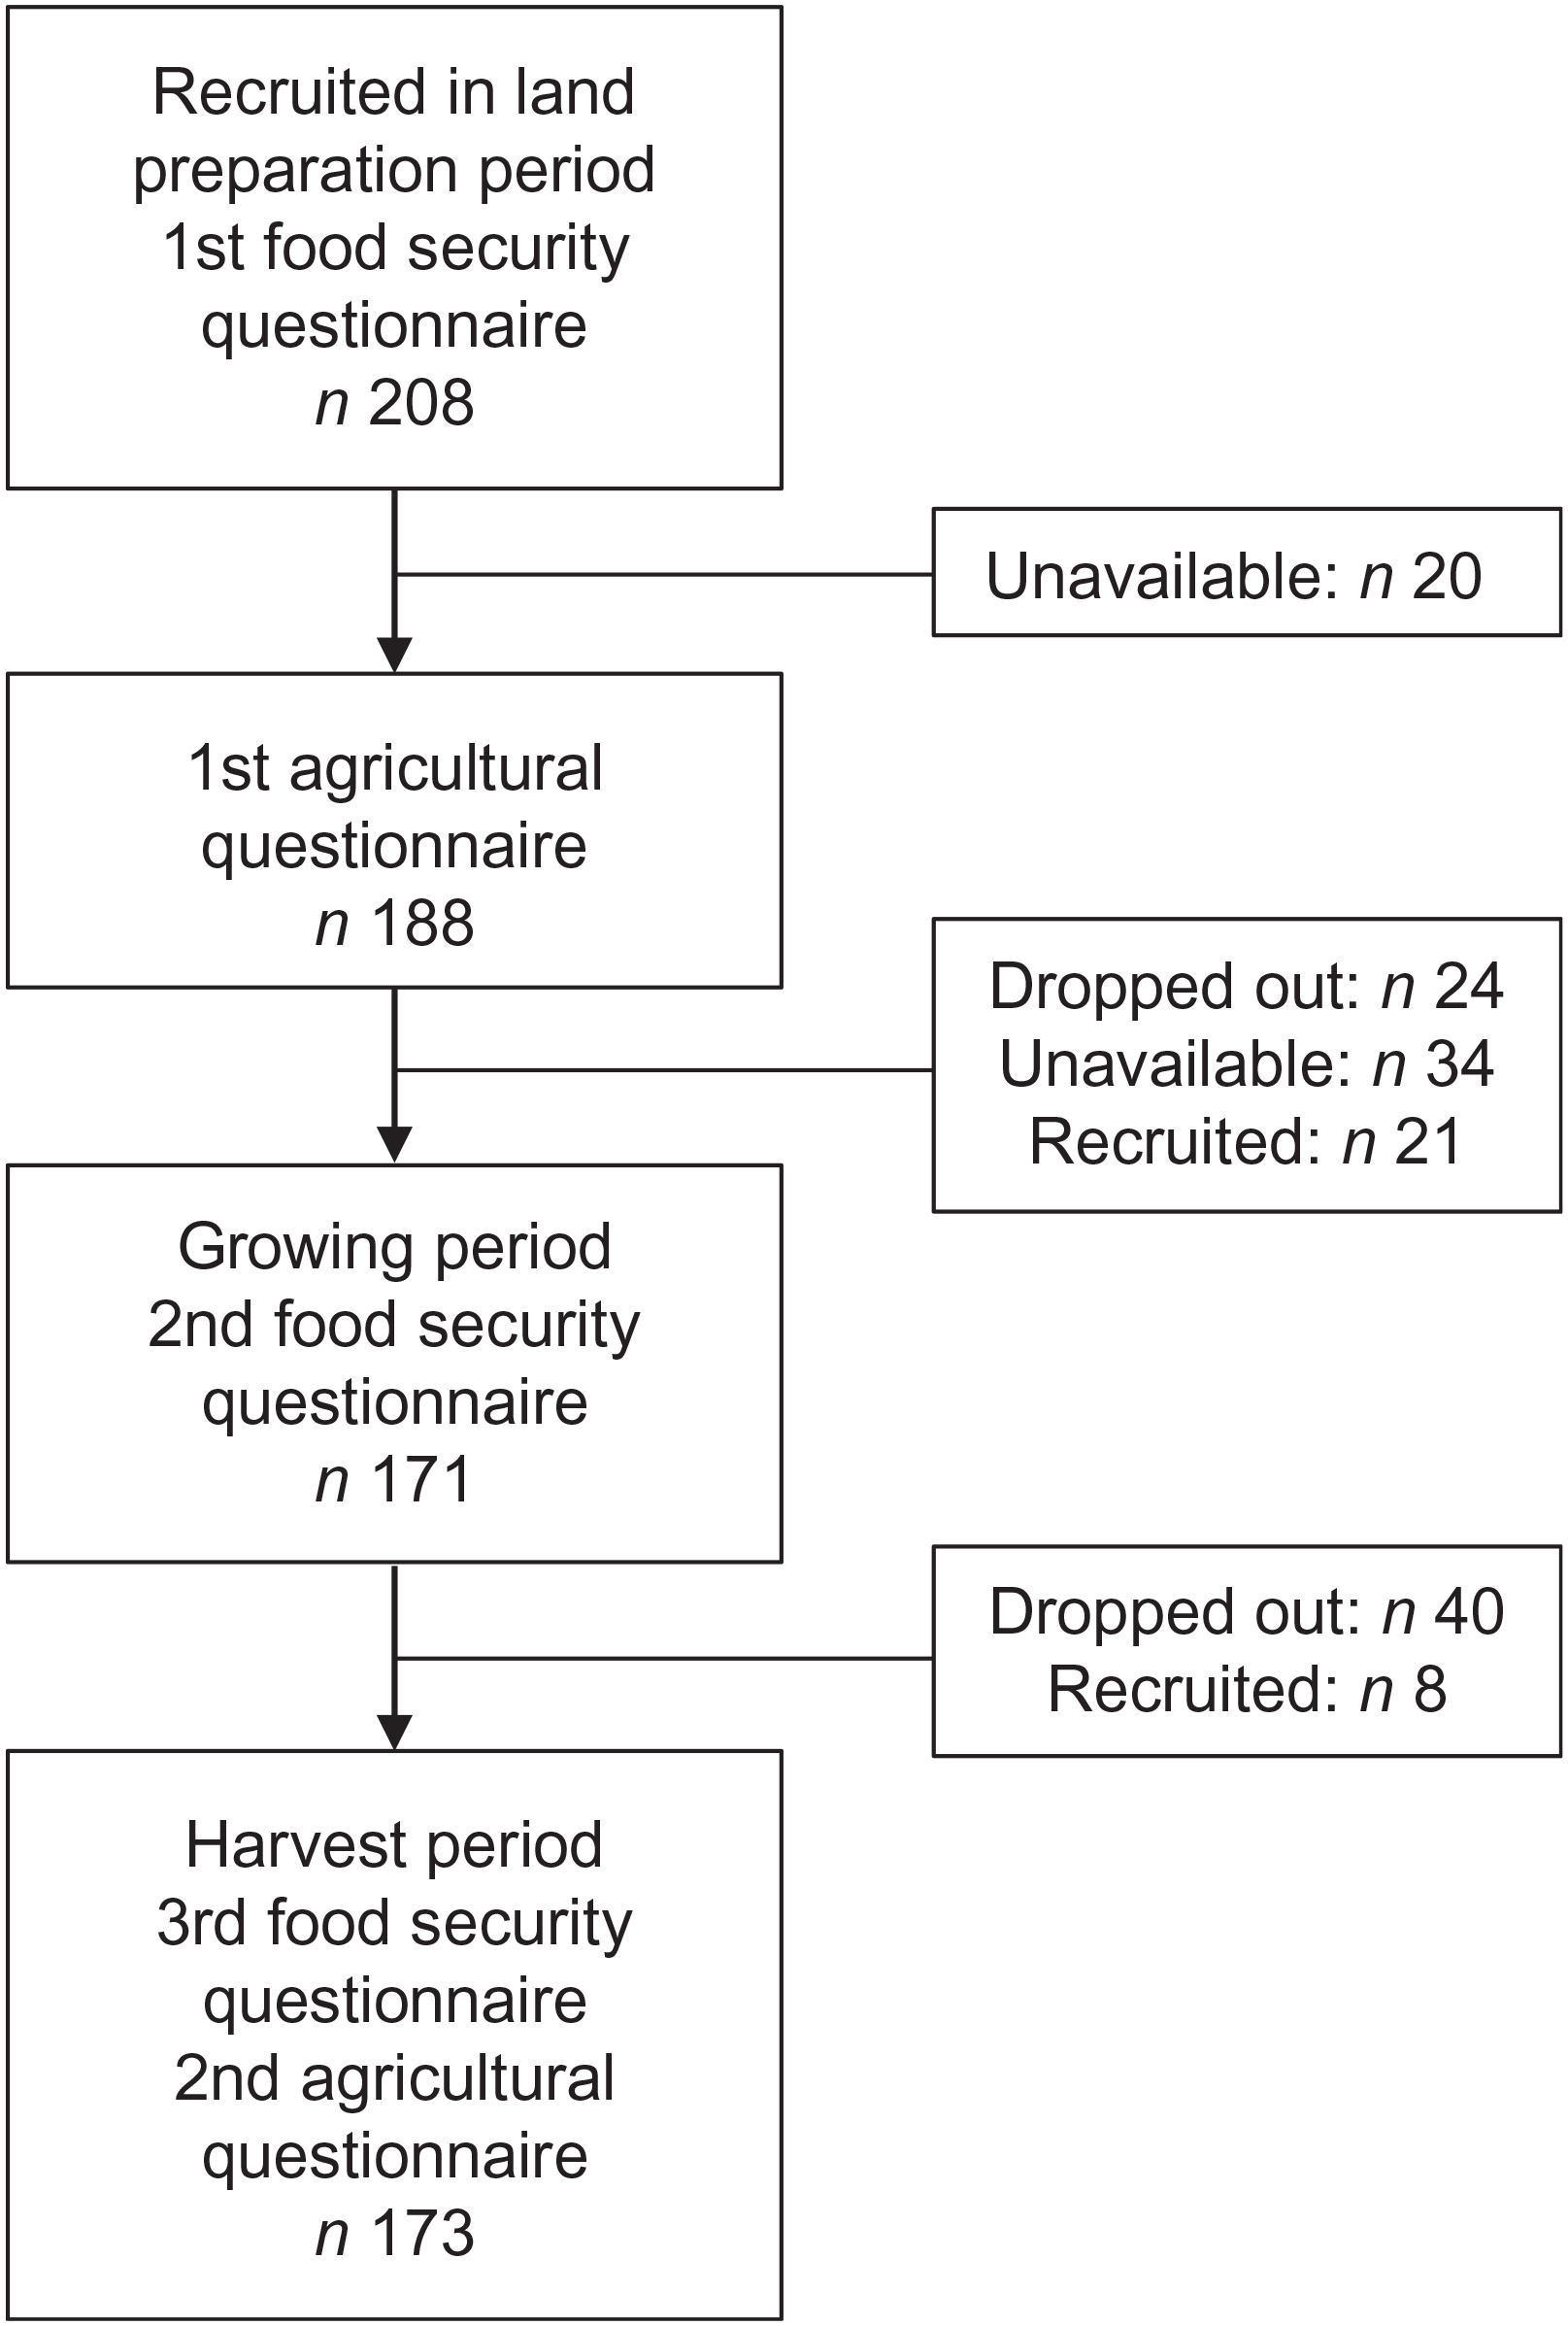
Fig. 1 Sample size for the food security questionnaires and agriculture questionnaires during land preparation, growing and harvest study periods, showing recruitment, unavailable and dropout rates
Population characteristics
Number of people living in the household and age and sex of the respondent were recorded. A history of agricultural production was obtained from questionnaires for crops that had been planted and harvested in 2011 and planted in 2012. Questionnaires on agricultural production were based on those used previously by agriculture extension workers from the Panama Ministry of Health working in these communities. Diversity of household agricultural production was measured as the total number of crops as well as the number of crops within each of three food categories: (i) grains and starches: rice, maize, cassava, plantain, yam, pale-flesh sweet potato, Xanthosoma spp., taro; (ii) legumes: black beans, Chiricano beans, pinto beans, pigeon peas, peanuts; (iii) vegetables: broad beans, carrots, celery, chives, cucumber, onions, pumpkin, sweet peppers, tomatoes, cilantro, ginger, hierbabuena. In addition, quantities planted and harvested were recorded for a subset of staple crops: rice, maize, cassava, plantain, beans and pigeon peas, in units relevant to the crops and familiar to respondents (e.g. lbs of seeds planted; number of bunches or 50 lb bags harvested). The number of pigs, chickens, ducks, turkeys, pigeons, goats and cattle that had been kept or bred for food was recorded for 2011 and 2012.
Three variables were used to assess economic status: selling produce, income and HWI. Participants were asked whether they sold agricultural produce (beans, maize, pigeon peas, pumpkin, rice, sweet peppers, sugarcane, tomatoes, chicken, eggs) and how much income was earned by the household from all activities in the preceding 30 d. These data were collected during the growing and harvest periods but not during land preparation when interviewers were still building rapport with participants. Household income was reported as per capita per month and did not include money received through government programmes. Asset-based household wealth was assessed using principal components analysis(Reference Filmer and Pritchett20, Reference Vyas and Kumaranayake21) based on ownership of durable assets, sanitation infrastructure, home construction materials, materials and infrastructure for cooking and lighting the home, and ownership of cattle and horses. The twelve variables that captured the most variability in principal component 1 were used to calculate HWI for each household. Households were divided into the lowest 40 %, middle 40 % and highest 20 % HWI(Reference Filmer and Pritchett20) for descriptive purposes, and HWI was also used as a continuous variable in multiple regression models.
Panama Food Security Questionnaire
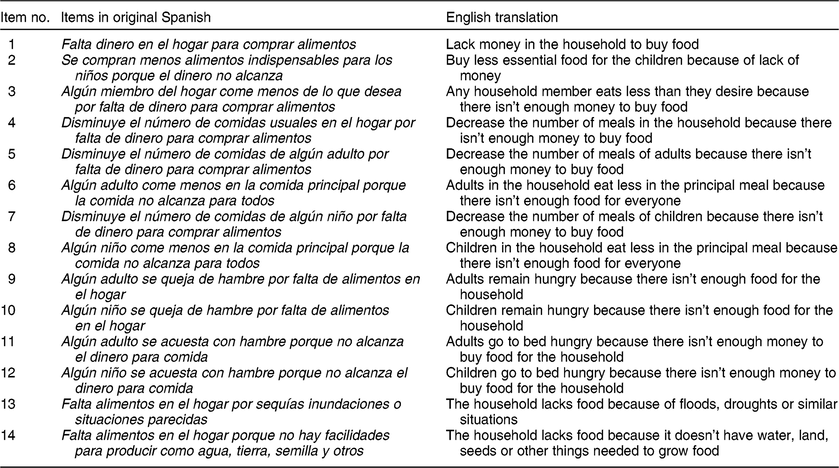
The Panama FSQ used for two decades prior to the present study contained fourteen items (Table 1). The first twelve items explored subjective experiences of food insecurity due to lack of money, and the last two were novel questions about whether access to enough food was disrupted by weather events such as floods and droughts (item 13) and lack of seeds, land, water or agricultural tools (item 14). Respondents described the frequency with which they experienced each item over the previous three months using a Likert scale: ‘never’ (0), ‘sometimes’ (1), ‘almost always’ (2) or ‘always’ (3). Reported scores for all items were summed to obtain a food insecurity score (FIS), ranging from 0 (‘never’ answered for all items) to 42 (‘always’ answered for all items). Four recognized FIS categories(28) were used to describe levels of food security in the population: ‘food secure’ (FIS = 0); ‘mildly insecure’ (FIS = 1–14); ‘moderately insecure’ (FIS = 15–28); and ‘severely insecure’ (FIS = 29–42).
Table 1 The Panama experience-based Food Security Questionnaire, original Spanish with English translation. Participants were asked to consider the previous three months
Data analysis
All statistical analyses were conducted using the statistical software package SAS version 9.3. Statistical analyses were considered significant at P < 0 05(Reference Greenland, Senn and Rothman31) unless otherwise indicated. Data are reported as means with se or as percentages. FIS was compared among agricultural periods using non-parametric one-way ANOVA because FIS was highly skewed.
Internal consistency of items in the FSQ was assessed by calculating a Cronbach’s coefficient α for each agricultural period; high internal consistency was indicated when α > 0·8(Reference Filmer and Pritchett20). Construct validity was assessed using exploratory factor analysis (EFA) that identified common latent factors representing types of experiences, or ‘constructs’(Reference Fabrigar and Wegener32). For each period, EFA models were examined to determine whether items were best divided into three, four or five latent factors based on communalities indicating how much variance for each item was explained by the combined common latent factors in the model. Communalities were considered very good (≥0·70), moderately good (0·40–0·69) or poor (<0·40)(Reference Fabrigar and Wegener32). A poor communality indicated that the item did not load well on to any of the identified latent factors, either because it was dissimilar to the other items in the FSQ or because of ambiguous wording or misinterpretation by respondents(Reference Fabrigar and Wegener32). Communalities for the four-factor EFA model were moderately good (0·40–0·69) to very good (≥0·70) for all three time periods (see online supplementary material, Supplemental Fig. S1), indicating that the items in the questionnaire were related to one another and measured common latent factors. The three-factor and five-factor models had significant weaknesses (Supplemental Fig. S1). Therefore the four-factor EFA models were used.
To determine which of the four latent factors best fit each item in each agricultural period, rotated factor loading coefficients (RFLC) of individual items were calculated for each latent factor for each period and the highest RFLC indicated the best fit for each item in each period (see online supplementary material, Supplemental Table S1). For each latent factor, a construct was assigned based on the wording of the items that generally grouped together(Reference Fabrigar and Wegener32) and these constructs were compared with those discussed in the literature.
Tabulation of the FIS (ranging from 0 to 42) resulted in count data for each score that was best fit by a negative binomial distribution. Therefore, negative binomial multiple regression analyses were used to build explanatory models for the FIS for each agricultural period. We initially considered household size, age and sex of respondent, HWI and per capita income during the previous month (except for land preparation, for which income was not available), whether or not the household sold produce, and agricultural production variables. These initial analyses were designed to (i) remove variables that were clearly unrelated to the FIS, (ii) not risk removing variables whose direct association with FIS was weak but that might be emerge as important when combined with other variables and (iii) ensure that the number of variables included in the final models did not exceed the limit based on our sample size(Reference Tabachnick and Fidell33). Initial exploration revealed that P < 0·30 for the preliminary screening achieved all three of our objectives. Variables were retained in the final models if P < 0·15 and those that entered with P < 0·05 were considered significant. Absence of collinearity among variables in each final model was based on a variance inflation factor < 10 and a tolerance > 0·10(Reference Tabachnick and Fidell33).
Results
Population characteristics
Respondents’ mean age was 33·1 (se 0·4) years and 90·6 % were female. Households had 6·3 (se 0·1) people, typically living in one- or two-room homes. Households in the present study reported growing about ten of the forty crops that are known to be grown locally. They grew the same number of crops in 2011 and 2012, and approximately the same amounts were planted in each year (Table 2). Grains and starches were most common, followed by vegetables and legumes. Among the staple crops, rice was planted by all households, and the volume of rice harvested was higher than that of maize (Table 2). Lower quantities of beans, cassava, plantain and pigeon peas were planted and harvested. Chickens were kept by almost all households, whereas approximately 20 % kept pigs and pigeons, and less than 10 % kept ducks, turkeys, goats or cattle (Table 2).
Table 2 Crop production and livestock data for the subsistence farming households from fifteen rural villages in Panama, 2011 (n 188) and 2012 (n 170)*
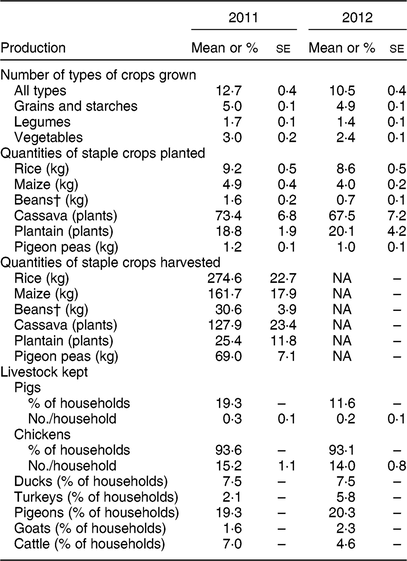
NA, data not available.
* Sample size is lower than total number of households interviewed during the harvest because three household participants did not have enough information to reliably answer questions about quantities harvested in 2012.
† Black, Chiricano and pinto beans.
Three measures of economic status were recorded: selling produce, monthly income and HWI. Regarding selling produce, 10·3 % of households reported selling small quantities of maize, beans, tomatoes, and occasionally selling rice, pigeon peas, sweet peppers, pumpkin and sugarcane, as well chickens or eggs in 2012. Monthly per capita income ($US 4·63 (se 0·51)) came from remittances from family members in urban centres and casual seasonal labour in the sugarcane industry. Income was higher during the harvest ($US 6·17 (se 0·79)) than the growing period ($US 2·79 (se 0·32); P = 0·0087). HWI was calculated based on the following assets: cellular telephone, shovel, hoe, axe, pickaxe, stove, horse, water piped to the house, latrine, adobe walls, concrete and dirt floors (see online supplementary material, Supplemental Table S2). Less than 10 % of households in the lowest HWI group owned a hoe, a stove or a horse, and most had homes with adobe walls and dirt floors. In contrast, ≥90 % of households in the highest HWI category owned a cellular telephone, shovel and axe, and 100 % had a pit latrine (Supplemental Table S2). Income was lower in households in the lowest HWI category than the highest HWI category (P < 0·0171; Supplemental Table S2).
Food insecurity during land preparation, growing and harvest months
Responses to individual items did not differ among agricultural periods (Fig. 2). At least 80 % of households reported lacking money to buy food (item 1) and buying less essential foods for children (item 2) at least sometimes. Fewer than 50 % of households reported that adults and children had experienced eating less than desired, fewer meals, or less food in the principal meal due to lack of money (items 3–8; Fig. 2). The most rarely experienced items were adults and children remaining hungry or going to bed hungry because of lack of money (items 9–12). Approximately 33 % of households experienced lack of food because of floods or droughts (item 13) or because of lack of resources to grow food (item 14) at least sometimes. Furthermore, the high values of the standardized Cronbach’s α for land preparation (0·939), growing (0·912) and harvest periods (0·894) showed that items had high reliability and that the FSQ was measuring the same overarching construct (‘food insecurity’) in all agricultural periods.
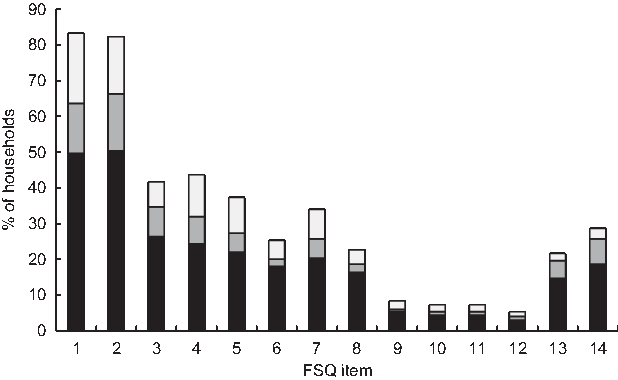
Fig. 2 Frequency of responses ‘sometimes’ (![]() ), ‘almost always’ (
), ‘almost always’ (![]() ) and ‘always’ (
) and ‘always’ (![]() ) to items in the Panama Food Security Questionnaire (FSQ), averaged for the three sampling periods (land preparation, growing and harvest) among subsistence farming households (n 237) from fifteen rural villages in Panama, 2011 and 2012
) to items in the Panama Food Security Questionnaire (FSQ), averaged for the three sampling periods (land preparation, growing and harvest) among subsistence farming households (n 237) from fifteen rural villages in Panama, 2011 and 2012
Household FIS extended over the full range of values (0–42) in each agricultural period. Furthermore, the frequency of moderate to severe food insecurity was similar among periods (11·9, 12·3 and 8·7 %, respectively; Fig. 3) and the mean FIS was also similar among periods (7·9 (se 0·6) during land preparation, 7·2 (se 0·5) during growing months and 6·6 (se 0·5) during harvest; χ 2 = 2·342, P = 0·31).
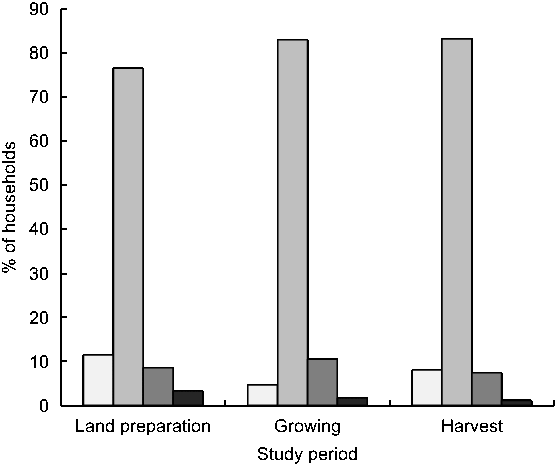
Fig. 3 Frequency distribution of the food insecurity score (FIS) by category (![]() , food secure (FIS = 0);
, food secure (FIS = 0); ![]() , mildly insecure (FIS = 1–14);
, mildly insecure (FIS = 1–14); ![]() , moderately insecure (FIS = 15–28);
, moderately insecure (FIS = 15–28); ![]() , severely insecure (FIS = 29–42)) during land preparation, growing and harvest study periods among subsistence farming households (n 237) from fifteen rural villages in Panama, 2011 and 2012
, severely insecure (FIS = 29–42)) during land preparation, growing and harvest study periods among subsistence farming households (n 237) from fifteen rural villages in Panama, 2011 and 2012
Constructs of the Panama Food Security Questionnaire during land preparation, growing and harvest months
Among the four factors identified by the EFA, three were common to FSQ in general. Factor 1 (‘ability to buy food’) included two items that grouped together in all time periods with RFLC > 0·75: item 1 (‘lack money to buy food’) and item 2 (‘buy less essential food for the children’; see online supplementary material, Supplemental Table S1). Factor 2 (‘decreasing the number of meals’) included three items that consistently grouped together and also had RFLC > 0·75: item 4 (‘decrease number of meals overall’), item 5 (‘decrease number of meals for adults’) and item 7 (‘decrease number of meals for children’; Supplemental Table S1). Factor 3 (‘feeling hungry’) included four items that grouped together with RFLC all >0·86 during growing and harvest months: items 9 (‘adults remain hungry’), 10 (‘children remain hungry’), 11 (‘adults go to bed hungry’) and 12 (‘children go to bed hungry’). However, during land preparation, RFLC of these items were higher for factor 4 (all >0·66) than for factor 3 (all <0·35; Supplemental Table S1). Both items 3 (‘eat less than desired’) and 6 (‘adults eat less in principal meal’) had low RFLC for all factors in all time periods.
The fourth factor from the EFA was novel and related to constraints on agricultural production. Factor 4 (‘lower agricultural production because of extreme weather or constraints on agricultural production’) included the two novel items in the Panama FSQ: item 13 (‘lacking food because of floods and droughts’) and item 14 (‘lacking resources to grow food’). They grouped together and RFLC were >0·77, except for a moderate RFLC for item 14 (‘lacking resources to grow food’) during the growing months (see online supplementary material, Supplemental Table S1).
Agricultural and economic determinants of the food insecurity score during land preparation, growing and harvest months
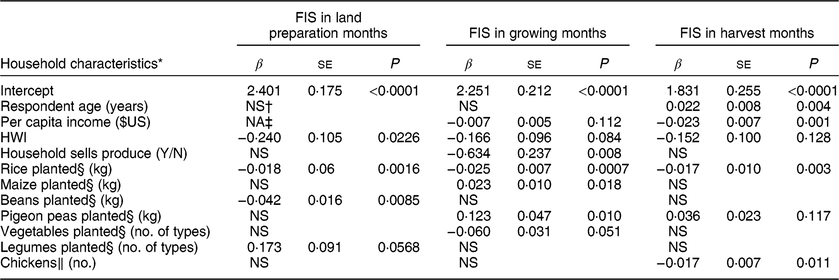
Multiple regression models showed that agricultural and economic variables were associated with FIS in all periods but that the specific variables differed (Table 3). During land preparation, higher HWI and planting more rice and beans (black, Chiricano and pinto beans combined) in the previous year were associated with lower FIS, whereas planting a greater diversity of legumes had a borderline positive association with FIS (P = 0·057). During the growing months, planting less rice but more maize and pigeon peas in the previous year and not selling produce were associated with higher FIS; planting a greater diversity of vegetables was associated with a lower FIS (P = 0·051). During harvest, older respondent age, planting less rice and having fewer chickens in the current year were associated with higher FIS.
Table 3 Negative binomial multiple regression models of 2012 food insecurity score (FIS) during land preparation (n 163), growing (n 119) and harvest (n 168) months, including demographic, recent income, household wealth index (HWI), sale of produce, agricultural production and domestic animals kept for food, among subsistence farming households from fifteen rural villages in Panama
* Variables that did not enter any of the models: respondent sex, quantity of cassava and plantain planted, number of types of crops planted and number of animals (pigs, cattle, goats, turkeys, ducks and pigeons).
† NS, P > 0·15.
‡ Not available because income was not measured during land preparation.
§ Models for FIS during 2012 land preparation and growing months used planting values from 2011; model for FIS during the harvest used planting values from 2012.
‖ Model for FIS during 2012 land preparation used livestock values from 2011; models for FIS during growing and harvest months used livestock values from 2012.
Discussion
By exploring agricultural and economic determinants of food security in remote subsistence farming communities that were unconnected to commercial markets, our study provided several new insights. First, in addition to the common constructs associated with food insecurity (‘ability to buy food’, ‘decreasing food or meals’, ‘being hungry’)(Reference Rossi, Ferre and Curutchel27), a novel construct, ‘constraints on agricultural production’, emerged. This construct included the influence of lack of tools and seeds as well as weather-related conditions such as droughts and floods on the experience of food insecurity. Second, during land preparation but not the growing or harvest period, FSQ items asking about hunger aligned with ‘constraints on agricultural production’ rather than ‘being hungry’, suggesting that concern about hunger early in the agricultural cycle was linked to worry about crop success. Third, households that raised more chickens and planted more rice and beans were more food secure. However, not all crops were associated with improved food security, as households that planted more maize and pigeon peas were less food secure in the growing period. Fourth, the impact of economic variables on food security varied among agricultural periods, with HWI emerging during land preparation, selling small amounts of produce emerging during the growing months and income emerging during the harvest. Thus, we showed that different crops and livestock and different wealth indices contribute to food security at different times during the agricultural cycle.
Our observations of the association of specific crops with food security raised several intriguing points. First, the quantities of rice and beans planted were positively associated with food security. This is consistent with the literature highlighting that food-secure households are able to access nutritionally rich foods(Reference Ghattas, Barbour and Nord17, Reference Gelli, Aberman and Margolies34, Reference Pei, Appannah and Sulaiman35). Planting more rice was associated with greater food security in all the agricultural periods, whereas planting black beans, Chiricano beans and pinto beans was associated with greater food security only during land preparation. In contrast, households that had planted more maize and pigeon peas in the previous year were less food secure during the subsequent growing period. Maize and pigeon peas grow more quickly, require less land and can be grown on more marginal land. Therefore, the choice to plant maize and pigeon peas instead of rice and beans may indicate greater vulnerability to food insecurity because of lack of land or labour available for subsistence agriculture. On the other hand, choice of crops planted may also contribute to long-term food security, based on the ability of households to dry and store some crops for later consumption but not others. Rice is an important staple crop that forms the basis of the daily diet in these communities, and both rice and beans are regularly dried and stored for later consumption, whereas pigeon peas and maize are commonly eaten fresh and are not dried and stored for later consumption in this region, unlike in other parts of Latin America and parts of South Asia and Africa(36–Reference Vales, Ranga Rao and Sudini38). Households may withstand the lean months more successfully and be less food insecure if they are able to prioritize staple crops that can be stored, such as rice and beans, over crops harvested for immediate consumption, such as pigeon peas and maize. This also suggests an opportunity to introduce newer approaches for post-harvest storage and preparation of dried maize and pigeon peas(36–Reference Thamaga-Chitja, Hendriks and Ortmann39). Pigeon peas, in particular, are also known nitrogen fixers and as such can contribute to the maintenance of soil fertility(Reference Njira, Semu and Mrema40), which provides further incentive for uncovering ways for households to gain better food security from this crop. These and other factors may play a role in further success of agricultural interventions for food security in this region and warrant further investigation.
Crop diversity has been clearly linked to dietary diversity(Reference Olney, Talukder and Iannotti41–Reference Ruel and Alderman45) but the reported link to food security is weak(Reference Ghattas, Barbour and Nord17). Our results also provide weak evidence that crop diversity is associated with food security. Planting a greater diversity of vegetables had a borderline positive association with food security, consistent with the concept that a more diverse diet improves food security(Reference Ghattas, Barbour and Nord17). However, planting a greater diversity of legumes had a borderline negative association with food security, perhaps because the measure of legume diversity captures both beans, which are associated with greater food security, and pigeon peas, which were associated with food insecurity. As described above, this may indicate a direct, negative effect of growing pigeon peas on household food security, or alternatively it may indicate a lack of resources for subsistence agriculture that has effects on both food security and choice of crops to plant.
In addition, the number of chickens raised was positively associated with food security but only during the harvest. It is not clear why having more chickens emerged only during the harvest, as chickens would have provided an ongoing source of protein throughout the year. Perhaps sale of eggs and meat to other households increased during the harvest when more disposable cash was available, and this indirectly improved the food security of households that owned chickens. The importance of animal-source foods, in this case chickens, supports general understanding that keeping livestock is very relevant for attaining food security(Reference Ghattas, Barbour and Nord17, Reference Dumas, Lungu and Mulambya46).
Our results confirmed the well-established association of food security with economic status, as measured by income(Reference Sibhatu and Qaim1–Reference de Janvry and Sadoulet5) or by variables that are more relevant in subsistence agriculture settings removed from commercial markets, including the HWI(Reference Naja, Hwalla and Fossian10, Reference Knueppel, Demment and Kaiser18, Reference Tsai, Bangsberg and Emenyonu19, Reference Saaka and Osman47) and sale of crops(Reference De Cock, D’Haese and Vink11–Reference D’Haese, Vink and Nkunzimana14). However, we uncovered intriguing differences in relevant economic variables through the agricultural cycle. During land preparation, households with higher HWI were less food insecure, as shovels, hoes, axes, pickaxes and horses, assets more common among the moderate or high HWI households, would have been needed for clearing and preparing the land. During the growing months, selling of crops emerged as the only economic indicator of better food security. At this time, much of the food stored from the previous harvest would have been depleted(Reference Patterson, Berrang-Ford and Lwasa6) but early-maturing crops such as vegetables could be sold. This is consistent with our observation that the growing period was the only time when diversity of vegetables had a positive impact on food security. During the harvest, income emerged as the only economic variable associated with better food security. Among vulnerable subsistence farmers who purchase some of their staple foods, even small amounts of cash have been shown to improve food security(Reference de Janvry and Sadoulet5). This is consistent with the finding that indigenous subsistence farmers in Uganda harvested immature crops in an effort to obtain small amounts of cash(Reference Patterson, Berrang-Ford and Lwasa6) and that growing vegetables contributed to food security of Bedouin subsistence farmers(Reference Ghattas, Barbour and Nord17). Even though income had doubled compared with the growing period, less than 10 % of households were food secure during the harvest and the proportions of mild and moderate/severe food-insecure households remained unchanged, reinforcing that even a doubling of income still resulted in very modest per capita income not sufficient to improve households’ food security. This is consistent with the suggestion that extra cash available during this period may have been spent on non-food items rather than food(Reference Patterson, Berrang-Ford and Lwasa6).
In subsistence farming communities in particular, inclement weather and lack of agricultural resources such as seeds, land and tools are important barriers that limit food production(Reference Patterson, Berrang-Ford and Lwasa6). Furthermore, the risk of floods and droughts and other extreme weather events resulting from climate change has been shown to be higher in areas already experiencing food insecurity(Reference Wheeler and von Braun7), and may contribute to food insecurity. The Panama FSQ explicitly incorporated two novel items that addressed exposure to ‘extreme weather conditions such as floods or droughts’ (item 13) and ‘access to water, land, seeds and other resources’ (item 14). EFA revealed that these two items grouped into a novel construct ‘constraints on agricultural production’ in all three agricultural seasons. Interestingly, concern about floods and drought was consistently high throughout the agricultural cycle, but the communality of tools (item 14) was somewhat weaker during the growing season when tools may not have been as critical for the farmers. The communality of item 14 may have been strengthened if the item also referred to other household resources required to successfully produce food, including labour, which is necessary for tending fields during the growing season. Of note, the construct ‘constraints on agricultural production’ also incorporated aspects of reducing food per meal, as the two items that considered whether the amount of food per meal had been reduced (items 6 and 8) were more relevant to factor 4 than factors 1–3 during growing months. Stevens et al.(Reference Stevens, Watt and Brimbecombe48) also reported that women ate small meals or a more limited variety of foods during seasons of food shortage, which likely occurred in our population during the growing months. Our data indicate that respondents link this behavioural adjustment to constraints on agricultural production during the growing season. This strengthens our conclusion that it is important to appreciate the full range of constraints on food production in order to understand the experience of food insecurity in remote subsistence farming contexts.
In the case of subsistence farmers unconnected with commercial markets, communalities of most items in the Panama FSQ were high in all agricultural periods indicating that the items themselves were not inherently seasonal. However, our data do suggest real differences in how these households think about hunger over the agricultural cycle. First, items that asked whether adults or children remain hungry after meals or go to bed hungry (items 9–12) aligned, as expected, with the construct ‘feeling hungry’ during the growing and harvest periods. However, they aligned with our novel construct ‘constraints on agricultural production’ during land preparation. Given that the wording of items 9–12 is standard on many validated food security questionnaires, it is unlikely that respondents misunderstood these questions. Instead, we suggest that this shift in alignment with constructs may reflect heightened concern for future food availability resulting from difficulties in preparing the land for planting. This also suggests that the timing of ongoing monitoring of food security in these types of contexts should be consistent from year to year.
Despite its novel findings, the present study had several limitations. First, as we collected data over a single agricultural cycle, we cannot infer annual patterns. Second, the three-month recall periods did not fully align with activities within the agricultural cycle, a challenge faced in other studies on food security in subsistence farming settings(Reference Patterson, Berrang-Ford and Lwasa6). We were constrained in our choice of data collection periods by ongoing extension activities in the communities. Nevertheless, determinants of FIS differed by agricultural period. Third, we were unable to obtain data on the harvest from the year of the study because, at the time of administering the questionnaire, not all households had finished harvesting. Therefore, we relied on recall of harvest data from the previous year. Fourth, the interpretation of our findings might have been improved if we had explicitly asked about crop storage. Fifth, data on income were not collected during land preparation, at the advice of local colleagues who recommended that rapport be built before asking these sensitive questions. Sixth, funds received through government programmes were excluded from income because dispersal of funds did not consistently align with the timing of our surveys. Finally, we recognize that our findings cannot be extrapolated to other agricultural settings without appropriate validation.
Conclusion
In conclusion, the present study provides further evidence that agricultural and economic determinants of food insecurity in subsistence farming communities shift during the agricultural cycle and highlights the complex relationship between choice of which crops to plant and food security in a subsistence setting such as this. Furthermore, incorporation of non-cash constraints on agricultural production into food security questionnaires provides insights into the dynamics of local food security that are relevant for public policies and programmes designed to reduce food insecurity in subsistence farming settings. Finally, our results suggest that new storage technologies for harvested crops could play a key role in food security in subsistence farming settings, opening opportunities for further agricultural development in marginalized settings.
Acknowledgements
Acknowledgements: The authors are grateful to the staff of the VERASAN programme, particularly Dalys de Abrego, Dimas Ulloa and Elvia Murgas, and participating families of VERASAN for making this research possible. Financial support: This work was funded by the International Development Research Centre (R.J.K., grant number 106204-99906075-039) and the Natural Sciences and Engineering Research Council of Canada (R.J.K., grant number PGSD3-392828-2010). These funders had no role in the design, analysis or writing of this article. This work was also supported by in-kind support from the Panama Ministry of Health through arrangement by O.S. Conflict of interest: None. Authorship: R.J.K. designed the research, with contributions from M.E.S., O.S. and K.G.K. R.J.K. conducted the data collection with logistical support from O.S. O.S. provided the Panama Food Security Questionnaire and relevant background information on it. R.J.K. performed the statistical analysis, with contributions from M.E.S. and K.G.K. R.J.K. wrote the paper, with contributions from M.E.S., O.S. and K.G.K. All authors read and approved the final manuscript. Ethics of human subject participation: This study was conducted according to the guidelines laid down in the Declaration of Helsinki and all procedures involving human subjects were approved by the Internal Review Board, Faculty of Medicine, McGill University and the National Research Bioethics Committee, Gorgas Commemorative Institute for the Study of Health in Panama. Written informed consent was obtained from all subjects.
Supplementary material
To view supplementary material for this article, please visit https://doi.org/10.1017/S1368980019001186


