Introduction
Belgica antarctica (Diptera: Chironomidae) is the only endemic insect occurring on the Antarctic Peninsula and, with Parochlus steinenii (Diptera: Chironomidae) on the adjacent South Shetland Islands, native to this region (Usher & Edwards Reference Usher and Edwards1984, Richard et al. Reference Richard, Convey and Block1994, Convey & Block Reference Convey and Block1996, Chown & Convey Reference Chown and Convey2016, Kozeretska et al. Reference Kozeretska, Serga, Kovalenko, Gorobchyshyn and Convey2022). It has stimulated considerable research interest across disciplines: from genomics and phylogeography to biochemistry, physiology and ecology (Kozeretska et al. Reference Kozeretska, Serga, Kovalenko, Gorobchyshyn and Convey2022). Of particular interest are its possible responses to climate change, as has been occurring in the Antarctic Peninsula region in recent decades (Turner et al. Reference Turner, Barrand, Bracegirdle, Convey, Hodgson and Jarvis2014, Convey & Peck Reference Convey and Peck2019, Bargagli Reference Bargagli2020). However, to date, few studies of either B. antarctica or Antarctic microarthropods more generally have directly addressed climate change (Devlin et al. Reference Devlin, Unfried, Lecheta, McCabe, Gantz and Kawarasaki2022, Matheson & McGaughran Reference Matheson and McGaughran2023). Belgica antarctica's karyotype was briefly described 60 years ago on the basis of the salivary gland chromosomes (Martin Reference Martin1962). The diploid set of chromosomes is 2n = 6 (Martin Reference Martin1962, Atchley & Davis Reference Atchley and Davis1979, Michailova et al. Reference Michailova, Ilkova, Kovalenko, Dzhulai and Kozeretska2021). However, to date, a cytological map of the polytene chromosomes of this species has not been compiled. Belgica antarctica has one of the smallest insect genomes yet sequenced, although other members of the Chironomidae (including the subfamily Orthocladiinae to which B. antarctica belongs) also have small genomes, and the number of functional genes is comparable to that in other Diptera species (Kelley et al. Reference Kelley, Peyton, Fiston-Lavier, Teets, Yee and Johnston2014, Cornette et al. Reference Cornette, Gusev, Nakahara, Shimura, Kikawada and Okuda2015, Kaiser et al. Reference Kaiser, Poehn, Szkiba, Preussner, Sedlazeck and Zrim2016).
Chromosomal indels are common in many species of insects representing multiple different groups, including Diptera, Orthoptera, Coleoptera, Hemiptera, Lepidoptera and Dermaptera (Da Cunha Reference Da Cunha1960, John & Lewis Reference John and Lewis1966, Hoffmann et al. Reference Hoffmann, Sgrò and Weeks2004). They can contribute > 20 Mb of the genome in some insect species (e.g. 22 Mb in Anopheles gambiae; White et al. Reference White, Hahn, Pombi, Cassone, Lobo, Simard and Besansky2007). It is known that chromosomal inversions often occur as balance polymorphisms and potentially can play an important role in speciation (Noor et al. Reference Noor, Grams, Bertucci and Reiland2001, Fuller et al. Reference Fuller, Leonard, Young, Schaeffer and Phadnis2018, Wellenreuther & Bernatchez Reference Wellenreuther and Bernatchez2018). However, it remains unknown which factors evoke changes in the frequencies of chromosomal inversions in natural populations (Kirkpatrick Reference Kirkpatrick2010). Inversions are thought to perform adaptive functions by suppressing recombination in the heterozygous state, when heterozygous individuals have an advantage in stabilizing selection (Wellenreuther & Bernatchez Reference Wellenreuther and Bernatchez2018). Pool-seq technology, which has recently been used to study the genomes of many species, allows the study of inversion events but cannot be used to obtain inversion frequencies in species whose genomes have not been sufficiently studied (Kapun et al. Reference Kapun, van Schalkwyk, McAllister, Flatt and Schlötterer2014). In such cases, cytological studies of polytene chromosomes provide a useful tool. Although the B. antarctica genome has been sequenced (Kelley et al. Reference Kelley, Peyton, Fiston-Lavier, Teets, Yee and Johnston2014), a set of diagnostic indel markers has yet to be determined (Michailova et al. Reference Michailova, Ilkova, Kovalenko, Dzhulai and Kozeretska2021).
Martin (Reference Martin1962) described the presence of inversions in two of the three chromosomes of B. antarctica: an inversion in chromosome III and a large inversion in chromosome I. Atchley & Davis (Reference Atchley and Davis1979) described five inversions: one large heterozygous inversion in chromosome I, apparently the same as that described by Martin (Reference Martin1962), two further inversions in chromosome II (annotated as inversions A and B), one inversion in chromosome III (a small inversion, inversion C) and also one further inversion in chromosome III was sex-linked (D) and was always heterozygous in males. In the most recent research (Michailova et al. Reference Michailova, Ilkova, Kovalenko, Dzhulai and Kozeretska2021), the presence of inversions A and B in chromosome II was confirmed, as well as that of the small inversion near the telomere in chromosome III. However, the inversion reported in chromosome I and the sex-linked inversion in chromosome III were not detected. Michailova et al. (Reference Michailova, Ilkova, Kovalenko, Dzhulai and Kozeretska2021) also first noted the presence of a dark band in chromosomes in a few cells. However, they only examined а small sample of B. antarctica individuals from a single location. To provide greater understanding of chromosomal variability in B. antarctica, material from a wider proportion of the range of the species needs to be examined, and, to enable such research, a chromosome map of the species is required allowing precise locating of chromosome abnormalities from all sampling locations. Comparative analyses of the presence and frequencies of chromosomal indels from different locations can also then be performed.
In this study, we provide the first standard polytene chromosome map for B. antarctica. In addition, we analysed chromosomal variability in sample material collected from two separate locations on Galindez Island (Argentine Islands, western coast of the Antarctic Peninsula). We also performed a comparative chromosomal analysis of material obtained from these two locations and, using statistical analyses, identified differences in the occurrence of common chromosomal abnormalities of the populations present at these sampling locations and others reported by Martin (Reference Martin1962), Atchley & Davis (Reference Atchley and Davis1979) and Michailova et al. (Reference Michailova, Ilkova, Kovalenko, Dzhulai and Kozeretska2021).
Material and methods
Study sites
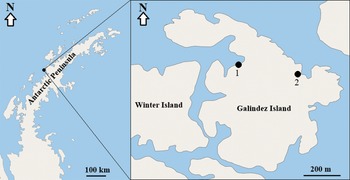
Samples were obtained during the 26th Ukrainian Antarctic expedition 2021–2022. Belgica antarctica fourth-instar larvae were collected from moss cushions from two separate locations on Galindez Island, Argentine Islands, western coast of the Antarctic Peninsula (Fig. 1 & Table I) and immediately fixed in ethanol acetic acid (3:1) for cytogenetic analysis. The fixative was changed several times between February and May 2022.

Fig. 1. Map indicating the sampling locations (1 and 2) for Belgica antarctica larvae on Galindez Island (Argentine Islands) used in this study.
Table I. Description of sampling locations on Galindez Island (Argentine Islands, western coast of the Antarctic Peninsula) used in this study.

Cytogenetic analyses
The polytene chromosomes of B. antarctica were studied in the fourth-instar larvae. To develop the chromosome map, we used living larval collections returned from the Antarctic (contained and transported within their native substrate in moist sterile boxes at a temperature +4°C) in order to obtain well-spread polytene chromosomes. Chromosome preparations were performed as described by Michailova (Reference Michailova1989). To localize the centromeric region, we used the ‘C’ banding method (Michailova Reference Michailova1994). Preparations are archived at the Institute of Biodiversity and Ecosystem Research, Bulgarian Academy of Sciences and at the National Antarctic Scientific Center of Ukraine.
For the preparation of the standard chromosome map, each chromosome is divided into sections, indicated by numbers, with the chromosomes numbered one (I), two (II) and three (III). The notation used for inversions follows Atchley & Davis (Reference Atchley and Davis1979). We used the standard chromosome map for the accurate location of different puffs, as well as those of somatic and inherited aberrations. It is necessary to underline the number of cells in every salivary gland. There are two round salivary glands in the studied species, and after fixation specific for cytogenetic analysis of the larva, the cells are located peripherally. Their number in each gland is ~16. We considered an inversion to be inherited when it affected all cells of both salivary glands of the same individual, although we did not have the opportunity to confirm inheritance through generations. Somatic structural aberrations are typically located in only a few cells of the salivary glands (Sella et al. Reference Sella, Bovero, Ginepro, Michailova, Petrova and Robotti2004). Their locations and those of inherited aberrations were established by detailed comparative analysis against the standard chromosome map of the species.
Statistical analyses
Percentages of different inherited and somatic aberrations in the salivary gland cells in larvae from each sampling location were calculated. A somatic index (S) was calculated for each location as the ratio of the number of different somatic aberrations relative to the number of individuals sampled from that location. The inherited index (H) was calculated as the ratio between the number of individuals with inherited aberrations at each location and the number of individuals sampled from that location (Sella et al. Reference Sella, Bovero, Ginepro, Michailova, Petrova and Robotti2004).
The frequencies of common hereditary aberrations in the polytene chromosomes of larvae sampled from both locations as well as those from our previous study (Michailova et al. Reference Michailova, Ilkova, Kovalenko, Dzhulai and Kozeretska2021) were compared using Fisher's exact test (Fisher Reference Fisher1922). The frequencies of inherited aberrations recorded in previous studies (Martin Reference Martin1962, Atchley & Davis Reference Atchley and Davis1979, Michailova et al. Reference Michailova, Ilkova, Kovalenko, Dzhulai and Kozeretska2021) were compared using the Kruskal-Wallis test (Kruskal & Wallis Reference Kruskal and Wallis1952). Confidence intervals were calculated using the Clopper-Pearson exact method (at a confidence level of 0.95; Clopper & Pearson Reference Clopper and Pearson1934).
Results
The numbers of larvae analysed from each location and the indices calculated are given in Table II.
Table II. The number of individual Belgica antarctica larvae studied and indices calculated.

Chromosome map of B. antarctica and functional activity along its polytene chromosomes
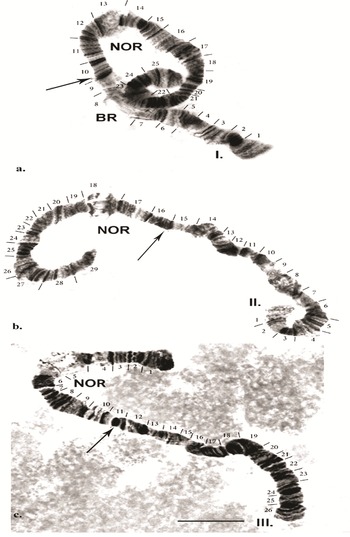
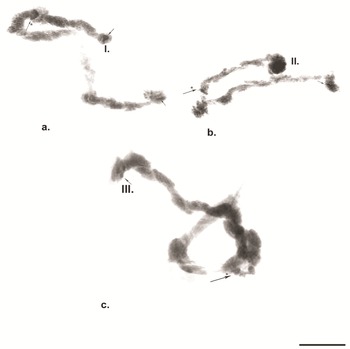
In living larval material of B. antarctica, the salivary polytene chromosomes show a good band-like structure. However, in fixed material, the bands of each chromosome are often of different compactness and can become fused, complicating analysis of the chromosomes. In addition, chromosomes in salivary glands with varying degrees of polytene can be seen in the same individual. By applying the ‘C’ banding method, the precise location of the centromeric regions of the chromosomes can be determined. The centromeric region is a dark band where structural heterochromatin is localized. Polytene chromosomes, after the specific processing characteristic of the ‘C’ banding method, lose their typical disc-shaped structure. Despite that, the bands are light and can be used for chromosome identification. Only certain regions of the chromosome that contain the structural heterochromatin remain darkly stained (these are the centromeres and telomere regions). This method reveals structural heterochromatin containing satellite DNA, most often located in the centromeric regions of the chromosome. The resulting original chromosome map of B. antarctica is shown in Fig. 2a–c.

Fig. 2. Chromosome map of the polytene chromosomes of Belgica antarctica: a. chromosome I; b. chromosome II; c. chromosome III. Scale bar = 10 μm. BR = Balbiani ring; NOR = nuclear organizer region.
Chromosome I (Fig. 2a). The chromosome is submetacentric - the centromere is localized between sections 9 and 10 (Fig. 3a). The first chromosome is provisionally divided into 25 sections. Atchley & Davis (Reference Atchley and Davis1979) designated the arm near the Balbiani ring (BR) as the left arm (L) and that on the opposite side as the right arm (R). In Chironomus tentans, the BR contains genes encoding 75 rRNA (Kirov et al. Reference Kirov, Wurtz and Daneholt1991). It is a matrix for the synthesis of the high-molecular-weight proteins of the salivary gland, and they are used to build ‘houses’ for the larvae, where the development of the larvae takes place. In section 2, three fused pairs of dark discs are often present. Using ‘C’ differential staining in zone 1, a strong heterochromatin disc is always detected. From section 3 to section 7, alternating pairs of dark and light discs are apparent. The BR is located in section 8 and is a very well-expressed marker of this chromosome.

Fig. 3. 'C’ banding in polytene chromosomes of Belgica antarctica. a. ‘C’ banding of chromosome I; b. ‘C’ banding of chromosome II; c. ‘C’ banding of chromosome III. Scale bar = 10 μm. Large arrows with asterisks indicate centromere regions, small arrows indicate telomere heterochromatin.
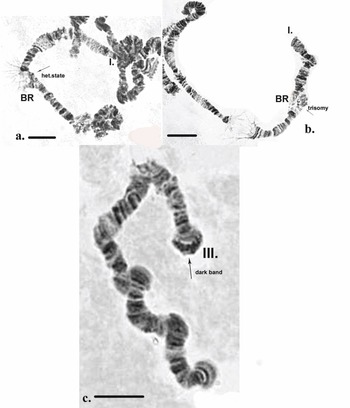
It is notable that in some cells in certain individuals the BR was in a heterozygous state or in trisomy (Fig. 4a,b). The dark disc located between sections 9 and 10 represents the centromere region and is a very well-defined section with ‘C’ banding staining. As diagnostic features of this chromosome, the dark bands of the centromere region, those in section 10 and the two lighter discs located between them were used. The bands next to the nuclear organizer region (NOR), located in section 13, were not always well-expressed. The NOR is a functionally active sector of the chromosome with genes responsible for the synthesis of 18s and 28s RNA (Gunderina et al. Reference Gunderina, Golygina and Broshkov2015). It is a giant puff that functions through all stages of larval development, and material of transcriptional activity is visible around it (using phase-contrast microscopy). However, the NOR is surrounded by two dark bands, providing a good chromosome marker. In some cases, the NOR was expressed in sections 16, 17 or 18. The group of dark bands in sections 14, 17 and 18 is diagnostic for this chromosome. The embroidery-like pattern of discs between zones 15 and 18 is also a chromosome marker, as are the group of dark bands in sections 21, 22 and 24. The chromosome terminates with a few bands, before which an active zone is often observed. It is notable that, using ‘С’ differential staining, these bands appear as separate dots, with a well-defined dark disc in front of them (Fig. 3a–c).

Fig. 4. Polytene chromosomes of Belgica antarctica with functional chromosome alterations and structure aberrations. a. Chromosome I: Balbiani ring (BR) in a heterozygous state; b. chromosome I: BR with a trisomy; c. chromosome III: dark band at telomere. Scale bar = 10 μm.
Chromosome II (Fig. 2b). The second chromosome is metacentric, with the centromere located in sections 15–16 (Fig. 3b), and it is provisionally divided into 29 sections. The chromosome begins with a slight expansion, and the telomere part of the chromosome contains well-expressed heterochromatin (Fig. 3b), which is well revealed by ‘C’ banding. Atchley & Davis (Reference Atchley and Davis1979) referred to this part of the chromosome as the left arm (L) and the opposite part as the right arm (R). There is a narrowing in section 3, in which three pairs of dark bands are located. A faint extension is apparent in section 4, being diagnostic for the chromosome. The dense dark discs delimiting each of sections 7, 8, 10, 11, 12, 13, 14, 15, 16 and 17 provide good diagnostic markers for this chromosome. The NOR, located in section 18, is also a chromosome marker, along with dark bands in sections 20, 23, 26 and 27. Section 28 has a weak extension and is bounded by dark discs. The telomere part of the chromosome is often weakly active. It is notable that, using ‘С’ differential staining, these bands appear as separate dots, with a well-defined dark disc in front of them (Fig. 3a–c).
Chromosome III (Fig. 2c). The third chromosome is submetacentric, with the centromere region included in a heterozygous inversion in section 11 (Fig. 3c). The chromosome is divided into 26 sections. A characteristic feature of the chromosome is that the NOR is not far from the telomere, in section 5, forming part of the left arm (L) of this chromosome, and the opposite part is the right arm (R; Atchley & Davis Reference Atchley and Davis1979). A large dark band was frequently present in the telomere of this chromosome, expressed by a telomere dark disc. In section 6, delimiting the NOR, a group of dark discs was present, providing a marker for this chromosome. Following this, a series of solid dark bands was present up to section 8. The centromere is located in section 11, which is clearly shown by ‘С’ differential staining (Fig. 3c). Discs between the centromere region and section 19 were not always well defined. Sections 21, 22, 23, 24 and 26 contained well-defined dark discs, providing markers for this chromosome. Using ‘C’ differential staining, several dark spots were detected in the telomere of this chromosome (Fig. 3c).
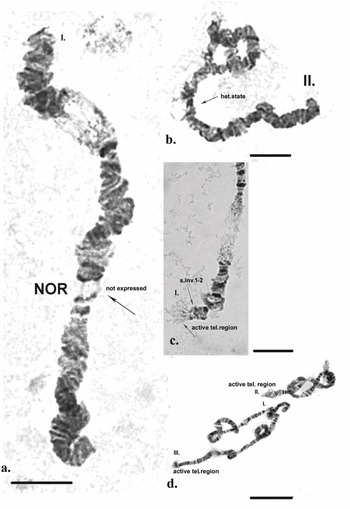
A telomere dark disc (Fig. 4c) was observed on all chromosomes of individuals from the different sampling locations, in some cases in a heterozygous state. Different expressions of the NORs of the polytene chromosomes were often observed in different cells, both in the same and different individuals (Fig. 5a). In some cells, the NOR occurred in a heterozygous state (Fig. 5b); in a heterozygous state, one homologue is active, expressed by the formation of a puff and reflecting transcriptional activity, and the other homologue is with the corresponding discs.

Fig. 5. Polytene chromosomes of Belgica antarctica with functional chromosome alterations and structure aberrations. a. Chromosome I: nuclear organizer region (NOR) is not expressed; b. chromosome II: NOR in a heterozygous state, heterozygous inversion A; c. chromosome I: an active telomere region, a somatic inversion 1–2; d. chromosomes II and III: an active telomere region. Scale bar = 10 μm.
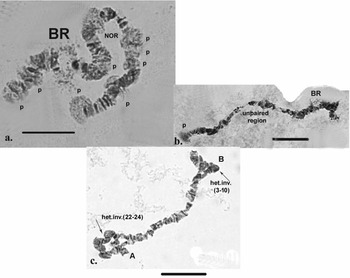
High functional activity characterized the specimens analysed, as indicated by the presence of numerous puffs along the length of the chromosomes, as well as at their telomeres (Figs 5c,d & 6a). Functional variability in the telomeres of the chromosome (appearance of puffs) can be observed in species living in conditions to which they are not well-adapted (e.g. polluted areas).

Fig. 6. Polytene chromosomes of Belgica antarctica with functional chromosome alterations and structure aberrations. a. Many puffs (p) along chromosome I; b. puff in section 25 of chromosome I, unpaired region; c. heterozygous inversions in chromosome II: A (sections 22–28) + B (sections 3–10). Scale bar = 10 μm. BR = Balbiani ring; NOR = nuclear organizer region.
The telomere activity of all chromosomes from specimens from each of the sampling locations was notable. The telomere heterochromatin often changed from clearly visible heterochromatin bands with a granular structure to very active regions with the formation of puffs (Figs 5c,d & 6a,b). In some cases, individual bands were missing or appeared as a large dark band (Fig. 4c).
Chromosome aberrations in B. antarctica
The markers characteristic of each chromosome, combined with the standard chromosome map, allowed different aberrations along the polytene chromosomes to be identified and comparisons made between these aberrations from the different sampling locations. Two types of aberrations were present in the cytogenetically examined samples: hereditary and somatic.
Inherited aberrations from both sampling locations
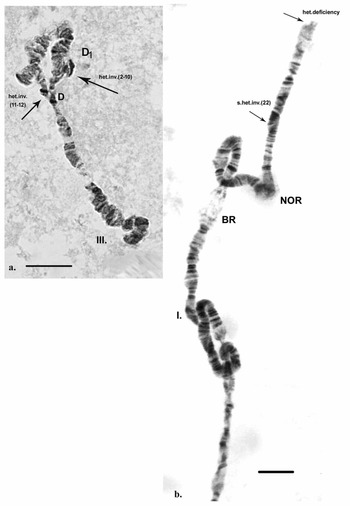
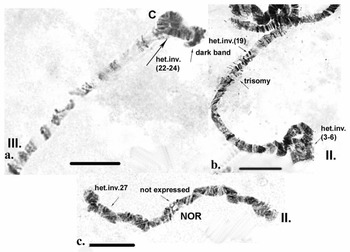
Inherited aberrations were represented by paracentric heterozygous inversions distributed in the second and third chromosomes with varying frequencies (Table III). An inversion is a structural chromosomal aberration in which a chromosomal segment is rotated 180°. It is paracentric when it occurs in one arm of the chromosome only. In the heterozygous state, this inversion covers only one homologue, and to preserve the conjugation of the chromosomes a loop is formed, which is observed when this type of aberration occurs. In samples from location 1, the heterozygous inversions A and B in the second chromosome were present in separate specimens, whereas in sampling location 2, the inversions in the second chromosome were found in both the same and separate individuals (Fig. 6c). There was a significant difference in the frequency of inversion A (inv. A and A + B; Table III) between the two sampled locations (Fisher's exact test, P = 0.036), but not of inversion B (inv. B and A + B; Table III; Fisher's exact test, P = 0.201; Table S1). A heterozygous inversion (D1) and a sex-linked inversion (D) in the third chromosome were detected in samples from both locations (Fig. 7a & Table III). We also observed a heterozygous deficiency in chromosome I (Fig. 7b). Inversion D1 occurred at significantly different frequencies at the two sampling locations (Fisher's exact test, P = 0.0099). The small inversion (C) in the third chromosome (Fig. 8a) was found only in sampling location 2 (Table III). There was no significant difference in the frequencies of sex-linked inversion D (Fisher's exact test, P = 0.3536).
Table III. Inherited aberrations and their chromosomal locations in Belgica antarctica larvae from the studied locations.


Fig. 7. Polytene chromosomes of Belgica antarctica showing structural aberrations. a. Heterozygous inversion in chromosome III: D1 (sections 2–10), sex-linked inversion D (11–12); b. chromosome I: somatic heterozygous deficiency, somatic heterozygous inversion (section 22). Scale bar = 10 μm. BR = Balbiani ring; NOR = nuclear organizer region.

Fig. 8. Polytene chromosomes of Belgica antarctica showing structural aberrations and functional chromosome alterations. a. Chromosome III: heterozygous inversion C (22–24); b. chromosome II: somatic trisomy, somatic heterozygous inversion (sections 3–6), somatic heterozygous inversion (section 19); c. chromosome II: nuclear organizer region (NOR) is not expressed, somatic heterozygous inversion (section 27). Scale bar = 10 μm.
Comparison of the frequency of common inversions found in the current study with previous studies
We did not identify a significant difference in the general patterns of frequencies of inversions A, B and C between the data obtained in our study and those of Atchley & Davis (Reference Atchley and Davis1979) and Michailova et al. (Reference Michailova, Ilkova, Kovalenko, Dzhulai and Kozeretska2021; Kruskal-Wallis test, P = 0.062 for inversion A, P = 0.127 for inversion B, P = 0.185 for inversion C; Table S2).
The frequencies of heterozygous inversion A in the current study and those reported by Michailova et al. (Reference Michailova, Ilkova, Kovalenko, Dzhulai and Kozeretska2021) were significantly different for sampling location 1 (Fisher's exact test, P = 0.028) but not for sampling location 2 (Fisher's exact test, P = 0.451). The same result was obtained for heterozygous inversion B in chromosome II: the frequency differed significantly only for sampling location 1 (Fisher's exact test, P = 0.028; Table III & Table S1).
No significant difference was observed in the frequency of the large dark band in the telomere of the third chromosome in samples from location 2 compared with that reported by Michailova et al. (Reference Michailova, Ilkova, Kovalenko, Dzhulai and Kozeretska2021; Fisher's exact test, P = 0.1011), while a significant difference was detected in the comparison of Michailova et al.'s (Reference Michailova, Ilkova, Kovalenko, Dzhulai and Kozeretska2021) data and the current samples from location 1 (Fisher's exact test, P = 0.031).
In samples from location 2, we found a heterozygous inversion (C) in the third chromosome (Table IV) in the same chromosomal section in which an inversion was reported by Martin (Reference Martin1962). There was no difference in the frequency of this aberration between the two studies (Fisher's exact test, P = 1).
Table IV. Somatic aberrations and their chromosomal location in Belgica antarctica larvae from both sampling locations in the current study.

BR = Balbiani ring; NOR = nuclear organizer region.
Somatic aberrations from both sampling locations
A wide spectrum of somatic chromosome rearrangements (paracentric heterozygous inversions, deficiencies, trisomy (trisomy is a numerical change in the chromosome in which three parts of the chromosome are visible) and a large dark band) was observed in individuals sampled from both sampling locations in the current study (Figs 7a,b, 8b,c & 9a–c & Table IV). Such rearrangements occurred in a small region, at a low frequency and only in a few cells of the salivary gland. The frequency of the presence of the dark band at the telomeres of the three chromosomes showed a significant difference only in the third chromosome (Fisher's exact test, chromosome I: P = 0.4501; chromosome II: P = 1; chromosome III: P = 0.0001).

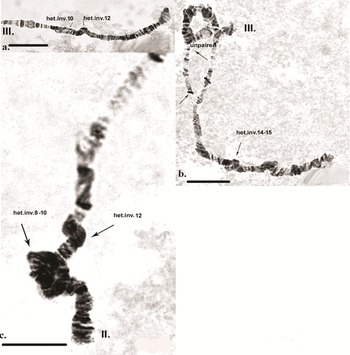
Fig. 9. Polytene chromosomes of Belgica antarctica showing structural aberrations. a. Chromosome III: somatic heterozygous inversions in section 10 and section 12; b. chromosome II: unpairing homologous, somatic heterozygous inversion (sections 14–15); c. chromosome II: somatic heterozygous inversion (sections 8–10), somatic heterozygous inversion (section 12). Scale bar = 10 μm.
Discussion
This study provides the first polytene chromosome map of B. antarctica, an important contribution enabling analysis of chromosomal instability in this species, which is important for enabling the use of this species as a model (Kozeretska et al. Reference Kozeretska, Serga, Kovalenko, Gorobchyshyn and Convey2022). This adds to the maps available for various chironomid genera (Keyl Reference Keyl1962, Michailova Reference Michailova1989, Kiknadze et al. Reference Kiknadze, Istomina, Golygina and Gunderina2016). These maps contribute to studies in taxonomy, cytogenetics and chromosomal polymorphism in natural populations and help us to identify pathways of species divergence.
The chromosome maps of Keyl (Reference Keyl1962) provided a detailed analysis of the structural-chromosomal aberrations and primarily homozygous inversions involved in the divergence of members of the genus Chironomus, which are otherwise characterized by great variation in external morphology and poor efficacy of separation using morphological characters. Michailova (Reference Michailova1989) indicated on chromosome maps of species representing different genera of the family the band marker patterns by which separate species can be reliably determined. Kiknadze et al. (Reference Kiknadze, Istomina, Golygina and Gunderina2016) used the chromosome maps of each species to clearly indicate the locations of fixed homozygous inversions characteristic of species in this genus. Michailova (Reference Michailova1989) reported other chromosomal aberrations in standard chromosome maps of species of the genus Cricotopus (subfamily Orthocladiinae) that were involved in the divergence of these species, in particular tandem translocations. The chromosomal map of Chironomus thummi (Kiknadze et al. Reference Kiknadze, Istomina, Golygina and Gunderina2016) has proved to have great application in analysing chromosome variability in this species caused by environmental pollution (Michailova et al. Reference Michailova, Ilkova, Kovalenko, Dzhulai and Kozeretska2021). Standard chromosome maps of other chironomid species have also been used to analyse chromosomal changes due to exposure to various environmental pollutants (Ilkova et al. Reference Ilkova, Michailova, Szarek-Gwiazda, Kownacki and Ciszewski2017). Chromosome maps are particularly widely used in the analysis of chromosomal polymorphism within populations of species under different environmental conditions and from geographically distinct populations (e.g. Kiknadze et al. Reference Kiknadze, Istomina, Golygina and Gunderina2016).
The map of polytene chromosomes of B. antarctica we created has the potential to inform knowledge on the paths of speciation in this taxon, provided that corresponding maps become available in closely related species (notably Belgica albipes and Eretmoptera murphyi; Allegrucci et al. Reference Allegrucci, Carchini, Convey and Sbordoni2012, Kozeretska et al. Reference Kozeretska, Serga, Kovalenko, Gorobchyshyn and Convey2022). Inversions are the result of damage being caused to DNA molecules followed by their repair. Such damage can include errors in the repair system and can be caused by external factors such as ionizing radiation and other sources of oxidative damage (Theodorakis Reference Theodorakis, Jørgensen and Fath2008). The inversions can become fixed in the population through both selection and random drift. Many inversions, particularly small ones in intergenic regions, are likely to evolve neutrally by drift alone. Some characteristics of inversions can influence selection processes. Inversions that generate structural problems in the process of meiosis can disrupt open reading frames or alter gene expression in deleterious manners, but they can also be drivers of adaptive shifts and speciation (Hoffmann & Rieseberg Reference Hoffmann and Rieseberg2008, Kirkpatrick Reference Kirkpatrick2010). The established inherited aberrations observed in specimens from the two sampling locations here were first observed several decades ago (Martin Reference Martin1962, Atchley & Davis Reference Atchley and Davis1979). It is plausible that the inherited inversions A, B and C, which appear at high frequency, have an adaptive value and hence enhance individual survival potential, possibly by playing a role in adaptation to the extreme conditions of Antarctica. Further detailed functional genomic analyses would be required to investigate this hypothesis further.
Atchley & Davis (Reference Atchley and Davis1979) proposed that the Antarctic terrestrial environment is inherently very variable, and therefore genetic systems may be highly buffered through selection supporting those mechanisms that preserve heterozygosity and reduce recombination (Otto & Barton Reference Otto and Barton1997). More generally, Peck et al. (Reference Peck, Convey and Barnes2006) also emphasized that, while Antarctic environmental conditions are correctly considered to be extreme, in reality the terrestrial biota in particular can also face highly variable conditions. Our data illustrate that B. antarctica provides a good example of a species characterized by highly heterozygous chromosomal inversions, consistent with evolutionary processes in a highly variable environment.
A large spectrum of somatic aberrations was observed in this study. The appearance of the dark band at the telomeres of the chromosomes is particularly notable. A dark disc called a ‘dark knob’ has been reported in Chironomus nuditarsis populations from Switzerland (Fischer Reference Fischer1978) and in a Siberian population (Kiknadze et al. Reference Kiknadze, Istomina, Golygina and Gunderina2016), probably resulting from amplification events. The somatic alterations observed in chironomid larvae have been proposed to be useful biomarkers for the action of genotoxic agents (Michailova et al. Reference Michailova, Sella and Petrova2012). Their sensitivity may be indicated by the S index calculated from the samples obtained at the two study locations. The high number of somatic aberrations observed in the genome of B. antarctica suggests that the polytene chromosomes of this species may be particularly sensitive to breakages that occur under the environmental conditions of the studied locations (Parnikoza et al. Reference Parnikoza, Abakumov, Korsun, Klymenko, Netsyk and Kudinov2016). Such structural-chromosomal aberrations have been observed in many species of the family Chironomidae: Chironomus riparius, Chironomus piger, Chironomus plumosus, Glyptotendipes barbipes and Glyptotendipea glaucus (Sella et al. Reference Sella, Bovero, Ginepro, Michailova, Petrova and Robotti2004, Michailova et al. Reference Michailova, Sella and Petrova2012).
Larval development of B. antarctica often takes place in mosses, which could potentially provide a source of contaminants. Contaminants in Antarctic terrestrial ecosystems can include trace elements originating both from the natural weathering of source minerals and from anthropogenic activities (Chu et al. Reference Chu, Dang, Kok, Ivan Yap, Phang and Convey2019, Magesh et al. Reference Magesh, Tiwari, Botsa and da Lima Leitao2021). The spectrum of somatic aberrations we documented in B. antarctica is similar to that noted in other chironomid species as a result of trace element exposure (Michailova et al. Reference Michailova, Sella and Petrova2012). Trace elements are known to affect not only the structure of chromosomes but also the transcriptional activity of genes. In particular, it is notable that the transcriptional activity of important polytene chromosome structures of B. antarctica, such as the NOR of the three chromosomes, is reduced by such exposure, as has also been noted in other chironomids (Michailova et al. Reference Michailova, Sella and Petrova2012). A heterozygous state of the BR was also found in specimens in this study, along with high functional activity along the length of the chromosomes, as indicated through the presence of multiple puffs. The functional activity of the polytene chromosomes observed here may be a result of the environmental conditions experienced in the habitats sampled or during transport from Antarctica. Of particular interest is the formation of puffs in the telomeric part of chromosomes, which depends on the specific telomere structure. For instance, some Chironomus species (e.g. C. thummi and C. piger) are capable of producing heat shock proteins, an activity indicated by puffs at the telomeres (Martinez et al. Reference Martinez, Sanchez-Elsner, Morcillo and Diez2001). These proteins are permanently expressed at high levels by B. antarctica larvae (Rinehart et al. Reference Rinehart, Hayward, Elnitsky, Sandro, Lee and Denlinger2006). However, it is also important to recognize that the precise locations of specific genes on the chromosomes are not currently known. We hypothesize that these genes may be located in the telomere regions, which should be addressed in future research.
In conclusion, we suggest that the range of aberrations documented for the first time in this study may indicate damage as a result of the intense environmental conditions that characterize Antarctic terrestrial habitats. They may, therefore, serve as an important bioindicator of Antarctic environmental conditions (Bickham & Smolen Reference Bickham and Smolen1994), and in particular provide information regarding the occurrence of changes in the structure and functioning of these ecosystems.
Acknowledgements
We are sincerely grateful to Ina Aneva, Anna Ganeva, Snezhana Grozeva, Peter Ostoich, Petar Zhelev, Roumiana Metcheva and Mila Ihtimanska (Bulgarian Academy of Sciences) for their support and assistance. We also thank the participants of the 26th Ukrainian Antarctic expedition for technical and logistical support in the organization of the sample collection. We certify that this work was made possible thanks to brave Ukrainian soldiers and the support of the entire progressive world in countering Russian aggression. The authors thank the reviewers and the editorial board for the recommendations that helped to improve the text and make it more accessible to readers.
Financial support
This study was performed within the framework of the Ukrainian State Special-Purpose Research Program in Antarctica for 2011–2023. PAK is supported by a scientific project of the National Academy of Sciences of Ukraine to research laboratories/groups of young scientists (Code 6541230) ‘The impact of global climate change on the populations of individual plants and animals world’ (No. of state registration 0122U002153). SS is supported by PAUSE-ANR Gandhi-Ukraine Program. PC is supported by Natural Environment Research Council (NERC) core funding to the British Antarctic Survey (BAS) ‘Biodiversity, Evolution and Adaptation’ Team.
Author contributions
PM: conceived and designed the study, performed experiments, data analysis and interpretation, initial drafting and subsequent revision of the manuscript. PAK: sample collection, performed experiments, data analysis and interpretation, initial drafting and subsequent revision of the manuscript. SS: data analysis, manuscript revision. IP: sample collection, manuscript revision. IK: project administration, study conception and design, interpretation, initial drafting and revision of the manuscript. PC: data interpretation, manuscript revision, critical review. All authors have agreed to the final version of the manuscript.
Supplemental material
A supplemental material section containing two supplemental tables will be found at https://doi.org/10.1017/S0954102023000202.


