Nomenclature
- AR
-
aspect ratio
- TSFC
-
thrust specific fuel consumption
-
 ${{{\dot{\textrm{m}}}}_{{\rm{air}}}}$
-
air mass flow rate
- A b
-
bellmouth throat area
- D e
-
nozzle exit diameter
- L
-
nozzle total length
- P
-
static pressure
- P t
-
total pressure
- P a
-
ambient pressure
- T
-
static temperature
- T t
-
total temperature
- F
-
thrust
- M
-
mach number
- V
-
velocity
- I
-
radiance
- Q
-
exhaust gas mass flow rate
- E
-
entrainment ratio
1.0 Introduction
It has been known that some types of exhaust nozzles applied to aircraft propulsion engines can reduce the temperature of the exhaust plume or shield the heat source of the high-temperature turbine depending on their shape. Numerous studies on the flow characteristics and performance of exhaust nozzles have been conducted based on the geometry of such nozzles. Early aircraft jet engines contained axisymmetric circular exhaust nozzles that yielded low thrust losses and could be easily manufactured. Many researchers have conducted basic studies to understand the internal gas flow of these nozzles, shape of the plume ejected from the exhaust nozzle exit and turbulence characteristics [Reference Dimotakis, Miake lye and Papantoniou1–Reference Crow and Champagne3]. Recently, studies on various shapes of exhaust nozzles have been conducted to reduce infrared signals emitted from the exhaust nozzle. Mahulikar et al. [Reference Mahulikar, Sonawane and Rao4] presented shapes capable of infrared signal suppression and concluded through experiments and analysis that nozzle shapes affect infrared signals [Reference Lamb, Taylor and Frassinelli5]. Sfeir [Reference Sfeir6] reported that the geometry of a non-axisymmetric nozzle with a specific aspect ratio improved the mixing with outside air, thus reducing the temperature of the exhaust plume. Gutmark et al. [Reference Gutmark, Schadow and Wilson7] performed a study on the mixing performance with air for a wider variety of nozzle shapes. They explained that an important cause of the decrease in the length of the plume is the phenomenon in which external air is mixed into the exhaust jet. As the aspect ratio increases, the amount of air introduced into the ejecting jet from the outside increases, and from this result, it was recognised that the asymmetric nozzle has an effective shape for reducing the temperature of the exhaust plume [Reference Ehsan, Maddahian, Faghani and Farhanieh8, Reference Quinn9]. Recently, exhaust nozzle research has been conducted more actively, and numerical analysis studies have been conducted on how to reduce infrared signal in aircraft. An et al. [Reference An, Kang, Baek, Myong, Kim and Choi10] conducted flow and infrared signal analysis to see the effect of nozzle shape applied with aspect ratio on aircraft infrared signals. When the aspect ratio increases, the plume length is shortened and spread widely, and due to this characteristic, the infrared signal may increase or decrease depending on the direction of the aircraft. Recently, research on turbojet engines and infrared signal characteristics has been conducted experimentally. Gu et al. [Reference Gu, Baek, Jegal, Choi and Kim11] developed a system capable of measuring the performance of a microturbine engine and infrared signal in order to analyse the characteristics of infrared signals of exhaust gas. The infrared signature reduced as the distance from the nozzle increased, and the infrared signatures of the rectangular nozzle were lower than those of the circular nozzle. Choi et al. [Reference Choi, Kim, Myong and Kim12] used a micro-turbojet engine with nozzles of various aspect ratios to investigate the relationship between exhaust gas temperature and infrared signature. As a result of measuring the exhaust gas temperature distribution, in the case of circular nozzles, the distribution of plums was formed in a circular shape, and a high temperature area was developed further from the exhaust nozzle outlet. In the case of the nozzle with a large aspect ratio, the average temperature of the exhaust gas was reduced and broadly scattered. Thus, the greater the aspect ratio of the exhaust nozzle, the greater would be the contact area with the cold air surrounding it. As the aspect ratio of the exhaust nozzle increases, the area in contact with the surrounding cold air increases, leading to a rapid drop in temperature of the exhaust plume, which leads to a decrease in infrared signals.
Many researchers have established this phenomenon by performing experiments, numerical analysis, and infrared signature measurements. However, integrated research on flow characteristic measurements based on a real turbojet engine and infrared signatures radiated from ejecting plumes and comparison validation through numerical flow analysis are not widely reported. In this study, a micro-turbojet engine that is comparable to a real engine was fitted with circular and rectangular nozzles, and the velocity and temperature distributions of the plume ejected from each nozzle were measured according to the nozzle exit distance to determine the flow distribution of the plume. At the same time, the magnitude of the infrared signal emitted from the plume is also measured. In addition, numerical analysis was conducted to determine the temperature and velocity distribution inside the exhaust nozzle. By integrating and analyzing the research results, it is expected that the correlation between the infrared signal emitted from the plume ejected from the nozzle and the nozzle shape will be better understood. Therefore, the main objective of this study is to identify the characteristics of flow according to the shape of the exhaust nozzle of the turbojet engine through experiments. And the second is to explain the mechanism of these distribution characteristics through numerical analysis.
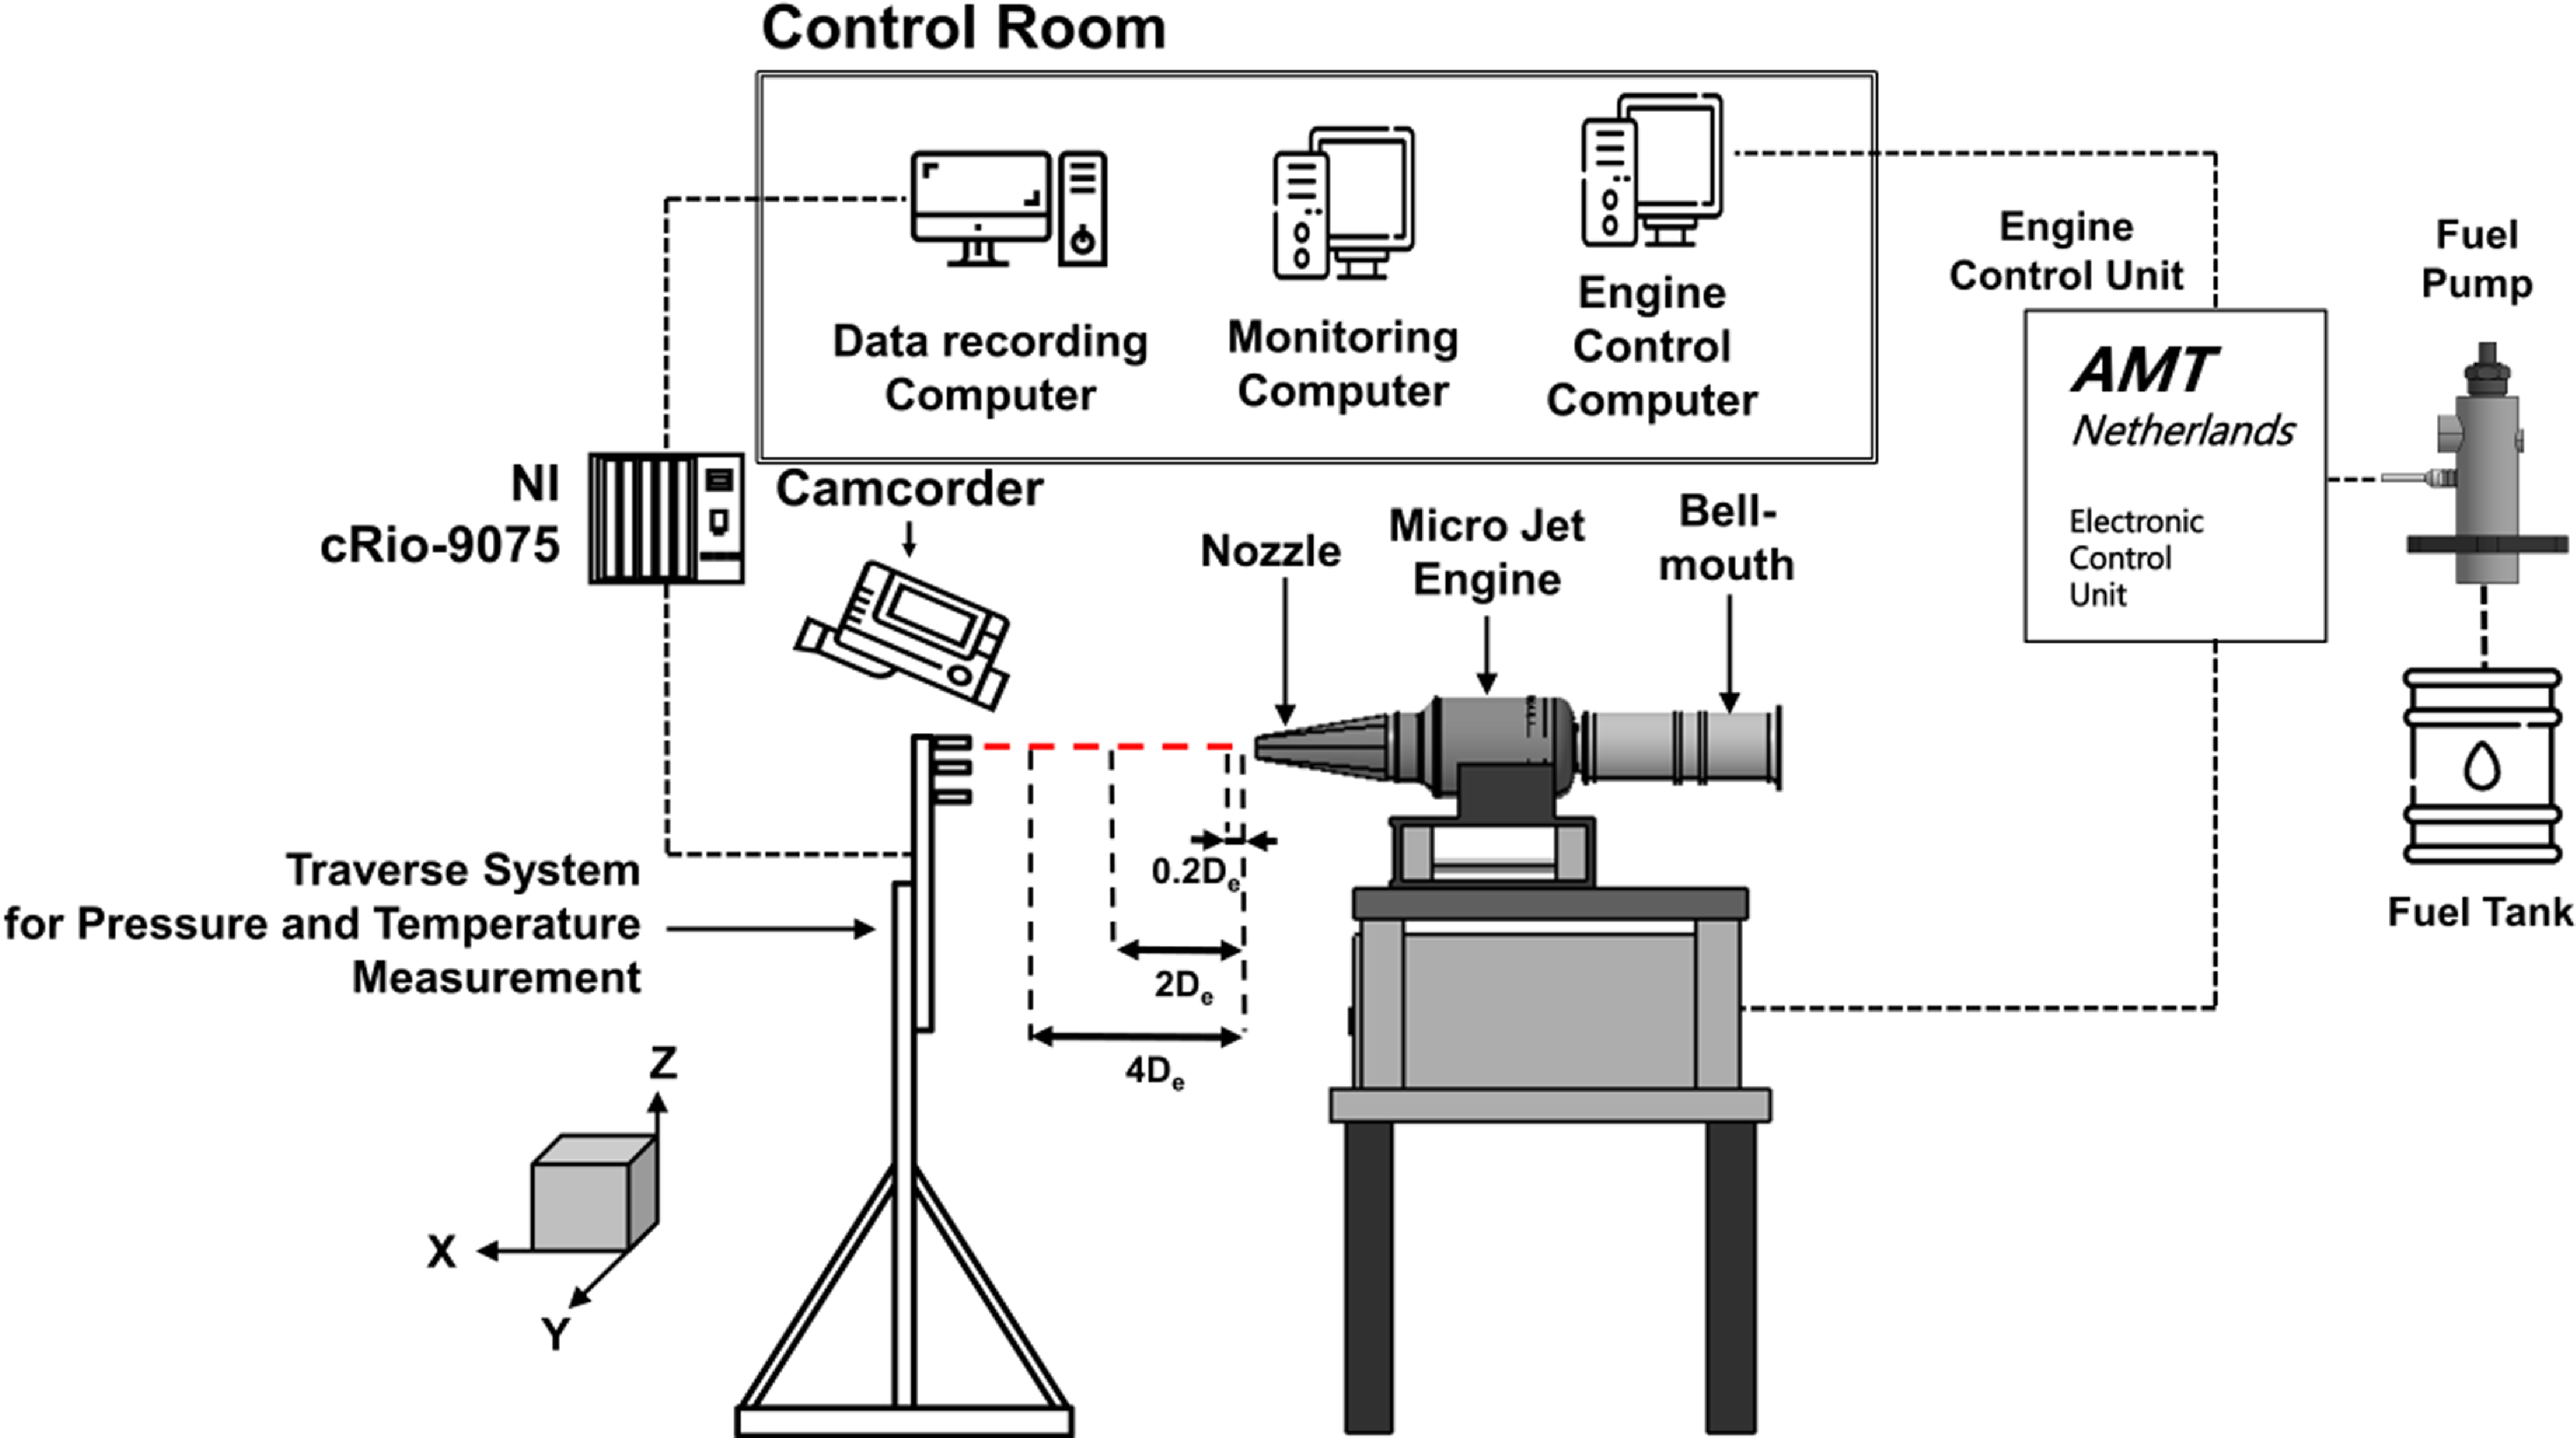
Figure 1. Layout of the engine test system.
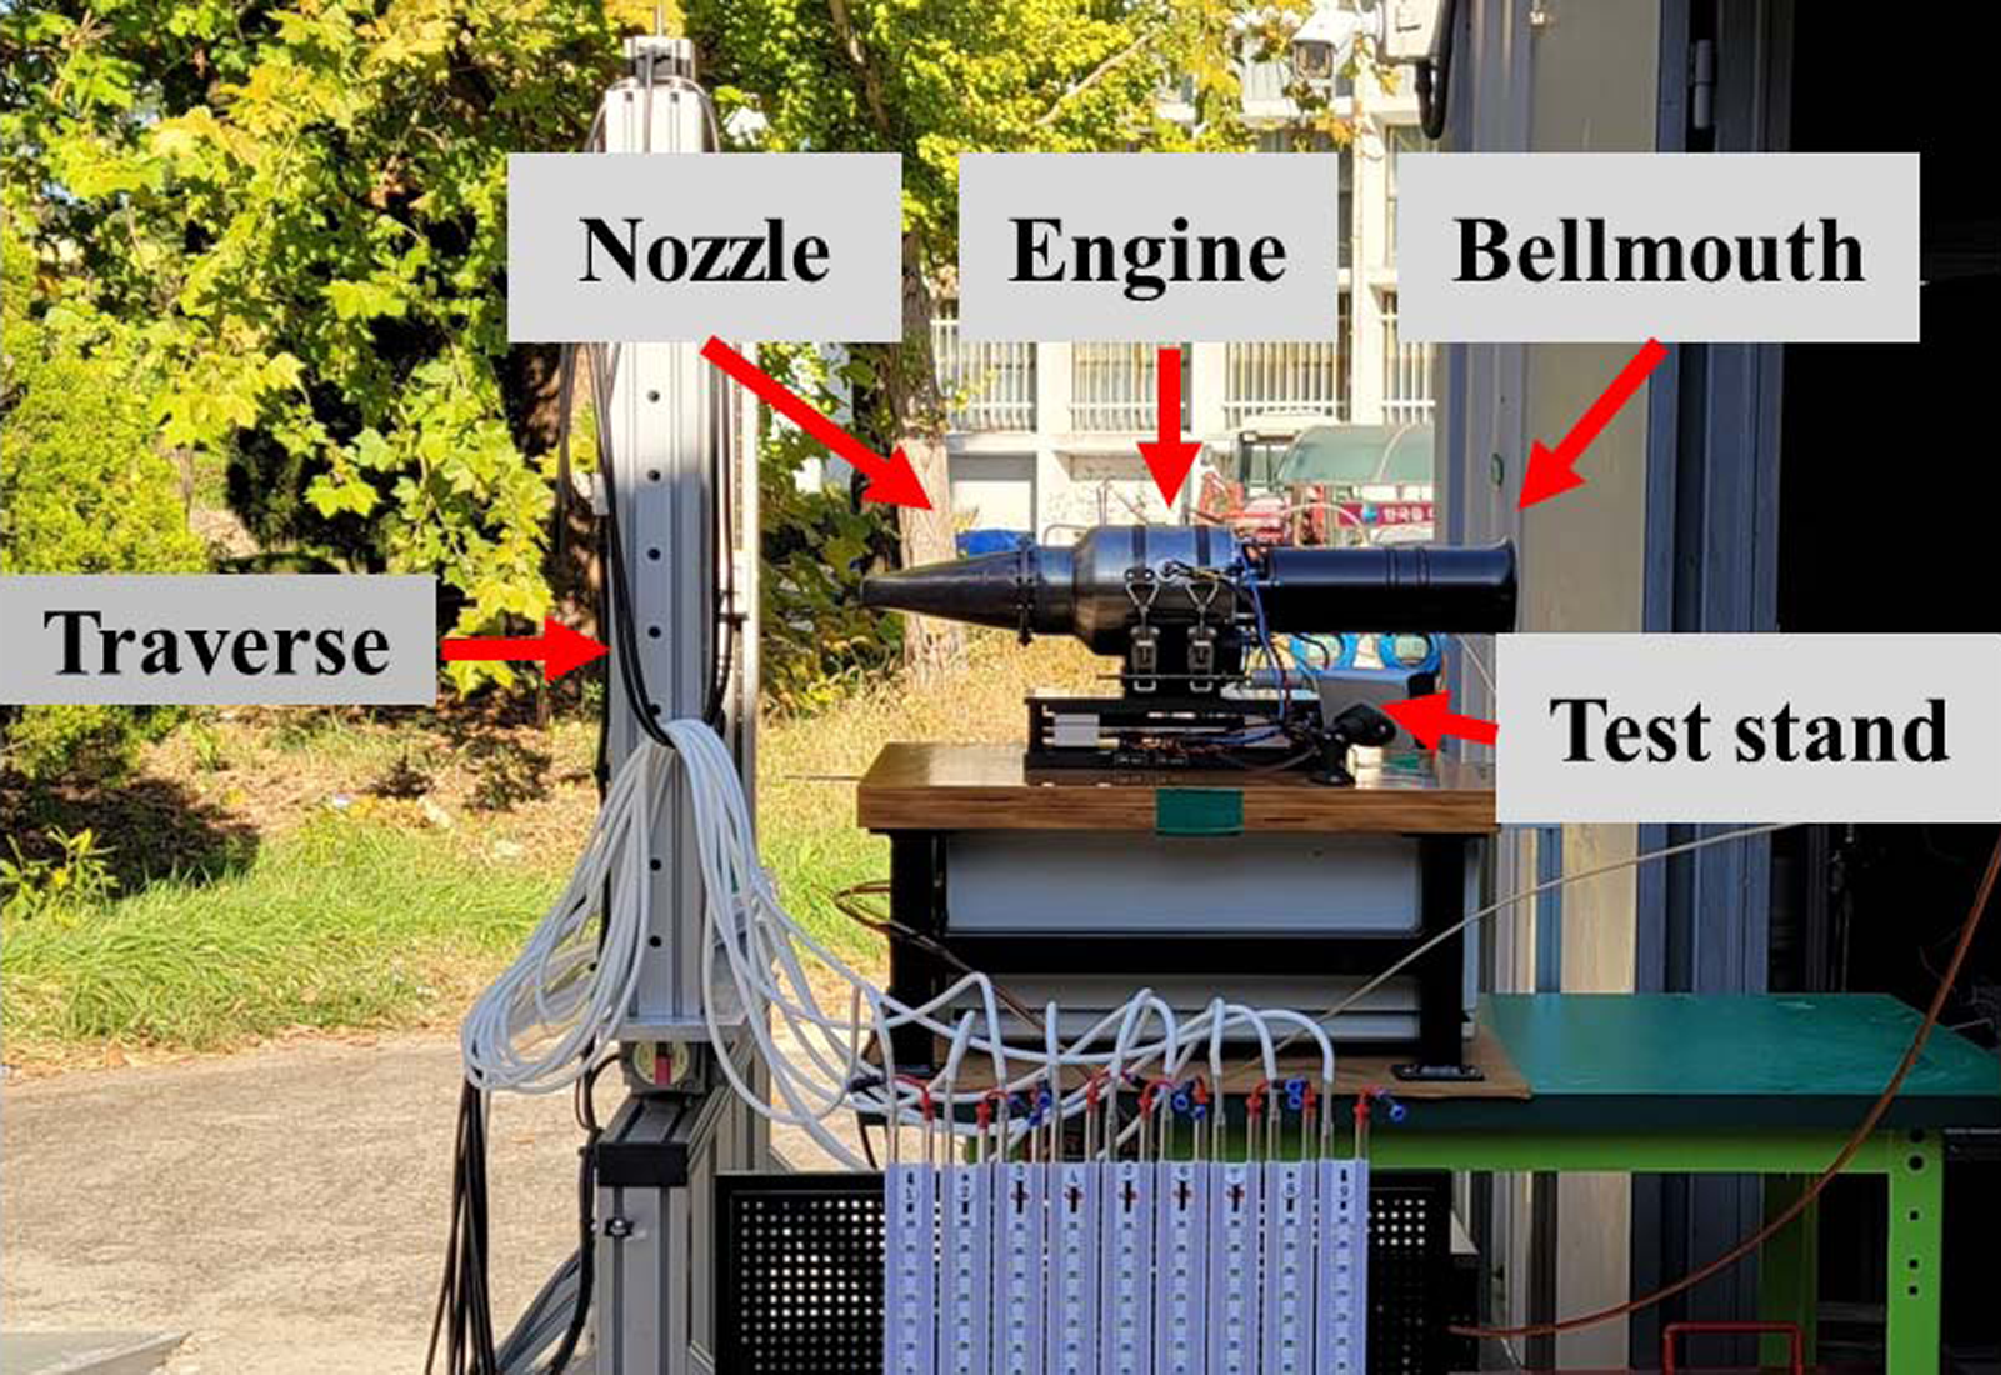
Figure 2. Picture of the engine test system.
2.0 Experimental and numerical methods
2.1 Engine and experimental setup
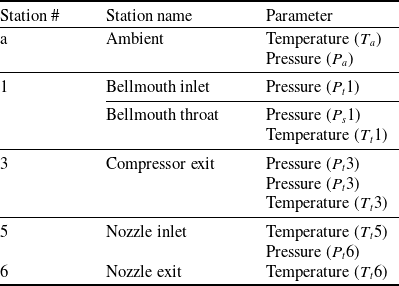
The micro turbojet engine is widely used for research purposes because the flow rate of intake air is relatively low and it is easy to measure the temperature and velocity of exhaust gas ejected from the engine nozzle. The AMT Olympus HP engine, which comprises a centrifugal compressor, a straight combustor and an axial flow turbine, was employed in this study. The engine has a maximum thrust of 230N, compression ratio of 3.8, maximum revolution of 108,500rpm, and maximum exhaust gas temperature of 750°C. A schematic of the experimental setup used in this study is presented in Fig. 1, and an image of the experimental setup is shown in Fig. 2. The micro-jet engine inhales air through the bell mouth, and the exhaust nozzle is attached to a flange such that it may be swapped in different configurations. The velocity and temperature measuring device is mounted on a two-dimensional moving traverse system. A measurement system was built to measure the air flow rate, engine speed, fuel flow rate, thrust, pressure and temperature for each major station. Figure 3 and Table 1 show the positions of sensors and probes mounted on the engine. The total pressure (P t 1), total temperature (T t 1) at the bell mouth inlet and static pressure (P s 1) at the inlet throat were measured. Then, the inhaled air flow rate was computed according to the differential pressure. The equation for the intake air flow rate is as follows:
 \begin{align}M = {\left\{ {\frac{2}{{\gamma - 1}}\left[ {{\rm{\;}}{{\left( {\frac{{{P_{t,1}}}}{{P_{s,1}}}} \right)}^{\frac{{\gamma - 1}}{\gamma }}} - 1} \right]} \right\}^{1/2}}{\rm{\;}}\end{align}
where ρ is the air density, T s,1 is the static temperature, A b is the bell mouth throat area, R is the air constant, γ is the air-specific heat ratio and M is the Mach number. Furthermore, the operational characteristics of the compressor were measured by mounting a total pressure probe (P t 3), static pressure probe (P s 3) and total temperature sensor (T t 3) at the rear end of the centrifugal compressor. To detect the exhaust gas temperature and total pressure at the nozzle inlet, a total pressure probe (P t 6) and a temperature sensor (T t 5) were mounted between the outlet of the turbine and the tail cone. A temperature sensor (T t 6) was mounted at the nozzle exit in order to detect the temperature of the exhaust gas before it was ejected into the atmosphere. The engine support fixes the Y-axis (major axis) and Z-axis (minor axis) directions, and it includes a linear motion (LM) slide in the X-axis direction to ensure that the axial thrust can be delivered. The thrust is measured using a load cell (MLP-200, Transducer Techniques) that is fitted at the end of the slide, yielding a measurement error of less than 0.06% for the full-scale operating range and a maximum measurable value of 890N (200lbf). A turbine flow meter (OCX00-10-X, Orbit Control) was used to measure the fuel mass flow rate; the measurement error was roughly 1%. Furthermore, the thrust specific fuel consumption (TSFC), which is a basic engine performance parameter, was analyzed using the following equation:
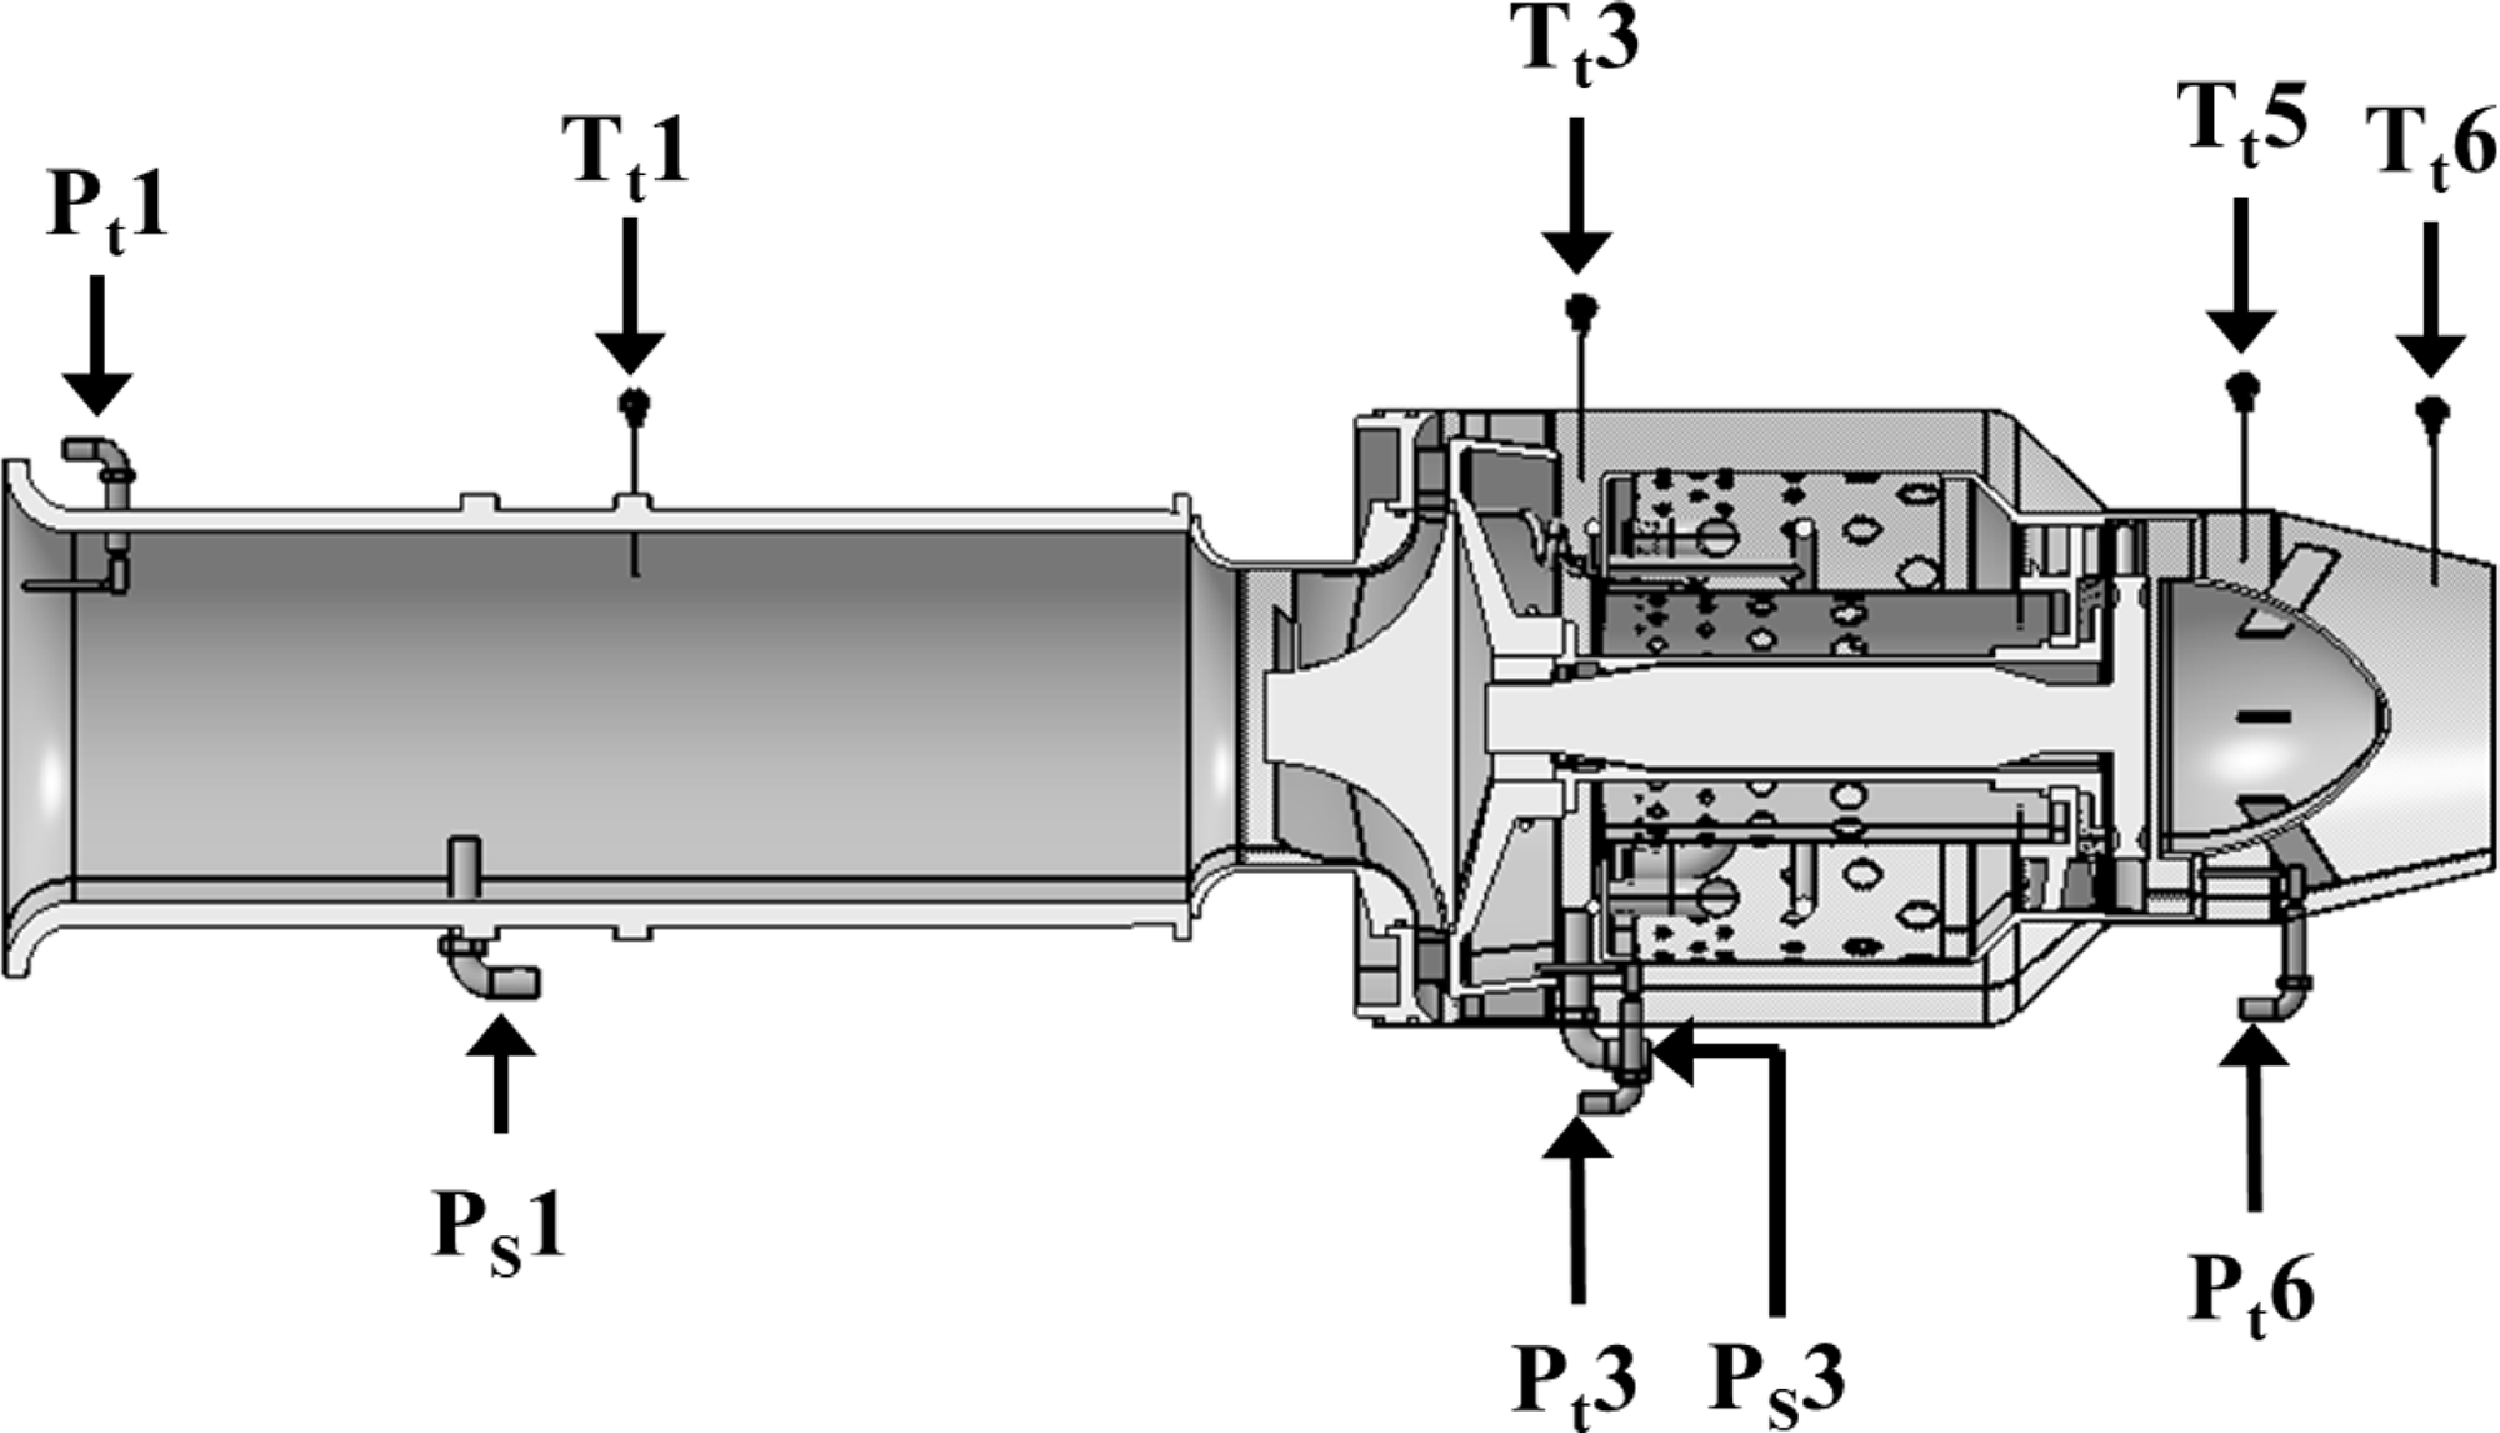
Figure 3. Schematic of the measurement probes in the engine.
Table 1. Details of measurement with station
An RPM sensor, which is mounted on the impeller blades, is used to measure the number of engine revolutions. Sixteen thermocouples were used to detect the temperature of the exhaust gas when the engine’s rotational speed reached 55,000RPM, and nine pitot tubes were used to measure the pressure. A two-axis (Y-Z axis) traverse was used for the probe’s coordinate movement. The two-axis traverse is designed in accordance with the objective of the experiment to alternatively place K-type thermocouples and pitot tubes. Figure 4 shows a photo of the thermocouple and pitot tube positioned on the traverse. A total of 16K-type thermocouples were inserted at 20-mm intervals along the Y-axis. The temperature standard deviation of the 16 thermocouples is 0.67°C, and the accuracy at the 95% confidence level of each thermocouple is ±1.32°C. A total of nine pitot tubes were placed at 10-mm intervals along the Y-axis. A U-tube manometer (DWYER, 1221-M600-W/M) and a pitot tube (KIMO, TPL-03-100, diameter 3mm) were used to measure the pressure. The pitot tube’s total pressure tube was linked to the manometer, while the static pressure tube was exposed to the atmosphere. The measured pressure was calculated to velocity using the following equation:
 \begin{align}V = \sqrt {\frac{{2\Delta P}}{\rho }} = \sqrt {\frac{{2\Delta P}}{P}RT} \end{align}
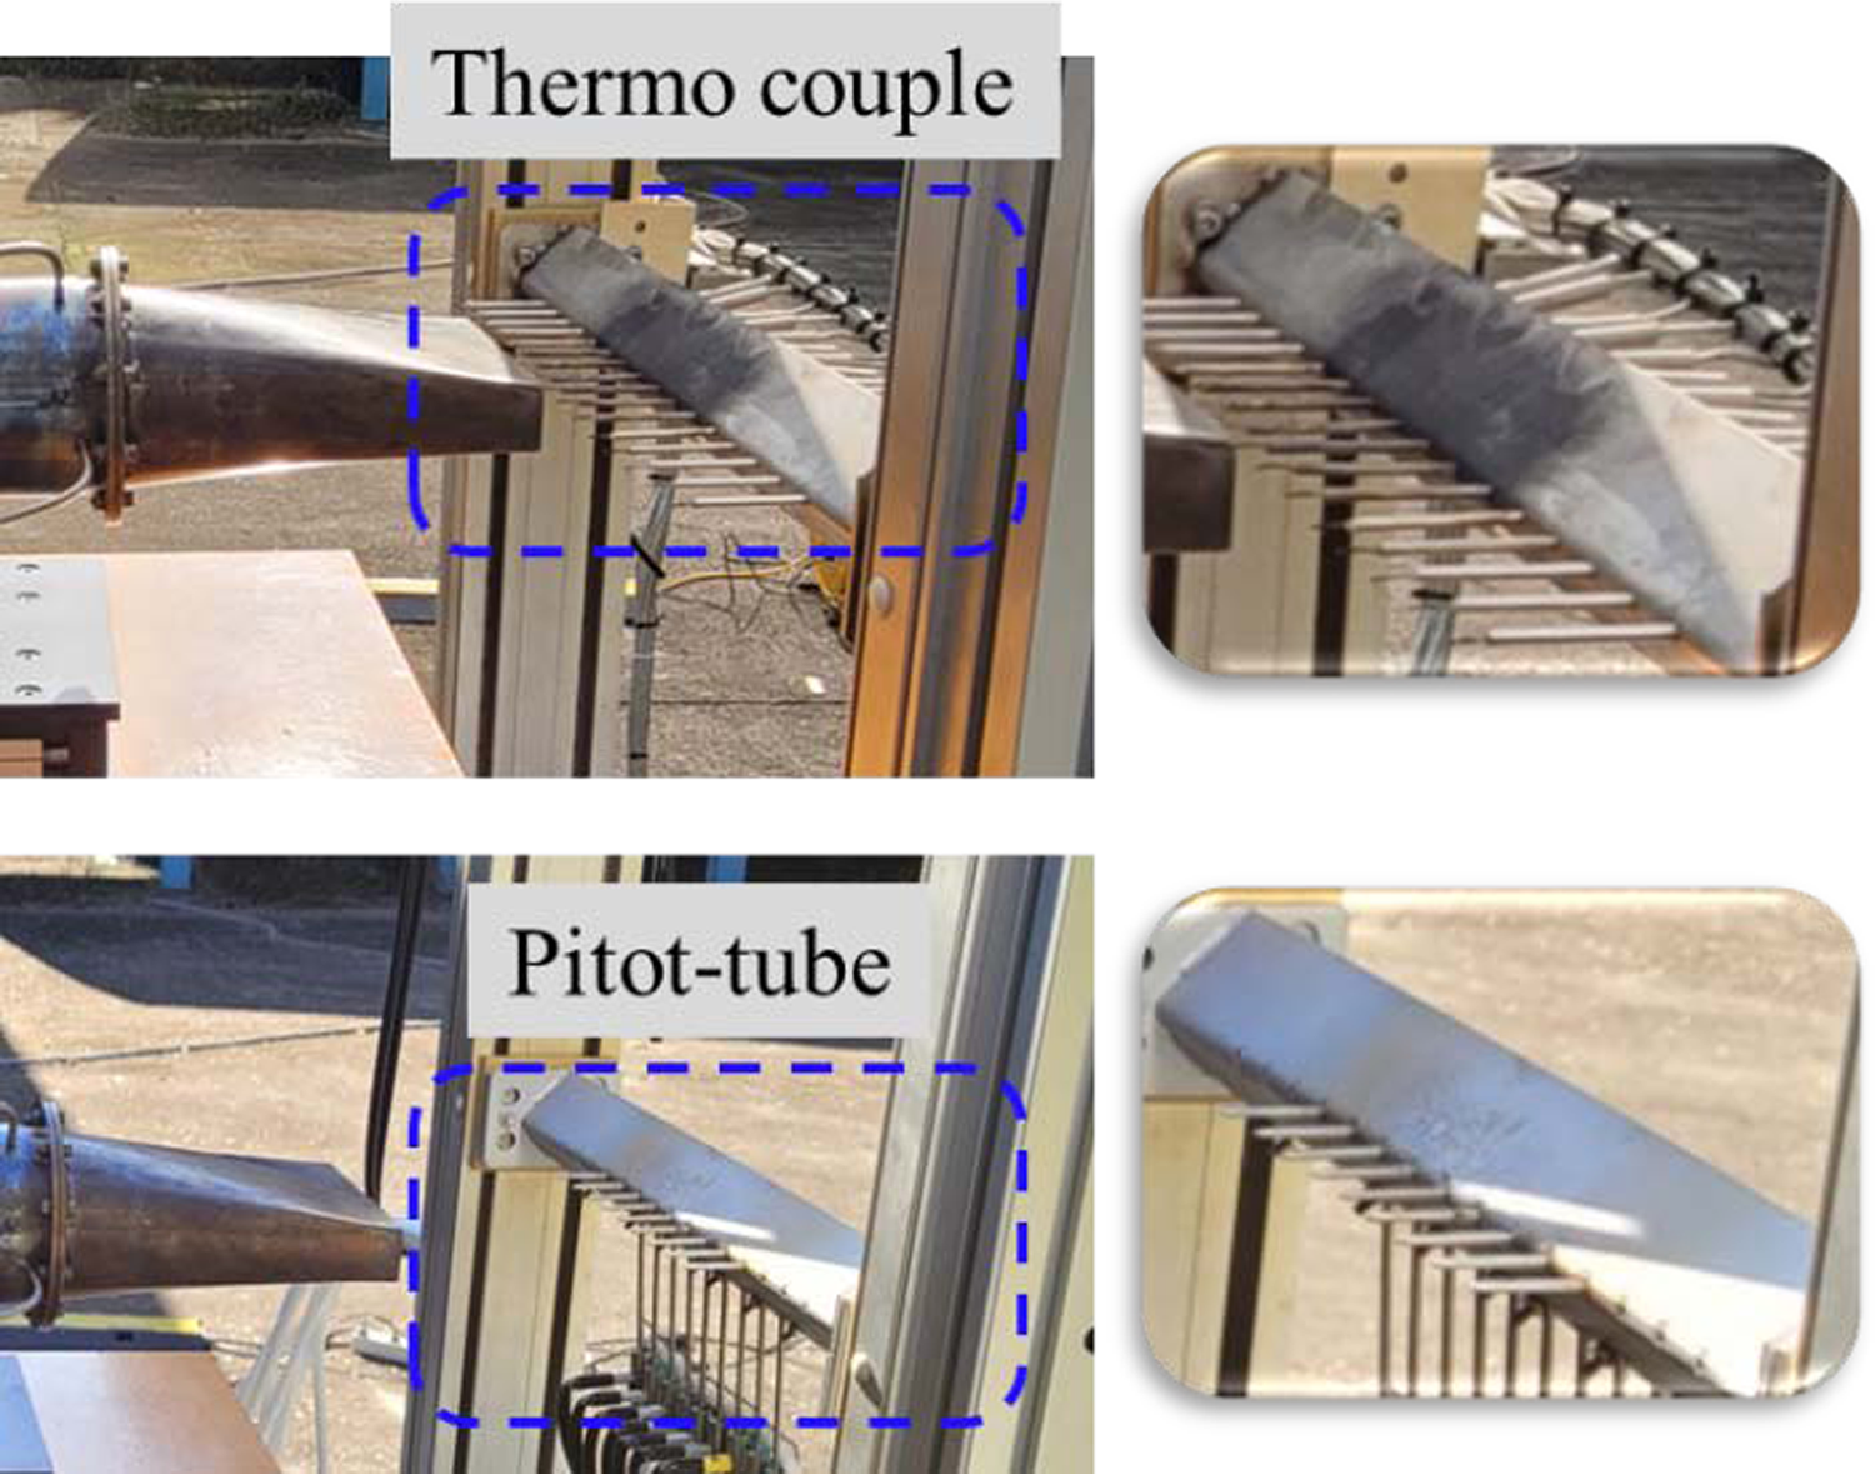
Figure 4. Picture of the pitot tube and thermocouple mounted on a traverse.
The exhaust gas temperature and pressure were monitored using a two-axis traverse at distances of 0.2De, 2De and 4De from the nozzle exit in order to investigate the exhaust gas properties based on axial distance. Here, De is the inner diameter of the circular nozzle exit, and its value is 65.6 mm. Furthermore, after the temperature and pressure were measured for 5 seconds while moving through the step motor driver in the directions of the Y- and Z-axes, the thermocouple was moved to the next measurement position to create a three-dimensional distribution map. The temperature and pressure measurements were obtained in real time using the NI-cRio 9075 and LabVIEW software. A thermal imaging camera (Variocam hr head, JENOPTIK) was used to measure the infrared signature emitted by the exhaust gas. The wavelength band is
![]() $7.5 \sim 14.0 $
μm, and the temperature range is
$7.5 \sim 14.0 $
μm, and the temperature range is
![]() $-40 \sim 1,200 $
°C. Figure 5 depicts a schematic diagram of the experimental approach for infrared measurement. The thermal imaging camera was placed at a 3 m from the nozzle exit along the central axis extension line at a 90° angle. The infrared signatures were measured from 1De to 10De in the axial direction. To measure the infrared signature in the major axis direction, a method wherein the rectangular nozzle mounted in the basic direction (0°) was rotated at 90° was designed. Figure 6 depicts the form of the rectangular nozzle inserted at 0° and 90° angles. The atmospheric temperature was 18.6±3°C, and the air pressure was 1,021.4±0.9hPa during the test.
$-40 \sim 1,200 $
°C. Figure 5 depicts a schematic diagram of the experimental approach for infrared measurement. The thermal imaging camera was placed at a 3 m from the nozzle exit along the central axis extension line at a 90° angle. The infrared signatures were measured from 1De to 10De in the axial direction. To measure the infrared signature in the major axis direction, a method wherein the rectangular nozzle mounted in the basic direction (0°) was rotated at 90° was designed. Figure 6 depicts the form of the rectangular nozzle inserted at 0° and 90° angles. The atmospheric temperature was 18.6±3°C, and the air pressure was 1,021.4±0.9hPa during the test.
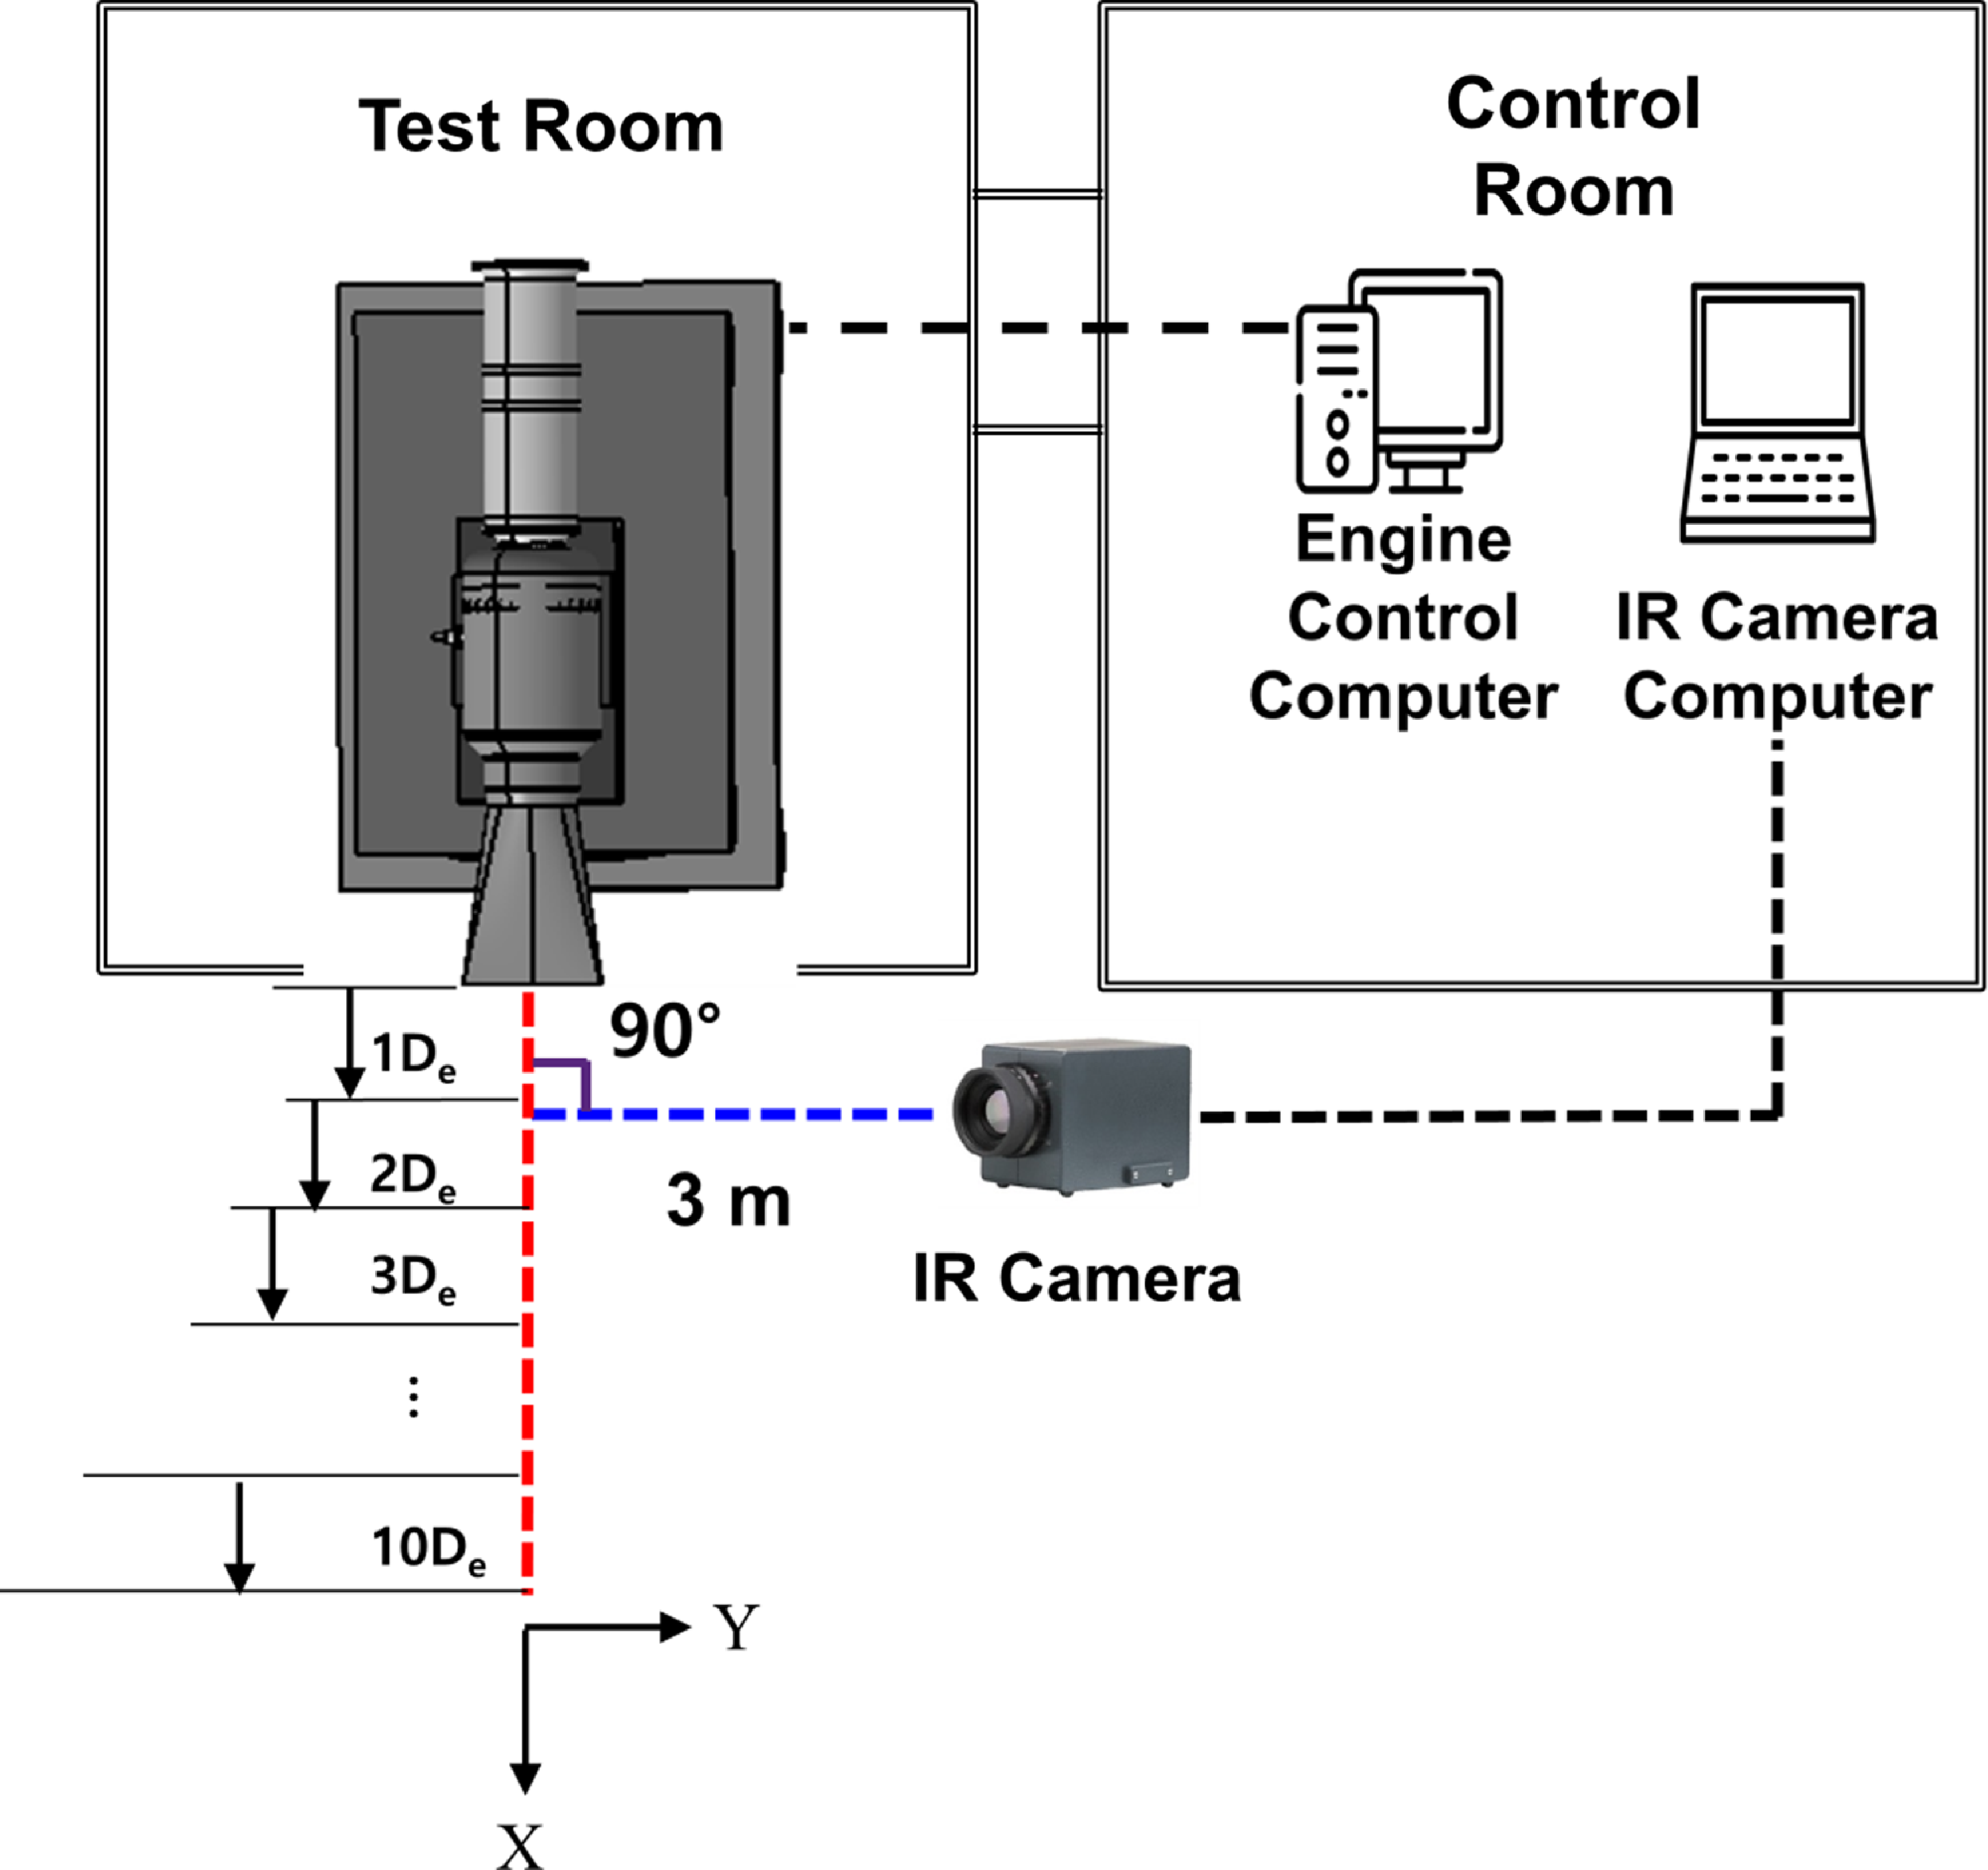
Figure 5. Layout of infrared measurement system.
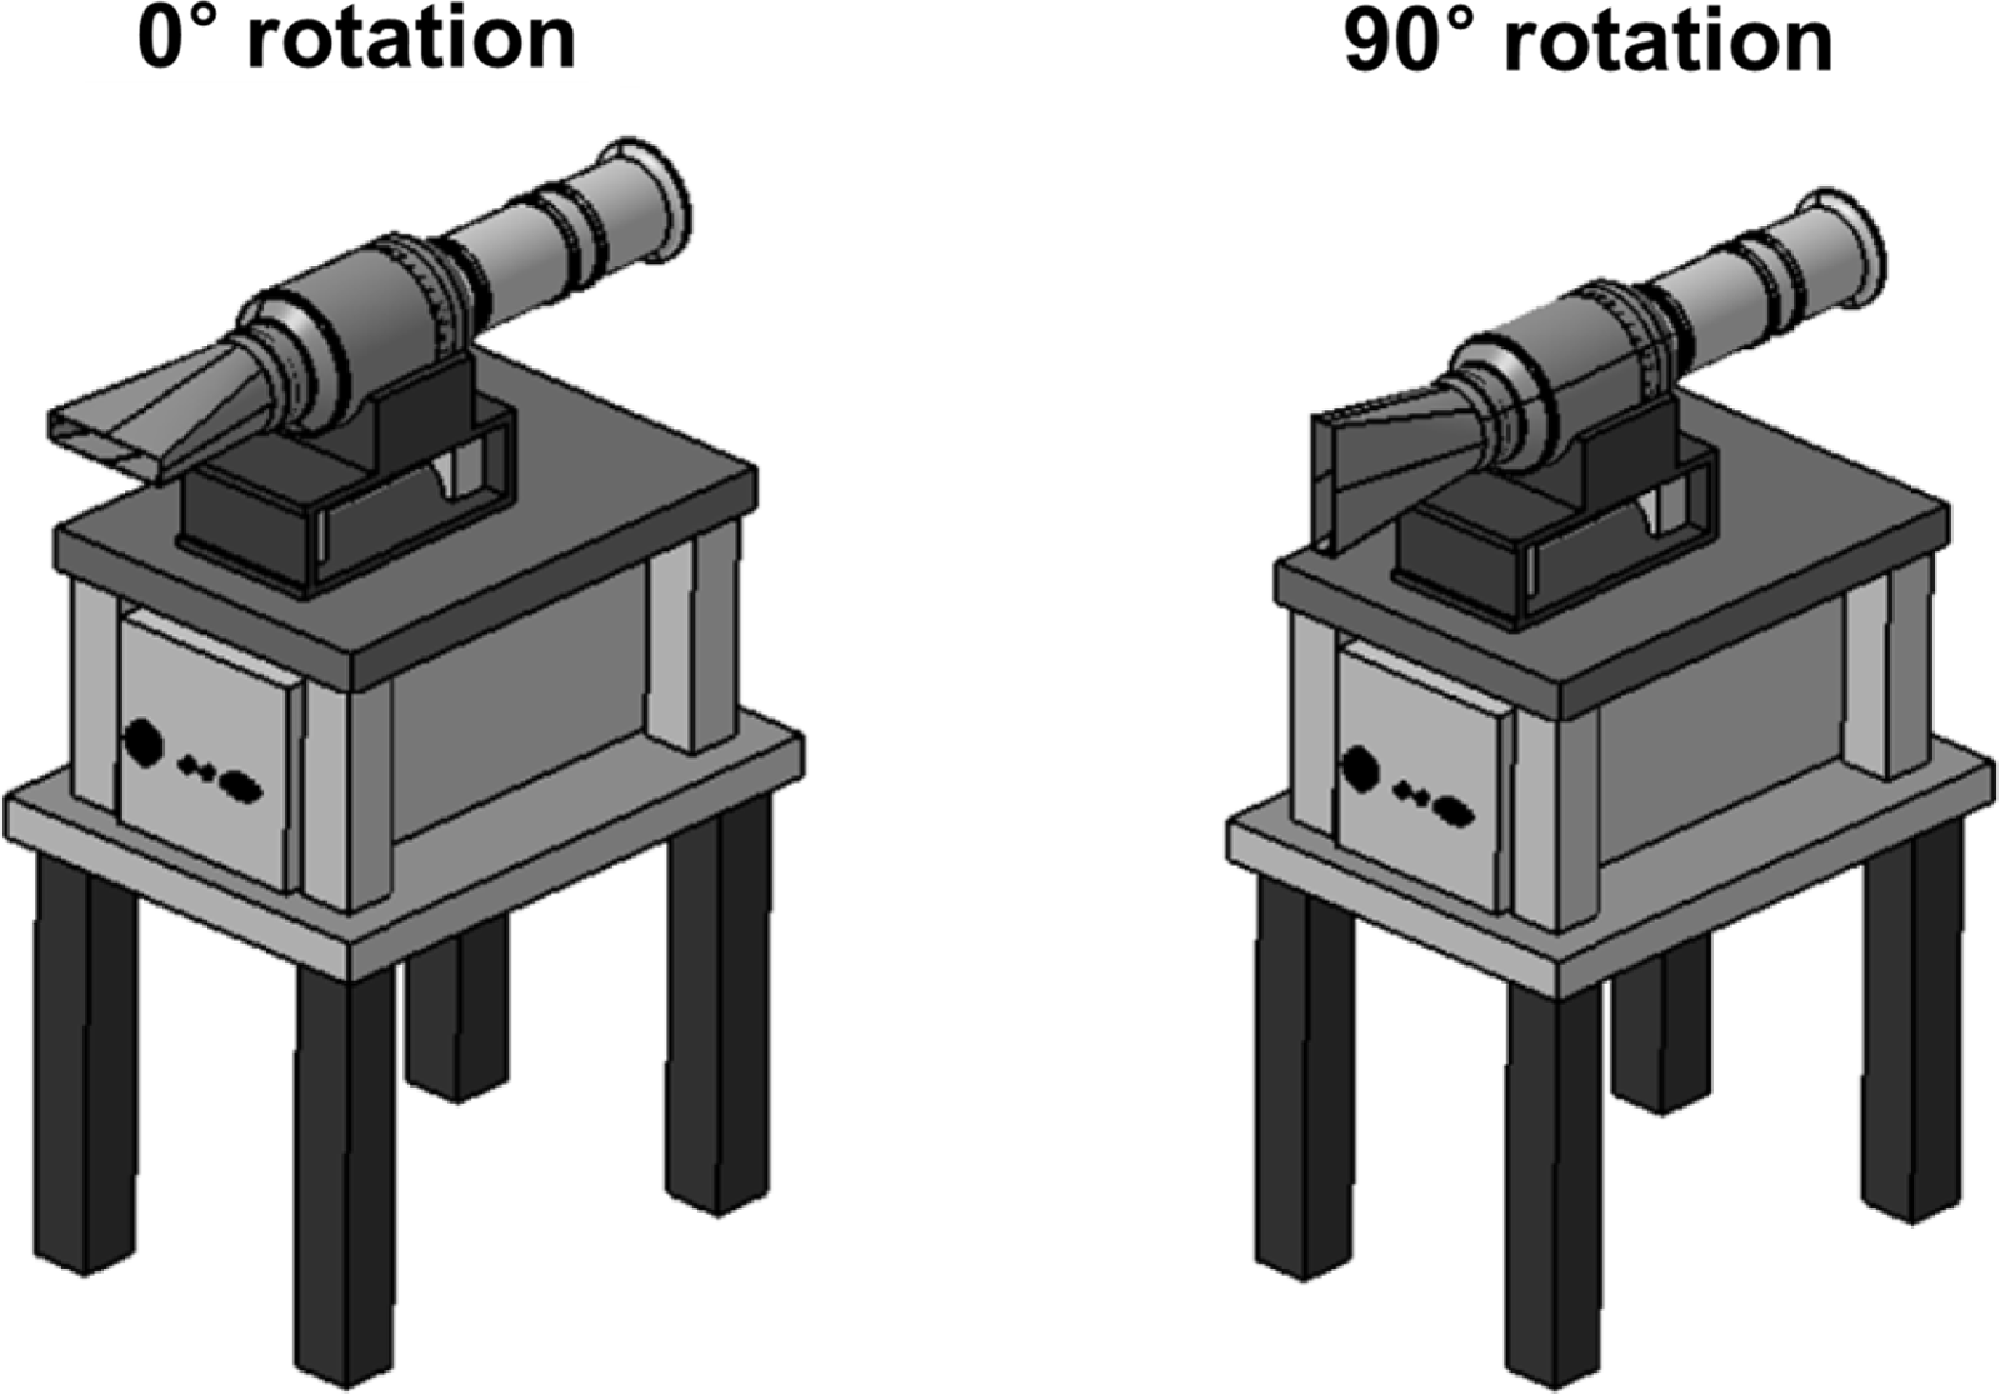
Figure 6. Setup of rectangular nozzle for the infrared measurement.
2.2 Nozzle shape
Figure 7 shows the shape and dimensions of the circular and rectangular nozzles used in the experiment. The nozzle inlet area, outlet area and overall length are 5,410.6mm2, 3,380mm2 and 166mm, respectively. The circular nozzle has a convergence angle of 6.8°, while the rectangle nozzle has convergence and divergence angles of 19.5° and 16.5°, respectively. The aspect ratio of the rectangular exhaust nozzle was fixed at five, as suggested by Choi et al. [Reference Choi, Kim, Myong and Kim12].
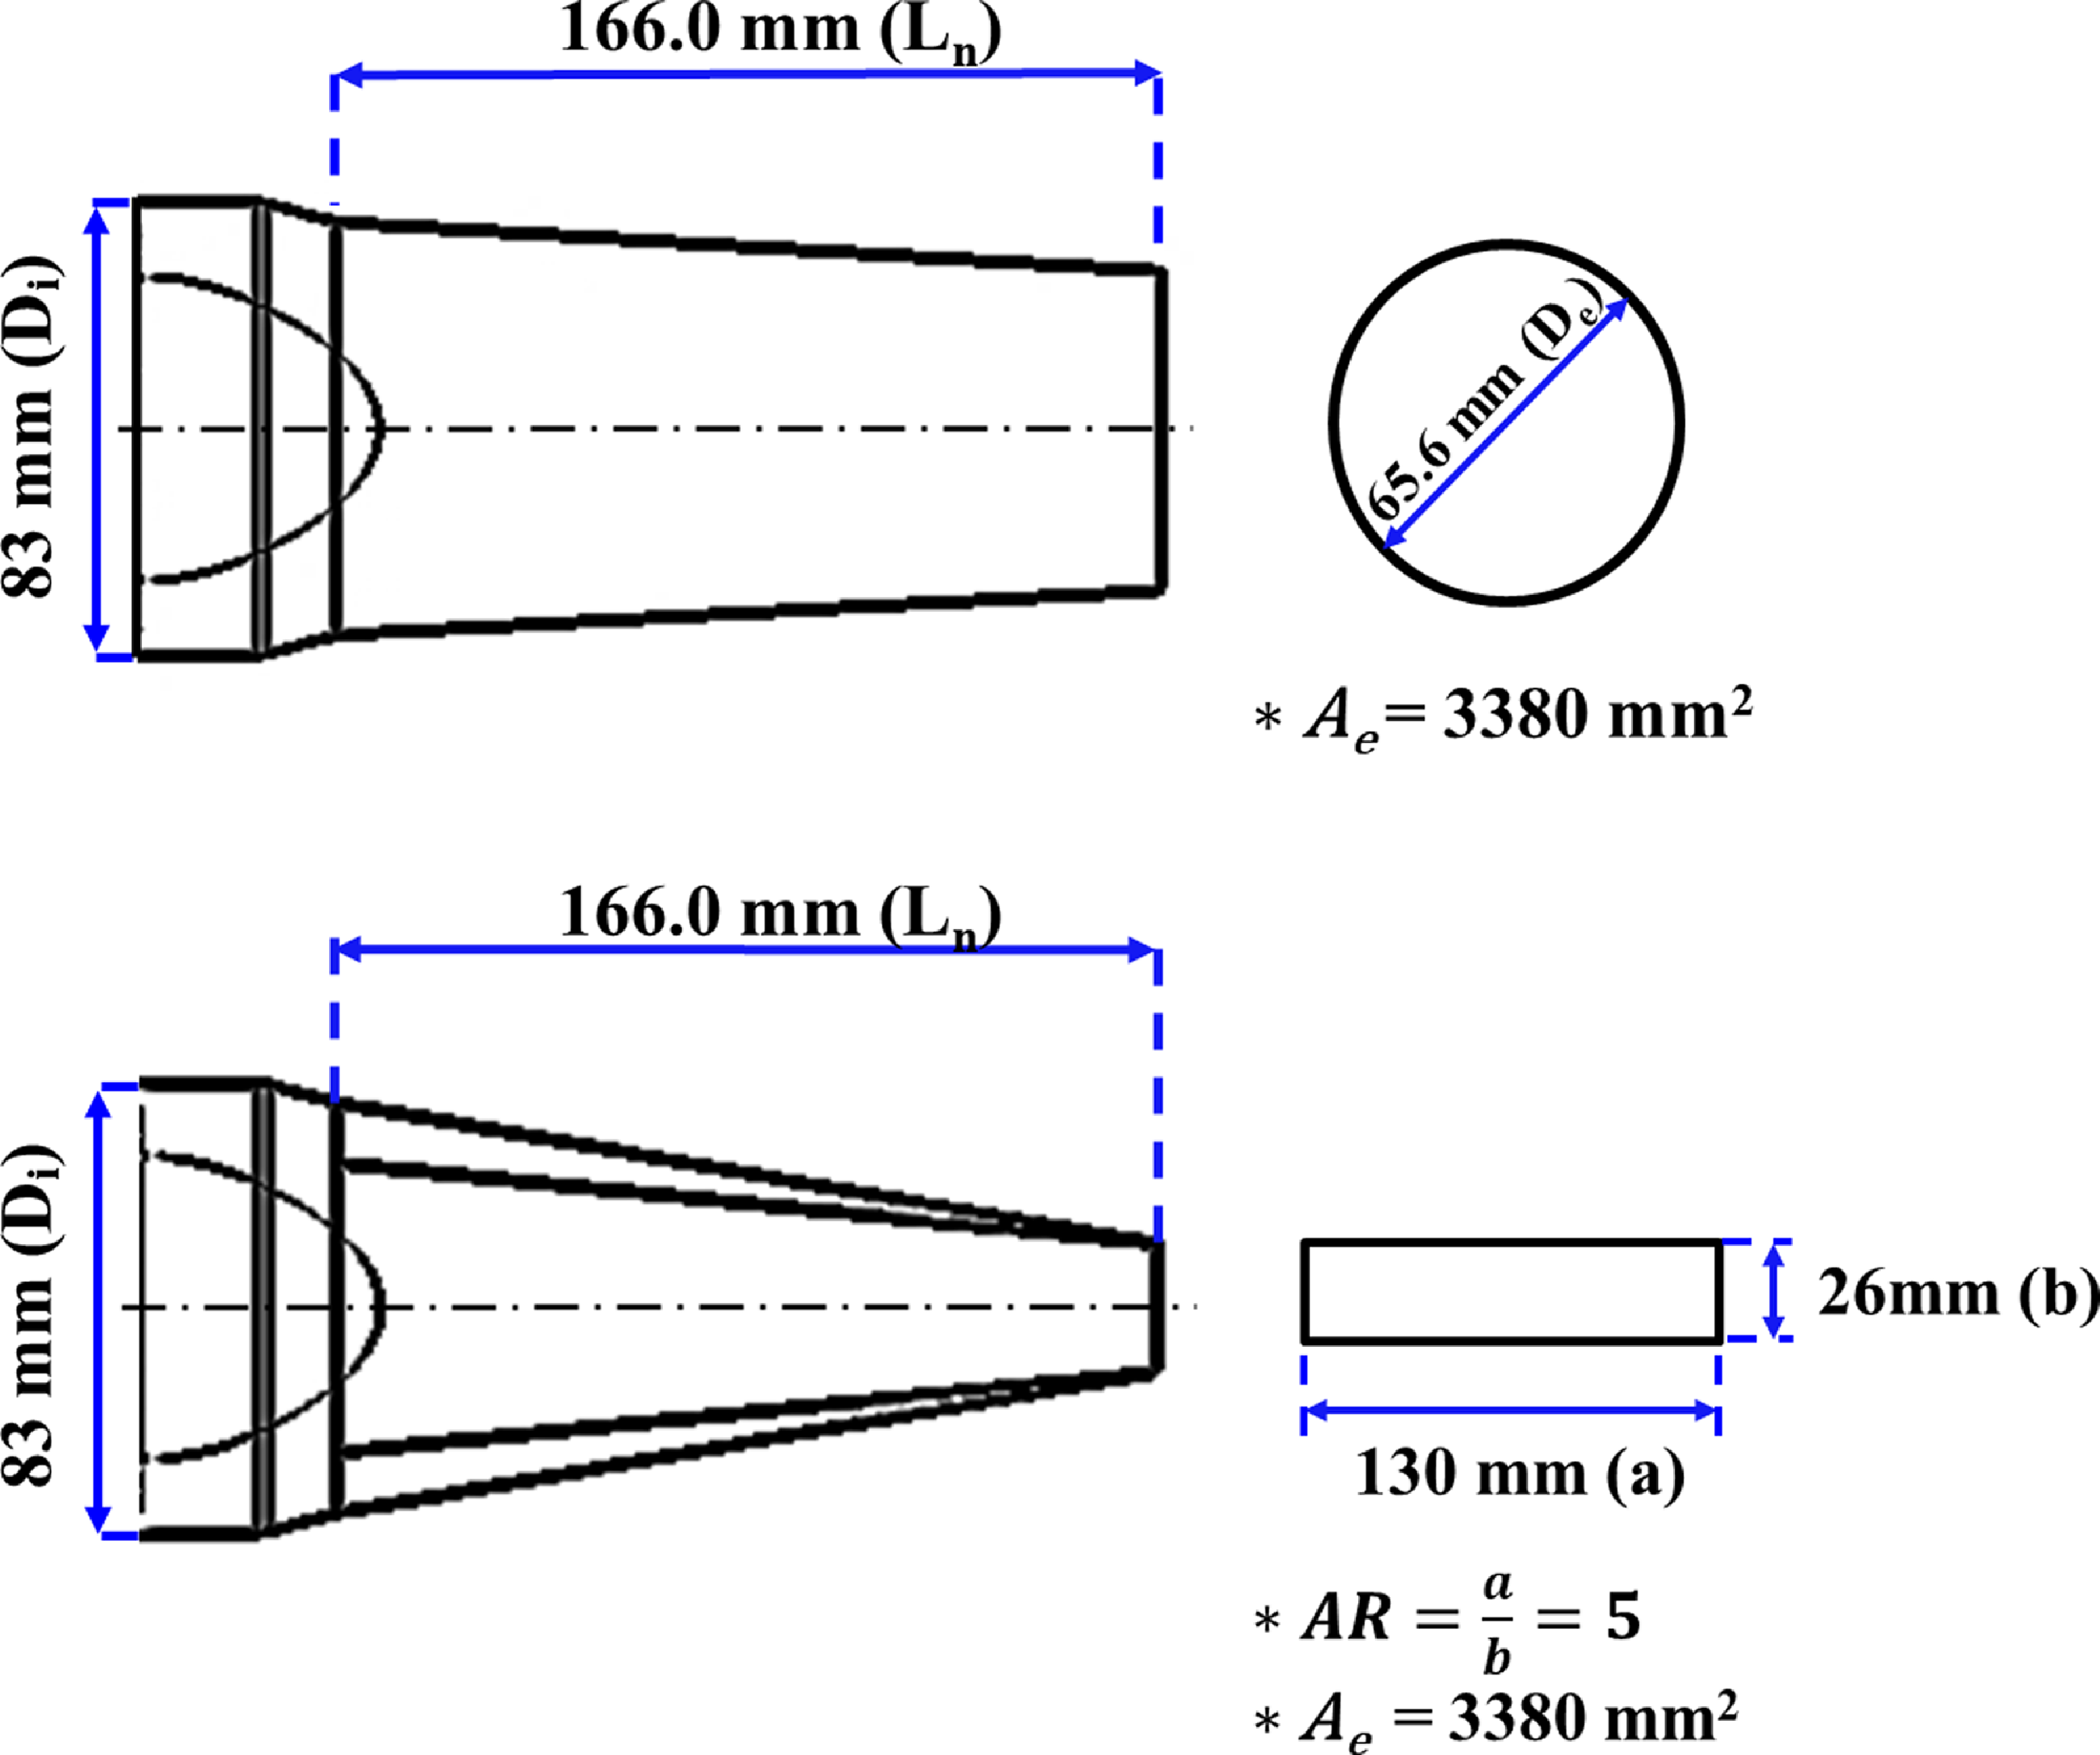
Figure 7. Layout of circular and rectangular nozzle.
2.3 Numerical analysis technique
The STAR CCM+ software was used for flow-field analysis. Computational fluid governing equations in the analysis include mass, momentum, energy conservation and species transport equations. The governing equations are as follows [Reference Pan, Zhang and Shan13]:
where
![]() $\rho $
is the gas density,
$\rho $
is the gas density,
![]() $\vec v$
is the velocity vector, p is static pressure,
$\vec v$
is the velocity vector, p is static pressure,
![]() $\tau $
is the stress tensor, E is total energy and
$\tau $
is the stress tensor, E is total energy and
![]() ${\lambda _{eff}}$
is effective conductivity (
${\lambda _{eff}}$
is effective conductivity (
![]() ${\lambda _{eff}} = \lambda + {\lambda _t},\;$
where
${\lambda _{eff}} = \lambda + {\lambda _t},\;$
where
![]() ${\lambda _t}$
is turbulent thermal conductivity), T is the temperature,
${\lambda _t}$
is turbulent thermal conductivity), T is the temperature,
![]() ${h_j}$
and
${h_j}$
and
![]() ${\vec J_j}$
are the enthalpy and diffusion flux for the species and Y
j
is the local mass fraction of species, respectively. The pressure-velocity coupled analysis employs a flow technique that computes velocity and pressure at the same time. The numerical finite volume method was used to solve the governing equation. Time differentiation was performed using a second-order implicit Euler scheme. The advection and diffusion terms, which are the spatial terms of the governing equation, were discretised according to an upwind scheme to reduce analytical costs. Considering the compressibility impact, the turbulence model used the k-ω model (k-ω SST), with the turbulent Schmidt number and Prandtl number set to 0.7 and 0.85, respectively. The y+ wall function technique is used during the implementation of the surface’s boundary layer. The same solution domain was selected for circular and rectangular nozzles, which were designed to be symmetrical about the Z-axis, and grid generation was performed for half of the nozzle shape. The computational domain includes the freestream and downstream exit zones, equivalent to 22De
${\vec J_j}$
are the enthalpy and diffusion flux for the species and Y
j
is the local mass fraction of species, respectively. The pressure-velocity coupled analysis employs a flow technique that computes velocity and pressure at the same time. The numerical finite volume method was used to solve the governing equation. Time differentiation was performed using a second-order implicit Euler scheme. The advection and diffusion terms, which are the spatial terms of the governing equation, were discretised according to an upwind scheme to reduce analytical costs. Considering the compressibility impact, the turbulence model used the k-ω model (k-ω SST), with the turbulent Schmidt number and Prandtl number set to 0.7 and 0.85, respectively. The y+ wall function technique is used during the implementation of the surface’s boundary layer. The same solution domain was selected for circular and rectangular nozzles, which were designed to be symmetrical about the Z-axis, and grid generation was performed for half of the nozzle shape. The computational domain includes the freestream and downstream exit zones, equivalent to 22De
![]() $ \times $
35De
$ \times $
35De
![]() $ \times $
130De. To improve the grid quality, octahedral grids structured as three blocks were generated, as illustrated in Fig. 8. The grids were concentrated, and considerable attention was paid to smooth generation in accordance with the diameter of the high-velocity region of the generated exhaust gas. The equation of the Reynolds number, 1.27
$ \times $
130De. To improve the grid quality, octahedral grids structured as three blocks were generated, as illustrated in Fig. 8. The grids were concentrated, and considerable attention was paid to smooth generation in accordance with the diameter of the high-velocity region of the generated exhaust gas. The equation of the Reynolds number, 1.27
![]() $ \times $
105, is as follows:
$ \times $
105, is as follows:
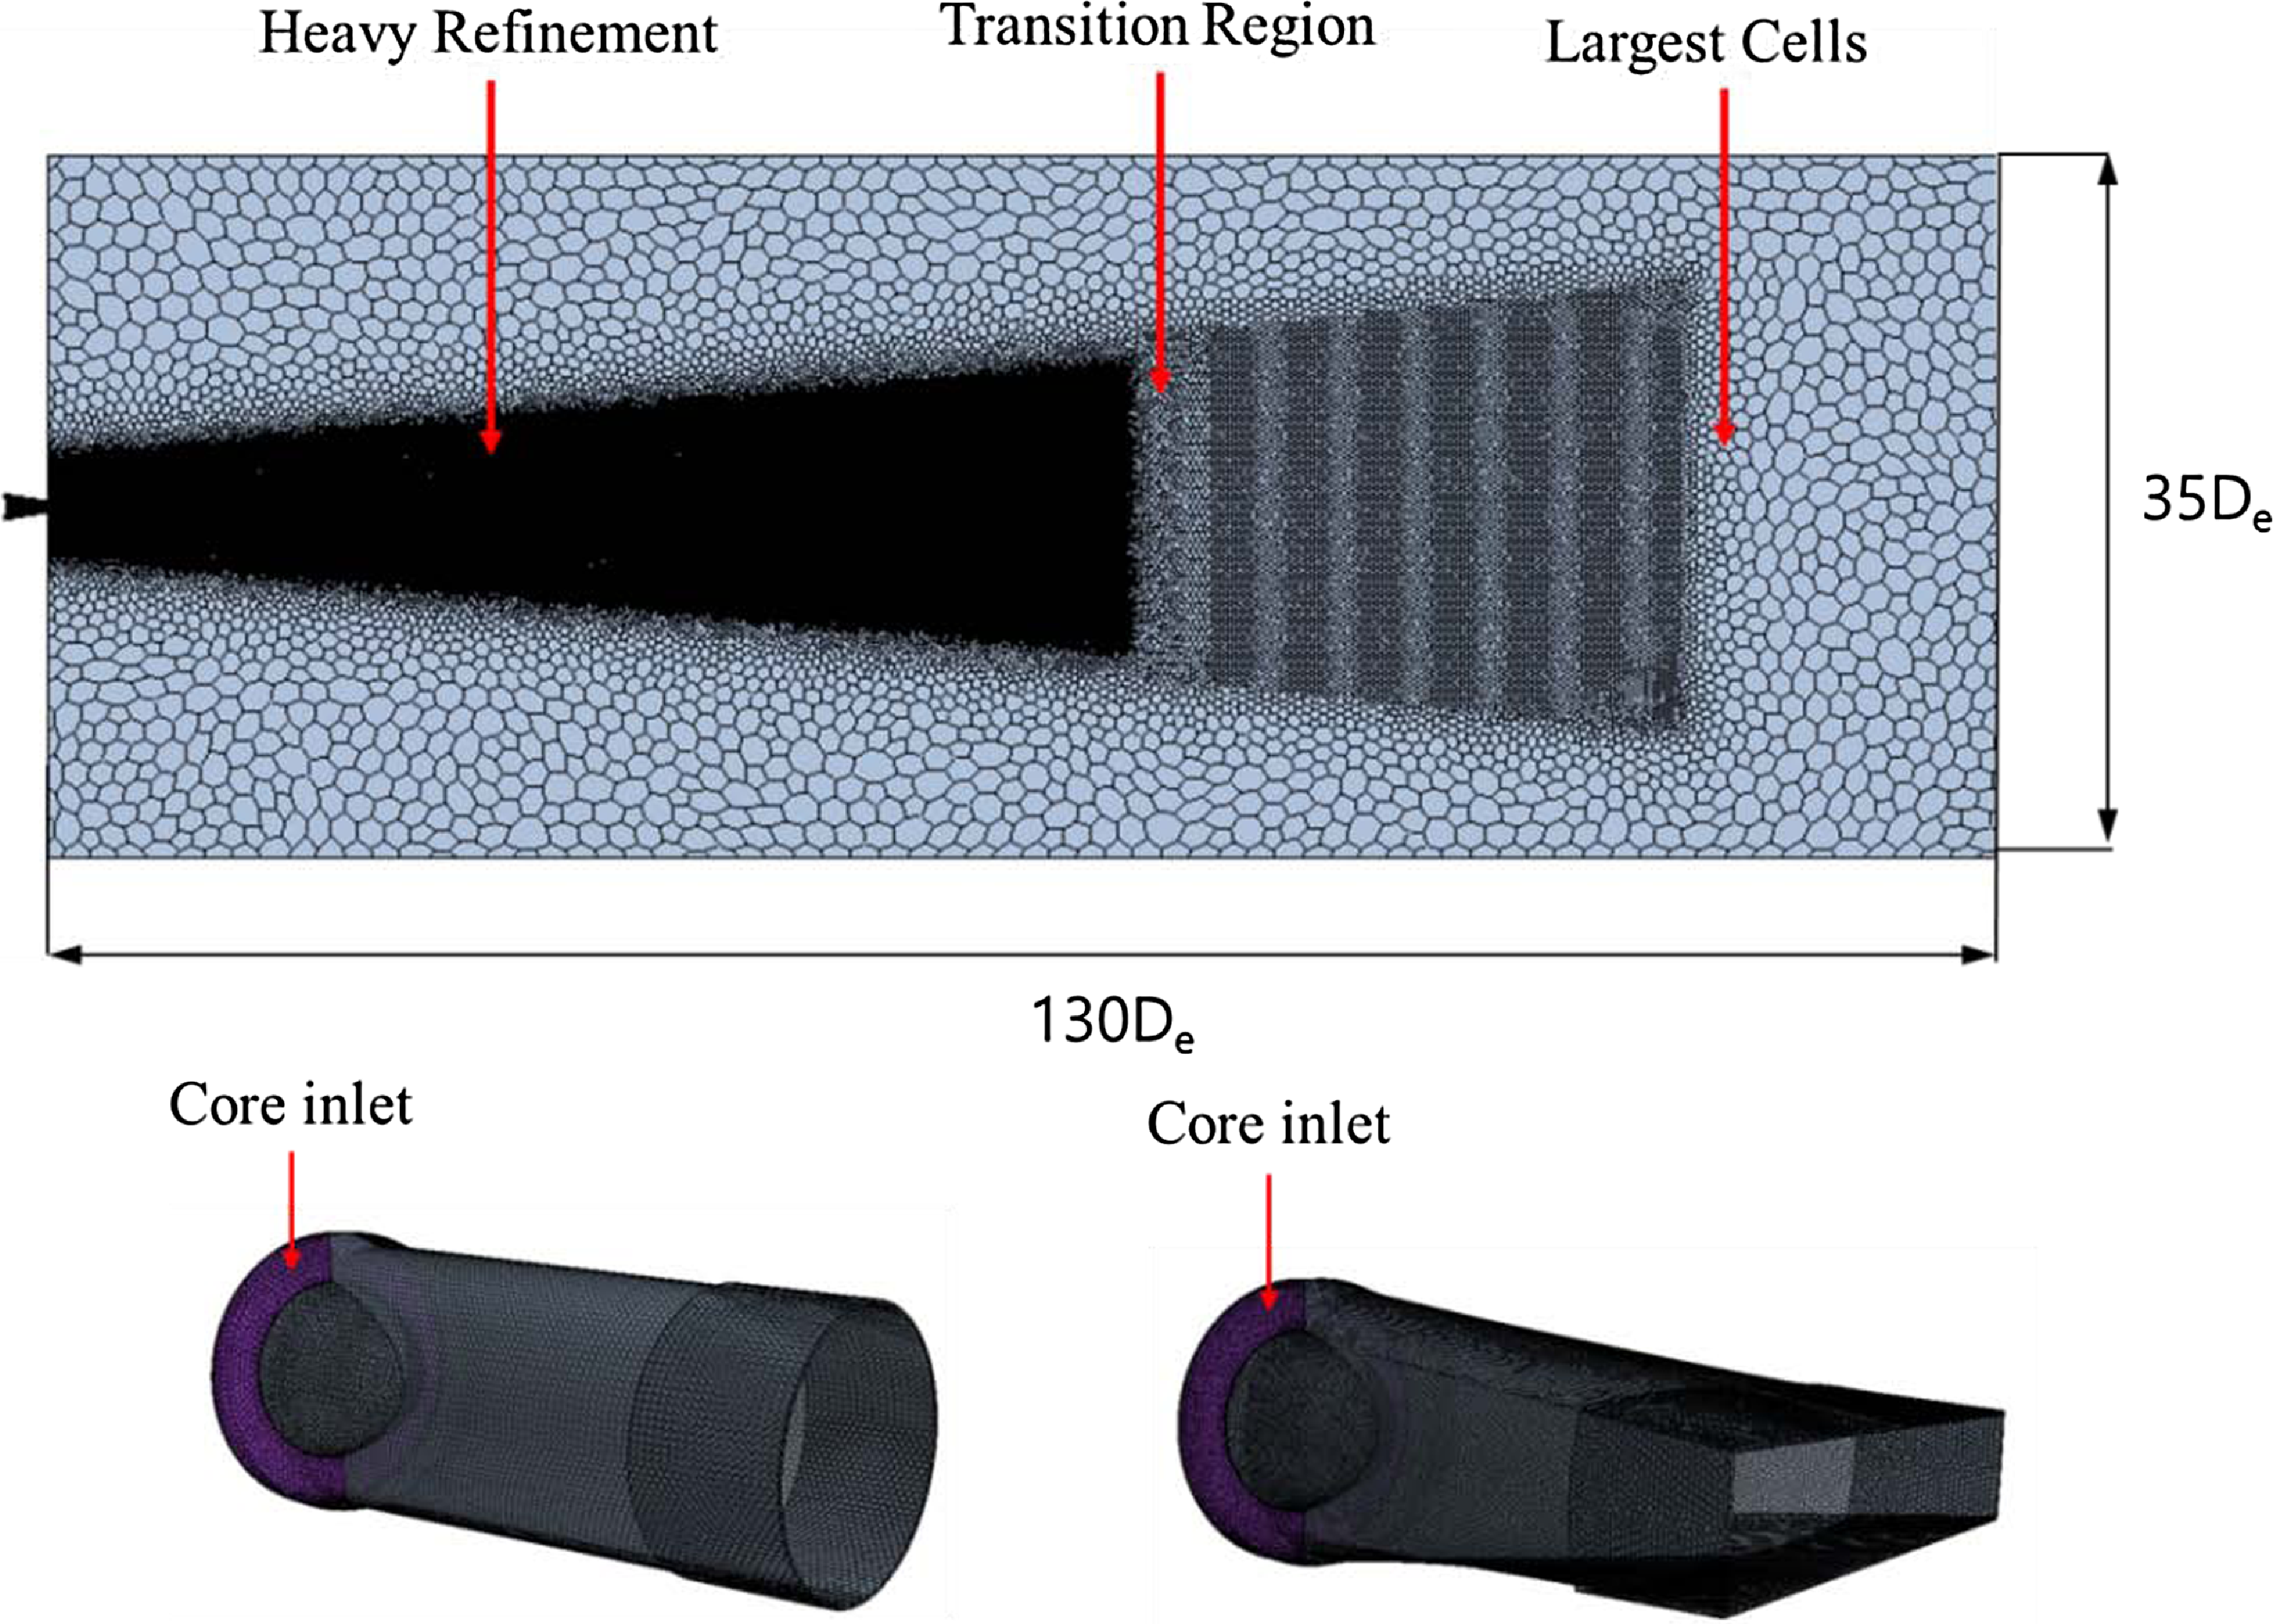
Figure 8. Global computational grid.
The values used to determine the Reynolds number are density (0.52kg/m3), velocity (116m/s), viscosity (3.09
![]() ${\rm{\;}} \times $
10−5
${\rm{\;}} \times $
10−5
![]() ${\rm{Pa}} \cdot {\rm{s}}$
) and diameter (65.6mm). The first cell height of the grid along the nozzle wall was set to approximately y+
${\rm{Pa}} \cdot {\rm{s}}$
) and diameter (65.6mm). The first cell height of the grid along the nozzle wall was set to approximately y+
![]() $ \lt $
1. The thrust values that were acquired during experiments were compared, and the variations in internal pressure and temperature were evaluated; the final grid size was 2.6
$ \lt $
1. The thrust values that were acquired during experiments were compared, and the variations in internal pressure and temperature were evaluated; the final grid size was 2.6
![]() $ \times $
106 cells. The initial grid’s height is 0.00135mm, and 13 prism layers are present. The results of the comparison of the internal pressure and temperature of five models with varied numbers of grids, which are shown in Fig. 9, validate grid independence. Grid 4’s pressure and temperature were the same as those of Grid 5, indicating the grid’s independence. Grid 4 and Grid 5 were analysed for 35 and 42h, respectively, and Grid 4 was selected as a compromise between computational resources and accuracy. The findings of Grid 4 analysis were then compared to the experimental thrust and flow measurements, and there was a 3.5% discrepancy between the experimental and analytical thrust values. Furthermore, the investigation revealed that the exhaust gas flow rate of the circular and rectangular nozzles was 0.20kg/s, and the average air flow rate value of the experiment was 0.22kg/s. Furthermore, the outcomes of the comparison of the experimental and analytical data at a site 0.2De distant from the nozzle exit are provided in Fig. 10, which further verifies the external temperature and velocity. It was observed that the temperature and velocity did not match precisely when comparing the experiment and analysis based on the distance of the Y-axis (major axis). However, the value size and distribution pattern matched to a certain extent. The analytical model is determined to be reliable once the thrust, flow rate, velocity and temperature at the nozzle exit are verified. Thus, this confirmed the validity of the turbine outlet boundary condition and analysis model established through experiment measurement. The total pressure and temperature of the nozzle core gas inlet condition are 106.275kPa and 410°C, respectively. The set inlet condition value was chosen based on the pressure and temperature that were measured during the experiment, and it is the result of the correction of the boundary condition value while comparing the thrust result and the flow rate value. Table 2 shows the analytical boundary conditions. Based on the assumption that the fuel (C11H22) is entirely consumed, the overall chemical equation of the fuel is as follows:
$ \times $
106 cells. The initial grid’s height is 0.00135mm, and 13 prism layers are present. The results of the comparison of the internal pressure and temperature of five models with varied numbers of grids, which are shown in Fig. 9, validate grid independence. Grid 4’s pressure and temperature were the same as those of Grid 5, indicating the grid’s independence. Grid 4 and Grid 5 were analysed for 35 and 42h, respectively, and Grid 4 was selected as a compromise between computational resources and accuracy. The findings of Grid 4 analysis were then compared to the experimental thrust and flow measurements, and there was a 3.5% discrepancy between the experimental and analytical thrust values. Furthermore, the investigation revealed that the exhaust gas flow rate of the circular and rectangular nozzles was 0.20kg/s, and the average air flow rate value of the experiment was 0.22kg/s. Furthermore, the outcomes of the comparison of the experimental and analytical data at a site 0.2De distant from the nozzle exit are provided in Fig. 10, which further verifies the external temperature and velocity. It was observed that the temperature and velocity did not match precisely when comparing the experiment and analysis based on the distance of the Y-axis (major axis). However, the value size and distribution pattern matched to a certain extent. The analytical model is determined to be reliable once the thrust, flow rate, velocity and temperature at the nozzle exit are verified. Thus, this confirmed the validity of the turbine outlet boundary condition and analysis model established through experiment measurement. The total pressure and temperature of the nozzle core gas inlet condition are 106.275kPa and 410°C, respectively. The set inlet condition value was chosen based on the pressure and temperature that were measured during the experiment, and it is the result of the correction of the boundary condition value while comparing the thrust result and the flow rate value. Table 2 shows the analytical boundary conditions. Based on the assumption that the fuel (C11H22) is entirely consumed, the overall chemical equation of the fuel is as follows:
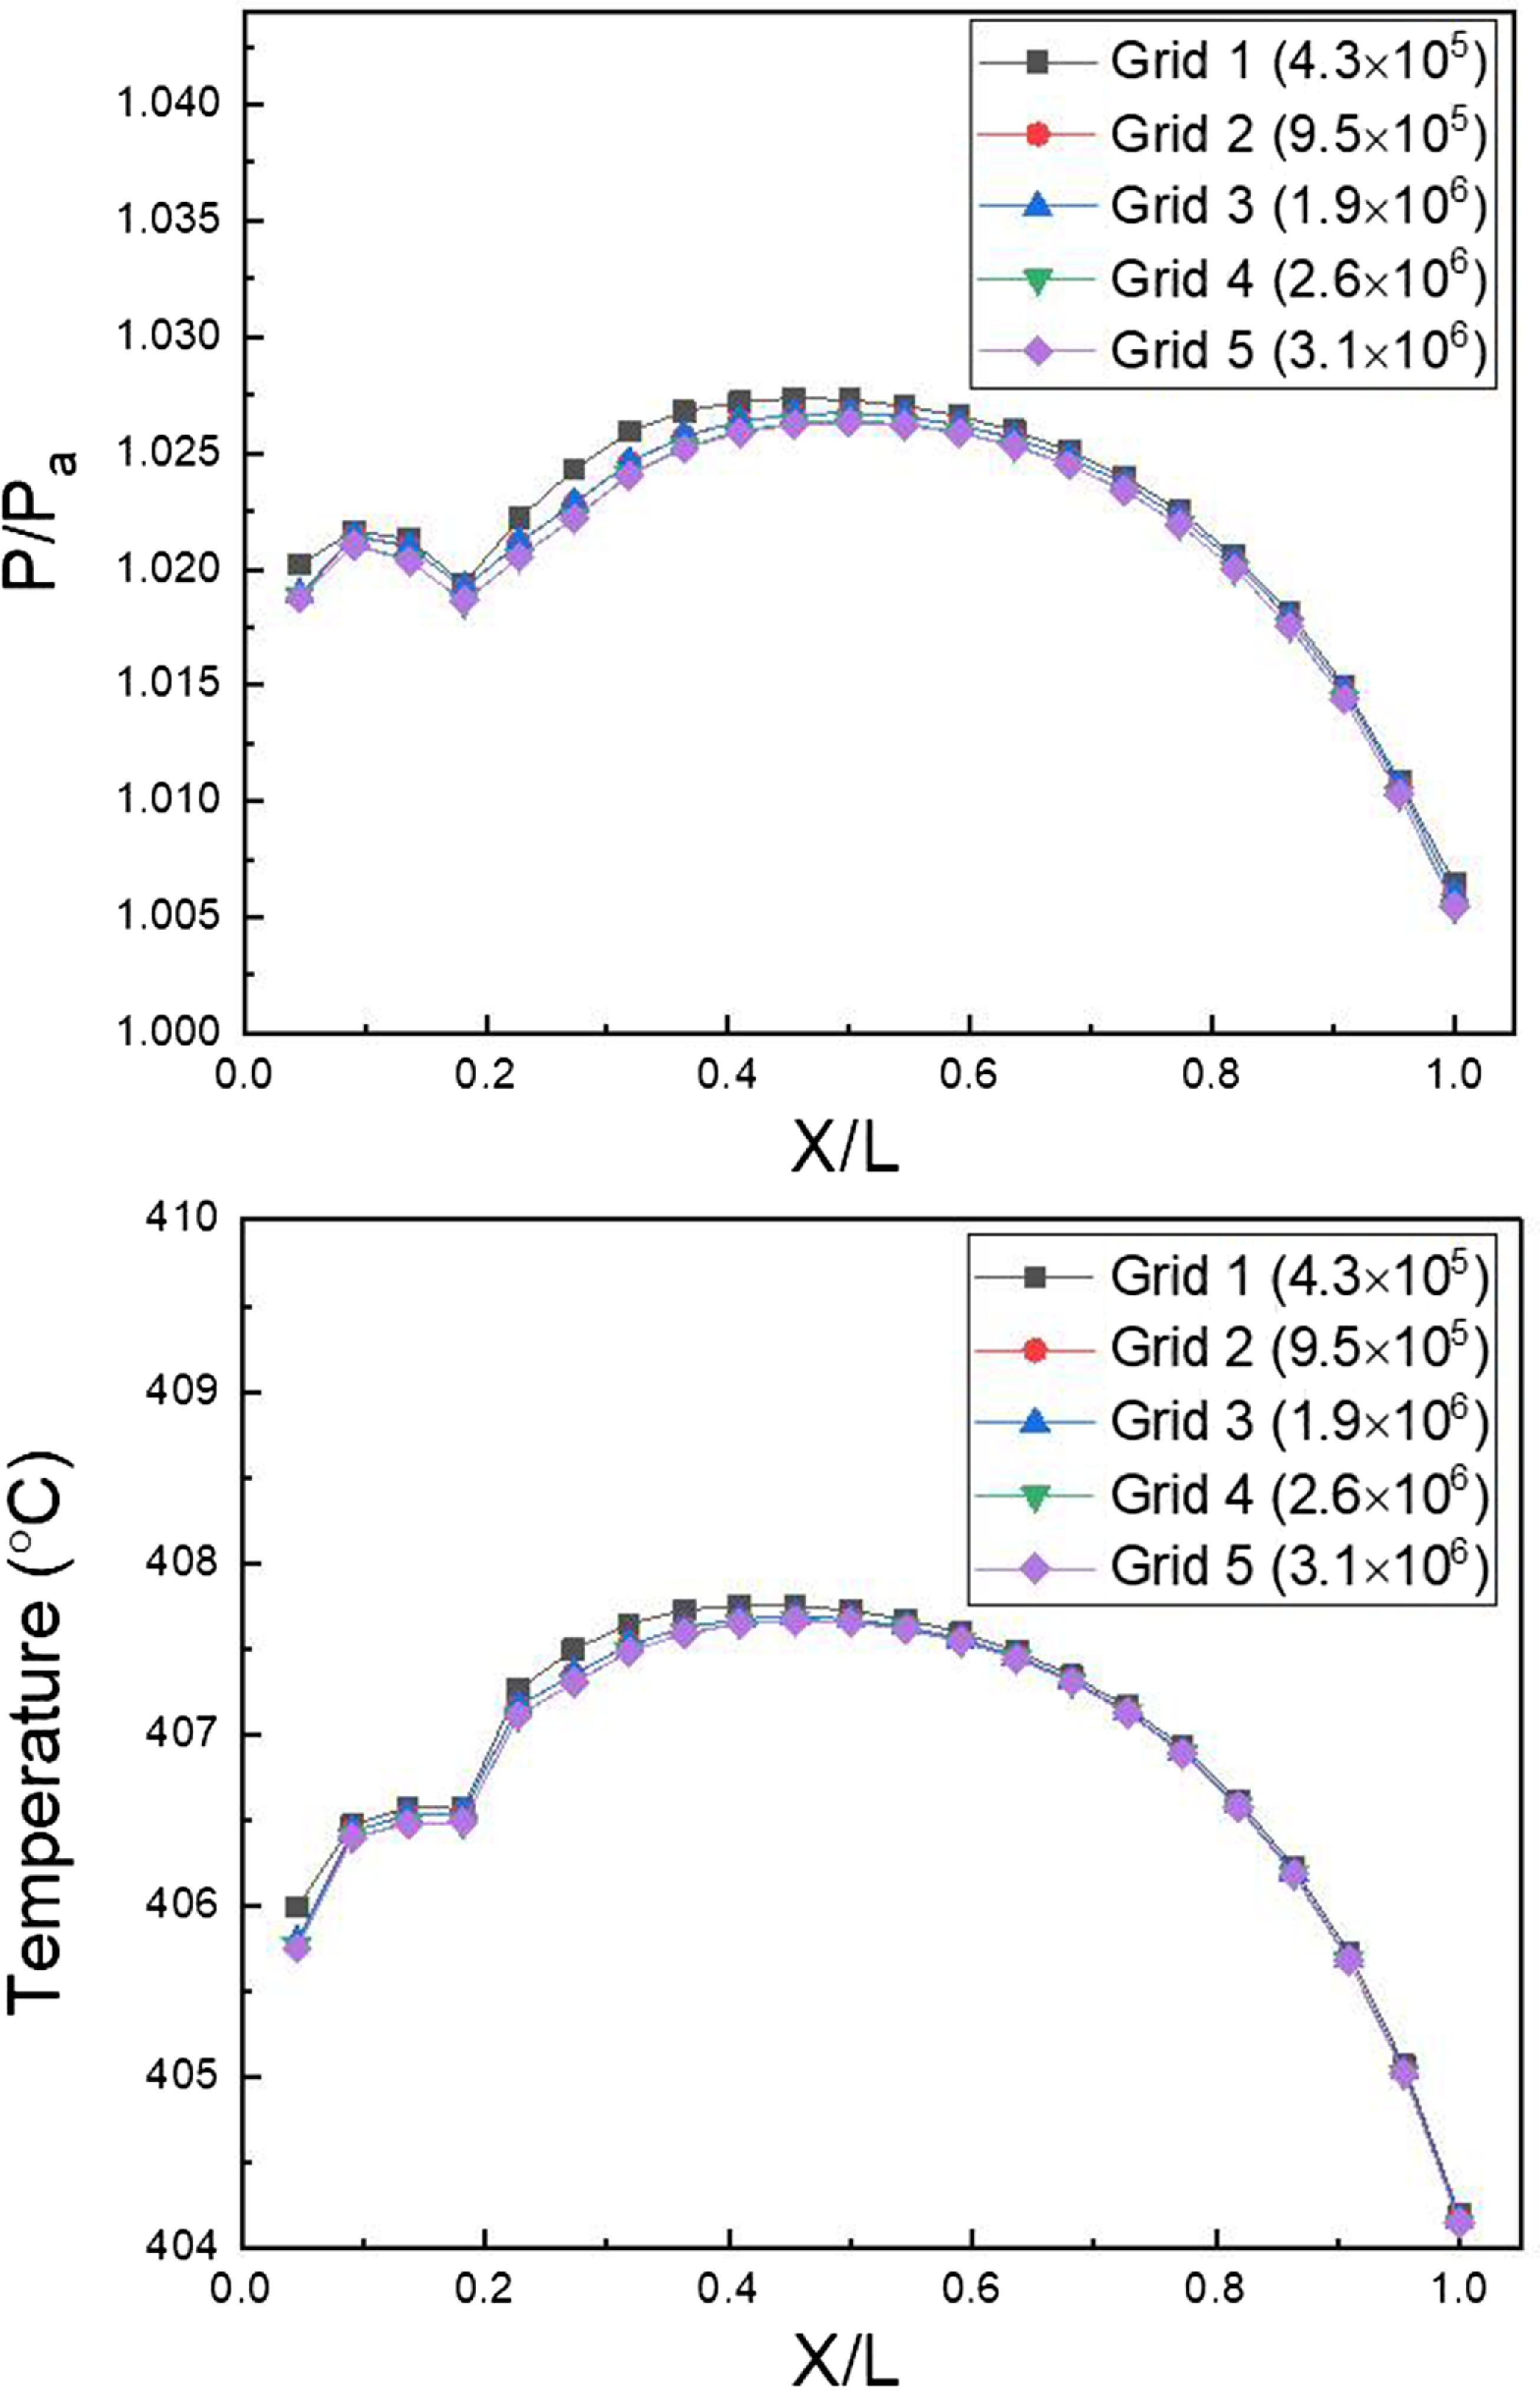
Figure 9. Plume pressure and temperature along nozzle length ratio.
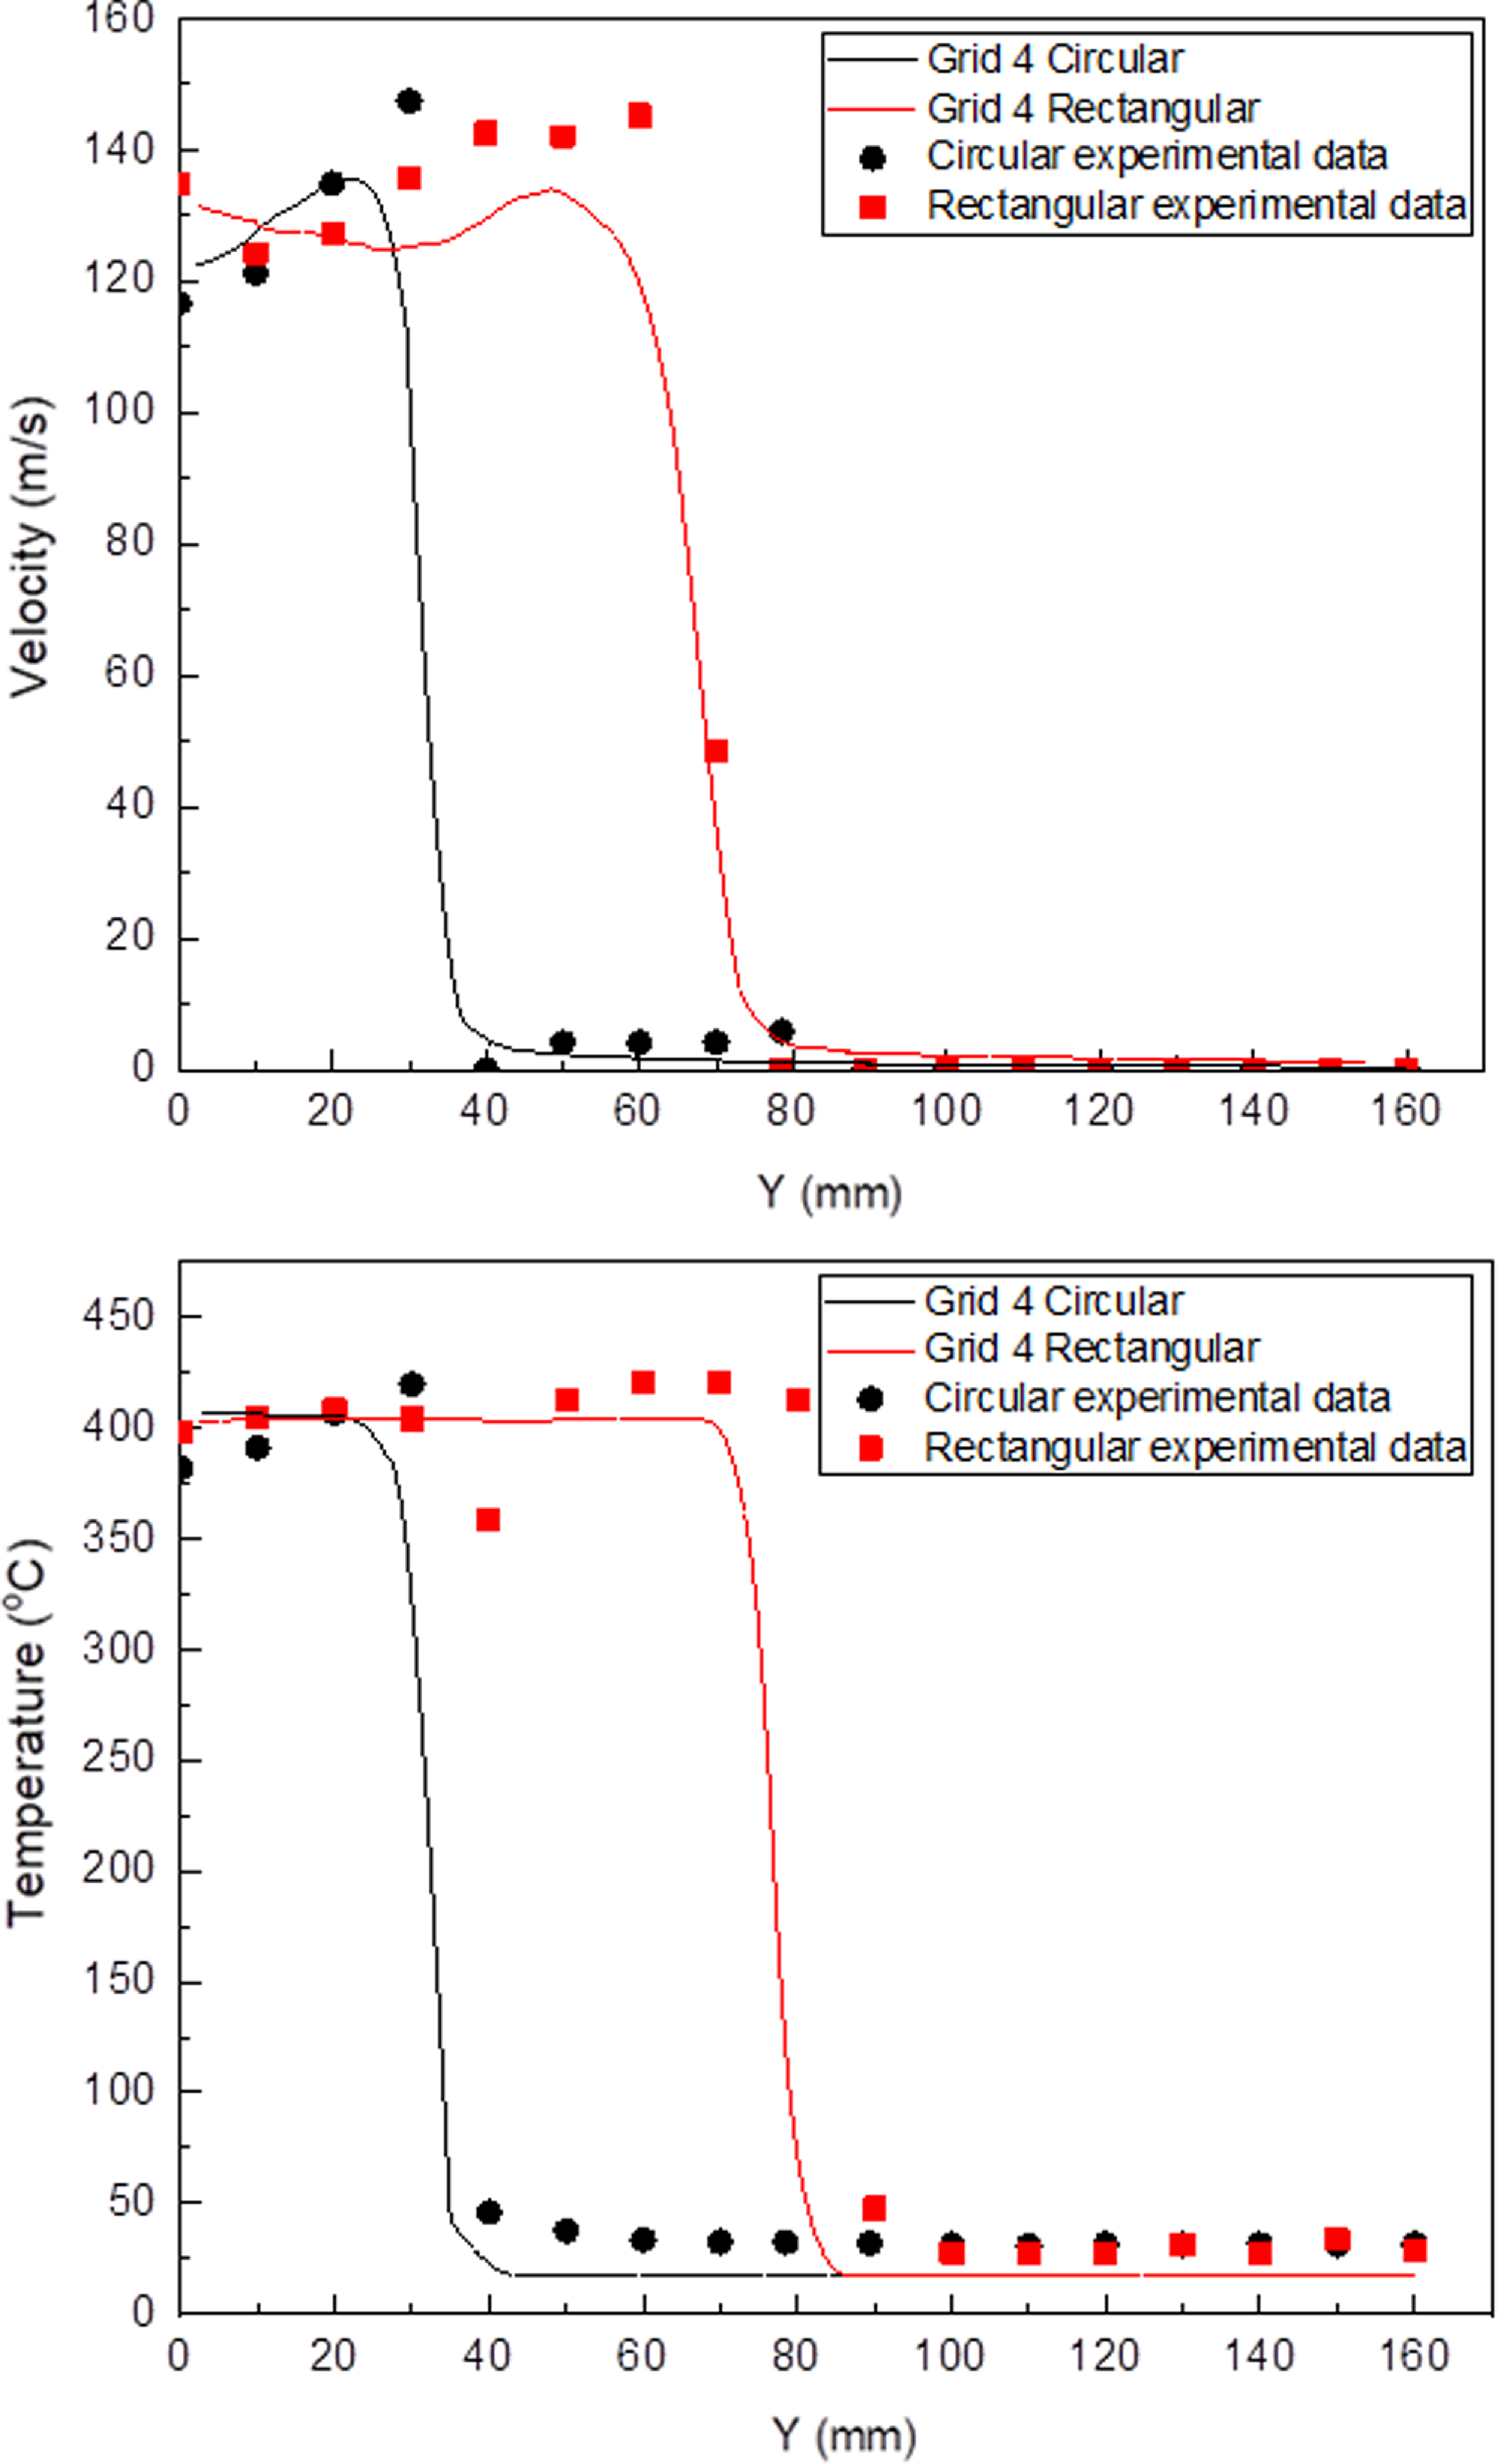
Figure 10. Plume velocity and temperature along y axis direction.
The mole fractions of exhaust gas produced by combustion were 13.0% for carbon dioxide (CO2) and 13.0% for water vapour (H2O). Nitrogen (N2) was composed of chemical species with a mole fraction of 74.0%. In addition, the atmospheric component was assumed to be the same as the exterior freestream. Table 3 shows the temperature-dependent properties of the working fluid [Reference Zografos, Martin and Sunderland14].
3.0 Experimental results
3.1 Engine performance
The engine performance test was repeated three times for each case once the circular and rectangular nozzles were mounted. Table 4 summarizes the results of the performance tests. After the circular nozzle is mounted, it was observed that the measured average air mass flow was 0.22kg/s and the thrust was 25.72N. When the rectangular nozzle was used, the average air mass flow observed was 0.22kg/s and the thrust was 26.02N. The measured fuel consumption rate was 2.82g/s for the circular nozzle and 2.93g/s for the rectangular nozzle. The TSFC, which indicates the fuel consumption rate per unit thrust, was 0.109g/sec/N when a circular nozzle was used and 0.113g/sec/N when a rectangular nozzle was used. Thus, the value of the case where the rectangular nozzle was installed was greater by approximately 3.6% than that where the circular nozzle was installed. This shows that the fuel consumption is slightly greater when the rectangular nozzle is used to provide the same thrust. The average nozzle exit temperatures (T t 6) for the circular and rectangular nozzles were 353.23°C and 354.10°C, respectively. As a result, the value for the case with the rectangular nozzle is greater by approximately 0.53%. The jet’s average total pressure measured at the outlet of the circular nozzle was 106.17kPa, and that measured at the outlet of the rectangular nozzle was 105.57kPa. The overall exhaust gas pressure at the rectangular nozzle’s outlet is lower than that of the circular nozzle by approximately 0.56%. In other words, the pressure loss of the injection jet formed inside the rectangular nozzle was larger than that in the circular nozzle. This is because the surface area increases as the shape changes from circular to rectangular, increasing the frictional force.
Table 2. Boundary conditions
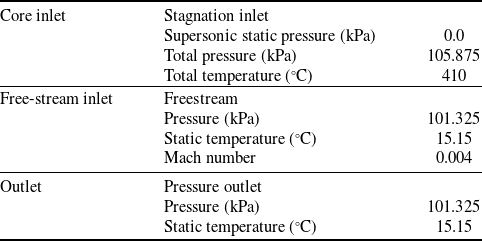
Table 3. Polynomial coefficients of temperature dependent property [Reference Zografos, Martin and Sunderland14]
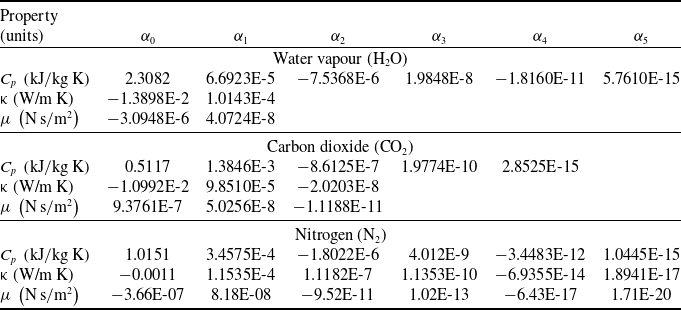
*Property =
![]() ${\alpha _0} + {\alpha _1} \cdot T + {\alpha _2} \cdot {T^2} + {\alpha _3} \cdot {T^3} + {\alpha _4} \cdot {T^4} + {\alpha _5} \cdot {T^5}$
.
${\alpha _0} + {\alpha _1} \cdot T + {\alpha _2} \cdot {T^2} + {\alpha _3} \cdot {T^3} + {\alpha _4} \cdot {T^4} + {\alpha _5} \cdot {T^5}$
.
Table 4. Engine performance results

3.2 Infrared signature of exhaust plume
Figure 11(a) shows an infrared thermal image that was obtained when a circular nozzle was mounted, while Fig. 11(b) shows an infrared thermal image measured in the 0° direction when a rectangular nozzle was mounted. Figure 11(c) shows the infrared thermal image measured in the 90o direction when a rectangular nozzle was mounted. When the circular nozzle was mounted, the length of the green infrared signatures (radiance = 2.3
![]() $ \times $
10−3
$ \times $
10−3
![]() ${\rm{W}} \cdot {\rm{s}}{{\rm{r}}^{ - 1}} \cdot {\rm{m}}{{\rm{m}}^{ - 2}}$
) was 3De, which is longer than the length of when the rectangular nozzle was mounted (2De) by about 1De, as shown in Fig. 11(a) and (b). Furthermore, the length of the infrared signature (radiance = 2.1
${\rm{W}} \cdot {\rm{s}}{{\rm{r}}^{ - 1}} \cdot {\rm{m}}{{\rm{m}}^{ - 2}}$
) was 3De, which is longer than the length of when the rectangular nozzle was mounted (2De) by about 1De, as shown in Fig. 11(a) and (b). Furthermore, the length of the infrared signature (radiance = 2.1
![]() $ \times $
10−3
$ \times $
10−3
![]() ${\rm{W}} \cdot {\rm{s}}{{\rm{r}}^{ - 1}} \cdot {\rm{m}}{{\rm{m}}^{ - 2}}$
), which is exhibited in blue, is roughly 6De, which is greater than that when a rectangular nozzle is installed (4De) by approximately 2De. Thus, when the rectangular nozzle is used, the infrared signature emitted from the exhaust plume becomes smaller as the distance from the nozzle exit increases than when the circular nozzle is used. In the case of a rectangular nozzle, from the comparison of Fig. 11(b) and (c), it was observed that the infrared signature varies depending on the direction of the infrared signature observation. The infrared signature is less when the rectangular exhaust nozzle is rotated by 90° than when the rectangular exhaust nozzle is installed at 0°.
${\rm{W}} \cdot {\rm{s}}{{\rm{r}}^{ - 1}} \cdot {\rm{m}}{{\rm{m}}^{ - 2}}$
), which is exhibited in blue, is roughly 6De, which is greater than that when a rectangular nozzle is installed (4De) by approximately 2De. Thus, when the rectangular nozzle is used, the infrared signature emitted from the exhaust plume becomes smaller as the distance from the nozzle exit increases than when the circular nozzle is used. In the case of a rectangular nozzle, from the comparison of Fig. 11(b) and (c), it was observed that the infrared signature varies depending on the direction of the infrared signature observation. The infrared signature is less when the rectangular exhaust nozzle is rotated by 90° than when the rectangular exhaust nozzle is installed at 0°.

Figure 11. Plume radiance image: (a) = circular nozzle (b) rectangular nozzle (rotation angle= 0°) (c) rectangular nozzle (rotation angle= 90°).
The infrared signature according to the distance from the nozzle exit is shown in Fig. 12. When a circular nozzle was installed, the infrared signature of the exhaust plume gradually decreased from 2.5
![]() $ \times $
10−3
$ \times $
10−3
![]() ${\rm{W}} \cdot {\rm{s}}{{\rm{r}}^{ - 1}} \cdot {\rm{m}}{{\rm{m}}^{ - 2}}$
at 1De position to 1.97
${\rm{W}} \cdot {\rm{s}}{{\rm{r}}^{ - 1}} \cdot {\rm{m}}{{\rm{m}}^{ - 2}}$
at 1De position to 1.97
![]() $ \times $
10−3
$ \times $
10−3
![]() ${\rm{W}} \cdot {\rm{s}}{{\rm{r}}^{ - 1}} \cdot {\rm{m}}{{\rm{m}}^{ - 2}}$
at 10De position. When the rectangular nozzle is mounted at 0°, the infrared intensity value of the exhaust plume is 2.8
${\rm{W}} \cdot {\rm{s}}{{\rm{r}}^{ - 1}} \cdot {\rm{m}}{{\rm{m}}^{ - 2}}$
at 10De position. When the rectangular nozzle is mounted at 0°, the infrared intensity value of the exhaust plume is 2.8
![]() $ \times $
10−3
$ \times $
10−3
![]() ${\rm{W}} \cdot {\rm{s}}{{\rm{r}}^{ - 1}} \cdot {\rm{m}}{{\rm{m}}^{ - 2}}$
at the 1De position, and it rapidly decreases to 1.86
${\rm{W}} \cdot {\rm{s}}{{\rm{r}}^{ - 1}} \cdot {\rm{m}}{{\rm{m}}^{ - 2}}$
at the 1De position, and it rapidly decreases to 1.86
![]() $ \times $
10−3
$ \times $
10−3
![]() ${\rm{W}} \cdot {\rm{s}}{{\rm{r}}^{ - 1}} \cdot {\rm{m}}{{\rm{m}}^{ - 2}}$
at the 10De position. When a rectangular nozzle is installed at 0° at 10De from the outlet of the exhaust nozzle, the infrared signature is smaller than that when a circular nozzle installed by about 5%.
${\rm{W}} \cdot {\rm{s}}{{\rm{r}}^{ - 1}} \cdot {\rm{m}}{{\rm{m}}^{ - 2}}$
at the 10De position. When a rectangular nozzle is installed at 0° at 10De from the outlet of the exhaust nozzle, the infrared signature is smaller than that when a circular nozzle installed by about 5%.
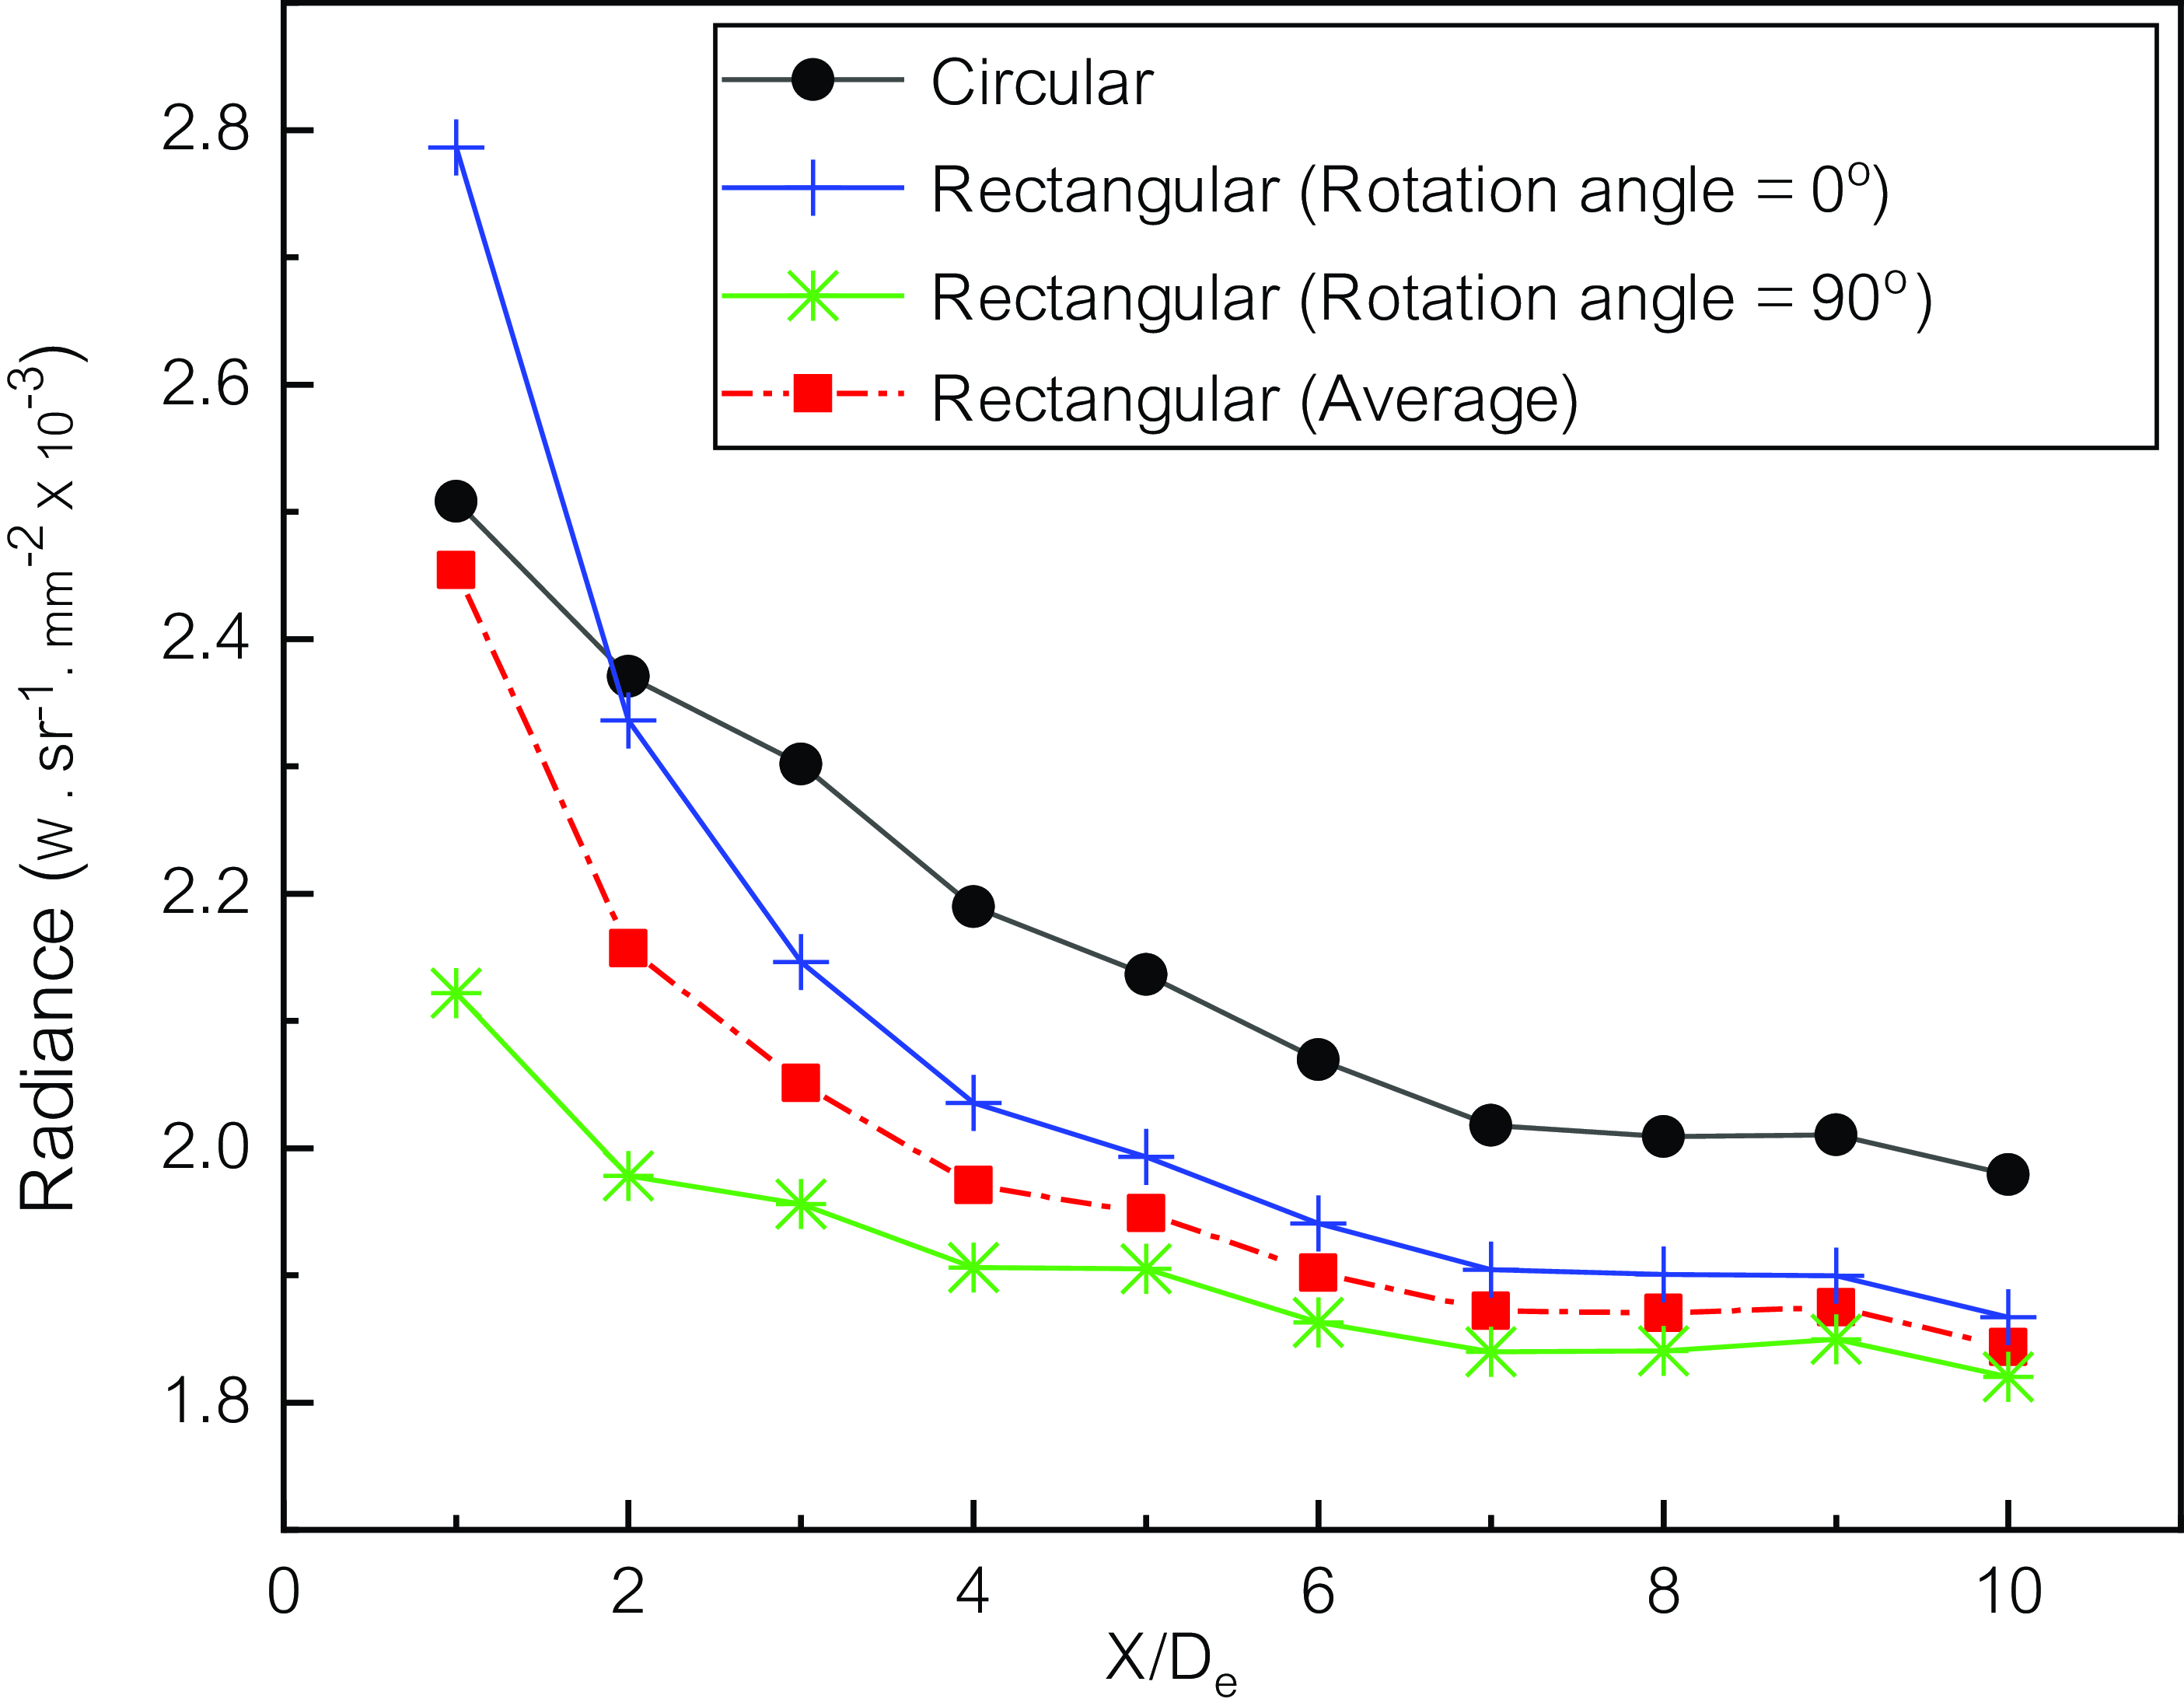
Figure 12. Plume radiance with distance from nozzle exit.
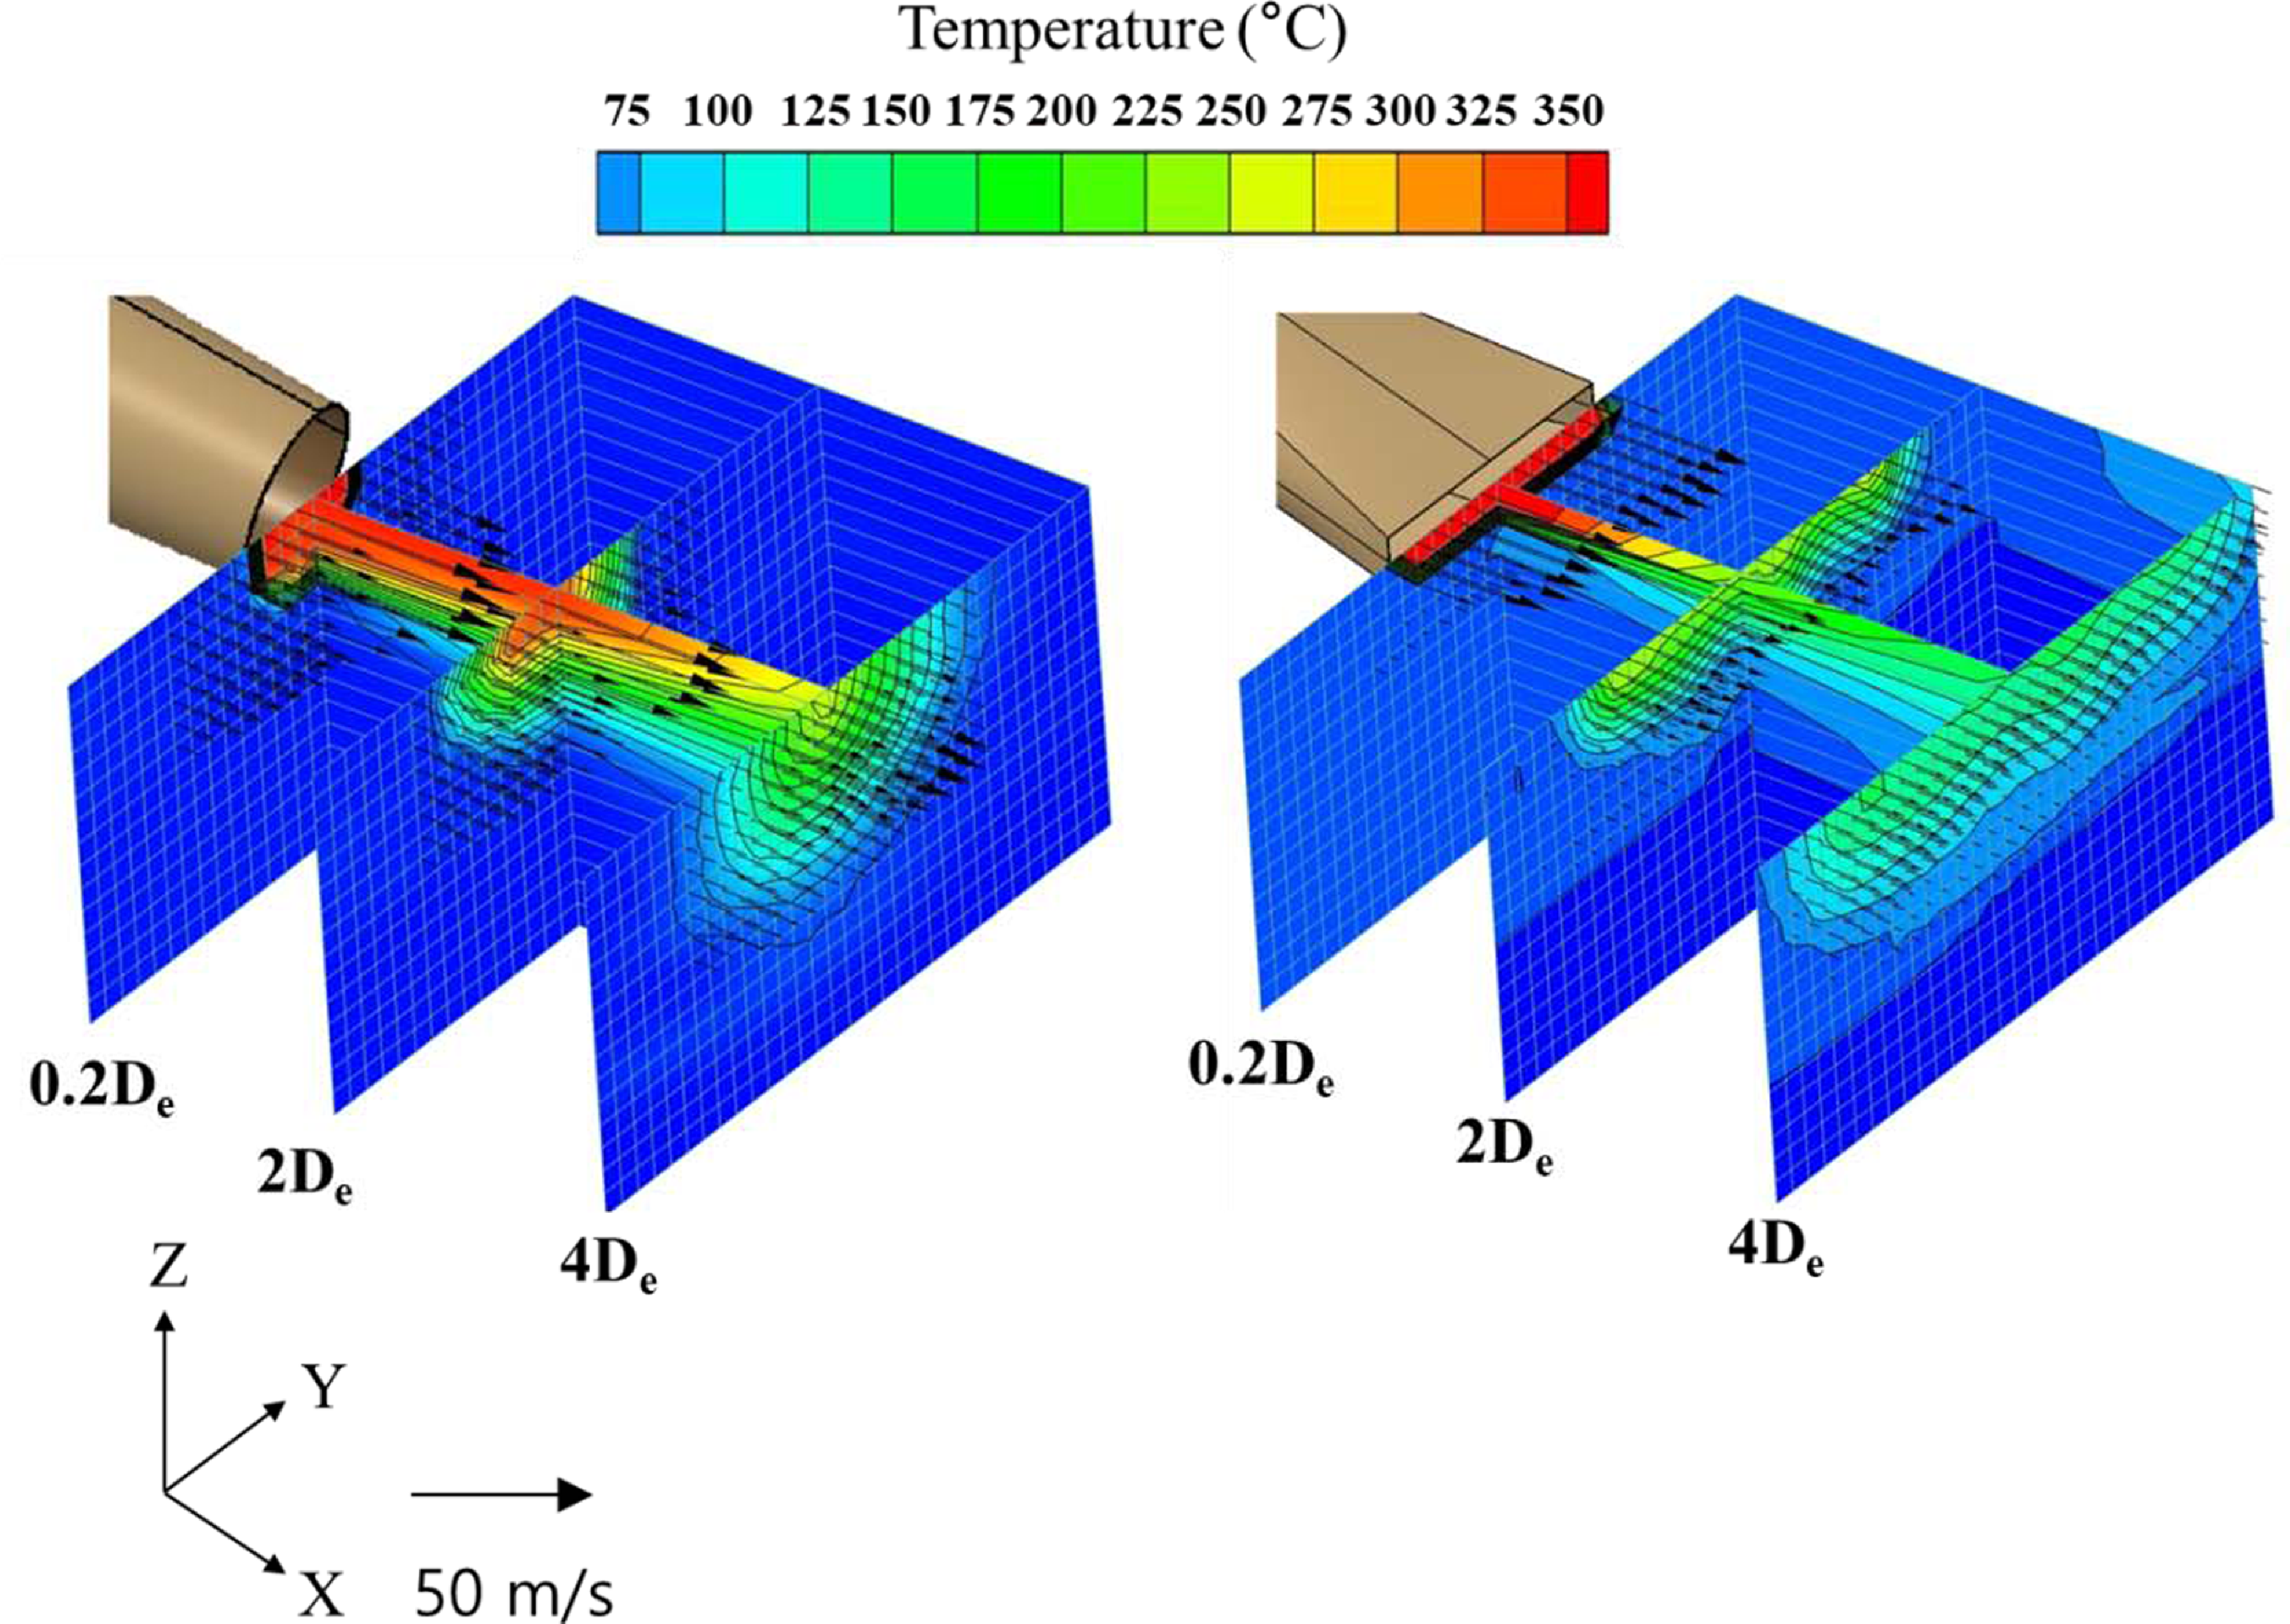
Figure 13. Three-dimensional plume temperature contour and velocity distribution (experiment).
3.3 Temperature and velocity distributions of exhaust plume
The magnitude of the infrared signature emitted from the exhaust plume was smaller when the rectangular nozzle was installed than when the circular nozzle was fitted. The temperature distribution and velocity distribution of the exhaust plume were examined for a detailed understanding of these properties. The temperature and velocity distributions observed in the experiment are depicted as a three-dimensional contour in Fig. 13. From Fig. 13, the overall flow characteristics of the exhaust plume can be easily understood. When a circular nozzle is placed, the magnitudes of temperature and velocity are largest near the centre of the nozzle. Furthermore, it can be proven that it is axially symmetrical and gradually diminishes from the centre of each portion to the outside. When a rectangular nozzle is used, the exhaust plume is emitted to the atmosphere at a relatively uniform rate through the exit of the nozzle. It can be easily understood that when moving away from the nozzle outlet, the velocity of the exhaust plume becomes smaller than that of when a circular nozzle is mounted, but the flow characteristics of a two-dimensional rectangular shape are maintained as they are. When the rectangular nozzle is used, the temperature distribution of the exhaust plume shows a shape similar to that of the velocity distribution. Moreover, the temperature of the exhaust plume decreases greater than when a circular nozzle is used, and the shape of the temperature distribution changes from rectangular to elliptical as the distance from the exit increases. When a rectangular nozzle is used, the exhaust plume extends in the direction toward the Y-axis and spreads over a large cross-sectional area. Thus, mixing with external air may be higher than when the circular nozzle is placed. Furthermore, in the rectangular temperature distribution, the thickness of the temperature boundary layer in the direction of the Z-axis is greater than that in the Y-axis. Therefore, when a rectangular nozzle is mounted, the thickness of the temperature boundary layer varies depending on the measurement position, and accordingly, the size of the infrared signal varies.

Figure 14. Plume temperature profile (experiment).
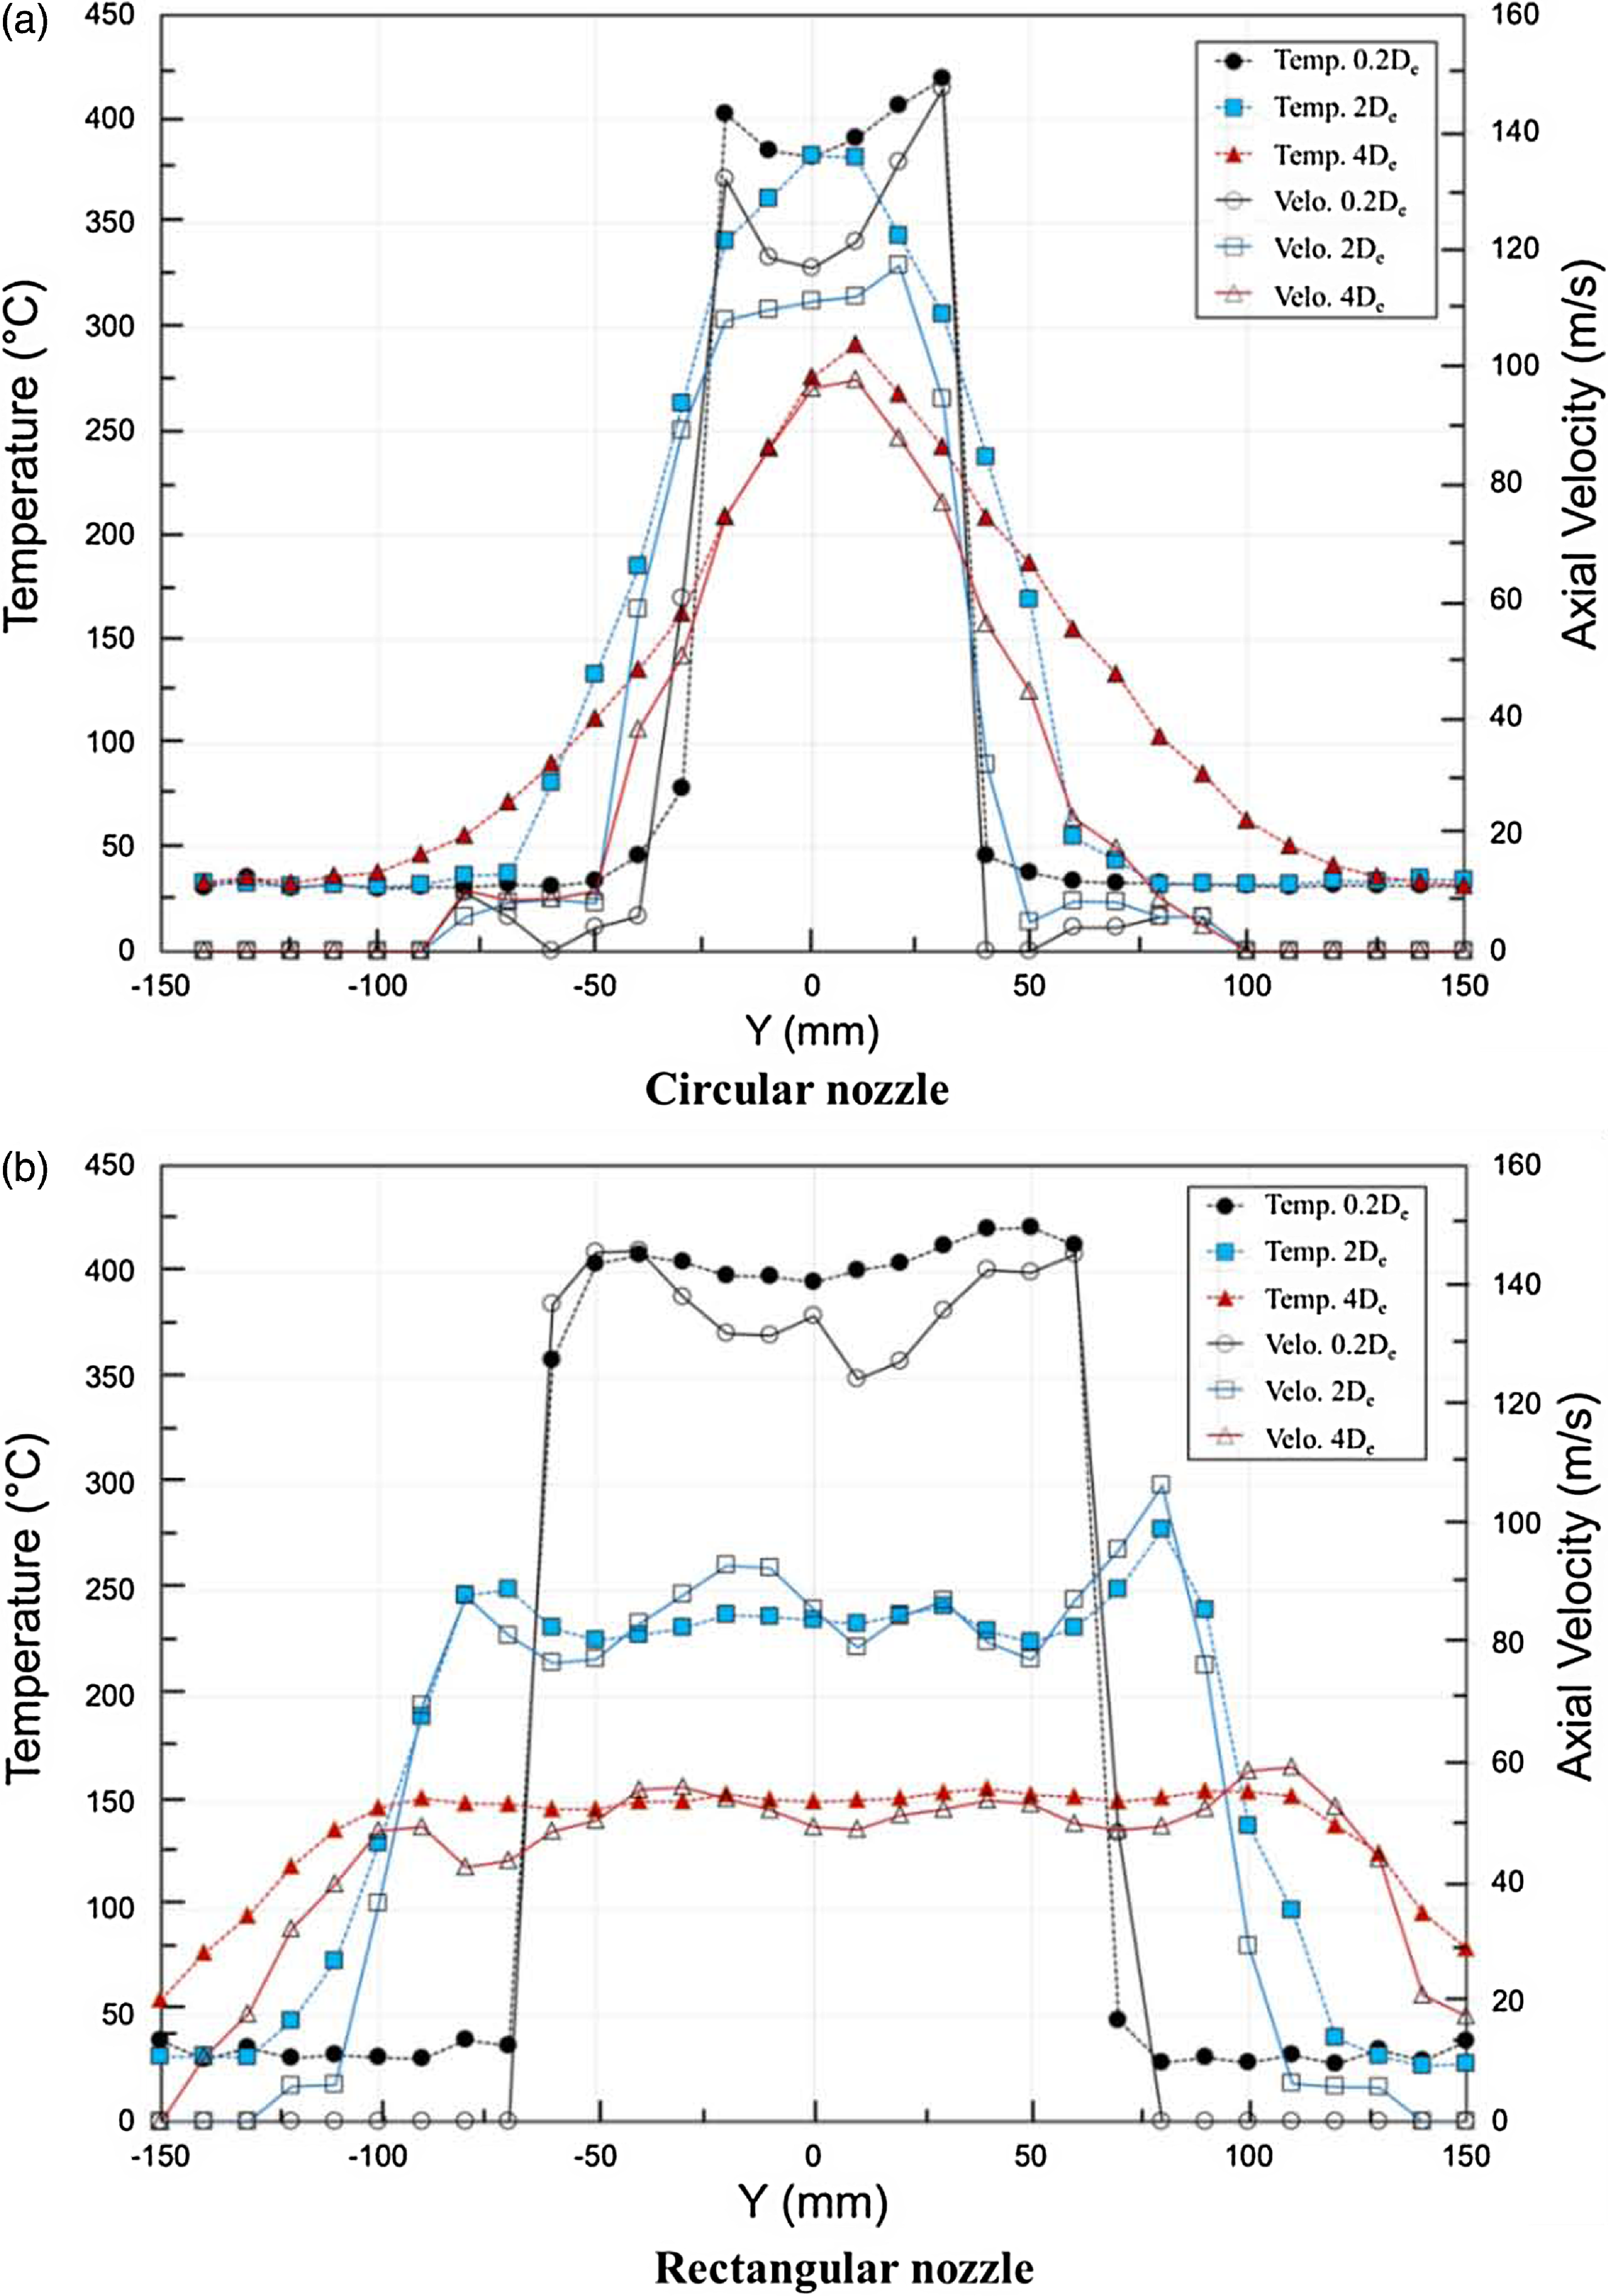
Figure 15. Plume temperature and velocity profile (experiment).
The temperature distribution of the exhaust plume measured at each section when two nozzles are installed is presented in Fig. 14. When a rectangular nozzle is installed, the exhaust plume is distributed over a distance of 120mm at about 400°C at the 0.2De position. At the 2De position, it is distributed over 170mm at about 250°C, and at the 4De position, it is distributed over 210mm at about 150°C. When the circular nozzle is installed, the maximum temperature of the exhaust plume is distributed over 50mm at about 400°C at the 0.2De position. At the 2De position, the maximum temperature is about 380°C, and at the 4De position, the maximum temperature is about 290°C. It shows a shape gradually decreasing in a symmetrical form at the high temperature of the centre. The temperature of the plume at the two exhaust nozzle outlets is similar. However, it can be seen that the further away from the nozzle outlet, the lower the maximum temperature of the exhaust plume ejected from the rectangular nozzle is by about 130 to 140°C. A rate at which the temperature of the plume at the exhaust nozzle outlet decreases as the distance was defined as Equation (12) and compared for each nozzle.
where T 0.2De denotes the maximum temperature at the 0.2De position, whereas T max denotes the maximum temperature value at each measuring position. The temperature reduction rates are 8.8% and 30.4% when circular nozzles are mounted at 2De and 4De, respectively. On the other hand, when a rectangular nozzle is installed, the temperature reduction rates are 33.8% and 45.6%, respectively.
The temperature and velocity distributions of the exhaust plume for the two nozzles, shown in Fig. 15, are used to find out the correlation between the velocity distribution and the temperature distribution of the exhaust plume. In the case of the two nozzles, it can be seen that the temperature distribution and the velocity distribution of the exhaust plume have almost similar shapes. Therefore, the flow characteristics of the plume according to the shape of the exhaust nozzle directly affect the temperature distribution of the plume, and the temperature distribution of the plume determines the magnitude of the infrared signal.
4.0 Numerical analysis of exhaust plume flow
The flow parameters inside the exhaust nozzle could not be determined in this experiment, and only the axial velocity component of the exhaust plume was observed. Therefore, it is important to investigate the exhaust plume in detail using numerical analysis. The 3D temperature contour and velocity distributions are displayed in Fig. 16, and they are used for a detailed comparison of the flow numerical analysis results with the experimental results. Figure 17 shows the two-dimensional temperature contour and velocity distributions, which help understand the flow characteristics of the overall plume, including that within the nozzle. When the circular nozzle is mounted, as depicted in Fig. 17, the velocity component of the plume is largely created in the axial direction. However, in the case of the rectangular nozzle, the plume spreads more broadly because it contains both the axial and Y-direction velocity components.
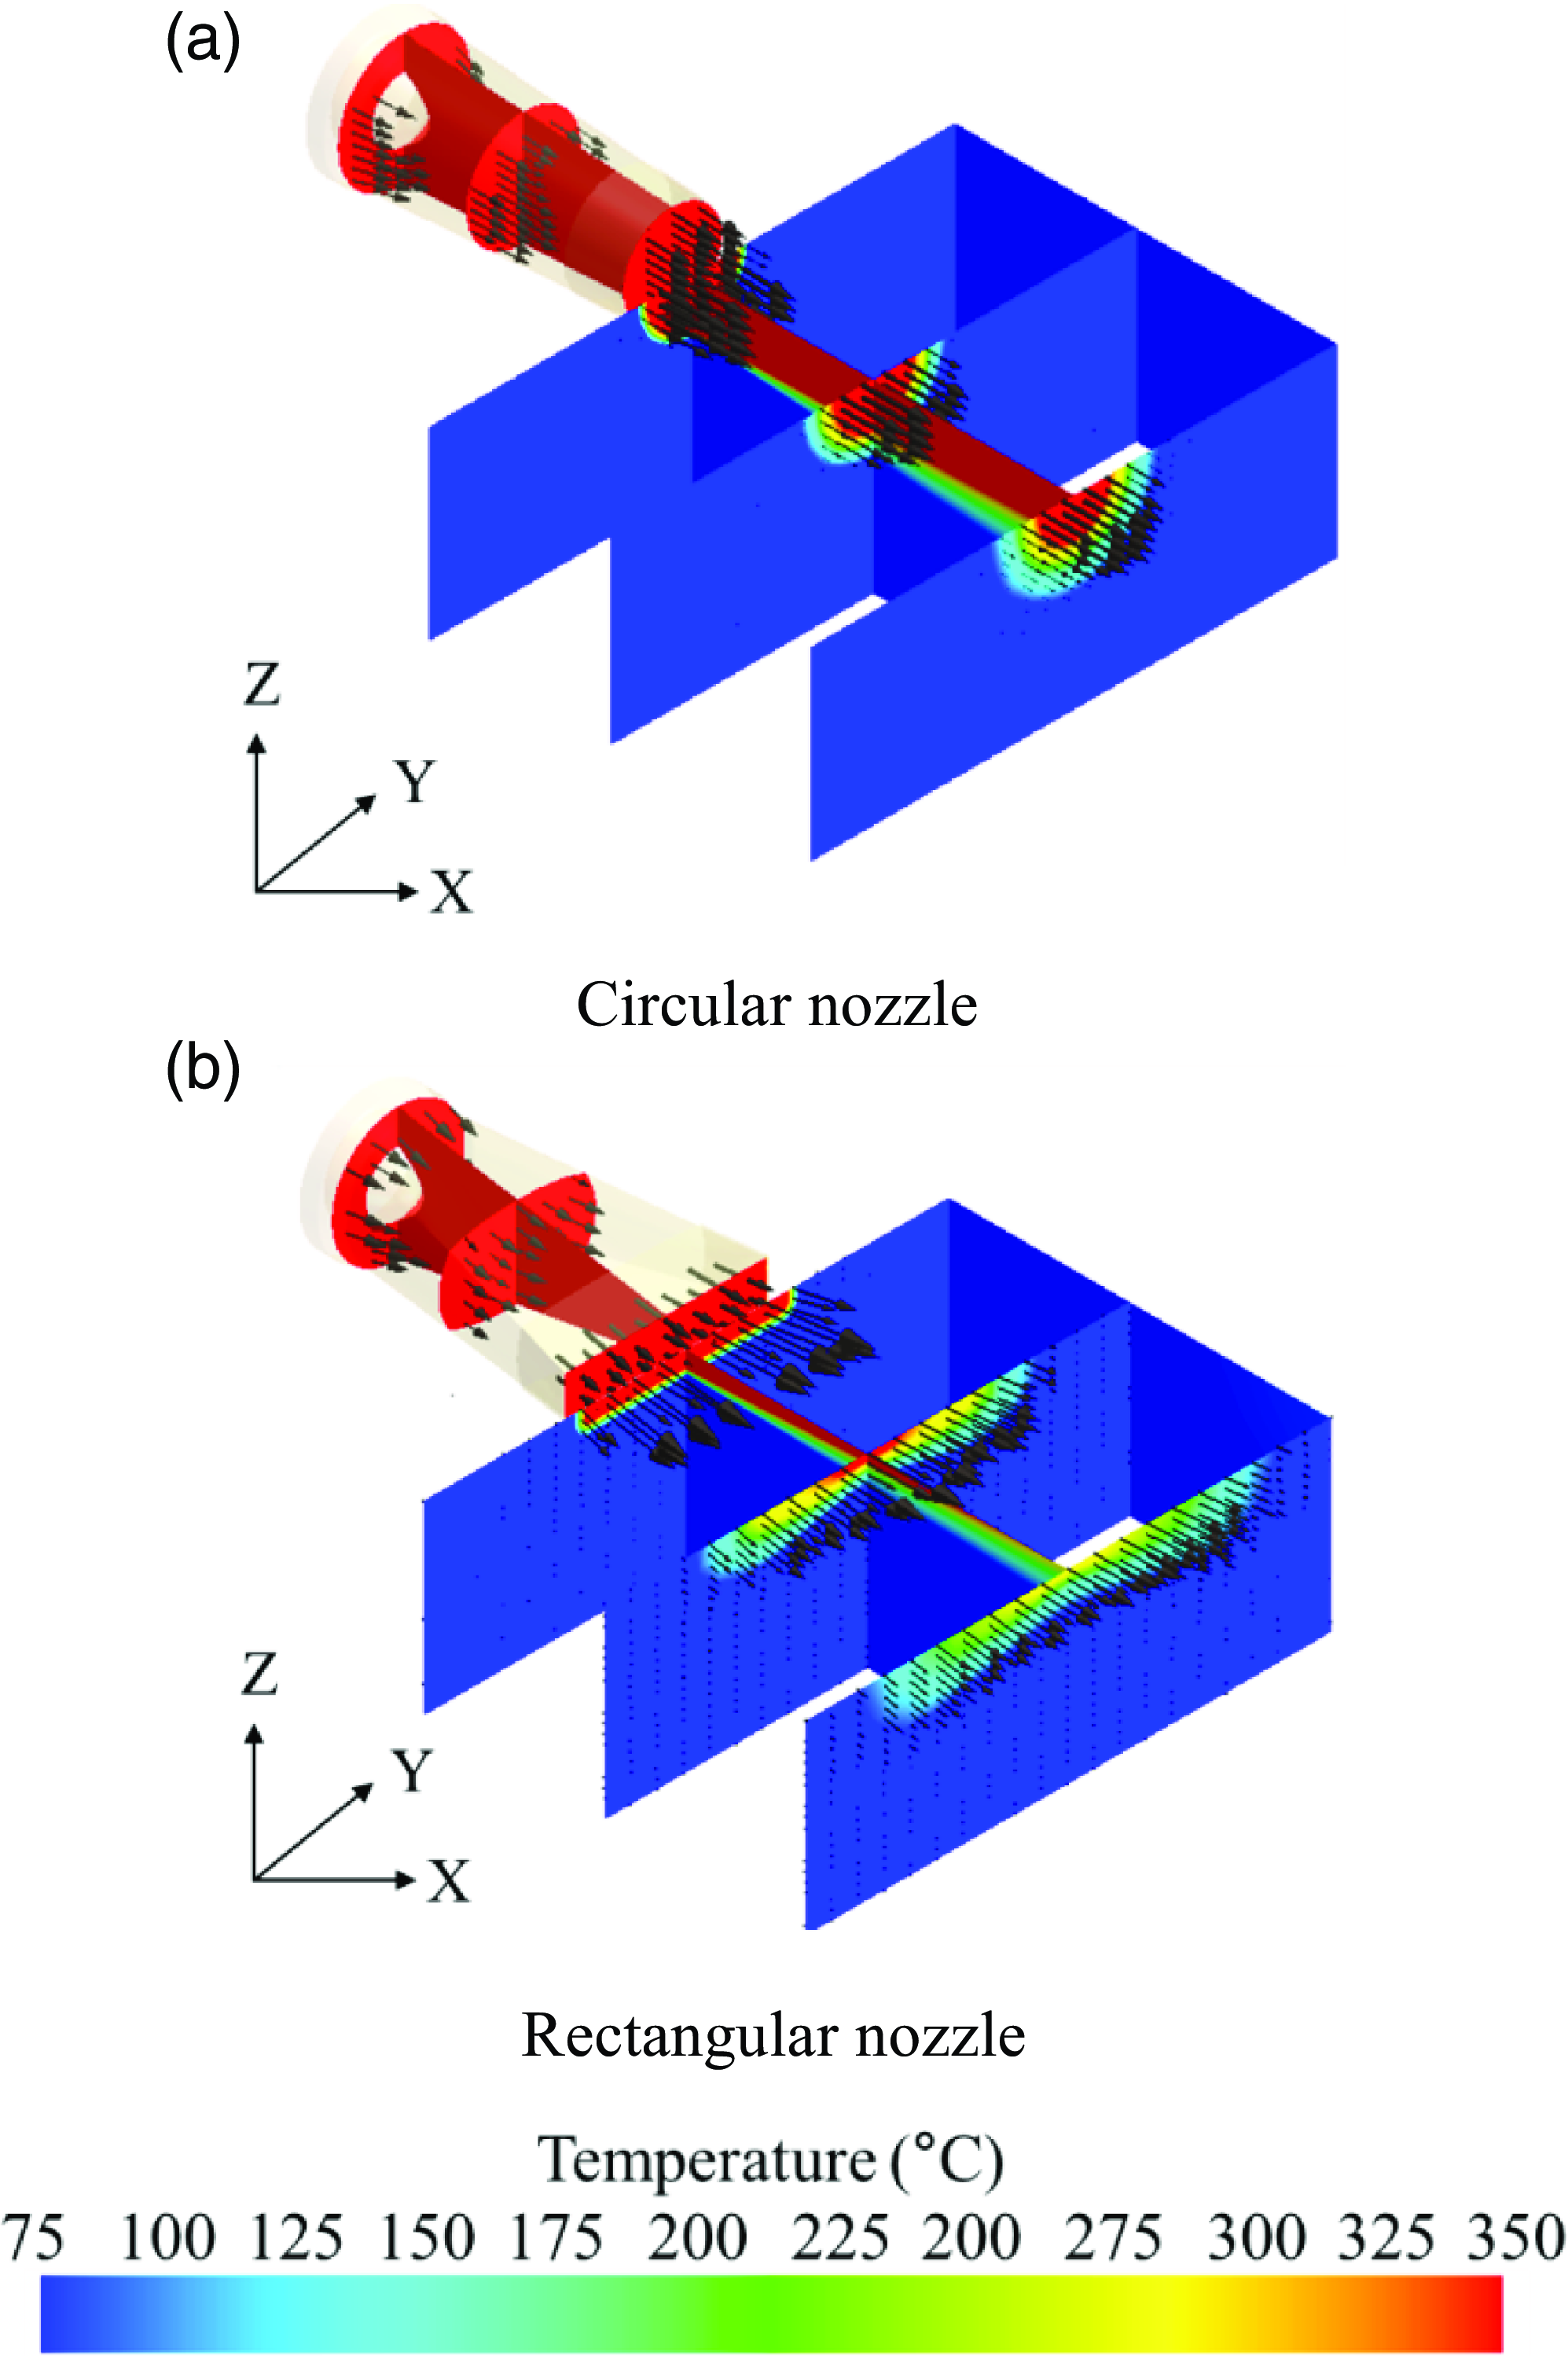
Figure 16. Three-dimensional temperature contour and velocity profile (calculation).
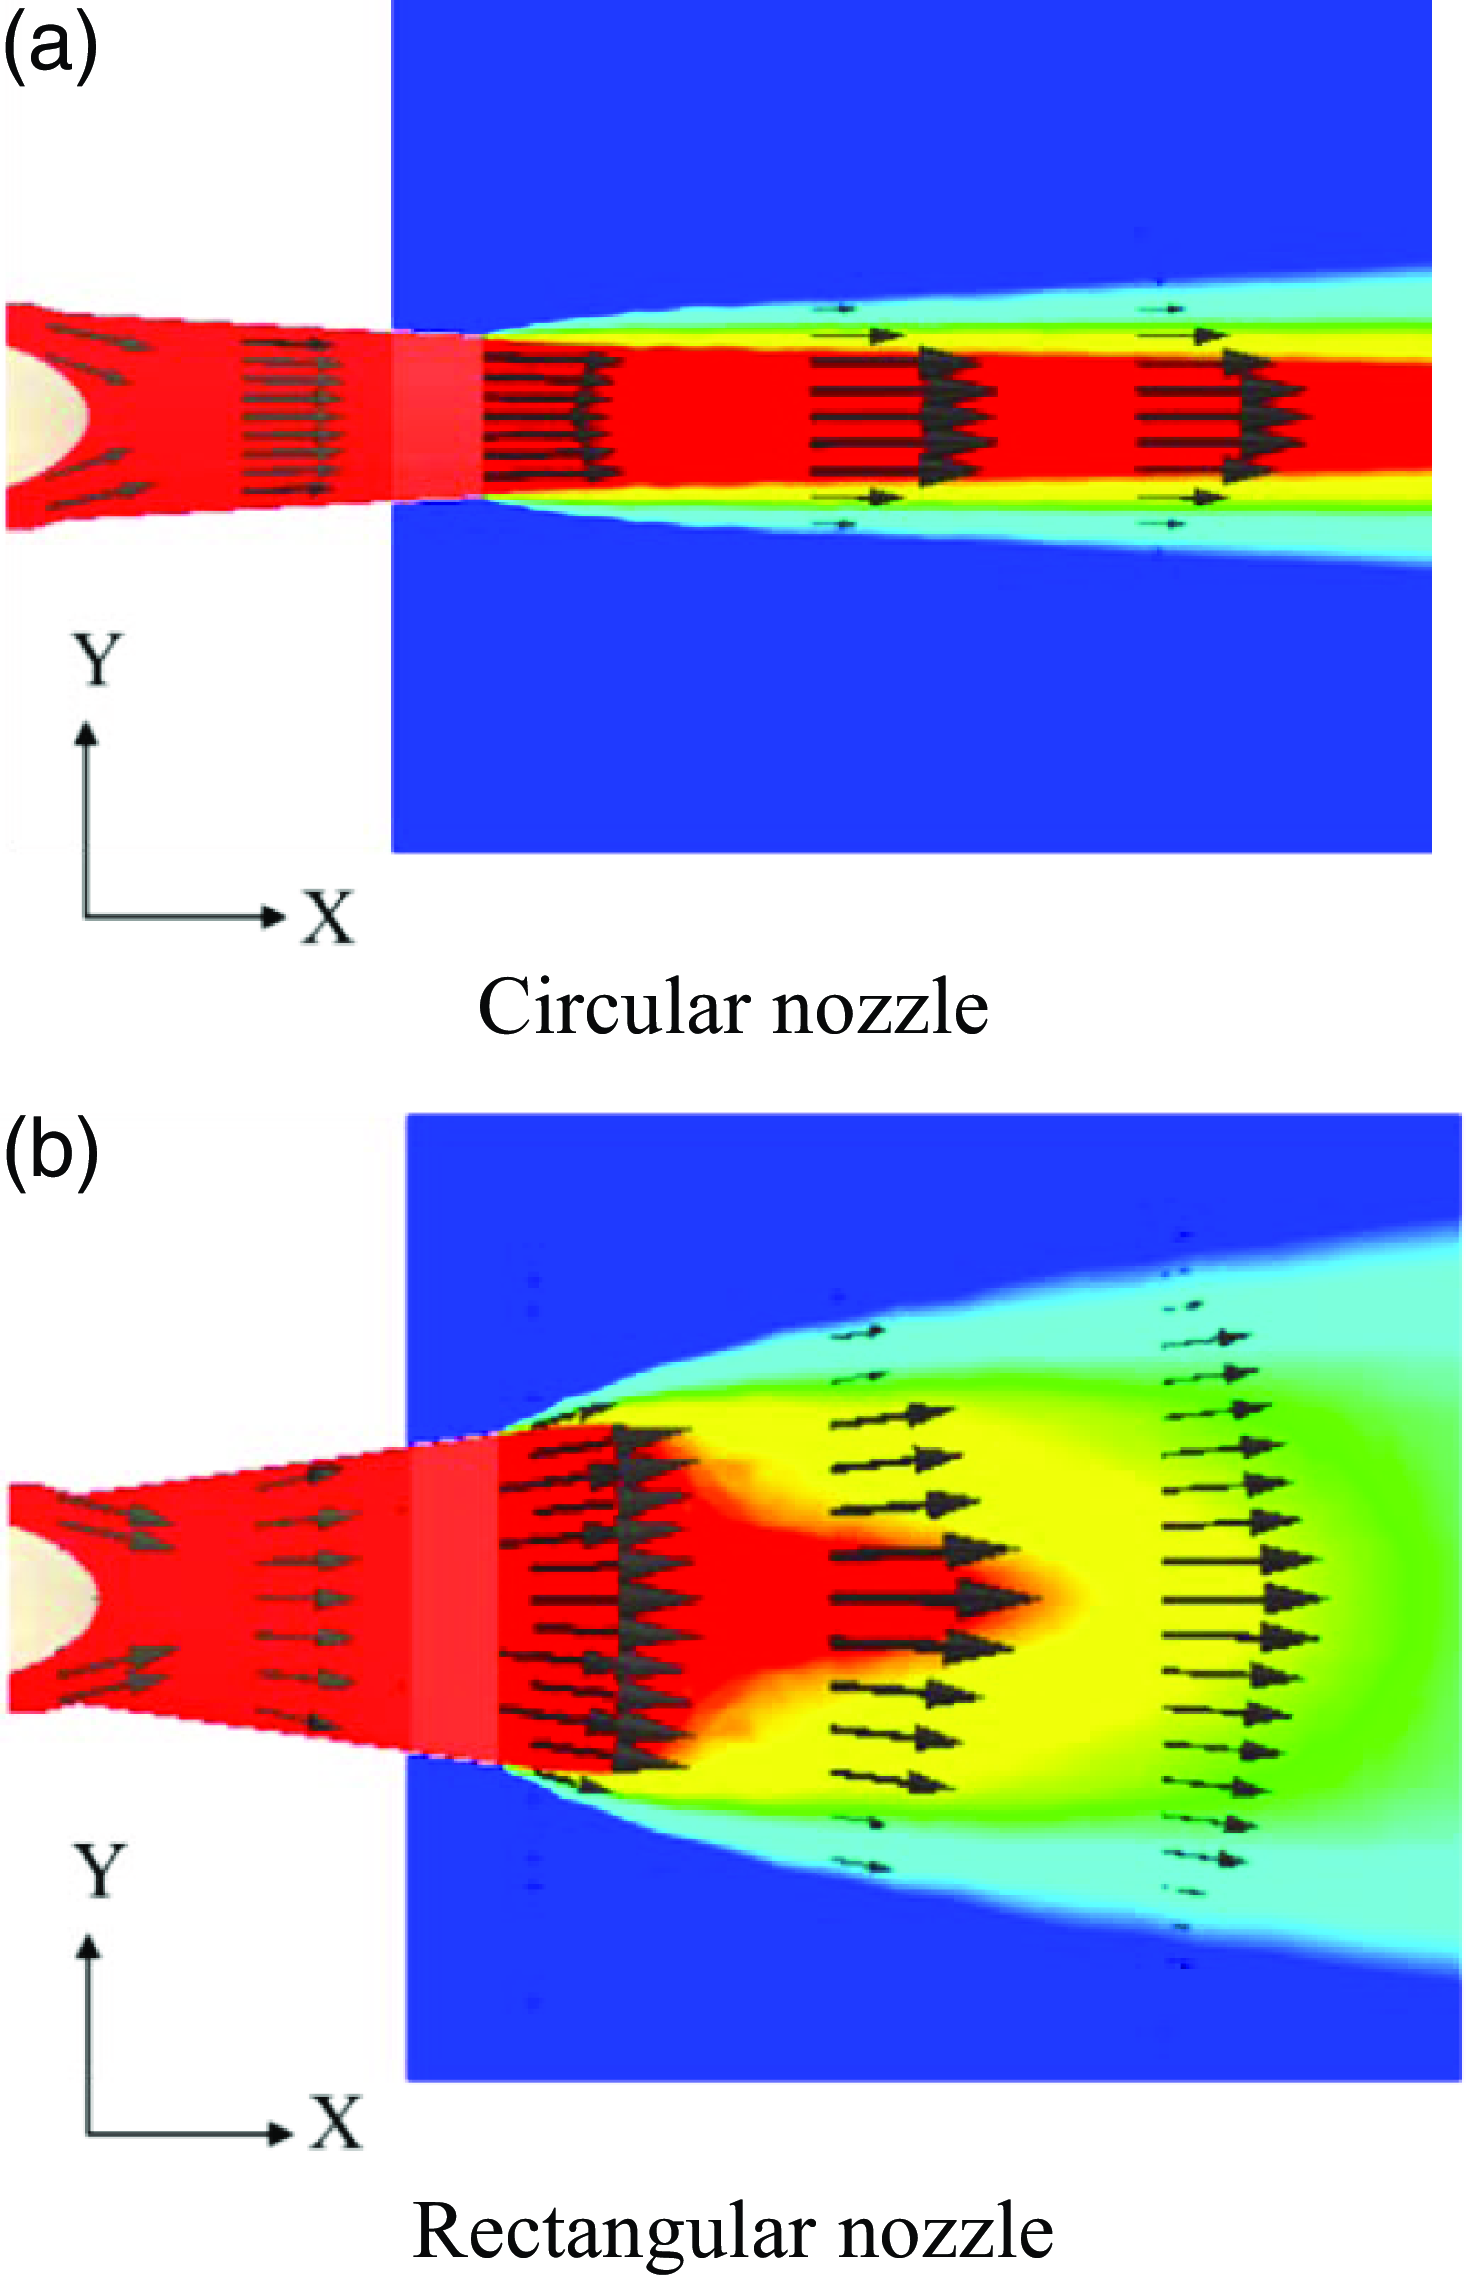
Figure 17. Two-dimensional temperature contour and velocity profile (calculation).
The velocity vector is shown in Fig. 18 to see the flow inside the exhaust nozzle. In both cases, the exhaust plume has a low-speed area in the centre area by the tail cone, and the exhaust plume is accelerated by the shrinking area towards the outlet direction. Inside the circular nozzle, the exhaust plume has velocity vectors with the same direction and the uniform velocity. However, in the case of the inside of the rectangular exhaust nozzle, some low-speed areas are generated. A similar low-speed region has occurred in a study inside a nozzle with an aspect ratio of Dippold et al. [18]. It is thought that the reason for the occurrence of small-speed areas is that some areas with low total pressure are generated due to rapid shape changes from circular to rectangular. Due to the unbalanced area of the pressure inside the nozzle, a velocity component in which the direction of some flow is directed from the centre to the wall surface is generated.
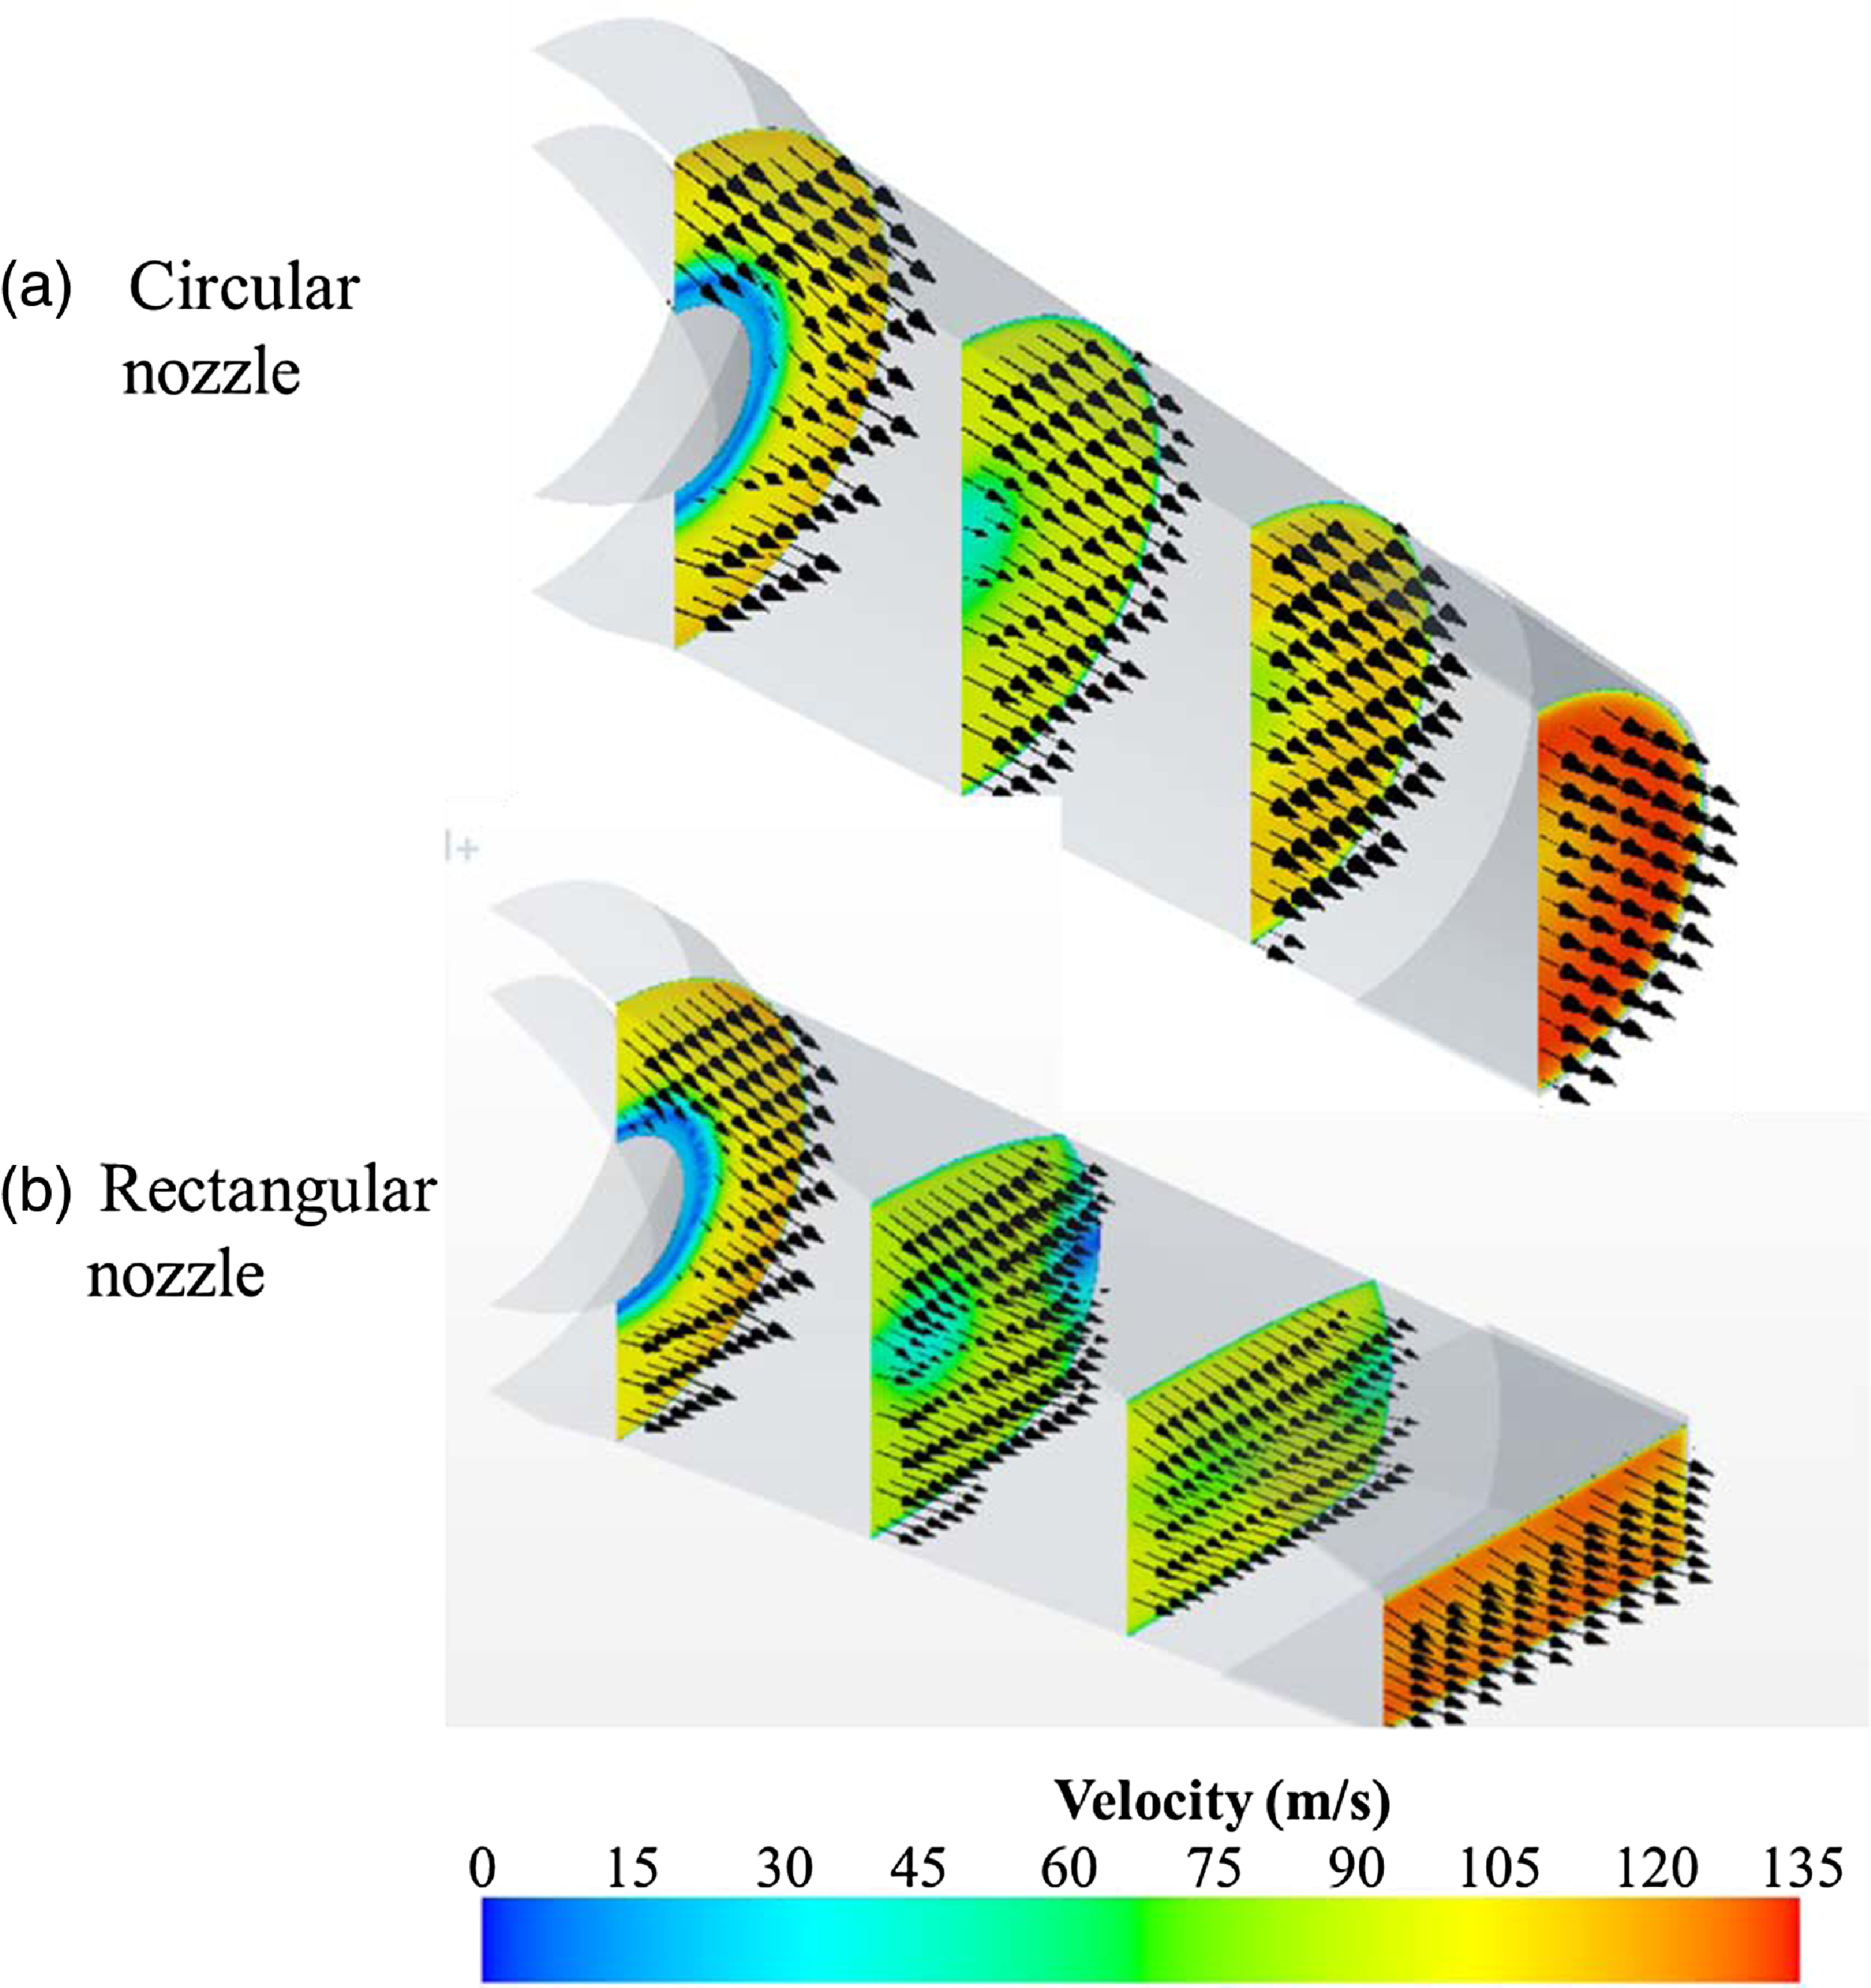
Figure 18. Velocity contours and vectors (calculation).
The transverse velocity distribution, excluding the axial velocity component, displayed in Fig. 19, provides a clear illustration of the characteristics of the internal flow. The definition of transverse speed (
![]() ${\vec u_t}$
) is as follows:
${\vec u_t}$
) is as follows:
where
![]() $\nu \hat J$
and
$\nu \hat J$
and
![]() $\omega \hat k$
are the velocity unit vectors corresponding to the Y and Z directions, respectively. Figure 19(a) shows the transverse velocity of the exhaust plume for the case of a circular nozzle. The transverse velocity has a maximum size in the nozzle inlet tail cone region, gradually decreases towards the nozzle outlet, and is about 4m/s at the nozzle outlet. And the transverse velocity component has a direction from the outer wall to the central region. Figure 19(b) shows the transverse velocity of the exhaust plume for the case of a rectangular nozzle. In the case of the inside of the rectangular nozzle, the direction of the transverse flow is directed from the centre to the side wall (major axis) and gradually accelerates to have a speed of up to 28m/s at the nozzle outlet. Therefore, in the case of rectangular exhaust nozzles, the wide diffusion of the exhaust plume at the nozzle outlet is due to the transverse velocity component at the rectangular nozzle outlet.
$\omega \hat k$
are the velocity unit vectors corresponding to the Y and Z directions, respectively. Figure 19(a) shows the transverse velocity of the exhaust plume for the case of a circular nozzle. The transverse velocity has a maximum size in the nozzle inlet tail cone region, gradually decreases towards the nozzle outlet, and is about 4m/s at the nozzle outlet. And the transverse velocity component has a direction from the outer wall to the central region. Figure 19(b) shows the transverse velocity of the exhaust plume for the case of a rectangular nozzle. In the case of the inside of the rectangular nozzle, the direction of the transverse flow is directed from the centre to the side wall (major axis) and gradually accelerates to have a speed of up to 28m/s at the nozzle outlet. Therefore, in the case of rectangular exhaust nozzles, the wide diffusion of the exhaust plume at the nozzle outlet is due to the transverse velocity component at the rectangular nozzle outlet.
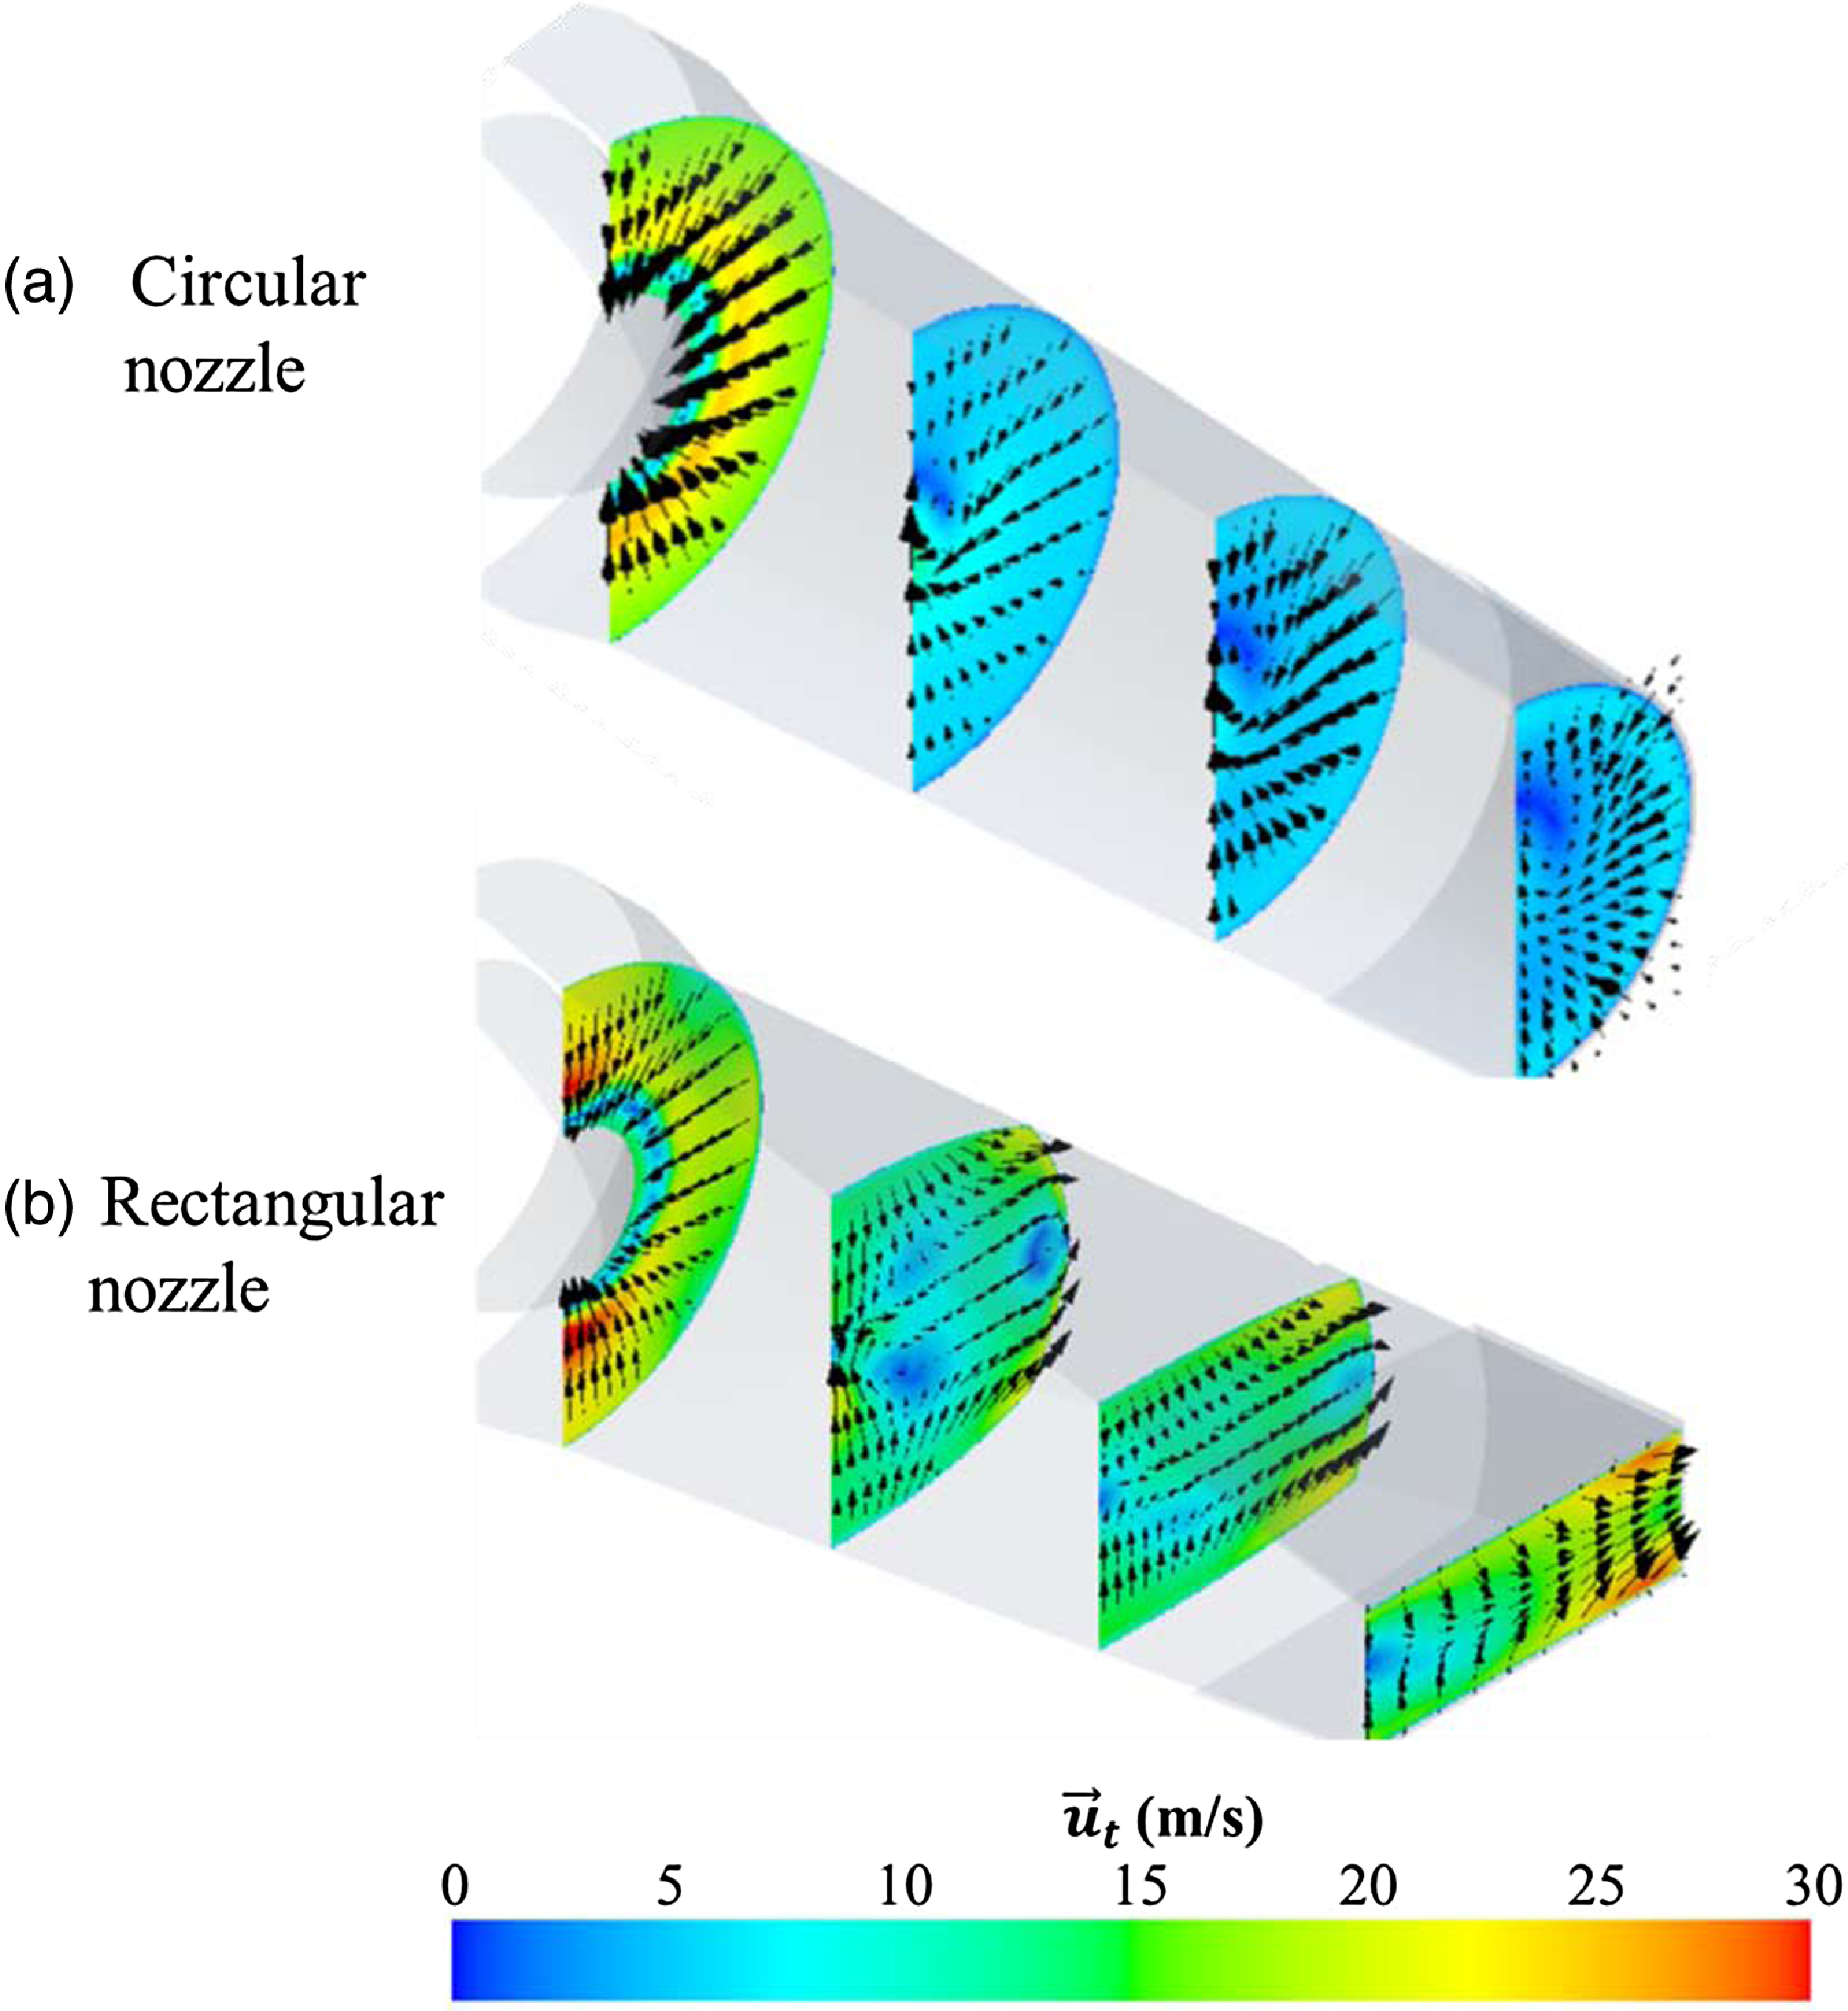
Figure 19. Transverse velocity contours and vectors (calculation).
The flow analysis of rectangular nozzles with aspect ratios of 3 and 7 was also performed to explore the impact of the rectangular aspect ratio on the transverse velocity of the plume. The average transverse velocity of the plume in a circular exhaust nozzle and a rectangular nozzle with aspect ratios of 3, 5, and 7 is shown in Fig. 20. The transverse velocity at the circular nozzle is roughly 4m/s at the exit of the exhaust nozzle, but when the rectangle aspect ratio increases from 3 to 7, the transverse velocity increases to 11.5, 15, and 24.2m/s. Therefore, it can be seen that the aspect ratio in a rectangular nozzle directly affects the magnitude of the transverse velocity.
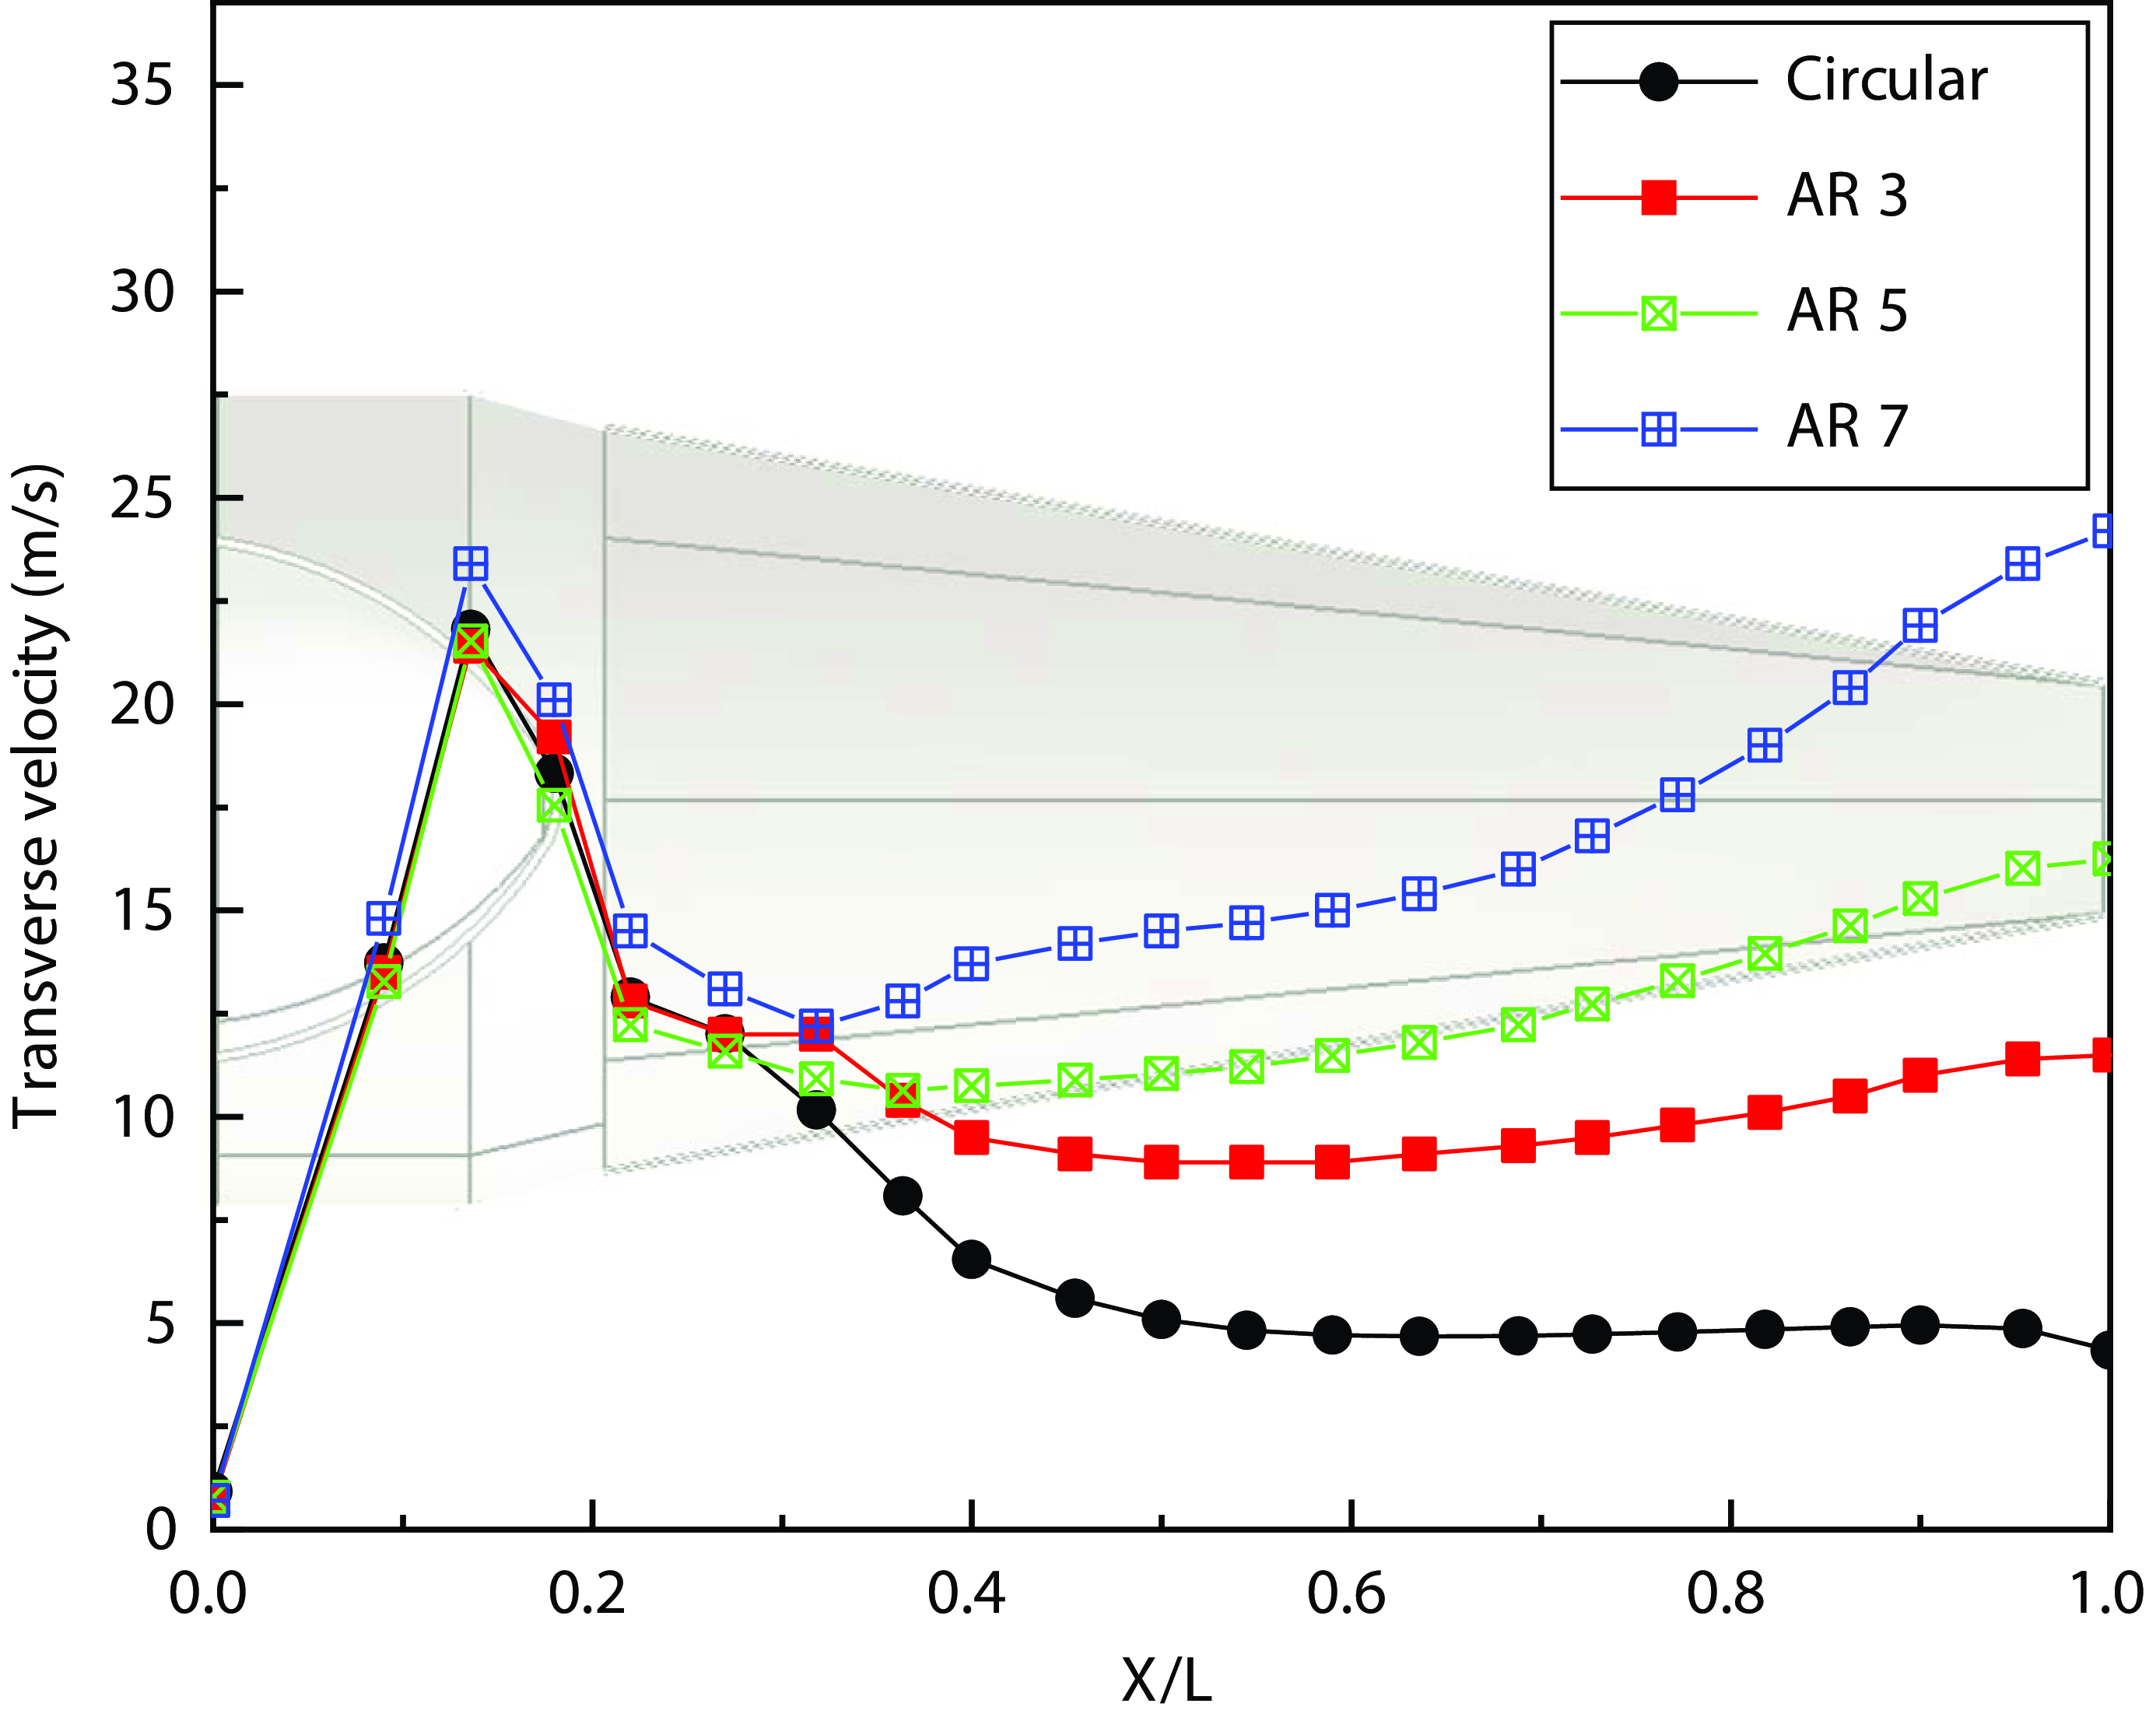
Figure 20. Averaged transverse velocity profiles along nozzle length ratio.
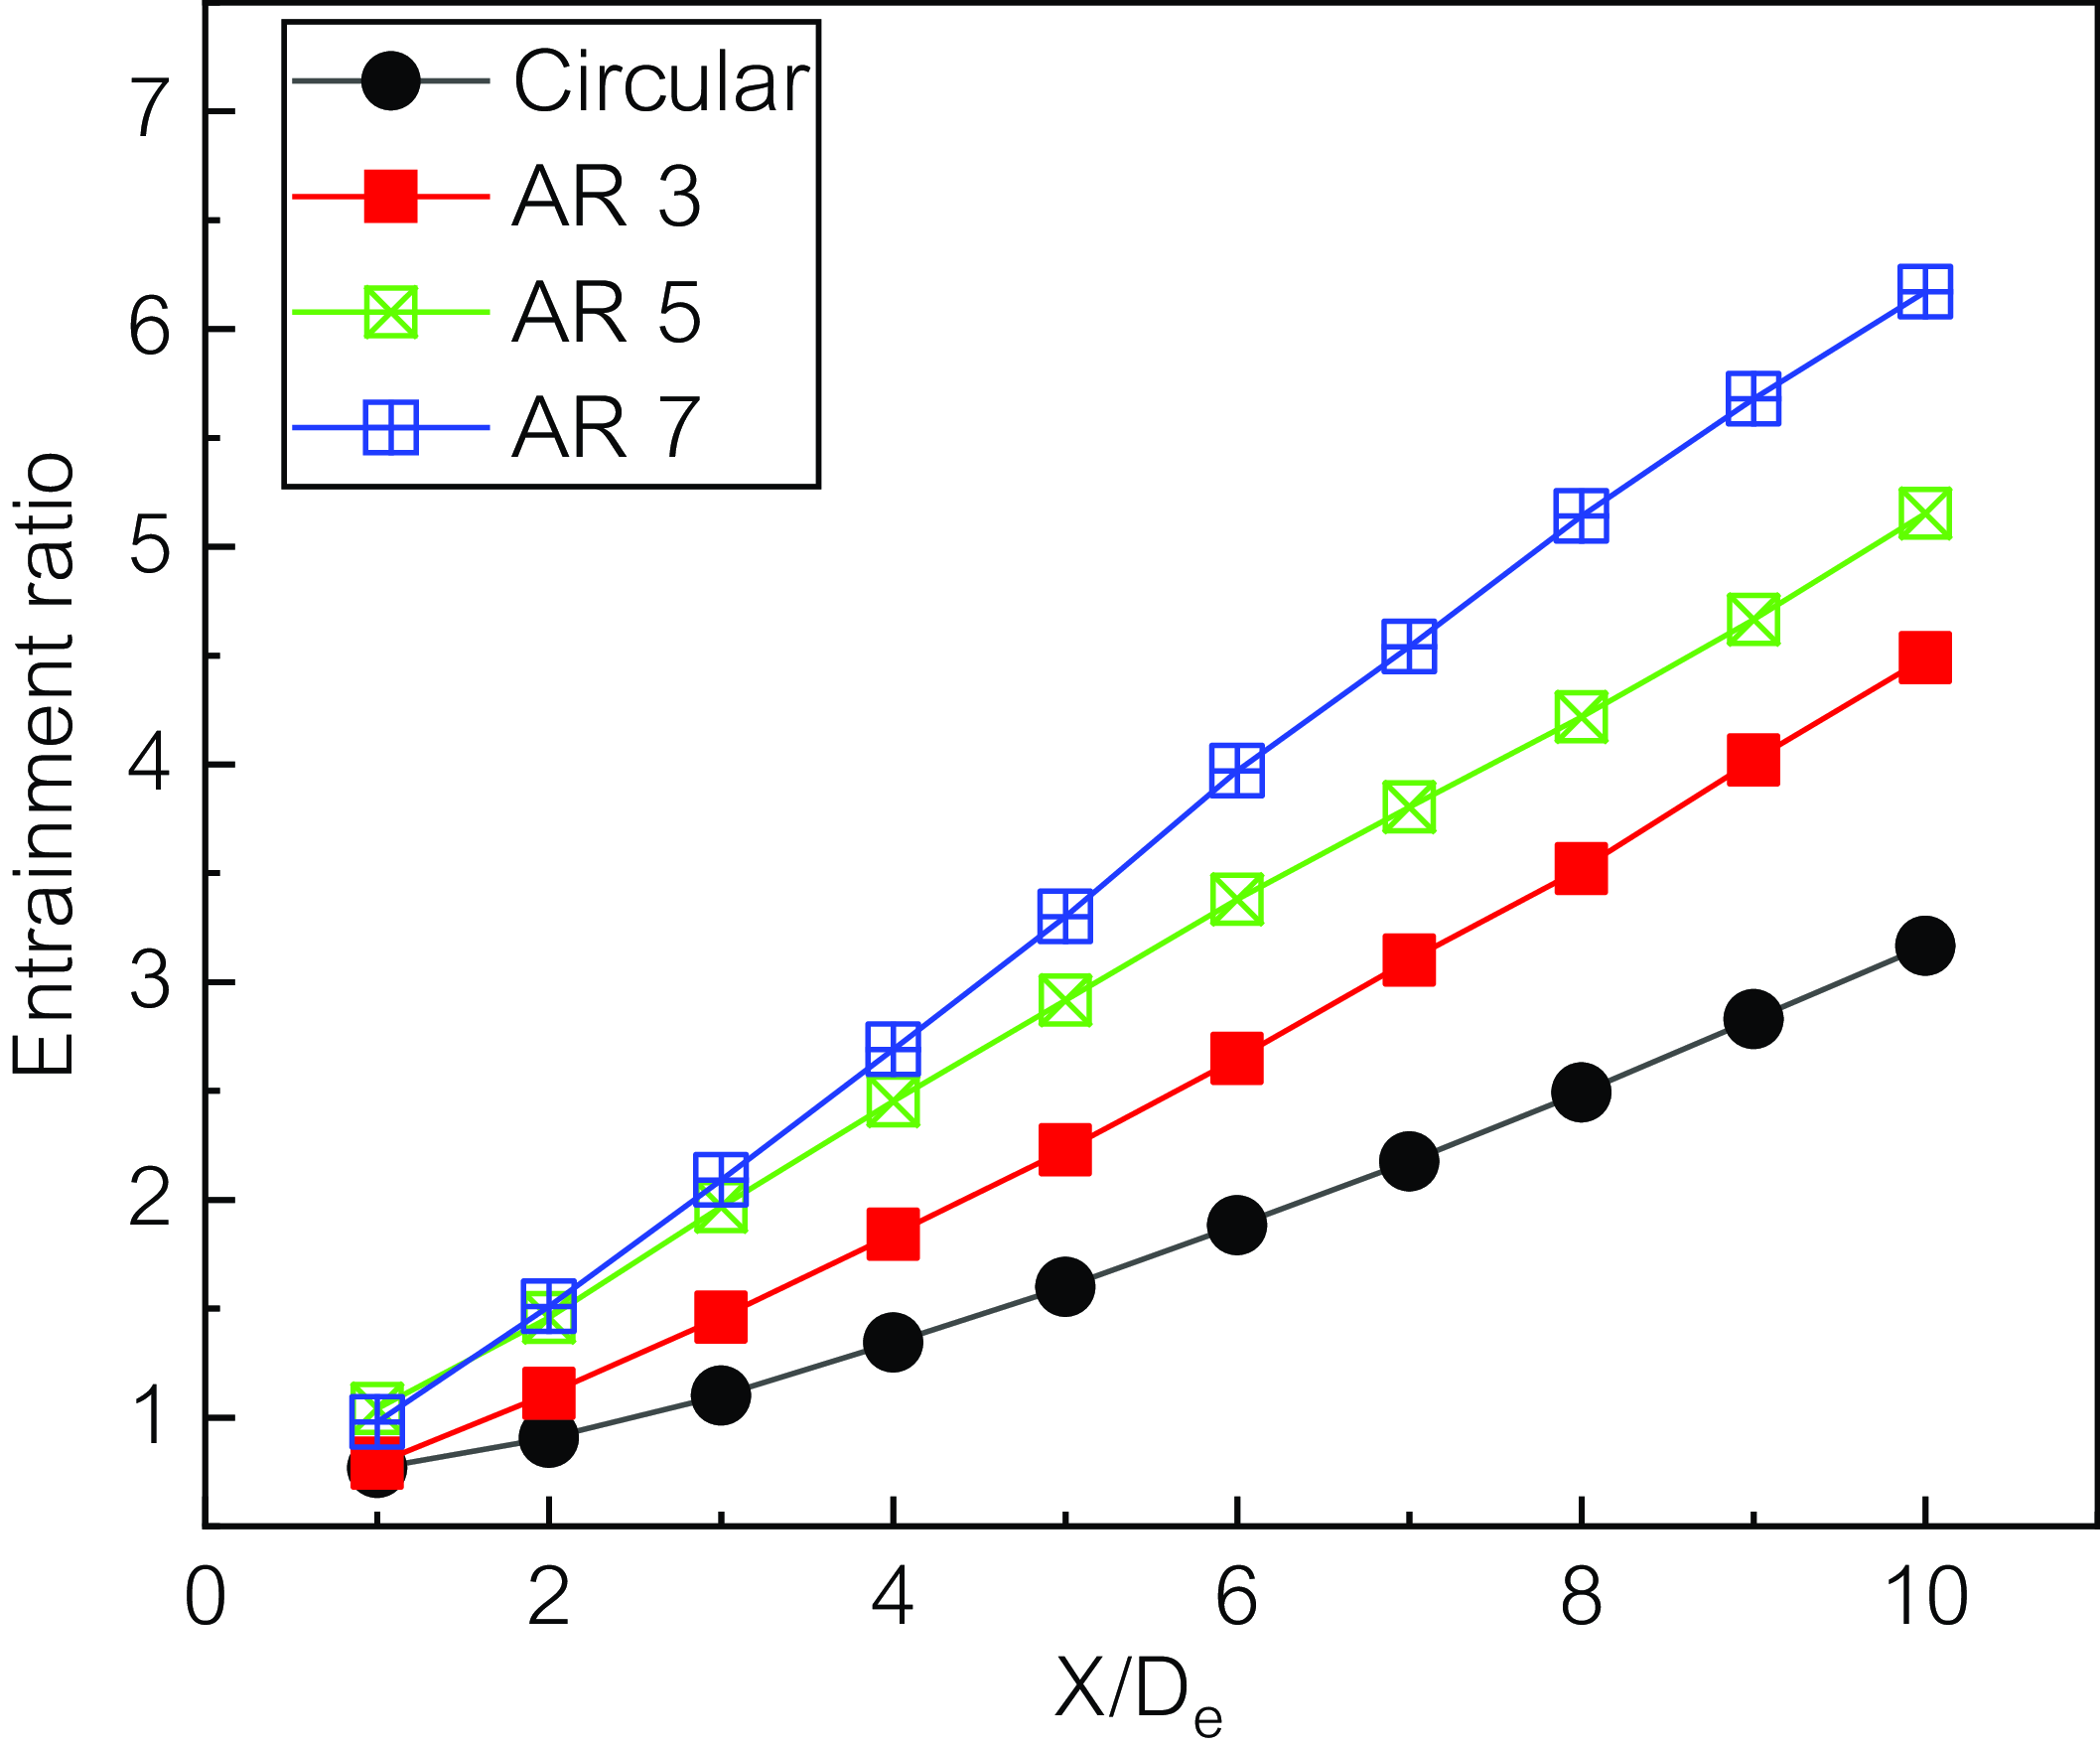
Figure 21. Entrainment ratio along the nozzle diameter distance.
Due to the flow direction and velocity of the exhaust plume, it is mixed with the surrounding air and the temperature and velocity of the exhaust plume decrease. The air inflow rate for the air entering the exhaust gas was defined by Ho and Gutmark [Reference Ho and Gutmark16] using the mass flow rate (Q) at a random position and mass flow rate (Q 0) at the nozzle exit, as follows:
The air inflow rates of circular and rectangular exhaust nozzles with aspect ratios of 3, 5, and 7 are shown in Fig. 21. The air inflow rate from the outer area into the plume is the smallest in the case of the circular nozzle, and the value increases with the aspect ratio. In the case of a rectangular nozzle with an aspect ratio of 5, it can be seen that the amount of air introduced from the outside is up to 1.5 times larger than that of a circular nozzle at the nozzle outlet 10De position. Therefore, the exhaust plume emitted from the rectangular nozzle contacts and mixes a larger amount of cold external air than in the case of the circular nozzle, thereby lowering the temperature of the exhaust plume. Similar results are reported in Zaman [20].
5.0 Conclusion
The flow characteristics of a jet, including velocity and temperature distribution, were measured by attaching a circular exhaust nozzle and a rectangular exhaust nozzle with an aspect ratio of five to a micro-jet engine. Furthermore, flow analysis was performed to thoroughly examine the flow characteristics in the exhaust nozzle. The findings of this study can be summarised as follows.
-
(1) According to the experiment results, when the rectangular exhaust nozzle was installed, the engine’s specific fuel consumption rate was higher than when the circular nozzle was installed by approximately 3.6%. The infrared signature was reduced by around 5%. When the rectangular exhaust nozzle was mounted at the 4De position from the nozzle exit, the temperature of the exhaust plume was around lower than that of the circular exhaust nozzle by approximately 130–140°C according to measurements. The temperature distribution and relative size of the exhaust plume exhibited a nearly identical shape to the velocity distribution.
-
(2) The numerical flow analysis revealed that the transverse velocity component is created with a larger value than that of the circular exhaust nozzle because of a rapid shape change inside the rectangular nozzle, and the exhaust plume diffuses to the nozzle exit. It is considered that this results in an increase in mixing with the outer air and a decrease in the temperature of the exhaust plume more than the circular nozzle.
-
(3) Various experiments were carried out with circular and rectangular exhaust nozzles mounted on a micro-jet engine. A numerical flow analysis was also performed to clearly understand the flow inside the exhaust nozzle. The cause of the decrease in the infrared signature of the plume ejected from the rectangular exhaust nozzle was evaluated based on an integrated analysis of the experimental and numerical analysis. However, it should be noted that the limitation of this study is that research on the nozzle flow characteristics of the bypass ratio of turbofan engines, which are mostly used as aircraft propulsion engines, has not been conducted.
Acknowledgements
This work was supported by the Aerospace Low Observable Technology Laboratory Program of the Defense Acquisition Program Administration and the Agency for Defense Development of the Republic of Korea.


